1.1 Functions. Input (Independent or x) and output (Dependent or y) of a function. Range: Domain: Function Rule. Input. Output.
|
|
|
- Tamsyn Bond
- 5 years ago
- Views:
Transcription
1 1.1 Functions Function Function: A rule for a relationship between an input, or independent, quantity and an output, or dependent, quantity in which each input value uniquely determines one output value. We say the output is a function of the input. Input (Independent or x) and output (Dependent or y) of a function Domain: The set of all inputs Function Rule Range: The set of all outputs Ex: Input Function Rule Output Ordered pair - 0 Double the input Ex. Is {(1,3), (,3), (3,3)} a function? Ex. Is {(3,-1), (3,-3), (3,4)} a function? Ex. If y = x, is y a function of x? Ex. If y = x, is y a function of x? One-to-One Function Sometimes in a relationship each input corresponds to exactly one output, and every output corresponds to exactly one input. We call this kind of relationship a one-to-one function. Ex. Is {(-1,), (,3), (3,4)} a one-to-one function? Ex. Is {(1,-3), (,3), (3,-3)} a one-to-one function?
2 Graph as Functions Ex. Graph the set of points {(1,3), (,3), (3,3)}: Ex. Graph the set of points {(3,-1), (3,-3), (3,4)}: Vertical Line Test The vertical line test is a handy way to think about whether a graph defines the vertical output as a function of the horizontal input. Imagine drawing vertical lines through the graph. If any vertical line would cross the graph more than once, then the graph does not define only one vertical output for each horizontal input. One-to-one function: Ex. Graph the set of points {(-1,), (,3), (3,4)}: Ex. Graph the set of points {(1,3), (,3), (3,3)}: Horizontal Line Test Once you have determined that a graph defines a function, an easy way to determine if it is a one-to-one function is to use the horizontal line test. Draw horizontal lines through the graph. If any horizontal line crosses the graph more than once, then the graph does not define a one-to-one function. Ex 5. Select all of the following graphs which represent y as a function of x. a b c d e f
3 Function Notation The notation output = f(input) defines a function named f. This would be read output is f of input Ex1. The amount of garbage, G, produced by a city with population p is given by G f ( p). G is measured in tons per week, and p is measured in thousands of people. a. The town of Tola has a population of 40,000 and produces 13 tons of garbage each week. Express this information in terms of the function f. b. Explain the meaning of the statement f 5. Ex4. Let ht () be the height above ground, in feet, of a rocket t seconds after launching. What is the input? What is the unit of the input? What is the output? Explain the meaning of each statement: a. h1 00 b. h 0 50 Ex0. Based on the table below, a. Evaluate f (8) b. Solve f ( x) 7 x f( x ) Ex 15. Given each function f( x ) graphed, evaluate f (0), f (1) and f (3) Ex 17. Given the function gx ( ) graphed here, a. Evaluate g () b. Solve gx
4 35. Suppose f x x 8x 4. Compute the following: a. f( 1) f(1) b. f ( 0) f ( ) 37. Let f t 3t 5 a. Evaluate f (0) b. Solve f t 0 Circles Q. What is the distance between the points P and Q? Definition of a Circle: A circle is a set of points in the xy-plane that are a fixed distance r from a fixed point (h, k). The fixed distance r is called the radius, and The fixed point (h, k) is the center of the circle. Find the Equation of Circles r (h, k) (x, y) The equation of a circle centered at the point (h, k) with radius r can be written as ( x h) ( y k) r (Called the Standard form of a circle) Unit circle: If r = 1 and the center of the circle is at the origin, then the circle is called the unit circle. x + y = 1 Ex. Write the equation of the circle centered at (-9, 9) with radius 16. Write your answer in standard Form.
5 1. Domain and Range Domain and Range Domain: The set of possible input values to a function Range: The set of possible output values of a function Ex. Is {(4,-3), (5,4), (6,-3)} a function? Domain: Range: Ex. Is {(1,-1), (3,-3), (1,4)} a function? Domain: Range: Ex. Find the domain and range of the following Table? x 8 8 Domain: y Domain and Range of a graph Range: d a b Domain: c Range: Notation for Domain and Range Inequality Set Builder Notation Interval notation 5 h 10 h 5 h 10 (5, 10] 5 h 10 h 5 h 10 [5, 10) 5 h 10 h 5 h 10 (5, 10) h h 10 h h 10 [10, ) all real numbers h h (, ) Combining two intervals together: As an inequality it is: 1 x 3 or x 5 In set builder notation: x 1 x 3 or x 5 In interval notation: [1,3] (5, ) h h (,10)
6 Is the graph a function? Domain: Range: Is the graph a function? Domain: Range: Is the graph a function? Domain: Range: Is the graph a function? Domain: Range:
7 Is the graph a function? Domain: Range: Is the graph a function? Domain: Range: Finding the Domain of a Function The Domain of most frequently used Mathematical functions, like linear, quadratic, and exponential functions, is the set of all real numbers. However, the following situations are not: 1 A zero in the denominator, such as, and x A negative value under an even root symbol, such as x. a. f(x) = x + b. x g(x) = x + 1 x c. h(x) = x 1 d. i(x) = x 4 e. j(x) = 3x + 9 f. x 5 k(x) = 4 x x 5
8 Piecewise Defined Functions A piecewise defined function is a function that is defined by different formulas on different parts of its domain. Ex. Given each function, evaluate: f ( 1), f (0), f (), f (4). f x 3 4x if x 1 x 1 if x x if x 1 0 f x 4 if 0 x 3 3x 1 if x 3 Graph a piecewise defined function: (Find the Domain and Range of the functions) 4, if x. x + 4, if x < x, if x 1, if x Ex. f x f x x, if x f(x) = { x 1, if x 1 x, if < x 4 x, if x

9 1.3 Rates of Change and Behavior of Graphs Rate of Change A rate of change describes how the output quantity changes in relation to the input quantity. The units on a rate of change are output units per input units Some other examples of rates of change would be quantities like: A population of rats increases by 40 rats per week A barista earns $9 per hour (dollars per hour) Average Rate of Change The average rate of change between two input values is the total change of the function values (output values) divided by the change in the input values. Change of Output y y y1 Average rate of change = = Change of Input x x x Average Rate of Change using Function Notation Given a function f(x), the average rate of change on the interval [a, b] is Change of Output f ( b) f ( a) Average rate of change = Change of Input b a 1 Ex 1. Ex 1a. Ex 1b. Ex. Find the average rate of change of the following functions: a. f ( x) x x on the interval [1, 9] b. g( x) x 4 x on the interval [-1. 3]
10 on the interval [1, 1+h] d. x 3x x 1 c. i( x) 4 x f on the interval [ a, a h] e. x x 3x 4 g on the interval [x, x + h] f. j ( x) x 3 on the interval [ a, a h] 3 g. i x x x 5 on the interval [x, x + h] h. sx 3 5x on the interval [x, x + h]
. f is decreasing on (b, c) Ex 3. Ex 4. a. b.")

11 Note: f is increasing on (a, b) and (c, d). f is decreasing on (b, c) Ex 3. Ex 4. a. b. Local Extrem A point where a function changes from increasing to decreasing is called a local maximum. A point where a function changes from decreasing to increasing is called a local minimum. Together, local maxima and minima are called the local extrema, or local extreme values, of the function.


12 Concavity A function is concave up if the rate of change is increasing. A function is concave down if the rate of change is decreasing. A point where a function changes from concave up to concave down or vice versa is called an inflection point. Larger increase Smaller increase Larger increase Smaller increase Graphically, concave down functions bend downwards like a frown, and concave up function bend upwards like a smile. Increasing Decreasing Concave Down Concave Up Ex 6. Examine the graph of the function and find the interval that is (a)concave up, (b)concave down and (c)the approximate coordinates, ( x, y), of all points of inflection (if any). Concave up Concave down Point of inflection Show Behaviors of the Toolkit Functions on P.43 and show how to use calculator to graph and estimate the local extrema (like the problem 40). Use a graph to estimate the local extrema and inflection points of each function, and to estimate the intervals on which the function is increasing, decreasing, concave up, and concave down. / k( t) 3t t
), and read this as f of g of x or f composed with g at x.")
13 1.4 Composition of Functions Composition of Functions When the output of one function is used as the input of another, we call the entire operation a composition of functions. We write f(g(x)), and read this as f of g of x or f composed with g at x. An alternate notation for composition uses the composition operator: ( f g)( x) is read f of g of x or f composed with g at x, just like f(g(x)). The domain of f g is the set of all x in the domain of g such that g(x) is in the domain of f. In other words, f gx is defined whenever both g(x) and f(g(x)) are defined. Ex1. Domain g(x) A f(g(x)) B f g x A B Ex5) If f x x and g x x, then find a) f(g(4)) e) gx f (Also find its domain) b) g(f()) c) f f 4 f) f x g (Also find its domain) d) f g1
14 For each pair of functions, find 1 x 4. f x, g x 4 x f g x and g f x and their domains. Simplify your answers. 7. If f(x) = x 4 + 6, g(x) = x 6 and h(x) = x, find f ( g( h( x ))). (Expand your answer) Find functions f( x ) and ( ) gx so the given function can be expressed as hx f g x 36. hx x h x 4 x.
, called parent functions, into what we need. The transformations that we study are shifting, stretching, and reflecting. Ex1: Fill the tables and sketch the graphs of the equations.")
15 1.5 Transformations of Functions In this section, we will learn to transform what we already know about the formulas or models, the tool-kit functions (P.43), called parent functions, into what we need. The transformations that we study are shifting, stretching, and reflecting. Ex1: Fill the tables and sketch the graphs of the equations. a) y x b) y x x y x y Domain: Range: g(x) = f(x) + h(x) = f(x) 3

16 1 Ex: Graph the equations y1 x, y 3x and y 3 x using the tables or calculator and draw a sketch of what you see in the coordinate 1 system below. Then compare the graphs of y 3x and y 3 x compare it with the graph of y1 x. (Domain of y is [,]) Domain: Range: g(x) = f(x) h(x) = f(x) + 3

17 Ex3: Fill the tables and sketch the graphs of the equations. Then compare them with the graph of y = x. a) y ( x ) b) y ( x 3) x y x y Domain: Range: g(x) = f(x + 3) h(x) = f(x 4) 3

18 Ex4: Graph the equations y1 x, y x and 3 y x using the tables or calculator and draw a sketch of what you see in the coordinate system below. Then compare the graphs of y x and y 3 x compare it with the graph of y1 x. Domain: Range: g(x) = f(x) g(x) = f ( x )
 -A: would constitute a Vertical Flip over the x axis B: Horizontal Stretch if 0<B<1 or Horizontal Compression if B> 1 (Inside changes")
19 g(x) = f(x) h(x) = f( x) SUMMARY OF TRANSFORMATIONS: A, B, h, k determine the transformation of a function f(x): g( x) Af B( x h) k where any function f(x) has been transformed A: Vertical Stretch if A > 1 or Vertical Compression if 0 < A < 1 (Outside changes in y) -A: would constitute a Vertical Flip over the x axis B: Horizontal Stretch if 0<B<1 or Horizontal Compression if B> 1 (Inside changes in x) -B: would constitute a Horizontal Flip over the y axis h: Horizontal Shift (Inside changes in x) h>0 shifts left h<0 shifts right k: Vertical Shift (Outside changes in y) k>0 shifts up k<0 shifts down
 = x, write the equation of the graph that results from a) shifting f(x) 7 units upward. y = b) shifting f(x) 6 units to the right.")
20 40. For each equation below, determine if the function is Odd, Even, or Neither. a. f x x b. 4 3 g x x c. hx x x Ex5. Starting with the graph of f(x) = x, write the equation of the graph that results from a) shifting f(x) 7 units upward. y = b) shifting f(x) 6 units to the right. y = c) reflecting f(x) about the x-axis. y = Ex6. Given a function For example: f x, represent the following in function notation. f xshifted up 3 units: f x 3 a) f xshifted 3 units to the left: b) f xstretched horizontally by a factor of 4: 1 c) f xstretched vertically by a factor of : 3
21 Ex7. If the domain of f is [ 3,9] and range is [1,5], and g(x) = f(3x) 5, find the domain and range of g. Ex8. Use transformations to Graph f(x) = (x 3) + 1 (Use y = x, with domain [, ], to graph f.) Ex9. Use transformations to Graph f(x) = (x + ) + 3 (Use y = x, with domain [, ], to graph f.) The function f( x ) is graphed here. Write an equation for each graph below as a transformation of f( x ). f(x)


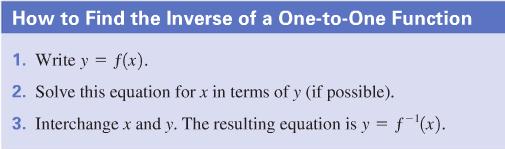
22 1.6 Inverse Functions Note: The idea of an inverse function is that the input becomes the output and the output becomes the input. One-to-one Functions A function is one-to-one if any two different inputs in the domain correspond to two different outputs in the range. That is, each X in the domain has one and only one Y in the range. Domain Range Horizontal Line Test Once you have determined that a graph defines a function, an easy way to determine if it is a one-to-one function is to use the horizontal line test. Draw horizontal lines through the graph. If any horizontal line crosses the graph more than once, then the graph does not define a one-to-one function. Ex1: Indicate if the function is a one-to-one function: a). b). c). Note: f reads f inverse or inverse of f, and f x f x If a function has an inverse, it is said to be invertible. Input and output relation: f(5) = f 1 (3) =

23 Ex. Ex3. a. b. Ex4. a. b. c.


24 Graph the inverse function Ex b. Ex a. Ex5: (a) Find f 1 x of 1 3x x 5 f x ; b) Find g 1 x of g x x 6 4 3x
Section 1.3 Rates of Change and Behavior of Graphs
 Section 1. Rates of Change and Behavior of Graphs 5 Section 1. Rates of Change and Behavior of Graphs Since functions represent how an output quantity varies with an input quantity, it is natural to ask
Chapter 3: Inequalities, Lines and Circles, Introduction to Functions
 QUIZ AND TEST INFORMATION: The material in this chapter is on Quiz 3 and Exam 2. You should complete at least one attempt of Quiz 3 before taking Exam 2. This material is also on the final exam and used
MAT 122 Homework 7 Solutions
 MAT 1 Homework 7 Solutions Section 3.3, Problem 4 For the function w = (t + 1) 100, we take the inside function to be z = t + 1 and the outside function to be z 100. The derivative of the inside function
Suppose that f is continuous on [a, b] and differentiable on (a, b). Then
![Suppose that f is continuous on [a, b] and differentiable on (a, b). Then](/thumbs/74/71325034.jpg "Suppose that f is continuous on [a, b] and differentiable on (a, b). Then") Lectures 1/18 Derivatives and Graphs When we have a picture of the graph of a function f(x), we can make a picture of the derivative f (x) using the slopes of the tangents to the graph of f. In this section
Lectures 1/18 Derivatives and Graphs When we have a picture of the graph of a function f(x), we can make a picture of the derivative f (x) using the slopes of the tangents to the graph of f. In this section
Section 1.1 Exercises
 Section. Functions and Function Notation 99 Section. Eercises. The amount of garbage, G, produced by a city with population p is given by G f( p). G is measured in tons per week, and p is measured in thousands
1. Which one of the following points is a singular point of. f(x) = (x 1) 2/3? f(x) = 3x 3 4x 2 5x + 6? (C)
 = (x 1) 2/3? f(x) = 3x 3 4x 2 5x + 6? (C)") Math 1120 Calculus Test 3 November 4, 1 Name In the first 10 problems, each part counts 5 points (total 50 points) and the final three problems count 20 points each Multiple choice section Circle the correct
Math 1120 Calculus Test 3 November 4, 1 Name In the first 10 problems, each part counts 5 points (total 50 points) and the final three problems count 20 points each Multiple choice section Circle the correct
A function is actually a simple concept; if it were not, history would have replaced it with a simpler one by now! Here is the definition:
 1.2 Functions and Their Properties A function is actually a simple concept; if it were not, history would have replaced it with a simpler one by now! Here is the definition: Definition: Function, Domain,
1) The line has a slope of ) The line passes through (2, 11) and. 6) r(x) = x + 4. From memory match each equation with its graph.
 The line has a slope of ) The line passes through (2, 11) and. 6) r(x) = x + 4. From memory match each equation with its graph.") Review Test 2 Math 1314 Name Write an equation of the line satisfying the given conditions. Write the answer in standard form. 1) The line has a slope of - 2 7 and contains the point (3, 1). Use the point-slope
Review Test 2 Math 1314 Name Write an equation of the line satisfying the given conditions. Write the answer in standard form. 1) The line has a slope of - 2 7 and contains the point (3, 1). Use the point-slope
Functions & Function Notation
 Functions & Function Notation What is a Function? The natural world is full of relationships between quantities that change. When we see these relationships, it is natural for us to ask If I know one quantity,
Test 2 Review Math 1111 College Algebra
 Test 2 Review Math 1111 College Algebra 1. Begin by graphing the standard quadratic function f(x) = x 2. Then use transformations of this graph to graph the given function. g(x) = x 2 + 2 *a. b. c. d.
AP Calculus AB. Chapter IV Lesson B. Curve Sketching
 AP Calculus AB Chapter IV Lesson B Curve Sketching local maxima Absolute maximum F I A B E G C J Absolute H K minimum D local minima Summary of trip along curve critical points occur where the derivative
MAT 107 College Algebra Fall 2013 Name. Final Exam, Version X
 MAT 107 College Algebra Fall 013 Name Final Exam, Version X EKU ID Instructor Part 1: No calculators are allowed on this section. Show all work on your paper. Circle your answer. Each question is worth
Notes: Piecewise Functions
 Objective: Students will be able to write evaluate piecewise defined functions, graph piecewise defined functions, evaluate the domain and range for piecewise defined functions, and solve application problems.
1.2 Functions and Their Properties Name:
 1.2 Functions and Their Properties Name: Objectives: Students will be able to represent functions numerically, algebraically, and graphically, determine the domain and range for functions, and analyze
Explain the mathematical processes of the function, and then reverse the process to explain the inverse.
 Lesson 8: Inverse Functions Outline Inverse Function Objectives: I can determine whether a function is one-to-one when represented numerically, graphically, or algebraically. I can determine the inverse
Section 6.1: Composite Functions
 Section 6.1: Composite Functions Def: Given two function f and g, the composite function, which we denote by f g and read as f composed with g, is defined by (f g)(x) = f(g(x)). In other words, the function
Polynomial Degree Leading Coefficient. Sign of Leading Coefficient
 Chapter 1 PRE-TEST REVIEW Polynomial Functions MHF4U Jensen Section 1: 1.1 Power Functions 1) State the degree and the leading coefficient of each polynomial Polynomial Degree Leading Coefficient y = 2x
1 Wyner PreCalculus Fall 2013
 1 Wyner PreCalculus Fall 2013 CHAPTER ONE: FUNCTIONS AND THEIR GRAPHS Summary, Terms, and Objectives Most of calculus and precalculus is based on functions. A function is a process that takes one or more
Math 1101 Test 2 Practice Problems
 Math 1101 Test 2 Practice Problems These problems are not intended to cover all possible test topics. These problems should serve as on activity in preparing for your test, but other study is required
Mock Final Exam Name. Solve and check the linear equation. 1) (-8x + 8) + 1 = -7(x + 3) A) {- 30} B) {- 6} C) {30} D) {- 28}
 (-8x + 8) + 1 = -7(x + 3) A) {- 30} B) {- 6} C) {30} D) {- 28}") Mock Final Exam Name Solve and check the linear equation. 1) (-8x + 8) + 1 = -7(x + 3) 1) A) {- 30} B) {- 6} C) {30} D) {- 28} First, write the value(s) that make the denominator(s) zero. Then solve the
Mock Final Exam Name Solve and check the linear equation. 1) (-8x + 8) + 1 = -7(x + 3) 1) A) {- 30} B) {- 6} C) {30} D) {- 28} First, write the value(s) that make the denominator(s) zero. Then solve the
College Algebra Joysheet 1 MAT 140, Fall 2015 D. Ivanšić. Name: Simplify and write the answer so all exponents are positive:
 College Algebra Joysheet 1 MAT 140, Fall 2015 D. Ivanšić Name: Covers: R.1 R.4 Show all your work! Simplify and write the answer so all exponents are positive: 1. (5pts) (3x 4 y 2 ) 2 (5x 2 y 6 ) 3 = 2.
Use a graphing utility to approximate the real solutions, if any, of the equation rounded to two decimal places. 4) x3-6x + 3 = 0 (-5,5) 4)
 x3-6x + 3 = 0 (-5,5) 4)") Advanced College Prep Pre-Calculus Midyear Exam Review Name Date Per List the intercepts for the graph of the equation. 1) x2 + y - 81 = 0 1) Graph the equation by plotting points. 2) y = -x2 + 9 2) List
Advanced College Prep Pre-Calculus Midyear Exam Review Name Date Per List the intercepts for the graph of the equation. 1) x2 + y - 81 = 0 1) Graph the equation by plotting points. 2) y = -x2 + 9 2) List
April 9, 2009 Name The problems count as marked. The total number of points available is 160. Throughout this test, show your work.
 April 9, 009 Name The problems count as marked The total number of points available is 160 Throughout this test, show your work 1 (15 points) Consider the cubic curve f(x) = x 3 + 3x 36x + 17 (a) Build
APPLICATIONS OF DIFFERENTIATION
 4 APPLICATIONS OF DIFFERENTIATION APPLICATIONS OF DIFFERENTIATION Many applications of calculus depend on our ability to deduce facts about a function f from information concerning its derivatives. APPLICATIONS
Lesson 9 Exploring Graphs of Quadratic Functions
 Exploring Graphs of Quadratic Functions Graph the following system of linear inequalities: { y > 1 2 x 5 3x + 2y 14 a What are three points that are solutions to the system of inequalities? b Is the point
1. Use the properties of exponents to simplify the following expression, writing your answer with only positive exponents.
 Math120 - Precalculus. Final Review. Fall, 2011 Prepared by Dr. P. Babaali 1 Algebra 1. Use the properties of exponents to simplify the following expression, writing your answer with only positive exponents.
Intermediate Algebra Final Exam Review
 Intermediate Algebra Final Exam Review Note to students: The final exam for MAT10, MAT 11 and MAT1 will consist of 30 multiple-choice questions and a few open-ended questions. The exam itself will cover
The coordinates of the vertex of the corresponding parabola are p, q. If a > 0, the parabola opens upward. If a < 0, the parabola opens downward.
 Mathematics 10 Page 1 of 8 Quadratic Relations in Vertex Form The expression y ax p q defines a quadratic relation in form. The coordinates of the of the corresponding parabola are p, q. If a > 0, the
How much can they save? Try $1100 in groceries for only $40.
 It s Not New, It s Recycled Composition of Functions.4 LEARNING GOALS KEY TERM In this lesson, you will: Perform the composition of two functions graphically and algebraically. Use composition of functions
3. Solve the following inequalities and express your answer in interval notation.
 Youngstown State University College Algebra Final Exam Review (Math 50). Find all Real solutions for the following: a) x 2 + 5x = 6 b) 9 x2 x 8 = 0 c) (x 2) 2 = 6 d) 4x = 8 x 2 e) x 2 + 4x = 5 f) 36x 3
Chapter 1: Functions. Section 1.1 Functions and Function Notation. Section 1.1 Functions and Function Notation 1
 Section. Functions and Function Notation Chapter : Functions Section. Functions and Function Notation... Section. Domain and Range... Section. Rates of Change and Behavior of Graphs... 4 Section.4 Composition
What makes f '(x) undefined? (set the denominator = 0)
 undefined? (set the denominator = 0)") Chapter 3A Review 1. Find all critical numbers for the function ** Critical numbers find the first derivative and then find what makes f '(x) = 0 or undefined Q: What is the domain of this function (especially
Chapter 3A Review 1. Find all critical numbers for the function ** Critical numbers find the first derivative and then find what makes f '(x) = 0 or undefined Q: What is the domain of this function (especially
Sections 4.1 & 4.2: Using the Derivative to Analyze Functions
 Sections 4.1 & 4.2: Using the Derivative to Analyze Functions f (x) indicates if the function is: Increasing or Decreasing on certain intervals. Critical Point c is where f (c) = 0 (tangent line is horizontal),
The First Derivative Test
 The First Derivative Test We have already looked at this test in the last section even though we did not put a name to the process we were using. We use a y number line to test the sign of the first derivative
Precalculus Lesson 4.1 Polynomial Functions and Models Mrs. Snow, Instructor
 Precalculus Lesson 4.1 Polynomial Functions and Models Mrs. Snow, Instructor Let s review the definition of a polynomial. A polynomial function of degree n is a function of the form P(x) = a n x n + a
Examples 2: Composite Functions, Piecewise Functions, Partial Fractions
 Examples 2: Composite Functions, Piecewise Functions, Partial Fractions September 26, 206 The following are a set of examples to designed to complement a first-year calculus course. objectives are listed
Solutions Manual for Precalculus An Investigation of Functions
 Solutions Manual for Precalculus An Investigation of Functions David Lippman, Melonie Rasmussen nd Edition Solutions created at The Evergreen State College and Shoreline Community College Last edited 9/6/17
Student Study Session Topic: Interpreting Graphs
 Student Study Session Topic: Interpreting Graphs Starting with the graph of a function or its derivative, you may be asked all kinds of questions without having (or needing) and equation to work with.
MATH 151, Fall 2015, Week 12, Section
 MATH 151, Fall 2015, Week 12, Section 5.1-5.3 Chapter 5 Application of Differentiation We develop applications of differentiation to study behaviors of functions and graphs Part I of Section 5.1-5.3, Qualitative/intuitive
HORIZONTAL AND VERTICAL TRANSLATIONS
 MCR3U Sections 1.6 1.8 Transformations HORIZONTAL AND VERTICAL TRANSLATIONS A change made to a figure or a relation such that the figure or graph of the relation is shifted or changed in shape. Translations,
In #1 and 2, use inverse operations to solve each equation. 2.
 In #1 and 2, use inverse operations to solve each equation. 1. 3x + 12 + 5x = 7 2. 1 (4x + 10) = x 5 2 3. Alex and Alyssa both have savings accounts. Alex has $515 and saves $23 per month. Alyssa has $725
To get horizontal and slant asymptotes algebraically we need to know about end behaviour for rational functions.
 Concepts: Horizontal Asymptotes, Vertical Asymptotes, Slant (Oblique) Asymptotes, Transforming Reciprocal Function, Sketching Rational Functions, Solving Inequalities using Sign Charts. Rational Function
Georgia Department of Education Common Core Georgia Performance Standards Framework CCGPS Advanced Algebra Unit 2
 Polynomials Patterns Task 1. To get an idea of what polynomial functions look like, we can graph the first through fifth degree polynomials with leading coefficients of 1. For each polynomial function,
2.6. Graphs of Rational Functions. Copyright 2011 Pearson, Inc.
 2.6 Graphs of Rational Functions Copyright 2011 Pearson, Inc. Rational Functions What you ll learn about Transformations of the Reciprocal Function Limits and Asymptotes Analyzing Graphs of Rational Functions
MATH 115 QUIZ4-SAMPLE December 7, 2016
 MATH 115 QUIZ4-SAMPLE December 7, 2016 Please review the following problems from your book: Section 4.1: 11 ( true and false) Section 4.1: 49-70 ( Using table or number line.) Section 4.2: 77-83 Section
ID: ID: ID: of 39 1/18/ :43 AM. Student: Date: Instructor: Alfredo Alvarez Course: 2017 Spring Math 1314
 1 of 39 1/18/017 10:43 AM Student: Date: Instructor: Alfredo Alvarez Course: 017 Spring Math 1314 Assignment: Practice Final 1. Graph the equation. y= x 3 ID: 1.1-11. Perform the multiplication and write
Determine whether the formula determines y as a function of x. If not, explain. Is there a way to look at a graph and determine if it's a function?
 1.2 Functions and Their Properties Name: Objectives: Students will be able to represent functions numerically, algebraically, and graphically, determine the domain and range for functions, and analyze
8 Building New Functions from Old Ones
 Arkansas Tech University MATH 2243: Business Calculus Dr. Marcel B. Finan 8 Building New Functions from Old Ones In this section we discuss various ways for building new functions from old ones. New functions
Day 1~ 2-1 Relations & Functions
 NOTES: Honors Algebra Unit 1: Linear Equations Day 1~ -1 Relations & Functions Part 1: Use the following words to complete the sentences below: Inputs Dependent Range Range Domain Independent Relation
Secondary Math 3 Honors Unit 10: Functions Name:
 Secondary Math 3 Honors Unit 10: Functions Name: Parent Functions As you continue to study mathematics, you will find that the following functions will come up again and again. Please use the following
Math 2: Algebra 2, Geometry and Statistics Ms. Sheppard-Brick Chapter 4 Test Review
 Chapter 4 Test Review Students will be able to (SWBAT): Write an explicit and a recursive function rule for a linear table of values. Write an explicit function rule for a quadratic table of values. Determine
AP CALCULUS AB Study Guide for Midterm Exam 2017
 AP CALCULUS AB Study Guide for Midterm Exam 2017 CHAPTER 1: PRECALCULUS REVIEW 1.1 Real Numbers, Functions and Graphs - Write absolute value as a piece-wise function - Write and interpret open and closed
PreCalculus: Semester 1 Final Exam Review
 Name: Class: Date: ID: A PreCalculus: Semester 1 Final Exam Review Short Answer 1. Determine whether the relation represents a function. If it is a function, state the domain and range. 9. Find the domain
Solve the problem. Determine the center and radius of the circle. Use the given information about a circle to find its equation.
 Math1314-TestReview2-Spring2016 Name MULTIPLE CHOICE. Choose the one alternative that best completes the statement or answers the question. Solve the problem. 1) Is the point (-5, -3) on the circle defined
Section 5-1 First Derivatives and Graphs
 Name Date Class Section 5-1 First Derivatives and Graphs Goal: To use the first derivative to analyze graphs Theorem 1: Increasing and Decreasing Functions For the interval (a,b), if f '( x ) > 0, then
UNIT 3: MODELING AND ANALYZING QUADRATIC FUNCTIONS
 UNIT 3: MODELING AND ANALYZING QUADRATIC FUNCTIONS This unit investigates quadratic functions. Students study the structure of quadratic expressions and write quadratic expressions in equivalent forms.
Absolute Value Functions
 By: OpenStaxCollege Distances in deep space can be measured in all directions. As such, it is useful to consider distance in terms of absolute values. (credit: "s58y"/flickr) Until the 1920s, the so-called
11 /2 12 /2 13 /6 14 /14 15 /8 16 /8 17 /25 18 /2 19 /4 20 /8
 MAC 1147 Exam #1a Answer Key Name: Answer Key ID# Summer 2012 HONOR CODE: On my honor, I have neither given nor received any aid on this examination. Signature: Instructions: Do all scratch work on the
MTH4100 Calculus I. Lecture notes for Week 2. Thomas Calculus, Sections 1.3 to 1.5. Rainer Klages
 MTH4100 Calculus I Lecture notes for Week 2 Thomas Calculus, Sections 1.3 to 1.5 Rainer Klages School of Mathematical Sciences Queen Mary University of London Autumn 2009 Reading Assignment: read Thomas
Polynomial functions right- and left-hand behavior (end behavior):
:") Lesson 2.2 Polynomial Functions For each function: a.) Graph the function on your calculator Find an appropriate window. Draw a sketch of the graph on your paper and indicate your window. b.) Identify
Lesson 2.2 Polynomial Functions For each function: a.) Graph the function on your calculator Find an appropriate window. Draw a sketch of the graph on your paper and indicate your window. b.) Identify
1.2. Functions and Their Properties. Copyright 2011 Pearson, Inc.
 1.2 Functions and Their Properties Copyright 2011 Pearson, Inc. What you ll learn about Function Definition and Notation Domain and Range Continuity Increasing and Decreasing Functions Boundedness Local
NAME: DATE: CLASS: AP CALCULUS AB SUMMER MATH 2018
 NAME: DATE: CLASS: AP CALCULUS AB SUMMER MATH 2018 A] Refer to your pre-calculus notebook, the internet, or the sheets/links provided for assistance. B] Do not wait until the last minute to complete this
4x 2-5x+3. 7x-1 HOMEWORK 1-1
 HOMEWORK 1-1 As it is always the case that correct answers without sufficient mathematical justification may not receive full credit, make sure that you show all your work. Please circle, draw a box around,
x 4 D: (4, ); g( f (x)) = 1
; g( f (x)) = 1") Honors Math 4 Describing Functions One Giant Review Name Answer Key 1. Let f (x) = x, g(x) = 6x 3, h(x) = x 3 a. f (g(h(x))) = 2x 3 b. h( f (g(x))) = 1 3 6x 3 c. f ( f ( f (x))) = x 1 8 2. Let f (x) =
Honors Math 4 Describing Functions One Giant Review Name Answer Key 1. Let f (x) = x, g(x) = 6x 3, h(x) = x 3 a. f (g(h(x))) = 2x 3 b. h( f (g(x))) = 1 3 6x 3 c. f ( f ( f (x))) = x 1 8 2. Let f (x) =
Semester Review Packet
 MATH 110: College Algebra Instructor: Reyes Semester Review Packet Remarks: This semester we have made a very detailed study of four classes of functions: Polynomial functions Linear Quadratic Higher degree
Math 110 Midterm 1 Study Guide October 14, 2013
 Name: For more practice exercises, do the study set problems in sections: 3.4 3.7, 4.1, and 4.2. 1. Find the domain of f, and express the solution in interval notation. (a) f(x) = x 6 D = (, ) or D = R
MATH 1113 Exam 1 Review
 MATH 1113 Exam 1 Review Topics Covered Section 1.1: Rectangular Coordinate System Section 1.3: Functions and Relations Section 1.4: Linear Equations in Two Variables and Linear Functions Section 1.5: Applications
College Algebra Notes
 Metropolitan Community College Contents Introduction 2 Unit 1 3 Rational Expressions........................................... 3 Quadratic Equations........................................... 9 Polynomial,
College Algebra. George Voutsadakis 1. LSSU Math 111. Lake Superior State University. 1 Mathematics and Computer Science
 College Algebra George Voutsadakis 1 1 Mathematics and Computer Science Lake Superior State University LSSU Math 111 George Voutsadakis (LSSU) College Algebra December 2014 1 / 74 Outline 1 Additional
The First Derivative Test for Rise and Fall Suppose that a function f has a derivative at every poin x of an interval A. Then
 Derivatives - Applications - c CNMiKnO PG - 1 Increasing and Decreasing Functions A function y = f(x) is said to increase throughout an interval A if y increases as x increases. That is, whenever x 2 >
Calculus 221 worksheet
 Calculus 221 worksheet Graphing A function has a global maximum at some a in its domain if f(x) f(a) for all other x in the domain of f. Global maxima are sometimes also called absolute maxima. A function
Pre-Calculus Midterm Practice Test (Units 1 through 3)
") Name: Date: Period: Pre-Calculus Midterm Practice Test (Units 1 through 3) Learning Target 1A I can describe a set of numbers in a variety of ways. 1. Write the following inequalities in interval notation.
Name: Date: Period: Pre-Calculus Midterm Practice Test (Units 1 through 3) Learning Target 1A I can describe a set of numbers in a variety of ways. 1. Write the following inequalities in interval notation.
MCR3U 1.1 Relations and Functions Date:
 MCR3U 1.1 Relations and Functions Date: Relation: a relationship between sets of information. ie height and time of a ball in the air. In relations, the pairs of time and heights are "ordered"; ie ordered
Quarter 2 400, , , , , , ,000 50,000
 Algebra 2 Quarter 2 Quadratic Functions Introduction to Polynomial Functions Hybrid Electric Vehicles Since 1999, there has been a growing trend in the sales of hybrid electric vehicles. These data show
Unit 3 Applications of Differentiation Lesson 4: The First Derivative Lesson 5: Concavity and The Second Derivative
 Warmup 1) The lengths of the sides of a square are decreasing at a constant rate of 4 ft./min. In terms of the perimeter, P, what is the rate of change of the area of the square in square feet per minute?
Honors Advanced Algebra Unit 3: Polynomial Functions November 9, 2016 Task 11: Characteristics of Polynomial Functions
 Honors Advanced Algebra Name Unit 3: Polynomial Functions November 9, 2016 Task 11: Characteristics of Polynomial Functions MGSE9 12.F.IF.7 Graph functions expressed symbolically and show key features
2.6 Logarithmic Functions. Inverse Functions. Question: What is the relationship between f(x) = x 2 and g(x) = x?
 = x 2 and g(x) = x?") Inverse Functions Question: What is the relationship between f(x) = x 3 and g(x) = 3 x? Question: What is the relationship between f(x) = x 2 and g(x) = x? Definition (One-to-One Function) A function f
Inverse Functions Question: What is the relationship between f(x) = x 3 and g(x) = 3 x? Question: What is the relationship between f(x) = x 2 and g(x) = x? Definition (One-to-One Function) A function f
4.4 Graphs of Logarithmic Functions
 590 Chapter 4 Exponential and Logarithmic Functions 4.4 Graphs of Logarithmic Functions In this section, you will: Learning Objectives 4.4.1 Identify the domain of a logarithmic function. 4.4.2 Graph logarithmic
Advanced Mathematics Unit 2 Limits and Continuity
 Advanced Mathematics 3208 Unit 2 Limits and Continuity NEED TO KNOW Expanding Expanding Expand the following: A) (a + b) 2 B) (a + b) 3 C) (a + b)4 Pascals Triangle: D) (x + 2) 4 E) (2x -3) 5 Random Factoring
Advanced Mathematics Unit 2 Limits and Continuity
 Advanced Mathematics 3208 Unit 2 Limits and Continuity NEED TO KNOW Expanding Expanding Expand the following: A) (a + b) 2 B) (a + b) 3 C) (a + b)4 Pascals Triangle: D) (x + 2) 4 E) (2x -3) 5 Random Factoring
SKILL BUILDER TEN. Graphs of Linear Equations with Two Variables. If x = 2 then y = = = 7 and (2, 7) is a solution.
 is a solution.") SKILL BUILDER TEN Graphs of Linear Equations with Two Variables A first degree equation is called a linear equation, since its graph is a straight line. In a linear equation, each term is a constant or
SKILL BUILDER TEN Graphs of Linear Equations with Two Variables A first degree equation is called a linear equation, since its graph is a straight line. In a linear equation, each term is a constant or
Section 1.1 Functions and Function Notation
 Chapter 1: Functions Section 1.1 Functions and Function Notation... 1 Section 1. Basic Toolkit Functions... 11 Section 1.3 Domain and Range... 1 Section 1.4 Composition of Functions... Section 1.5 Transformation
North Carolina State University
 North Carolina State University MA 141 Course Text Calculus I by Brenda Burns-Williams and Elizabeth Dempster August 7, 2014 Section1 Functions Introduction In this section, we will define the mathematical
( ) = 2 x + 3 B. f ( x) = x 2 25
 = 2 x + 3 B. f ( x) = x 2 25") PRACTICE - Algebra Final Exam (Semester 1) - PRACTICE 1. Which function contains only a vertical translation? A. f x ( ) = x + 3 B. f ( x) = x 5 C. f ( x) = 1( x 9) D. f ( x) = x + 4. Which function is
PRACTICE - Algebra Final Exam (Semester 1) - PRACTICE 1. Which function contains only a vertical translation? A. f x ( ) = x + 3 B. f ( x) = x 5 C. f ( x) = 1( x 9) D. f ( x) = x + 4. Which function is
AP Calculus Summer Homework MULTIPLE CHOICE. Choose the one alternative that best completes the statement or answers the question.
 AP Calculus Summer Homework 2015-2016 Part 2 Name Score MULTIPLE CHOICE. Choose the one alternative that best completes the statement or answers the question. Find the distance d(p1, P2) between the points
Regents Review Session #3 Functions
 Regents Review Session #3 Functions A relation is a set of ordered pairs. A function is a relation in which each element of the domain corresponds t exactly one element in the range. (Each x value is paired
Calculus I Practice Problems 8: Answers
 Calculus I Practice Problems : Answers. Let y x x. Find the intervals in which the function is increasing and decreasing, and where it is concave up and concave down. Sketch the graph. Answer. Differentiate
4.2: What Derivatives Tell Us
 4.2: What Derivatives Tell Us Problem Fill in the following blanks with the correct choice of the words from this list: Increasing, decreasing, positive, negative, concave up, concave down (a) If you know
MULTIPLE CHOICE. Choose the one alternative that best completes the statement or answers the question. C) x 8. C) y = x + 3 2
 x 8. C) y = x + 3 2") Precalculus Fall Final Exam Review Name Date Period MULTIPLE CHOICE. Choose the one alternative that best completes the statement or answers the question. Simplify the expression. Assume that the variables
Precalculus Fall Final Exam Review Name Date Period MULTIPLE CHOICE. Choose the one alternative that best completes the statement or answers the question. Simplify the expression. Assume that the variables
Chapter 3A -- Rectangular Coordinate System
 Fry Texas A&M University! Fall 2016! Math 150 Notes! Section 3A! Page61 Chapter 3A -- Rectangular Coordinate System A is any set of ordered pairs of real numbers. A relation can be finite: {(-3, 1), (-3,
Chapter 6: Exponential and Logarithmic Functions
 Section 6.1: Algebra and Composition of Functions #1-9: Let f(x) = 2x + 3 and g(x) = 3 x. Find each function. 1) (f + g)(x) 2) (g f)(x) 3) (f/g)(x) 4) ( )( ) 5) ( g/f)(x) 6) ( )( ) 7) ( )( ) 8) (g+f)(x)
MA 137 Calculus 1 with Life Science Applications Monotonicity and Concavity (Section 5.2) Extrema, Inflection Points, and Graphing (Section 5.
 Extrema, Inflection Points, and Graphing (Section 5.") MA 137 Calculus 1 with Life Science Applications Monotonicity and Concavity (Section 52) Extrema, Inflection Points, and Graphing (Section 53) Alberto Corso albertocorso@ukyedu Department of Mathematics
MA 137 Calculus 1 with Life Science Applications Monotonicity and Concavity (Section 52) Extrema, Inflection Points, and Graphing (Section 53) Alberto Corso albertocorso@ukyedu Department of Mathematics
Math 108, Solution of Midterm Exam 3
 Math 108, Solution of Midterm Exam 3 1 Find an equation of the tangent line to the curve x 3 +y 3 = xy at the point (1,1). Solution. Differentiating both sides of the given equation with respect to x,
Math 1311 Section 5.5 Polynomials and Rational Functions
 Math 1311 Section 5.5 Polynomials and Rational Functions In addition to linear, exponential, logarithmic, and power functions, many other types of functions occur in mathematics and its applications. In
Section 4.3 Concavity and Curve Sketching 1.5 Lectures. Dr. Abdulla Eid. College of Science. MATHS 101: Calculus I
 Section 4.3 Concavity and Curve Sketching 1.5 Lectures College of Science MATHS 101: Calculus I (University of Bahrain) Concavity 1 / 29 Concavity Increasing Function has three cases (University of Bahrain)
Chapter 2 Analysis of Graphs of Functions
 Chapter Analysis of Graphs of Functions Chapter Analysis of Graphs of Functions Covered in this Chapter:.1 Graphs of Basic Functions and their Domain and Range. Odd, Even Functions, and their Symmetry..
3 Inequalities Absolute Values Inequalities and Intervals... 4
 Contents 1 Real Numbers, Exponents, and Radicals 2 1.1 Rationalizing the Denominator................................... 2 1.2 Factoring Polynomials........................................ 2 1.3 Algebraic
Section 12.2 The Second Derivative
 Section 12.2 The Second Derivative Higher derivatives If f is a differentiable function, then f is also a function. So, f may have a derivative of its own, denoted by (f ) = f. This new function f is called
14 Increasing and decreasing functions
 14 Increasing and decreasing functions 14.1 Sketching derivatives READING Read Section 3.2 of Rogawski Reading Recall, f (a) is the gradient of the tangent line of f(x) at x = a. We can use this fact to
Applications of Derivatives
 Applications of Derivatives Extrema on an Interval Objective: Understand the definition of extrema of a function on an interval. Understand the definition of relative extrema of a function on an open interval.