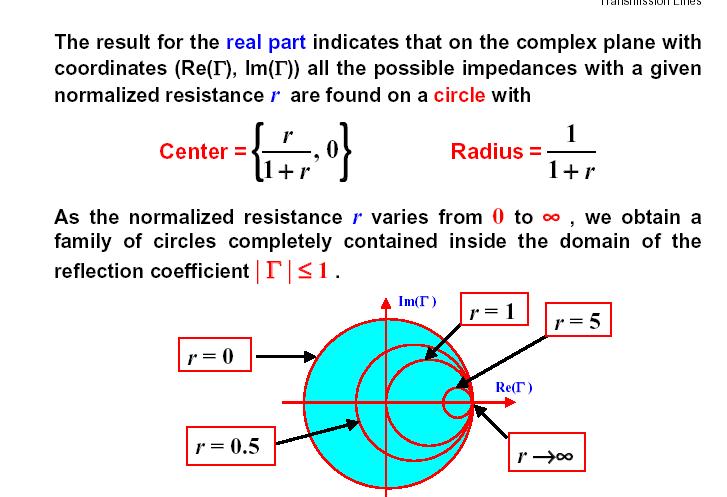
Imaginary Impedance Axis. Real Impedance Axis. Smith Chart. The circles, tangent to the right side of the chart, are constant resistance circles
|
|
|
- Bernard Greer
- 5 years ago
- Views:
Transcription

1 The Smith Chart The Smith Chart is simply a graphical calculator for computing impedance as a function of reflection coefficient. Many problems can be easily visualized with the Smith Chart The Smith chart is one of the most useful graphical tools for high frequency circuit applications. The chart provides a clever way to visualize complex functions. 1
2 2
3 3
4 4
5 Real Impedance Axis Smith Chart Imaginary Impedance Axis The circles, tangent to the right side of the chart, are constant resistance circles 5
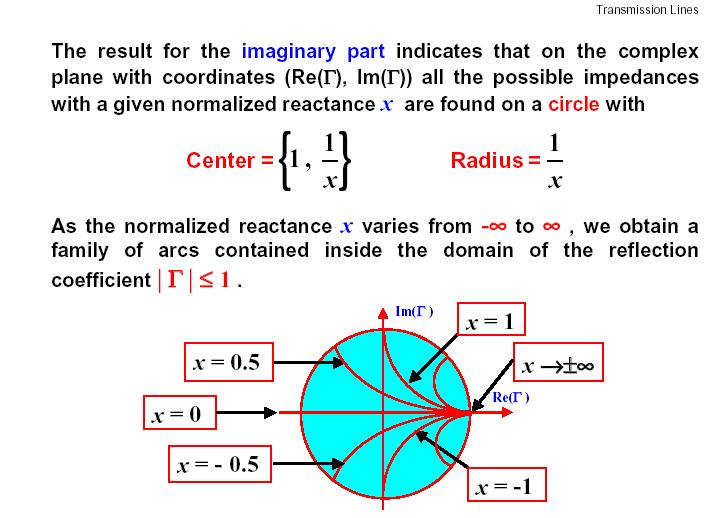
6 The curved lines from the outer circle terminating on the centerline at the right side of the chart are lines of reactance The outermost circle represents distance in normalized wavelength 6
7 At the bottom the chart, there are radially scaled parameters that would be used to find the amplitude of the reflection coefficient, transmission coefficient, VSWR or return loss Complete Smith Chart 7
8 The upper half of the outer circle scale of the chart represents the inductive reactance component jx L /Z 0 The lower half of the outer circle scale of the chart represents the capacitive reactance component jx c /Z 0 8
9 At the point 1.0, the line termination is equal to the characteristic impedance of the line and no reflection occurs The center of the line, also the center of the chart, is the 1.0 point where R=Z 0. Smith Chart The outside of the chart shows location on the line in wavelengths. The combination of intersecting circles inside the chart allow us to locate the normalized impedance and then to find the impedance anywhere on the line. All impedance values are normalized with respect to the characteristic impedance of the transmission line. 9
 do not change, so they characterize the voltage & current patterns on the line Smith Chart")
10 One revolution of the chart on the outermost circle is one-half wavelength. Impedances, voltages, currents, etc. all repeat every half wavelength The magnitude of the reflection coefficient, the standing wave ratio (SWR) do not change, so they characterize the voltage & current patterns on the line Smith Chart Impedance divided by line impedance (50 Ohms) Z1 = j50 Z2 = 75 -j100 Z3 = j200 Z4 = 150 Z5 = infinity (an open circuit) Z6 = 0 (a short circuit) Z7 = 50 Z8 = 184 -j900 Then, normalize and plot. The points are plotted as follows: z1 = 2 + j z2 = 1.5 -j2 z3 = j4 z4 = 3 z5 = infinity z6 = 0 z7 = 1 z8 = j18 10
11 Motion Towards Generator Moving towards generator means Γ(-l)= Γ e -jβl, or clockwise motion. We re back to where we started when 2βl=2π, or l=λ/2. Thus the impedance is periodic. Smith Chart Thus, the first step in analyzing a transmission line is to locate the normalized load impedance on the chart Next, a circle is drawn that represents the reflection coefficient or SWR. The center of the circle is the center of the chart. The circle passes through the normalized load impedance Any point on the line is found on this circle. Rotate clockwise to move toward the generator (away from the load) The distance moved on the line is indicated on the outside of the chart in wavelengths 11


 plane is called an")


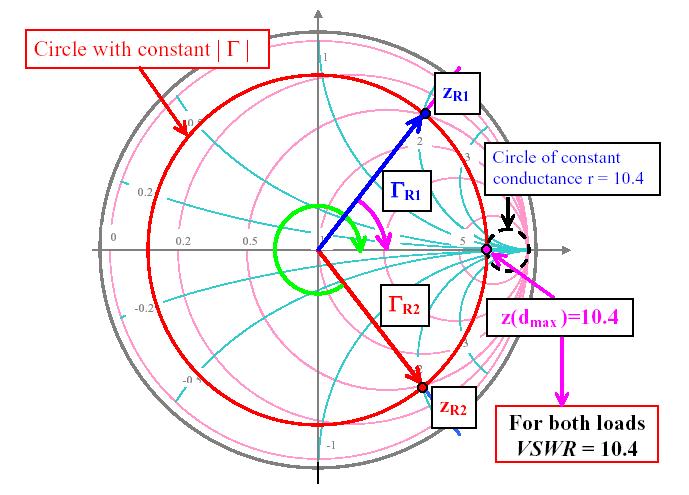
12 Toward Generator Constant Reflection Coefficient Circle Away From Generator Scale in Wavelengths Full Circle is One Half Wavelength Since Everything Repeats SWR Circle Since SWR is a function of Γ, a circle at origin in (r,x) plane is called an SWR circle Recall the voltage max occurs when the reflected wave is in phase with the forward wave, so Γ(z max ) = Γ(l) This corresponds to the intersection of the SWR circle with the positive real axis Likewise, the intersection with the negative real axis is the location of the voltage min 12
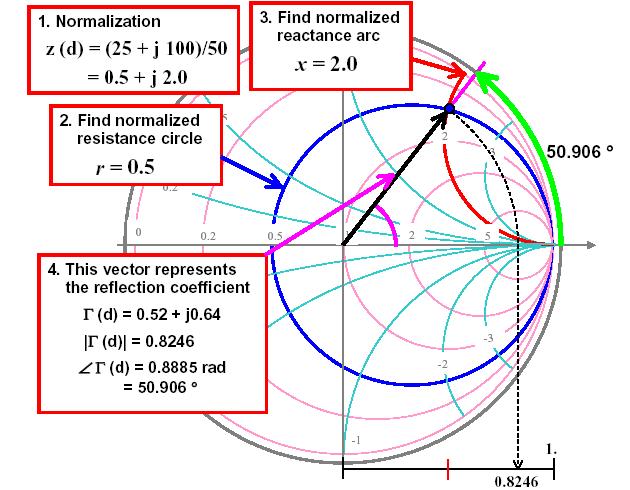
13 Smith Chart Example First, locate the normalized impedance on the chart for Z L = 30 + j70 (Z 0 =50 ohm) Then draw the circle through the point The circle gives us the reflection coefficient (the radius of the circle) which can be read from the scale at the bottom of most charts Also note that exactly opposite to the normalized load is its admittance. Thus, the chart can also be used to find the admittance. We use this fact in stub matching Start with the Smith Chart 13
14 Locate r Circle of the normalized Load Impedance = Real part of (Z L/Z o) Locate the x Circle of the normalized Load Impedance = Imag part of (Z L/Z o) 14
15 Locate the Intercept point of the r Circle and the x Circle for Load Impedance Draw a constant Γ Circle passing by the Intercept point for Load Impedance 15
16 Draw a Radial Line passing by the Intercept point for Load Impedance Identify the Position/Location in Wavelengths Measure the Radius of the Γ Circle. This is the Magnitude of Γ for the Load 16
17 17
18 18
19 19
20 20

21 21
22 22
23 23
24 24
25 25
26 26
27 Example:Smith Chart operation using admitances A load of Z L =100+j50Ω line. What are the load admittance and the input admittance if the line is 0.15λ long Locate r Circle of the normalized Load Impedance = Real part of (Z L/Z o) r=2 27
28 Locate the Intercept point of the r Circle and the x Circle for Load Impedance x=1 r=2 Draw the constant reflection coefficient (SWR) circle z L =2+j1 28

29 Draw a Radial Line passing by the Intercept point for Load Impedance Identify the Position/Location in Wavelengths 0.214λ 0.464λ z L =2+j1 The normalized admittance is located at a point on the circle of SWR which is diametrically opposite to the normalized impedance 0.214λ 0.464λ y L =0.40-j0.20 z L =2+j1 29
 The normalized input admittance can be found by rotating 0.15λ from y L 0.114λ y=0.")
30 The actual load admittance Y L =y L Y 0 =y L /Z 0 = j (S) The normalized input admittance can be found by rotating 0.15λ from y L 0.114λ y=0. 61+j λ y L =0.40-j
31 The actual input admittance Y L =yy 0 =y/z 0 = j (S) Smith Chart References hibp.ecse.rpi.edu/~connor/ education/fields/smith_chart.ppt uts.htm 31
Berkeley. The Smith Chart. Prof. Ali M. Niknejad. U.C. Berkeley Copyright c 2017 by Ali M. Niknejad. September 14, 2017
 Berkeley The Smith Chart Prof. Ali M. Niknejad U.C. Berkeley Copyright c 17 by Ali M. Niknejad September 14, 17 1 / 29 The Smith Chart The Smith Chart is simply a graphical calculator for computing impedance
Microwave Circuits Design
 The Smith Chart: The Smith chart is a graphical aide used to simplify the solution of Tx-line problems More importantly, the Smith chart allows us to visualize the periodic nature of the line impedance
Module 2 : Transmission Lines. Lecture 10 : Transmisssion Line Calculations Using Smith Chart. Objectives. In this course you will learn the following
 Objectives In this course you will learn the following What is a constant VSWR circle on the - plane? Properties of constant VSWR circles. Calculations of load reflection coefficient. Calculation of reflection
TRANSMISSION LINES AND MATCHING
 TRANSMISSION LINES AND MATCHING for High-Frequency Circuit Design Elective by Michael Tse September 2003 Contents Basic models The Telegrapher s equations and solutions Transmission line equations The
Lecture 9. The Smith Chart and Basic Impedance-Matching Concepts
 ecture 9 The Smith Chart and Basic Impedance-Matching Concepts The Smith Chart: Γ plot in the Complex Plane Smith s chart is a graphical representation in the complex Γ plane of the input impedance, the
ECE357H1S ELECTROMAGNETIC FIELDS TERM TEST 1. 8 February 2016, 19:00 20:00. Examiner: Prof. Sean V. Hum
 UNIVERSITY OF TORONTO FACULTY OF APPLIED SCIENCE AND ENGINEERING The Edward S. Rogers Sr. Department of Electrical and Computer Engineering ECE57HS ELECTROMAGNETIC FIELDS TERM TEST 8 February 6, 9:00 :00
) Rotate L by 120 clockwise to obtain in!! anywhere between load and generator: rotation by 2d in clockwise direction. d=distance from the load to the
 Rotate L by 120 clockwise to obtain in!! anywhere between load and generator: rotation by 2d in clockwise direction. d=distance from the load to the") 3.1 Smith Chart Construction: Start with polar representation of. L ; in on lossless lines related by simple phase change ) Idea: polar plot going from L to in involves simple rotation. in jj 1 ) circle
3.1 Smith Chart Construction: Start with polar representation of. L ; in on lossless lines related by simple phase change ) Idea: polar plot going from L to in involves simple rotation. in jj 1 ) circle
Voltage reflection coefficient Γ. L e V V. = e. At the load Γ (l = 0) ; Γ = V V
 ; Γ = V V") of 3 Smith hart Tutorial Part To begin with we start with the definition of SWR, which is the ratio of the reflected voltage over the incident voltage. The Reflection coefficient Γ is simply the complex
of 3 Smith hart Tutorial Part To begin with we start with the definition of SWR, which is the ratio of the reflected voltage over the incident voltage. The Reflection coefficient Γ is simply the complex
ECE 391 supplemental notes - #11. Adding a Lumped Series Element
 ECE 391 supplemental notes - #11 Adding a umped Series Element Consider the following T-line circuit: Z R,1! Z,2! Z z in,1 = r in,1 + jx in,1 Z in,1 = z in,1 Z,1 z = Z Z,2 zin,2 = r in,2 + jx in,2 z,1
EE Lecture 7. Finding gamma. Alternate form. I i. Transmission line. Z g I L Z L. V i. V g - Z in Z. z = -l z = 0
 Impedance on lossless lines EE - Lecture 7 Impedance on lossless lines Reflection coefficient Impedance equation Shorted line example Assigned reading: Sec.. of Ulaby For lossless lines, γ = jω L C = jβ;
Problem 1 Γ= = 0.1λ = max VSWR = 13
 Smith Chart Problems 1. The 0:1 length line shown has a characteristic impedance of 50 and is terminated with a load impedance of Z =5+j25. (a) ocate z = Z Z 0 =0:1+j0:5 onthe Smith chart. See the point
Microwave Circuit Design I
 9 1 Microwave Circuit Design I Lecture 9 Topics: 1. Admittance Smith Chart 2. Impedance Matching 3. Single-Stub Tuning Reading: Pozar pp. 228 235 The Admittance Smith Chart Since the following is also
y(d) = j
 = j") Problem 2.66 A 0-Ω transmission line is to be matched to a computer terminal with Z L = ( j25) Ω by inserting an appropriate reactance in parallel with the line. If f = 800 MHz and ε r = 4, determine the
Problem 2.66 A 0-Ω transmission line is to be matched to a computer terminal with Z L = ( j25) Ω by inserting an appropriate reactance in parallel with the line. If f = 800 MHz and ε r = 4, determine the
Impedance Matching. Generally, Z L = R L + jx L, X L 0. You need to turn two knobs to achieve match. Example z L = 0.5 j
 Impedance Matching Generally, Z L = R L + jx L, X L 0. You need to turn two knobs to achieve match. Example z L = 0.5 j This time, we do not want to cut the line to insert a matching network. Instead,
0-2 Operations with Complex Numbers
 Simplify. 1. i 10 2. i 2 + i 8 3. i 3 + i 20 4. i 100 5. i 77 esolutions Manual - Powered by Cognero Page 1 6. i 4 + i 12 7. i 5 + i 9 8. i 18 Simplify. 9. (3 + 2i) + ( 4 + 6i) 10. (7 4i) + (2 3i) 11.
0-2 Operations with Complex Numbers
 Simplify. 1. i 10 1 2. i 2 + i 8 0 3. i 3 + i 20 1 i esolutions Manual - Powered by Cognero Page 1 4. i 100 1 5. i 77 i 6. i 4 + i 12 2 7. i 5 + i 9 2i esolutions Manual - Powered by Cognero Page 2 8.
ECE 604, Lecture 13. October 16, 2018
 ECE 604, Lecture 13 October 16, 2018 1 Introduction In this lecture, we will cover the following topics: Terminated Transmission Line Smith Chart Voltage Standing Wave Ratio (VSWR) Additional Reading:
ECE145A/218A Course Notes
 ECE145A/218A Course Notes Last note set: Introduction to transmission lines 1. Transmission lines are a linear system - superposition can be used 2. Wave equation permits forward and reverse wave propagation
Lecture 12 Date:
 Lecture 12 Date: 09.02.2017 Microstrip Matching Networks Series- and Shunt-stub Matching Quarter Wave Impedance Transformer Microstrip Line Matching Networks In the lower RF region, its often a standard
How to measure complex impedance at high frequencies where phase measurement is unreliable.
 Objectives In this course you will learn the following Various applications of transmission lines. How to measure complex impedance at high frequencies where phase measurement is unreliable. How and why
Transmission Lines. Plane wave propagating in air Y unguided wave propagation. Transmission lines / waveguides Y. guided wave propagation
 Transmission Lines Transmission lines and waveguides may be defined as devices used to guide energy from one point to another (from a source to a load). Transmission lines can consist of a set of conductors,
Contents. ! Transmission Lines! The Smith Chart! Vector Network Analyser (VNA) ! Measurements. ! structure! calibration! operation
 ! Measurements. ! structure! calibration! operation") Contents! Transmission Lines! The Smith Chart! Vector Network Analyser (VNA)! structure! calibration! operation! Measurements Göran Jönsson, EIT 2009-11-16 Network Analysis 2! Waves on Lines! If the wavelength
Contents! Transmission Lines! The Smith Chart! Vector Network Analyser (VNA)! structure! calibration! operation! Measurements Göran Jönsson, EIT 2009-11-16 Network Analysis 2! Waves on Lines! If the wavelength
Annexure-I. network acts as a buffer in matching the impedance of the plasma reactor to that of the RF
 Annexure-I Impedance matching and Smith chart The output impedance of the RF generator is 50 ohms. The impedance matching network acts as a buffer in matching the impedance of the plasma reactor to that
Contents. Transmission Lines The Smith Chart Vector Network Analyser (VNA) ü structure ü calibration ü operation. Measurements
 ü structure ü calibration ü operation. Measurements") Contents Transmission Lines The Smith Chart Vector Network Analyser (VNA) ü structure ü calibration ü operation Measurements Göran Jönsson, EIT 2015-04-27 Vector Network Analysis 2 Waves on Lines If the
Contents Transmission Lines The Smith Chart Vector Network Analyser (VNA) ü structure ü calibration ü operation Measurements Göran Jönsson, EIT 2015-04-27 Vector Network Analysis 2 Waves on Lines If the
Name. Section. Short Answer Questions. 1. (20 Pts) 2. (10 Pts) 3. (5 Pts) 4. (10 Pts) 5. (10 Pts) Regular Questions. 6. (25 Pts) 7.
 2. (10 Pts) 3. (5 Pts) 4. (10 Pts) 5. (10 Pts) Regular Questions. 6. (25 Pts) 7.") Name Section Short Answer Questions 1. (20 Pts) 2. (10 Pts) 3. (5 Pts). (10 Pts) 5. (10 Pts) Regular Questions 6. (25 Pts) 7. (20 Pts) Notes: 1. Please read over all questions before you begin your work.
Name Section Short Answer Questions 1. (20 Pts) 2. (10 Pts) 3. (5 Pts). (10 Pts) 5. (10 Pts) Regular Questions 6. (25 Pts) 7. (20 Pts) Notes: 1. Please read over all questions before you begin your work.
6-1 Chapter 6 Transmission Lines
 6-1 Chapter 6 Transmission ines ECE 3317 Dr. Stuart A. ong 6-2 General Definitions p.133 6-3 Voltage V( z) = α E ds ( C z) 1 C t t ( a) Current I( z) = α H ds ( C0 closed) 2 C 0 ( b) http://www.cartoonstock.com
TC 412 Microwave Communications. Lecture 6 Transmission lines problems and microstrip lines
 TC 412 Microwave Communications Lecture 6 Transmission lines problems and microstrip lines RS 1 Review Input impedance for finite length line Quarter wavelength line Half wavelength line Smith chart A
Smith Chart Figure 1 Figure 1.
 Smith Chart The Smith chart appeared in 1939 as a graph-based method of simplifying the complex math (that is, calculations involving variables of the form x + jy) needed to describe the characteristics
arxiv: v1 [physics.acc-ph] 19 Jan 2012
![arxiv: v1 [physics.acc-ph] 19 Jan 2012](/thumbs/71/65761722.jpg "arxiv: v1 [physics.acc-ph] 19 Jan 2012") RF engineering basic concepts: the Smith chart F. Caspers CERN, Geneva, Switzerland arxiv:68v [physics.acc-ph] 9 Jan Motivation Abstract The Smith chart is a very valuable and important tool that facilitates
RF engineering basic concepts: the Smith chart F. Caspers CERN, Geneva, Switzerland arxiv:68v [physics.acc-ph] 9 Jan Motivation Abstract The Smith chart is a very valuable and important tool that facilitates
Lecture 14 Date:
 Lecture 14 Date: 18.09.2014 L Type Matching Network Examples Nodal Quality Factor T- and Pi- Matching Networks Microstrip Matching Networks Series- and Shunt-stub Matching L Type Matching Network (contd.)
Transmission line equations in phasor form
 Transmission line equations in phasor form Kenneth H. Carpenter Department of Electrical and Computer Engineering Kansas State University November 19, 2004 The text for this class presents transmission
ANTENNAS and MICROWAVES ENGINEERING (650427)
") Philadelphia University Faculty of Engineering Communication and Electronics Engineering ANTENNAS and MICROWAVES ENGINEERING (65427) Part 2 Dr. Omar R Daoud 1 General Considerations It is a two-port network
Philadelphia University Faculty of Engineering Communication and Electronics Engineering ANTENNAS and MICROWAVES ENGINEERING (65427) Part 2 Dr. Omar R Daoud 1 General Considerations It is a two-port network
Smith Chart Ahmad Bilal. Ahmad Bilal
 Smith Chart Ahmad Bilal Ahmad Bilal Objectives To develop a understanding about frame work of smith chart Ahmad Bilal But Why Should I Study Smith Chart Are the formulas not enough Ahmad Bilal Smith Chart
Contents. Transmission Lines The Smith Chart Vector Network Analyser (VNA) ü structure ü calibration ü operation. Measurements
 ü structure ü calibration ü operation. Measurements") Contents Transmission Lines The Smith Chart Vector Network Analyser (VNA) ü structure ü calibration ü operation Measurements Göran Jönsson, EIT 2017-05-12 Vector Network Analysis 2 Waves on Lines If the
Contents Transmission Lines The Smith Chart Vector Network Analyser (VNA) ü structure ü calibration ü operation Measurements Göran Jönsson, EIT 2017-05-12 Vector Network Analysis 2 Waves on Lines If the
Waves on Lines. Contents. ! Transmission Lines! The Smith Chart! Vector Network Analyser (VNA) ! Measurements
 ! Measurements") Waves on Lines If the wavelength to be considered is significantly greater compared to the size of the circuit the voltage will be independent of the location. amplitude d! distance but this is not true
Waves on Lines If the wavelength to be considered is significantly greater compared to the size of the circuit the voltage will be independent of the location. amplitude d! distance but this is not true
High Speed Communication Circuits and Systems Lecture 4 Generalized Reflection Coefficient, Smith Chart, Integrated Passive Components
 High Speed Communication Circuits and Systems Lecture 4 Generalized Reflection Coefficient, Smith Chart, Integrated Passive Components Michael H. Perrott February 11, 2004 Copyright 2004 by Michael H.
An Introduction to the Smith Chart for Amateur Radio. Jesse Sheinwald, N2CA
 An Introduction to the Smith Chart for Amateur Radio Jesse Sheinwald, N2CA jsheinwald@pobox.com ± 180 50 20 0.1 0.3 0.5 0.7 0.9 1.2 1.4 1.6 1.8 2.0 3.0 4.0 5.0 10 20 50-90 0 0 < 0.1 0.3 0.5 0.7 0.9 1.2
RF Engineering Basic Concepts: The Smith Chart
 RF Engineering Basic Concepts: The Smith Chart F. Caspers CERN, Geneva, Switzerland Motivation Abstract The Smith chart is a very valuable and important tool that facilitates interpretation of S-parameter
FINAL EXAM IN FYS-3007
 Page 1 of 4 pages + chart FINAL EXAM IN FYS-007 Exam in : Fys-007 Microwave Techniques Date : Tuesday, May 1, 2011 Time : 09.00 1.00 Place : Åsgårdveien 9 Approved remedies : All non-living and non-communicating
The Cooper Union Department of Electrical Engineering ECE135 Engineering Electromagnetics Exam II April 12, Z T E = η/ cos θ, Z T M = η cos θ
 The Cooper Union Department of Electrical Engineering ECE135 Engineering Electromagnetics Exam II April 12, 2012 Time: 2 hours. Closed book, closed notes. Calculator provided. For oblique incidence of
Transmission Lines in the Frequency Domain
 Berkeley Transmission Lines in the Frequency Domain Prof. Ali M. Niknejad U.C. Berkeley Copyright c 2016 by Ali M. Niknejad August 30, 2017 1 / 38 Why Sinusoidal Steady-State? 2 / 38 Time Harmonic Steady-State
Module 13: Network Analysis and Directional Couplers
 Module 13: Network Analysis and Directional Couplers 13.2 Network theory two port networks, S-parameters, Z-parameters, Y-parameters The study of two port networks is important in the field of electrical
Electrodynamics and Microwaves 17. Stub Matching Technique in Transmission Lines
 1 Module 17 Stub Matching Technique in Transmission Lines 1. Introduction 2. Concept of matching stub 3. Mathematical Basis for Single shunt stub matching 4.Designing of single stub using Smith chart 5.
Prepared by: Eng. Talal F. Skaik
 Islamic University of Gaza Faculty of Engineering Electrical & Computer Dept. Prepared by: Eng. Talal F. Skaik Microwaves Lab Experiment #3 Single Stub Matching Objectives: Understanding Impedance Matching,
ECE 107: Electromagnetism
 ECE 107: Electromagnetism Set 2: Transmission lines Instructor: Prof. Vitaliy Lomakin Department of Electrical and Computer Engineering University of California, San Diego, CA 92093 1 Outline Transmission
mywbut.com Lesson 16 Solution of Current in AC Parallel and Seriesparallel
 esson 6 Solution of urrent in Parallel and Seriesparallel ircuits n the last lesson, the following points were described:. How to compute the total impedance/admittance in series/parallel circuits?. How
Module 4. Single-phase AC Circuits
 Module 4 Single-phase AC Circuits Lesson 14 Solution of Current in R-L-C Series Circuits In the last lesson, two points were described: 1. How to represent a sinusoidal (ac) quantity, i.e. voltage/current
ECE357H1F ELECTROMAGNETIC FIELDS FINAL EXAM. 28 April Examiner: Prof. Sean V. Hum. Duration: hours
 UNIVERSITY OF TORONTO FACULTY OF APPLIED SCIENCE AND ENGINEERING The Edward S. Rogers Sr. Department of Electrical and Computer Engineering ECE357H1F ELECTROMAGNETIC FIELDS FINAL EXAM 28 April 15 Examiner:
COMPARATIVE STUDY OF THE TRANSMISSION ELLIPSOMETRIC FUNCTION CONTOURS AND THE SMITH CHART. A Thesis Presented to The Academic Faculty. Wade A.
 COMPARATIVE STUDY OF THE TRANSMISSION ELLIPSOMETRIC FUNCTION CONTOURS AND THE SMITH CHART A Thesis Presented to The Academic Faculty By Wade A. Berzett In Partial Fulfillment Of the Requirements for the
Impedance matching via QWT
 Impedance matching via QWT Goal: Design a QWT matching network such that: Z in = Z 0 z in = 1 + j0 For ZL purely real: Z 0 Z T λ/4 Z L = r L + j0 Z in Since Z in Z L = Z 2 T a match is achieved with a
Transmission Line Theory
 S. R. Zinka zinka@vit.ac.in School of Electronics Engineering Vellore Institute of Technology April 26, 2013 Outline 1 Free Space as a TX Line 2 TX Line Connected to a Load 3 Some Special Cases 4 Smith
Lecture 13 Date:
 ecture 3 Date: 6.09.204 The Signal Flow Graph (Contd.) Impedance Matching and Tuning Tpe Matching Network Example Signal Flow Graph (contd.) Splitting Rule Now consider the three equations SFG a a b 2
Electrical Circuits Lab Series RC Circuit Phasor Diagram
 Electrical Circuits Lab. 0903219 Series RC Circuit Phasor Diagram - Simple steps to draw phasor diagram of a series RC circuit without memorizing: * Start with the quantity (voltage or current) that is
Lowpass L Matching Network Designer
 Lowpass L Matching Network Designer V S L V L I S j*x S C j*x L Table of Contents I. General Impedance Matching II. Impedance Transformation for Power Amplifiers III. Inputs IV. Calculations V. Outputs
Microwave Oscillators Design
 Microwave Oscillators Design Oscillators Classification Feedback Oscillators β Α Oscillation Condition: Gloop = A β(jω 0 ) = 1 Gloop(jω 0 ) = 1, Gloop(jω 0 )=2nπ Negative resistance oscillators Most used
Smith Chart The quarter-wave transformer
 Smith Chart The quarter-wave transformer We will cover these topics The Smith Chart The Quarter-Wave Transformer Watcharapan Suwansan8suk #3 EIE/ENE 450 Applied Communica8ons and Transmission Lines King
Networks and Systems Prof. V. G. K. Murti Department of Electrical Engineering Indian Institution of Technology, Madras
 Networks and Systems Prof. V. G. K. Murti Department of Electrical Engineering Indian Institution of Technology, Madras Lecture - 32 Network Function (3) 2-port networks: Symmetry Equivalent networks Examples
Introduction to Smith Charts
 Intrductin t Smith Charts Dr. Russell P. Jedlicka Klipsch Schl f Electrical and Cmputer Engineering New Mexic State University as Cruces, NM 88003 September 2002 EE521 ecture 3 08/22/02 Smith Chart Summary
and Ee = E ; 0 they are separated by a dielectric material having u = io-s S/m, µ, = µ, 0
 602 CHAPTER 11 TRANSMISSION LINES 11.10 Two identical pulses each of magnitude 12 V and width 2 µs are incident at t = 0 on a lossless transmission line of length 400 m terminated with a load. If the two
Solutions to Problems in Chapter 6
 Appendix F Solutions to Problems in Chapter 6 F.1 Problem 6.1 Short-circuited transmission lines Section 6.2.1 (book page 193) describes the method to determine the overall length of the transmission line
Module 4. Single-phase AC circuits. Version 2 EE IIT, Kharagpur
 Module 4 Single-phase circuits ersion EE T, Kharagpur esson 6 Solution of urrent in Parallel and Seriesparallel ircuits ersion EE T, Kharagpur n the last lesson, the following points were described:. How
This section reviews the basic theory of accuracy enhancement for one-port networks.
 Vector measurements require both magnitude and phase data. Some typical examples are the complex reflection coefficient, the magnitude and phase of the transfer function, and the group delay. The seminar
AC Circuits Homework Set
 Problem 1. In an oscillating LC circuit in which C=4.0 μf, the maximum potential difference across the capacitor during the oscillations is 1.50 V and the maximum current through the inductor is 50.0 ma.
Fault Analysis Power System Representation
 .1. Power System Representation Single Line Diagram: Almost all modern power systems are three phase systems with the phases of equal magnitude and equal phase difference (i.e., 10 o ). These three phase
HOW TO SOLVE YOUR ANTENNA MATCHING PROBLEMS
 HOW TO SOLVE YOUR ANTENNA MATCHING PROBLEMS John Sexton, G4CNN. Reprinted from Echelford Amateur Radio Society Newsletter for November 1978. Introduction. In January 1977 there appeared in RADCOM an article
CHAPTER 45 COMPLEX NUMBERS
 CHAPTER 45 COMPLEX NUMBERS EXERCISE 87 Page 50. Solve the quadratic equation: x + 5 0 Since x + 5 0 then x 5 x 5 ( )(5) 5 j 5 from which, x ± j5. Solve the quadratic equation: x x + 0 Since x x + 0 then
EDEXCEL NATIONAL CERTIFICATE UNIT 28 FURTHER MATHEMATICS FOR TECHNICIANS OUTCOME 2- ALGEBRAIC TECHNIQUES TUTORIAL 2 - COMPLEX NUMBERS
 EDEXCEL NATIONAL CERTIFICATE UNIT 8 FURTHER MATHEMATICS FOR TECHNICIANS OUTCOME - ALGEBRAIC TECHNIQUES TUTORIAL - COMPLEX NUMBERS CONTENTS Be able to apply algebraic techniques Arithmetic progression (AP):
Introduction to Network Analysis of Microwave Circuits
 1 Introduction to Network Analysis of Microwave Circuits ABSTRACT Network presentation has been used as a technique in the analysis of lowfrequency electrical electronic circuits. The same technique is
Transmission and Distribution of Electrical Power
 KINGDOM OF SAUDI ARABIA Ministry Of High Education Umm Al-Qura University College of Engineering & Islamic Architecture Department Of Electrical Engineering Transmission and Distribution of Electrical
Lecture Outline. Scattering at an Impedance Discontinuity Power on a Transmission Line Voltage Standing Wave Ratio (VSWR) 8/10/2018
 8/10/2018") Course Instructor Dr. Raymond C. Rumpf Office: A 337 Phone: (95) 747 6958 E Mail: rcrumpf@utep.edu EE 4347 Applied Electromagnetics Topic 4d Scattering on a Transmission Line Scattering These on a notes
Course Instructor Dr. Raymond C. Rumpf Office: A 337 Phone: (95) 747 6958 E Mail: rcrumpf@utep.edu EE 4347 Applied Electromagnetics Topic 4d Scattering on a Transmission Line Scattering These on a notes
Smith Chart Tuning, Part I
 Smith Chart Tuning, Part I Donald Lee Advantest Test Cell Innovations, SOC Business Unit January 30, 2013 Abstract Simple rules of Smith Chart tuning will be presented, followed by examples. The goal is
Microwave Phase Shift Using Ferrite Filled Waveguide Below Cutoff
 Microwave Phase Shift Using Ferrite Filled Waveguide Below Cutoff CHARLES R. BOYD, JR. Microwave Applications Group, Santa Maria, California, U. S. A. ABSTRACT Unlike conventional waveguides, lossless
Lecture Outline. Shorted line (Z L = 0) Open circuit line (Z L = ) Matched line (Z L = Z 0 ) 9/28/2017. EE 4347 Applied Electromagnetics.
 Open circuit line (Z L = ) Matched line (Z L = Z 0 ) 9/28/2017. EE 4347 Applied Electromagnetics.") 9/8/17 Course Instructor Dr. Raymond C. Rumpf Office: A 337 Phone: (915) 747 6958 E Mail: rcrumpf@utep.edu EE 4347 Applied Electromagnetics Topic 4b Transmission ine Behavior Transmission These ine notes
9/8/17 Course Instructor Dr. Raymond C. Rumpf Office: A 337 Phone: (915) 747 6958 E Mail: rcrumpf@utep.edu EE 4347 Applied Electromagnetics Topic 4b Transmission ine Behavior Transmission These ine notes
ECE 3300 Standing Waves
 Standing Waves ECE3300 Lossless Transmission Lines Lossless Transmission Line: Transmission lines are characterized by: and Zo which are a function of R,L,G,C To minimize loss: Use high conductivity materials
Sinusoidal Steady-State Analysis
 Sinusoidal Steady-State Analysis Mauro Forti October 27, 2018 Constitutive Relations in the Frequency Domain Consider a network with independent voltage and current sources at the same angular frequency
ELG4125: Power Transmission Lines Steady State Operation
 ELG4125: Power Transmission Lines Steady State Operation Two-Port Networks and ABCD Models A transmission line can be represented by a two-port network, that is a network that can be isolated from the
Transmission Line Input Impedance
 1/22/23 Transmission e Input Impedance.doc 1/9 Transmission e Input Impedance Consider a lossless le, length, termated with a load. I(z) I + V (z) -, β + V - z z What is the put impedance of this le? Q:
The Maximally-Flat Current Transformer 1 By David W Knight
 1 The Maximally-Flat Current Transformer 1 By David W Knight In the design of current transformers for broadband RF applications, good performance at the lowfrequency end of the operating range requires
Impedance Matching and Tuning
 C h a p t e r F i v e Impedance Matching and Tuning This chapter marks a turning point, in that we now begin to apply the theory and techniques of previous chapters to practical problems in microwave engineering.
Module 4. Single-phase AC Circuits. Version 2 EE IIT, Kharagpur 1
 Module 4 Single-phase A ircuits ersion EE IIT, Kharagpur esson 4 Solution of urrent in -- Series ircuits ersion EE IIT, Kharagpur In the last lesson, two points were described:. How to represent a sinusoidal
2.4 The Smith Chart. Reading Assignment: pp The Smith Chart. The Smith Chart provides: The most important fact about the Smith Chart is:
 2/7/2005 2_4 The Smith Chart 1/2 2.4 The Smith Chart Readg Assignment: pp. 64-73 The Smith Chart The Smith Chart provides: 1) 2) The most important fact about the Smith Chart is: HO: The Complex Γ plane
1.3 Sinusoidal Steady State
 1.3 Sinusoidal Steady State Electromagnetics applications can be divided into two broad classes: Time-domain: Excitation is not sinusoidal (pulsed, broadband, etc.) Ultrawideband communications Pulsed
EE 205 Dr. A. Zidouri. Electric Circuits II. Two-Port Circuits Two-Port Parameters. Lecture #42
 EE 05 Dr. A. Zidouri Electric Circuits Two-Port Circuits Two-Port Parameters Lecture #4-1 - EE 05 Dr. A. Zidouri The material to be covered in this lecture is as follows: o ntroduction to two-port circuits
RLC Series Circuit. We can define effective resistances for capacitors and inductors: 1 = Capacitive reactance:
 RLC Series Circuit In this exercise you will investigate the effects of changing inductance, capacitance, resistance, and frequency on an RLC series AC circuit. We can define effective resistances for
Electricity and Light Pre Lab Questions
 Electricity and Light Pre Lab Questions The pre lab questions can be answered by reading the theory and procedure for the related lab. You are strongly encouraged to answers these questions on your own.
Sinusoidal Steady State Analysis (AC Analysis) Part I
 Part I") Sinusoidal Steady State Analysis (AC Analysis) Part I Amin Electronics and Electrical Communications Engineering Department (EECE) Cairo University elc.n102.eng@gmail.com http://scholar.cu.edu.eg/refky/
Sinusoidal Steady State Analysis (AC Analysis) Part I Amin Electronics and Electrical Communications Engineering Department (EECE) Cairo University elc.n102.eng@gmail.com http://scholar.cu.edu.eg/refky/
Gabriel Kron's biography here.
 Gabriel Kron, Electric Circuit Model of the Schrödinger Equation, 1945 - Component of :... Page 1 of 12 {This website: Please note: The following article is complete; it has been put into ASCII due to
5.2 Single-Stub Tuning
 3/26/29 5_2 Sgle_Stub Tung.doc 1/1 5.2 Sgle-Stub Tung Readg Assignment: pp. 228-235 Q: If we cannot use lumped elements like ductors or capacitors to build lossless matchg networks, what can we use? A:
EE 581 Power Systems. Admittance Matrix: Development, Direct and Iterative solutions
 EE 581 Power Systems Admittance Matrix: Development, Direct and Iterative solutions Overview and HW # 8 Chapter 2.4 Chapter 6.4 Chapter 6.1-6.3 Homework: Special Problem 1 and 2 (see handout) Overview
Secondary Math GRAPHING TANGENT AND RECIPROCAL TRIG FUNCTIONS/SYMMETRY AND PERIODICITY
 Secondary Math 3 7-5 GRAPHING TANGENT AND RECIPROCAL TRIG FUNCTIONS/SYMMETRY AND PERIODICITY Warm Up Factor completely, include the imaginary numbers if any. (Go to your notes for Unit 2) 1. 16 +120 +225
INSTITUTE OF AERONAUTICAL ENGINEERING Dundigal, Hyderabad Electronics and Communicaton Engineering
 INSTITUTE OF AERONAUTICAL ENGINEERING Dundigal, Hyderabad - 00 04 Electronics and Communicaton Engineering Question Bank Course Name : Electromagnetic Theory and Transmission Lines (EMTL) Course Code :
Basics of Network Theory (Part-I)
") Basics of Network Theory (PartI). A square waveform as shown in figure is applied across mh ideal inductor. The current through the inductor is a. wave of peak amplitude. V 0 0.5 t (m sec) [Gate 987: Marks]
Basics of Network Theory (PartI). A square waveform as shown in figure is applied across mh ideal inductor. The current through the inductor is a. wave of peak amplitude. V 0 0.5 t (m sec) [Gate 987: Marks]
2. The following diagram illustrates that voltage represents what physical dimension?
 BioE 1310 - Exam 1 2/20/2018 Answer Sheet - Correct answer is A for all questions 1. A particular voltage divider with 10 V across it consists of two resistors in series. One resistor is 7 KΩ and the other
Transmission lines. Shouri Chatterjee. October 22, 2014
 Transmission lines Shouri Chatterjee October 22, 2014 The transmission line is a very commonly used distributed circuit: a pair of wires. Unfortunately, a pair of wires used to apply a time-varying voltage,
IMPEDANCE and NETWORKS. Transformers. Networks. A method of analysing complex networks. Y-parameters and S-parameters
 IMPEDANCE and NETWORKS Transformers Networks A method of analysing complex networks Y-parameters and S-parameters 1 ENGN4545/ENGN6545: Radiofrequency Engineering L#7 Transformers Combining the effects
Wave Phenomena Physics 15c. Lecture 8 LC Transmission Line Wave Reflection
 Wave Phenomena Physics 15c Lecture 8 LC Transmission Line Wave Reflection Midterm Exam #1 Midterm #1 has been graded Class average = 80.4 Standard deviation = 14.6 Your exam will be returned in the section
Single Phase Parallel AC Circuits
 Single Phase Parallel AC Circuits 1 Single Phase Parallel A.C. Circuits (Much of this material has come from Electrical & Electronic Principles & Technology by John Bird) n parallel a.c. circuits similar
What s Your (real or imaginary) LCR IQ?
 LCR IQ?") Chroma Systems Solutions, Inc. What s Your (real or imaginary) LCR IQ? 11021, 11025 LCR Meter Keywords:. Impedance, Inductance, Capacitance, Resistance, Admittance, Conductance, Dissipation Factor, 4-Terminal
Chroma Systems Solutions, Inc. What s Your (real or imaginary) LCR IQ? 11021, 11025 LCR Meter Keywords:. Impedance, Inductance, Capacitance, Resistance, Admittance, Conductance, Dissipation Factor, 4-Terminal
KINGS COLLEGE OF ENGINEERING Punalkulam
 KINGS COLLEGE OF ENGINEERING Punalkulam 613 303 DEPARTMENT OF ELECTRICAL AND ELECTRONICS ENGINEERING POWER SYSTEM ANALYSIS QUESTION BANK UNIT I THE POWER SYSTEM AN OVERVIEW AND MODELLING PART A (TWO MARK
Two-Port Networks Admittance Parameters CHAPTER16 THE LEARNING GOALS FOR THIS CHAPTER ARE THAT STUDENTS SHOULD BE ABLE TO:
 CHAPTER16 Two-Port Networks THE LEARNING GOALS FOR THIS CHAPTER ARE THAT STUDENTS SHOULD BE ABLE TO: Calculate the admittance, impedance, hybrid, and transmission parameter for two-port networks. Convert