|
|
|
- Caren York
- 6 years ago
- Views:
Transcription
1
2
3
4
5

6
7
8
9 IE 361 Exam 2 Spring 2011 I have neither given nor received unauthorized assistance on this exam. Name Date 1
10 Below are 25 True-False Questions, worth 2 points each. Write one of "T" or "F" in front of each. 1. The percent impurity in one fluid ounce of a liquid product is tested and plotted once per hour in a production facility. The appropriate control chart limits are p chart limits. 2. A mean number of non-conformities per unit plotted on Shewhart control chart can exceed The upper standards given control limit for ranges increases as the sample size increases. 4. The upper standards given control limit for standard deviations increases as the sample size increases. 5. Upper and lower standards given control limits for fractions non-conforming get further apart as the sample size increases. 6. A point plotting outside of control limits on a Shewhart chart always suggests process degradation. 7. A standard " " used in setting x chart control limits represents only "process" variation. 8. Engineering specifications on dimension A are 1.00'.02', while specifications on dimension B are 1.00'.01'. Then samples of size n 5 must produce x chart control limits that are tighter for dimension B than for dimension A. 9. Engineering feedback control can play a part in establishing industrial process stability that is then monitored using statistical process control. 10. "Special cause variation" is another name for "process change" that Shewhart control charting is meant to detect. 11. Retrospective control limits are meant to help answer the question "Are process parameters at their standard values?" 12. Statistical tolerance limits are intended to indicate the requirements on a measurement in order for a corresponding item to be functional. 13. Statistical prediction limits are intended to locate most of the future output of a stable process based on a sample from that process. 14. C pk is a measure of present process performance (rather than process potential). 15. If a 95% confidence interval for C is sigma" process performance goal has been achieved. pk 1.5,1.7 then it is reasonably clear that a "6 2
11 16. The ARL concept is a tool for aiding the choice/design of a process monitoring scheme, in that it is a quantification of monitoring scheme performance under a particular model of process behavior. 17. The "Western Electric Alarm Rules" are meant to provide the ability to quickly detect non-random patterns on a Shewhart chart. 18. Tool wear in a turning process that would naturally make consecutively machined cylinders increase in size can potentially be compensated for by the use of engineering feedback control. 19. A physically stable process will of necessity produce acceptable product. 20. Trends on an individuals chart tend to make the corresponding value of MR /1.128 "too small" as an estimate of " ". 21. Two different machining centers produce supposedly identical cylinders. A consistent difference between those machines (in terms of diameters produced) if ignored would produce "sample" averages of two diameters from each machine that would tend to look "too/unbelievably stable." 22. Samples (or rational subgroups) of size n 1 make completely reliable estimation of impossible. 23. If a process has a number of known "knobs" that can be used to change an output variable, y, establishing a level of "baseline" variation for y might be done by holding those fixed and control charting process output. 24. Lack of physical stability means that basic changes to process configuration or operation are necessary in order to reduce observed variation. 25. Normal plotting and confirmation a normal distributional shape are necessary before it is possible to make any form of statistical prediction limits. The next 5 pages each have a 10 point "work out" problem on them (numbered W1, W2,W3,W4, and W5.). Answer all 5. 3
12 W1. Below are some means and standard deviations for samples of size n 3 surface roughness measurements (units are -inches ). Sample x x s s 12.2 Suppose that process standards are 20 and 1. Is there evidence of change from these standard values in these data? Show appropriate calculations and explicitly say whether there is any evidence of change from the process standard values. Evidence of change from standard values? (Circle the correct response.) In means? yes/no In standard deviations? yes/no 4
13 W2. Below are numbers of radiators inspected and total leaks found in those inspections over a number of 1 hour periods. Period Leaks Leaks 16 Number Inspected Total 20 Determine whether there is any evidence of process instability in these data. Show appropriate calculations and say clearly where (if at all) there is evidence of instability. 5
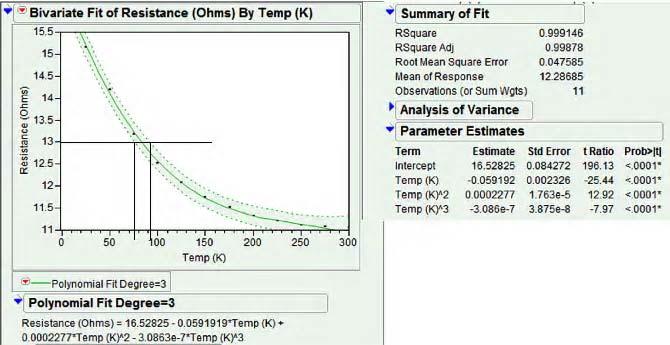
 Why is consideration of the kind of plot shown here wise before considering process capability measures?")
14 W3. Below is a JMP report for n 25 measured weld strengths (units are psi). a) Why is consideration of the kind of plot shown here wise before considering process capability measures? b) Specifications on such strengths are 1100 psi to 1800 psi. Give 95% confidence limits for C pk. 6
15 W4. Suppose that a pelletizing process is physically stable, producing constant fraction nonconforming p. Samples of size n 100 are used to do Shewhart control charting with standard value p.2. a) What is the ARL if p is at its standard value? b) What is the ARL if p is twice its standard value? 7
16 W5. Below is an artificial series of observations (samples of size n 1) collected from consecutive items (suppose the units are inches). 2,4,6,8,10,12,14,16,18,20 a) How does the best available estimate of " " here (based on control charting ideas) compare to the sample standard deviation? Provide some rationale why the larger of these is larger. b) Set up control limits for future monitoring of individual measurements of this type using a process mean of 10 and an appropriate estimate of process standard deviation. 8
17 IE 361 Exam 3 Spring 2011 I have neither given nor received unauthorized assistance on this exam. Name Date 1
18 Below are 25 True-False Questions, worth 2 points each. Write one of "T" or "F" in front of each. 1. Simulation and "statistical tolerancing" are both methods that can be used to approximate the standard deviation of a function of several random variables. 2. "Statistical tolerancing" is more a data analysis tool than it is a "design" or "what if" tool. 3. If a system input is highly variable, then the system output will of necessity be highly variable. 4. If a system is highly sensitive to variation in one input, then the system output will of necessity be highly variable. 5. Without replication in an experiment, there is no solid basis upon which to establish the level of background noise against which observed changes in response experimentalcondition-to-experimental-condition can be judged. 6. Replication in an experiment requires that every set of experimental conditions be "run" the same number of times, producing balanced data. 7. spooled is meant to measure variability in response y for any fixed set of experimental conditions. 8. If s1 2.0, s2 1.5, s3 5.1, and s 4 3.4, then it is impossible that s pooled Rough/approximate 95% "margins of error" for sample means ( y i ) in an r -sample study are 2 s pooled. 10. In a balanced data study, margins of error for a difference in two means yi twice those for a single mean y i. y are i 11. Large sample sizes in experiments improve one's ability to estimate basic experimental variation, but do not much help improve the precision with which main effects and interactions are known. 12. An experimental effect is statistically detectable exactly when it is of realworld/practical importance. 13. One reason to consider the making of margins of error for linear combinations of sample means from an experiment, is that in factorial studies fitted main effects and interactions are such linear combinations. 14. A fitted "A" main effect in a factorial study compares the average mean response at a fixed level of the factor with the overall average mean response. 2
19 15. The difference between two fitted "A" main effects in a factorial study is the difference between the two corresponding average sample means. 16. The presence of important interactions in a two-way factorial study means that it is possible to make blanket statements about the impact of a change in level of Factor A that will hold true across all levels of Factor B. 17. Fitted two-factor interactions in a two-way factorial study measure the difference between what is true about the response and what can be accounted for by considering the impact of the factors acting separately/individually on the response. 18. Three-way interactions in a three-way factorial measure the difference between what one would call A B two-factor interactions looking separately at mean responses on the various levels of Factor C. 19. Results of 2 p factorial experiments are most easily interpreted when p -way interactions are important and statistically detectable. 20. All of the values produced by the Yates algorithm have the same associated margin of error. 7 3 For questions 21-25: In a particular 2 fractional factorial experiment, generators E AB, F CD, and G ABCD are used. 21. In this study, 1 th of all 128 possible combinations of tow levels of each of factors 8 A,B,C,D,E,F, and G are run. 22. The results of such an experiment will typically provide the same amount of 7 information about the effects of Factors A,B,C,D,E,F, and G as would a full 2 factorial study In this study every 2 factorial effect has 7 "aliases." (Every 7 indistinguishable from 7 other 2 factorial effects.) 7 2 factorial effect is 24. One combination of levels of the 7 factors included in the study is the combination abcd. 25. In this study, the E main effects are aliased with F G two-factor interactions. The next 5 pages each have a 10 point "work out" problem on them (numbered W1, W2,W3,W4, and W5.). Answer all 5. 3


20 W1. A plate with two circular holes in it must fit over 2 round pegs. The sketch below illustrates the situation. Pegs of radii r 1 and r 2 mm are placed d 1 mm apart. The holes of radii r 3 and r 4 are placed d 2 mm apart. The plate will fit over the pegs provided 0 r r d r r d and 0 d r r d r r So, for example, the variable c d1 d2 r1 r2 r3 r4 is of interest. Suppose that means and standard deviations of the dimensions here are as follows. Variable d 20 mm 1 mm 1 d 20 mm 1 mm 2 r, r 6 mm.1 mm 1 2 r, r 7 mm.1 mm 3 4 Assuming the dimensions are independent, find the mean ( c ) and standard deviation ( c ) for c. c c 4
21 W2. Some so-called "tilttable tests" were done to compare angles at which vehicles experience liftoff of "high side" wheels and begin to roll over. Tests on r 3 vans produced tangents of angles ("tilttable ratios") at which lift-off occurs summarized below. (Plug in completely, but you need not simplify.) Van #1 Van #2 Van #3 n n2 5 n y y2.968 y s1.002 s2.003 s2.004 Van #1 was a minivan, and Vans #2 and #3 were full-sized vans. A linear combination of means that could be used to compare the minivan to the two full-sized vans is Find 95% confidence limits for this quantity. L
22 W3. Below are some summary statistics from a class project concerning stopping distances of a bicycle with smooth and reverse tread tires on dry and wet concrete. Lengths of m 6 skids marks were measured under each set of conditions and processed to produce the values below. (Units are cm.) Dry Concrete Wet Concrete Smooth Tires y and s11 19 y and s12 26 Reverse Tread Tires y and s21 16 y and s22 37 Using 95% confidence limits find a margin of error to associate with each sample mean in the table. Do some appropriate plotting below, and based on the plot and your margin of error say whether (and WHY) you think that Tire by Surface interactions are statistically detectable. 6
23 3 W4. A 2 factorial study with four sample sizes of 2 and four sample sizes of 1 produces s and the hypothetical sample means below. pooled 1.5 comb y (1) 10 a 13 b 8 ab 11 c 16 ac 5 bc 14 abc 3 Which (if any) factorial effects are statistically detectable (based on 95% confidence limits for effects)? 7
24 W5. A 1 8 th fraction of a 7 2 factorial has defining relation I ABE CDF ABCDG ABCDEF CDEG ABFG EFG Suppose that (initially ignoring levels of factors E,F, and G) one does data analysis that leads to the conclusion that important effects are AB interaction aliases CD interaction aliases ABCD interaction aliases Give then 2 simple plausible interpretations of this outcome in terms of all 7 factors A,B,C,D,E,F, 7 and G? (Which of the 2 factorial effect are potentially important? Consider only interpretations involving main effects or possibly main effects and associated interactions.) Possible interpretation #1: Possible interpretation#2: 8
IE 316 Exam 1 Fall 2011
 IE 316 Exam 1 Fall 2011 I have neither given nor received unauthorized assistance on this exam. Name Signed Date Name Printed 1 1. Suppose the actual diameters x in a batch of steel cylinders are normally
IE 316 Exam 1 Fall 2012
 IE 316 Exam 1 Fall 2012 I have neither given nor received unauthorized assistance on this exam. Name Signed Date Name Printed 1 20 pts 1. Here are 10 True-False questions worth 2 points each. Write (very
IE 316 Exam 1 Fall 2011
 IE 316 Exam 1 Fall 2011 I have neither given nor received unauthorized assistance on this exam. Name Signed Date Name Printed 1 1. Suppose the actual diameters x in a batch of steel cylinders are normally
 IE 361 EXAM #3 FALL 2013 Show your work: Partial credit can only be given for incorrect answers if there is enough information to clearly see what you were trying to do. There are two additional blank
IE 361 Exam 3 Fall I have neither given nor received unauthorized assistance on this exam.
 IE 361 Exam 3 Fall 2012 I have neither given nor received unauthorized assistance on this exam. Name Date 1 1. I wish to measure the density of a small rock. My method is to read the volume of water in
IE 361 Exam 1 October 2004 Prof. Vardeman
 October 5, 004 IE 6 Exam Prof. Vardeman. IE 6 students Demerath, Gottschalk, Rodgers and Watson worked with a manufacturer on improving the consistency of several critical dimensions of a part. One of
IE 361 Exam 3 (Form A)
") December 15, 005 IE 361 Exam 3 (Form A) Prof. Vardeman This exam consists of 0 multiple choice questions. Write (in pencil) the letter for the single best response for each question in the corresponding
December 15, 005 IE 361 Exam 3 (Form A) Prof. Vardeman This exam consists of 0 multiple choice questions. Write (in pencil) the letter for the single best response for each question in the corresponding
Chapter 10: Statistical Quality Control
 Chapter 10: Statistical Quality Control 1 Introduction As the marketplace for industrial goods has become more global, manufacturers have realized that quality and reliability of their products must be
Stat 231 Exam 2 Fall 2013
 Stat 231 Exam 2 Fall 2013 I have neither given nor received unauthorized assistance on this exam. Name Signed Date Name Printed 1 1. Some IE 361 students worked with a manufacturer on quantifying the capability
Stat 231 Final Exam Fall 2013 Slightly Edited Version
 Stat 31 Final Exam Fall 013 Slightly Edited Version I have neither given nor received unauthorized assistance on this exam. Name Signed Date Name Printed 1 1. An IE 361 project group studied the operation
Stat 401B Exam 2 Fall 2016
 Stat 40B Eam Fall 06 I have neither given nor received unauthorized assistance on this eam. Name Signed Date Name Printed ATTENTION! Incorrect numerical answers unaccompanied by supporting reasoning will
IE 361 Module 32. Patterns on Control Charts Part 2 and Special Checks/Extra Alarm Rules
 IE 361 Module 32 Patterns on Control Charts Part 2 and Special Checks/Extra Alarm Rules Reading: Section 3.4 Statistical Methods for Quality Assurance ISU and Analytics Iowa LLC (ISU and Analytics Iowa
Stat 231 Final Exam Fall 2011
 Stat 3 Final Exam Fall 0 I have neither given nor received unauthorized assistance on this exam. Name Signed Date Name Printed . An experiment was run to compare the fracture toughness of high purity 8%
Power Functions for. Process Behavior Charts
 Power Functions for Process Behavior Charts Donald J. Wheeler and Rip Stauffer Every data set contains noise (random, meaningless variation). Some data sets contain signals (nonrandom, meaningful variation).
SAT Subject Test Practice Test II: Math Level I Time 60 minutes, 50 Questions
 SAT Subject Test Practice Test II: Math Level I Time 60 minutes, 50 Questions All questions in the Math Level 1 and Math Level Tests are multiple-choice questions in which you are asked to choose the BEST
Stat 502X Exam 2 Spring 2014
 Stat 502X Exam 2 Spring 2014 I have neither given nor received unauthorized assistance on this exam. Name Signed Date Name Printed This exam consists of 12 parts. I'll score it at 10 points per problem/part
The stopping distance of a car is the sum of the thinking distance and the braking distance.
 The stopping distance of a car is the sum of the thinking distance and the braking distance. The table below shows how the thinking distance and braking distance vary with speed. Speed in m / s Thinking
Assignment 4.2 Frictional Forces CONCEPTUAL QUESTIONS: 1. What is the SI unit of the coefficient of friction (μ s or μ k )?
?") CONCEPTUAL QUESTIONS: 1. What is the SI unit of the coefficient of friction (μ s or μ k )? 2. Tennis is played on clay, grass, and hard surfaces. Please explain why you think tennis players have or don
CONCEPTUAL QUESTIONS: 1. What is the SI unit of the coefficient of friction (μ s or μ k )? 2. Tennis is played on clay, grass, and hard surfaces. Please explain why you think tennis players have or don
Integers include positive numbers, negative numbers, and zero. When we add two integers, the sign of the sum depends on the sign of both addends.
 Adding Integers Reteaching 31 Math Course 3, Lesson 31 Integers include positive numbers, negative numbers, and zero. When we add two integers, the sign of the sum depends on the sign of both addends.
Chapter 5: Measurement of Circles
 Chapter 5: Measurement of Circles Getting Started, p. 151 1. a) Perimeter, since the word around is used. b) Area, since since the word wrap is used. c) Perimeter, since the word wrap is used. 2. a) 5
Design of experiment ERT k-p fractional factorial. Miss Hanna Ilyani Zulhaimi
 + Design of experiment ERT 427 2 k-p fractional factorial Miss Hanna Ilyani Zulhaimi + OUTLINE n Limitation of full factorial design n The concept of fractional factorial, 2 k-p n One-half fraction factorial
IE 361 Module 13. Control Charts for Counts ("Attributes Data")
") IE 361 Module 13 Control Charts for Counts ("Attributes Data") Prof.s Stephen B. Vardeman and Max D. Morris Reading: Section 3.3, Statistical Quality Assurance Methods for Engineers 1 In this module, we
IE 361 Module 13 Control Charts for Counts ("Attributes Data") Prof.s Stephen B. Vardeman and Max D. Morris Reading: Section 3.3, Statistical Quality Assurance Methods for Engineers 1 In this module, we
Here is what you will be able to do when you complete each objective: 1. State the general laws of static and kinetic friction.
 Friction I Learning Outcome When you complete this module you will be able to: Describe and solve problems involving friction. Learning Objectives Here is what you will be able to do when you complete
Date: Math 7 Final Exam Review Name:
 Specific Outcome Achievement Indicators Chapter Got it?? the Solve a given problem involving the addition of two or more decimal numbers. addition, subtraction, multiplication and division of decimals
(b)complete the table to show where the function is positive (above the x axis) or negative (below the x axis) for each interval.
complete the table to show where the function is positive (above the x axis) or negative (below the x axis) for each interval.") Lesson 3.4 Graph and Equation of Polynomial Functions Part A: Graph of a Polynomial Function the x intercepts of the graph the zeros of the function the roots of the equation Multiplicity (of a zero) A
Lesson 3.4 Graph and Equation of Polynomial Functions Part A: Graph of a Polynomial Function the x intercepts of the graph the zeros of the function the roots of the equation Multiplicity (of a zero) A
AP C - Webreview ch 7 (part I) Rotation and circular motion
 Rotation and circular motion") Name: Class: _ Date: _ AP C - Webreview ch 7 (part I) Rotation and circular motion Multiple Choice Identify the choice that best completes the statement or answers the question. 1. 2 600 rev/min is equivalent
Name: Class: _ Date: _ AP C - Webreview ch 7 (part I) Rotation and circular motion Multiple Choice Identify the choice that best completes the statement or answers the question. 1. 2 600 rev/min is equivalent
On the declaration of the measurement uncertainty of airborne sound insulation of noise barriers
 On the declaration of the measurement uncertainty of airborne sound insulation of noise barriers Massimo Garai and Paolo Guidorzi 2,2 University of Bologna - DIN Viale Risorgimento 2, 036 Bologna, Italy
Physics 101. Hour Exam II Fall 2008
 Physics 101. Hour Exam II Fall 2008 Last Name: First Name ID Discussion Section: Discussion TA Name: Instructions Turn off your cell phone and put it away.!!!!!this Exam Booklet is Version A. Mark the
Physics 101. Hour Exam III Spring Last Name: First Name Network-ID Discussion Section: Discussion TA Name:
 Physics 101. Hour Exam III Spring 2011 Last Name: First Name Network-ID Discussion Section: Discussion TA Name: Instructions Turn off your cell phone and put it away. Calculators may not be shared. Please
G.C.B.5: Arc Length 1
 Regents Exam Questions G.C.B.5: Arc Length 1 www.jmap.org Name: G.C.B.5: Arc Length 1 1 A sprinkler system is set up to water the sector shown in the accompanying diagram, with angle ABC measuring 1 radian
CCE RR. ( / English Version ) ( / New Syllabus ) ( / Regular Repeater )
 ( / New Syllabus ) ( / Regular Repeater )") CCE RR 1 81-E : 81-E Code No. : 81-E CCE RR Subject : MATHEMATICS ( / English Version ) ( / New Syllabus ) ( / Regular Repeater ) General Instructions : i) The Question-cum-Answer Booklet consists of objective
CCE RR 1 81-E : 81-E Code No. : 81-E CCE RR Subject : MATHEMATICS ( / English Version ) ( / New Syllabus ) ( / Regular Repeater ) General Instructions : i) The Question-cum-Answer Booklet consists of objective
G.C.B.5: Arc Length 1
 Regents Exam Questions G.C.B.5: Arc Length www.jmap.org Name: G.C.B.5: Arc Length The diagram below shows circle O with radii OA and OB. The measure of angle AOB is 0, and the length of a radius is inches.
SAT SHEET (calculators allowed)
") . If! 15 = 15! x, then x = A) -0 B) -15 C) 0 D) 15 E) 0 4. A dozen roses cost $15.60 and the cost of one rose and one lily together cost $4.50. What is the cost of one lily? A) $1.0 B) $.0 C) $5.80 D)
. If! 15 = 15! x, then x = A) -0 B) -15 C) 0 D) 15 E) 0 4. A dozen roses cost $15.60 and the cost of one rose and one lily together cost $4.50. What is the cost of one lily? A) $1.0 B) $.0 C) $5.80 D)
Stat 401B Final Exam Fall 2015
 Stat 401B Final Exam Fall 015 I have neither given nor received unauthorized assistance on this exam. Name Signed Date Name Printed ATTENTION! Incorrect numerical answers unaccompanied by supporting reasoning
An interval estimator of a parameter θ is of the form θl < θ < θu at a
 Chapter 7 of Devore CONFIDENCE INTERVAL ESTIMATORS An interval estimator of a parameter θ is of the form θl < θ < θu at a confidence pr (or a confidence coefficient) of 1 α. When θl =, < θ < θu is called
Student s Name Course Name Mathematics Grade 7. General Outcome: Develop number sense. Strand: Number. R D C Changed Outcome/achievement indicator
 Strand: Number Specific Outcomes It is expected that students will: 1. Determine and explain why a number is divisible by 2, 3, 4, 5, 6, 8, 9 or 10, and why a number cannot be divided by 0. [C, R] 2. Demonstrate
How Measurement Error Affects the Four Ways We Use Data
 Measurement error is generally considered to be a bad thing, and yet there is very little written about how measurement error affects the way we use our measurements. This column will consider these effects
Directions: This is a final exam review which covers all of the topics of the course. Please use this as a guide to assist you in your studies.
 MATH 1113 Precalculus FINAL EXAM REVIEW irections: This is a final exam review which covers all of the topics of the course. Please use this as a guide to assist you in your studies. Question: 1 QI: 758
BHP BILLITON UNIVERSITY OF MELBOURNE SCHOOL MATHEMATICS COMPETITION, 2003: INTERMEDIATE DIVISION
 BHP BILLITON UNIVERSITY OF MELBOURNE SCHOOL MATHEMATICS COMPETITION, 00: INTERMEDIATE DIVISION 1. A fraction processing machine takes a fraction f and produces a new fraction 1 f. If a fraction f = p is
Physics 116A, Section 2, Second Exam A, February 26, Name (Please print)
") Physics 116A, Section 2, Second Exam A, February 26, 2008 Name (Please print) Mulitiple choice questions are worth 3 points each. Mark your answers in the space provided at the right, and on the OPSCAN
Physics 116A, Section 2, Second Exam A, February 26, 2008 Name (Please print) Mulitiple choice questions are worth 3 points each. Mark your answers in the space provided at the right, and on the OPSCAN
Physics 116A, Section 2, Second Exam Version B, February 26, Name (Please print)
") Physics 116A, Section 2, Second Exam Version B, February 26, 2008 Name (Please print) Mulitiple choice questions are worth 3 points each. Mark your answers in the space provided at the right, and on the
Physics 116A, Section 2, Second Exam Version B, February 26, 2008 Name (Please print) Mulitiple choice questions are worth 3 points each. Mark your answers in the space provided at the right, and on the
CONTROL CHARTS FOR THE GENERALIZED POISSON PROCESS WITH UNDER-DISPERSION
 International J. of Math. Sci. & Engg. Appls. (IJMSEA) ISSN 0973-9424, Vol. 10 No. III (December, 2016), pp. 173-181 CONTROL CHARTS FOR THE GENERALIZED POISSON PROCESS WITH UNDER-DISPERSION NARUNCHARA
Zero-Inflated Models in Statistical Process Control
 Chapter 6 Zero-Inflated Models in Statistical Process Control 6.0 Introduction In statistical process control Poisson distribution and binomial distribution play important role. There are situations wherein
Algebra 1 S1 Lesson Summaries. Lesson Goal: Mastery 70% or higher
 Algebra 1 S1 Lesson Summaries For every lesson, you need to: Read through the LESSON REVIEW which is located below or on the last page of the lesson and 3-hole punch into your MATH BINDER. Read and work
MATHEMATICS ( CANDIDATES WITH PRACTICALS/INTERNAL ASSESSMENT ) ( CANDIDATES WITHOUT PRACTICALS/INTERNAL ASSESSMENT )
 ( CANDIDATES WITHOUT PRACTICALS/INTERNAL ASSESSMENT )") Total No. of Printed Pages 6 X/3/M 0 3 MATHEMATICS ( CANDIDATES WITH PRACTICALS/INTERNAL ASSESSMENT ) Full Marks : 80 Pass Marks : 4 ( CANDIDATES WITHOUT PRACTICALS/INTERNAL ASSESSMENT ) Full Marks : 00
Total No. of Printed Pages 6 X/3/M 0 3 MATHEMATICS ( CANDIDATES WITH PRACTICALS/INTERNAL ASSESSMENT ) Full Marks : 80 Pass Marks : 4 ( CANDIDATES WITHOUT PRACTICALS/INTERNAL ASSESSMENT ) Full Marks : 00
A Unified Approach to Uncertainty for Quality Improvement
 A Unified Approach to Uncertainty for Quality Improvement J E Muelaner 1, M Chappell 2, P S Keogh 1 1 Department of Mechanical Engineering, University of Bath, UK 2 MCS, Cam, Gloucester, UK Abstract To
MULTIPLE CHOICE. Choose the one alternative that best completes the statement or answers the question.
 Exam Name MULTIPLE CHOICE. Choose the one alternative that best completes the statement or answers the question. 1) You are standing in a moving bus, facing forward, and you suddenly fall forward as the
CDS-I 2019 Elementary Mathematics (Set-C)
") 1 CDS-I 019 Elementary Mathematics (Set-C) Direction: Consider the following for the next three (03) items : A cube is inscribed in a sphere. A right circular cylinder is within the cube touching all the
1 CDS-I 019 Elementary Mathematics (Set-C) Direction: Consider the following for the next three (03) items : A cube is inscribed in a sphere. A right circular cylinder is within the cube touching all the
Stat 401XV Final Exam Spring 2017
 Stat 40XV Final Exam Spring 07 I have neither given nor received unauthorized assistance on this exam. Name Signed Date Name Printed ATTENTION! Incorrect numerical answers unaccompanied by supporting reasoning
FRACTIONAL REPLICATION
 FRACTIONAL REPLICATION M.L.Agarwal Department of Statistics, University of Delhi, Delhi -. In a factorial experiment, when the number of treatment combinations is very large, it will be beyond the resources
2.830J / 6.780J / ESD.63J Control of Manufacturing Processes (SMA 6303)
") MIT OpenCourseWare http://ocw.mit.edu 2.830J / 6.780J / ESD.63J Control of Processes (SMA 6303) Spring 2008 For information about citing these materials or our Terms of Use, visit: http://ocw.mit.edu/terms.
MIT OpenCourseWare http://ocw.mit.edu 2.830J / 6.780J / ESD.63J Control of Processes (SMA 6303) Spring 2008 For information about citing these materials or our Terms of Use, visit: http://ocw.mit.edu/terms.
2.830J / 6.780J / ESD.63J Control of Manufacturing Processes (SMA 6303) Spring 2008
 Spring 2008") MIT OpenCourseWare http://ocw.mit.edu 2.830J / 6.780J / ESD.63J Control of Manufacturing Processes (SMA 6303) Spring 2008 For information about citing these materials or our Terms of Use, visit: http://ocw.mit.edu/terms.
MIT OpenCourseWare http://ocw.mit.edu 2.830J / 6.780J / ESD.63J Control of Manufacturing Processes (SMA 6303) Spring 2008 For information about citing these materials or our Terms of Use, visit: http://ocw.mit.edu/terms.
PRELIMINARY EXAMINATION Department of Physics University of Florida Part C, January, 2016, 09:00 12:00. Instructions
 Student ID Number: PRELIMINARY EXAMINATION Instructions 1. You may use a calculator and CRC Math tables or equivalent. No other tables or aids are allowed or required. You may NOT use programmable calculators
Geometry: Hutschenreuter Semester II. Select the best answer for each question. Show expected work. MAKE A SUPPORTING SKETCH!
 Geometry: Hutschenreuter Semester II Review B Name Period Date Select the best answer for each question. Show expected work. MAKE A SUPPORTING SKETCH! 1. A parallelogram has a diagonal of 41 cm and side
2014 State Competition Sprint Round Problems 1 30
 2014 State Competition Sprint Round Problems 1 30 HONOR PLEDGE I pledge to uphold the highest principles of honesty and integrity as a Mathlete. I will neither give nor accept unauthorized assistance of
Recall the basic equation connecting period and frequency, developed in Chapter 5 for uniform circular motion:
 Chapter 8: Rotational Kinematics Tuesday, September 17, 2013 10:00 PM Rotational Kinematics We discussed the basics of rotational kinematics in Chapter 5; we complete the story here, including the kinematics
Quality Control & Statistical Process Control (SPC)
") Quality Control & Statistical Process Control (SPC) DR. RON FRICKER PROFESSOR & HEAD, DEPARTMENT OF STATISTICS DATAWORKS CONFERENCE, MARCH 22, 2018 Agenda Some Terminology & Background SPC Methods & Philosophy
Quality Control & Statistical Process Control (SPC) DR. RON FRICKER PROFESSOR & HEAD, DEPARTMENT OF STATISTICS DATAWORKS CONFERENCE, MARCH 22, 2018 Agenda Some Terminology & Background SPC Methods & Philosophy
Math 8 Honors Coordinate Geometry part 1 Unit Updated July 29, 2016
 Reviewing the basics The number line A number line is a visual representation of all real numbers. Each of the images below are examples of number lines. The top left one includes only positive whole numbers,
6. CONFIDENCE INTERVALS. Training is everything cauliflower is nothing but cabbage with a college education.
 CIVL 3103 Approximation and Uncertainty J.W. Hurley, R.W. Meier 6. CONFIDENCE INTERVALS Training is everything cauliflower is nothing but cabbage with a college education. Mark Twain At the beginning of
Factorial designs (Chapter 5 in the book)
") Factorial designs (Chapter 5 in the book) Ex: We are interested in what affects ph in a liquide. ph is the response variable Choose the factors that affect amount of soda air flow... Choose the number
Factorial designs (Chapter 5 in the book) Ex: We are interested in what affects ph in a liquide. ph is the response variable Choose the factors that affect amount of soda air flow... Choose the number
GRE Quantitative Reasoning Practice Questions
 GRE Quantitative Reasoning Practice Questions y O x 7. The figure above shows the graph of the function f in the xy-plane. What is the value of f (f( ))? A B C 0 D E Explanation Note that to find f (f(
CHAPTER 3. THE IMPERFECT CUMULATIVE SCALE
 CHAPTER 3. THE IMPERFECT CUMULATIVE SCALE 3.1 Model Violations If a set of items does not form a perfect Guttman scale but contains a few wrong responses, we do not necessarily need to discard it. A wrong
Techniques for Improving Process and Product Quality in the Wood Products Industry: An Overview of Statistical Process Control
 1 Techniques for Improving Process and Product Quality in the Wood Products Industry: An Overview of Statistical Process Control Scott Leavengood Oregon State University Extension Service The goal: $ 2
Mahopac Central School District Curriculum Introduction to Science 8
 Introduction to Science 8 A. The goal of science is to understand the natural world 1. As you make new observations and test new explanations your view of the natural world may change again and again 2.
MULTIPLE CHOICE. Choose the one alternative that best completes the statement or answers the question.
 Exam Name MULTIPLE CHOICE. Choose the one alternative that best completes the statement or answers the question. 1) Two men, Joel and Jerry, push against a wall. Jerry stops after 10 min, while Joel is
IE 361 Module 25. Introduction to Shewhart Control Charting Part 2 (Statistical Process Control, or More Helpfully: Statistical Process Monitoring)
") IE 361 Module 25 Introduction to Shewhart Control Charting Part 2 (Statistical Process Control, or More Helpfully: Statistical Process Monitoring) Reading: Section 3.1 Statistical Methods for Quality Assurance
IE 361 Module 25 Introduction to Shewhart Control Charting Part 2 (Statistical Process Control, or More Helpfully: Statistical Process Monitoring) Reading: Section 3.1 Statistical Methods for Quality Assurance
MULTIPLE CHOICE. Choose the one alternative that best completes the statement or answers the question.
 Exam Name MULTIPLE CHOICE. Choose the one alternative that best completes the statement or answers the question. Use the appropriate identity to find the indicated function value. Rationalize the denominator,
Reference: Chapter 7 of Devore (8e)
") Reference: Chapter 7 of Devore (8e) CONFIDENCE INTERVAL ESTIMATORS Maghsoodloo An interval estimator of a population parameter is of the form L < < u at a confidence Pr (or a confidence coefficient) of
Reference: Chapter 7 of Devore (8e) CONFIDENCE INTERVAL ESTIMATORS Maghsoodloo An interval estimator of a population parameter is of the form L < < u at a confidence Pr (or a confidence coefficient) of
Date: Pd: Unit 4. GSE H Analytic Geometry EOC Review Name: Units Rewrite ( 12 3) 2 in simplest form. 2. Simplify
 2 in simplest form. 2. Simplify") GSE H Analytic Geometry EOC Review Name: Units 4 7 Date: Pd: Unit 4 1. Rewrite ( 12 3) 2 in simplest form. 2. Simplify 18 25 3. Which expression is equivalent to 32 8? a) 2 2 27 4. Which expression is
GSE H Analytic Geometry EOC Review Name: Units 4 7 Date: Pd: Unit 4 1. Rewrite ( 12 3) 2 in simplest form. 2. Simplify 18 25 3. Which expression is equivalent to 32 8? a) 2 2 27 4. Which expression is
PHY2F (JAN08PHY2F01) General Certifi cate of Secondary Education January ADDITIONAL SCIENCE Unit Physics P2. PHYSICS Unit Physics P2
 General Certifi cate of Secondary Education January ADDITIONAL SCIENCE Unit Physics P2. PHYSICS Unit Physics P2") Surname Other Names For Examiner s Use Centre Number Candidate Number Candidate Signature General Certifi cate of Secondary Education January 2008 ADDITIONAL SCIENCE Unit Physics P2 PHYSICS Unit Physics
Surname Other Names For Examiner s Use Centre Number Candidate Number Candidate Signature General Certifi cate of Secondary Education January 2008 ADDITIONAL SCIENCE Unit Physics P2 PHYSICS Unit Physics
Level 2 Exam Key. Donald and Helen Schort School of Mathematics and Computing Sciences. High School Math Contest
 017 High School Math Contest Level Exam Key Lenoir-Rhyne University Donald and Helen Schort School of Mathematics and Computing Sciences This exam has been prepared by the following faculty from Western
Area and Volume 1. Circumference and Area of a Circle. Area of a Trapezium. and Measures. Geometry. Key Point. Key Point.
 Geometry and Measures Area and Volume 1 You must be able to: Recall and use the formulae for the circumference and area of a circle Recall and use the formula for the area of a trapezium Recall and use
Real-World Problems: Circles
 11.3 Real-World Problems: Circles Lesson Objectives Solve real-world problems involving area and circumference of circles. Solve real-world problems involving semicircles, quadrants, and composite figures.
Given that m A = 50 and m B = 100, what is m Z? A. 15 B. 25 C. 30 D. 50
 UNIT : SIMILARITY, CONGRUENCE AND PROOFS ) Figure A'B'C'D'F' is a dilation of figure ABCDF by a scale factor of. The dilation is centered at ( 4, ). ) Which transformation results in a figure that is similar
Fractional Replication of The 2 k Design
 Fractional Replication of The 2 k Design Experiments with many factors involve a large number of possible treatments, even when all factors are used at only two levels. Often the available resources are
Mathematics 8 Review 1 Square Roots. Practice: When a number is multiplied by itself, you square the number. The product is a perfect square.
 Mathematics 8 Review 1 Square Roots When a number is multiplied by itself, you square the number. The product is a perfect square. For example: The square of 5 is 5 5 25 We write: 5 2 5 5 25 We say: Five
EXAMINATIONS OF THE ROYAL STATISTICAL SOCIETY
 EXAMINATIONS OF THE ROYAL STATISTICAL SOCIETY HIGHER CERTIFICATE IN STATISTICS, 2011 MODULE 6 : Further applications of statistics Time allowed: One and a half hours Candidates should answer THREE questions.
Assignment 7 (Solution) Control Charts, Process capability and QFD
 Control Charts, Process capability and QFD") Assignment 7 (Solution) Control Charts, Process capability and QFD Dr. Jitesh J. Thakkar Department of Industrial and Systems Engineering Indian Institute of Technology Kharagpur Instruction Total No.
Assignment 7 (Solution) Control Charts, Process capability and QFD Dr. Jitesh J. Thakkar Department of Industrial and Systems Engineering Indian Institute of Technology Kharagpur Instruction Total No.
There are two main types of friction:
 Section 4.15: Friction Friction is needed to move. Without friction, a car would sit in one spot spinning its tires, and a person would not be able to step forward. However, the motion of an object along
INSTALLING TRAK SPORT TIRE CHAINS ON 20 MODEL 3 TIRES
 INSTALLING TRAK SPORT TIRE CHAINS ON 20 MODEL 3 TIRES 2018 TESLA, INC. All rights reserved. All information in this document and all MODEL 3 software is subject to copyright and other intellectual property
 Cambridge International Examinations Cambridge International Advanced Level FURTHER MATHEMATICS 9231/23 Paper 2 October/November 2014 3 hours *8248777190* Additional Materials: Answer Booklet/Paper Graph
Unless otherwise specified, use g = 9.80 m/s2
 Phy 111 Exam 2 March 10, 2015 Name Section University ID Please fill in your computer answer sheet as follows: 1) In the NAME grid, fill in your last name, leave one blank space, then your first name.
OHS Algebra 1 Summer Packet
 OHS Algebra 1 Summer Packet Good Luck to: Date Started: (please print student name here) 8 th Grade Math Teacher s Name: Complete each of the following exercises in this formative assessment. To receive
Rotational Motion Test
 Rotational Motion Test Multiple Choice: Write the letter that best answers the question. Each question is worth 2pts. 1. Angular momentum is: A.) The sum of moment of inertia and angular velocity B.) The
Open book and notes. 120 minutes. Covers Chapters 8 through 14 of Montgomery and Runger (fourth edition).
.") IE 330 Seat # Open book and notes 10 minutes Covers Chapters 8 through 14 of Montgomery and Runger (fourth edition) Cover page and eight pages of exam No calculator ( points) I have, or will, complete
IE 330 Seat # Open book and notes 10 minutes Covers Chapters 8 through 14 of Montgomery and Runger (fourth edition) Cover page and eight pages of exam No calculator ( points) I have, or will, complete
Friction. Objectives. Assessment. Assessment. Physics terms. Equations 5/20/14. Models for friction
 Objectives Friction Calculate friction forces from equation models for static, kinetic, and rolling friction. Solve one-dimensional force problems that include friction. 1. A box with a mass of 10 kg is
PUTNAM TRAINING PROBLEMS
 PUTNAM TRAINING PROBLEMS (Last updated: December 3, 2003) Remark This is a list of Math problems for the NU Putnam team to be discussed during the training sessions Miguel A Lerma 1 Bag of candies In a
spc Statistical process control Key Quality characteristic :Forecast Error for demand
 spc Statistical process control Key Quality characteristic :Forecast Error for demand BENEFITS of SPC Monitors and provides feedback for keeping processes in control. Triggers when a problem occurs Differentiates
2018 LEHIGH UNIVERSITY HIGH SCHOOL MATH CONTEST
 08 LEHIGH UNIVERSITY HIGH SCHOOL MATH CONTEST. A right triangle has hypotenuse 9 and one leg. What is the length of the other leg?. Don is /3 of the way through his run. After running another / mile, he
Sample Problems for the Final Exam
 Sample Problems for the Final Exam 1. Hydraulic landing assemblies coming from an aircraft rework facility are each inspected for defects. Historical records indicate that 8% have defects in shafts only,
Math 8 Performance Test
 Name: Class: Date: Math 8 Performance Test Multiple Choice Identify the choice that best completes the statement or answers the question. 1) Which of the following is an irrational number? 300 a. 5 c.
SMAM 314 Practice Final Examination Winter 2003
 SMAM 314 Practice Final Examination Winter 2003 You may use your textbook, one page of notes and a calculator. Please hand in the notes with your exam. 1. Mark the following statements True T or False
MATHCOUNTS State Competition Sprint Round Problems 1 30
 MATHCOUNTS 2013 State Competition Sprint Round Problems 1 30 HONOR PLEDGE I pledge to uphold the highest principles of honesty and integrity as a Mathlete. I will neither give nor accept unauthorized assistance
Unit 6: Forces II PRACTICE PROBLEMS
 Regents Physics Mrs. Long Unit 6: Forces II PRACTICE PROBLEMS Essential Understanding for the Unit: The net force can be determined by using force diagrams in order to show all forces acting, and thereby
University of Houston High School Mathematics Contest Geometry Exam Spring 2015
 University of Houston High School Mathematics Contest Geometry Exam Spring 2015 Note that diagrams may not be drawn to scale. 1. A pool has a 4 foot wide sidewalk around it. If the pool is 28 feet long
8 th Grade Exam Scoring Format: 3 points per correct response -1 each wrong response 0 for blank answers
 Pellissippi State Middle School Mathematics Competition 8 th Grade Exam Scoring Format: 3 points per correct response -1 each wrong response 0 for blank answers Directions: For each multiple-choice problem
Statistical Process Control
 Chapter 3 Statistical Process Control 3.1 Introduction Operations managers are responsible for developing and maintaining the production processes that deliver quality products and services. Once the production
Physics 53 Summer Exam I. Solutions
 Exam I Solutions In questions or problems not requiring numerical answers, express the answers in terms of the symbols for the quantities given, and standard constants such as g. In numerical questions
Final Exam - Spring
 EM121 Final Exam - Spring 2011-2012 Name : Section Number : Record all your answers to the multiple choice problems (1-15) by filling in the appropriate circle. All multiple choice answers will be graded
Selection of Variable Selecting the right variable for a control chart means understanding the difference between discrete and continuous data.
 Statistical Process Control, or SPC, is a collection of tools that allow a Quality Engineer to ensure that their process is in control, using statistics. Benefit of SPC The primary benefit of a control