Computational and Monte-Carlo Aspects of Systems for Monitoring Reliability Data. Emmanuel Yashchin IBM Research, Yorktown Heights, NY
|
|
|
- Lily Floyd
- 6 years ago
- Views:
Transcription

1 Computational and Monte-Carlo Aspects of Systems for Monitoring Reliability Data Emmanuel Yashchin IBM Research, Yorktown Heights, NY COMPSTAT 2010, Paris, 2010
2 Outline Motivation Time-managed lifetime data Key issues in the design of a monitoring system Design of monitoring schemes Dynamically Changing Observations (DCO) Failure rate monitoring Wearout monitoring Computational and Monte Carlo Issues Conclusions

 Potential for early")
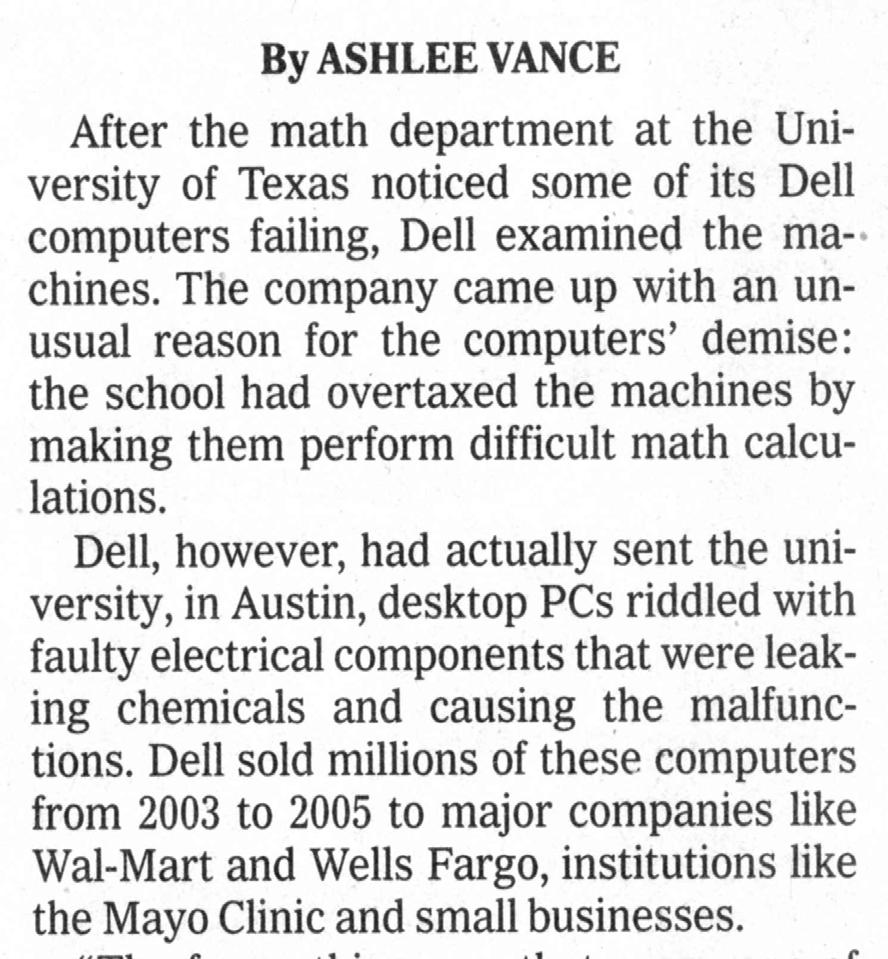
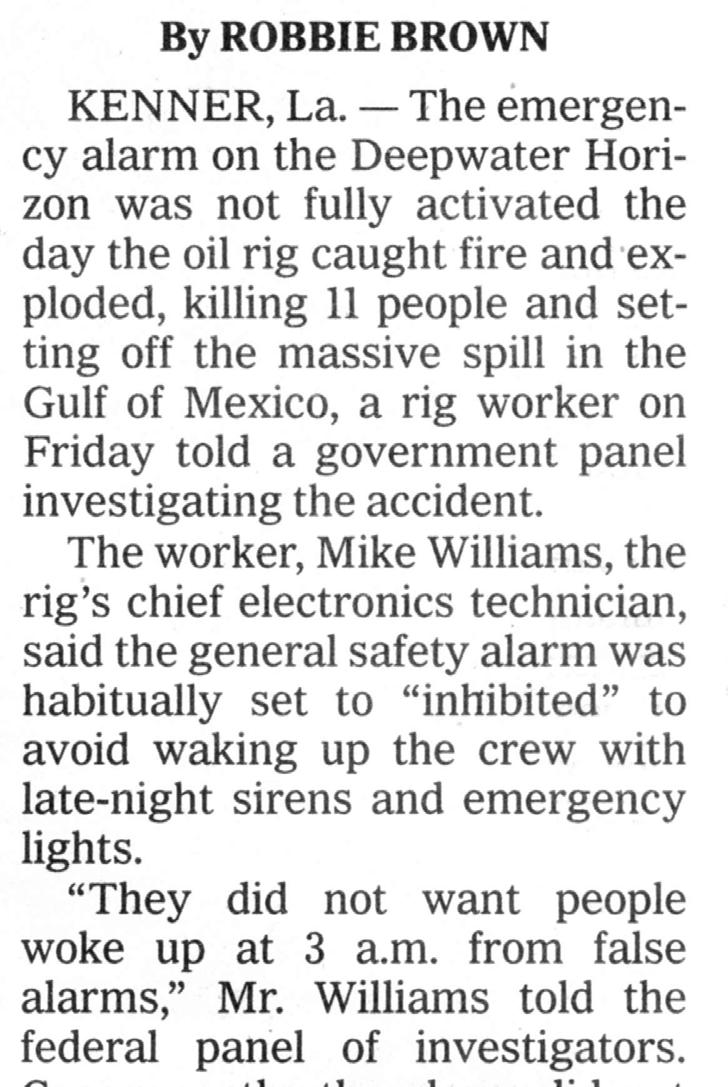
3 Reliability degradation of PC s caused by faulty capacitors Bulging capacitors Venting capacitor (top view) Root cause: Temperature driven chemical reaction (unexpected failure mode) Potential for early detection: High
4
5 Introduction Typical monitoring application: static observations Motivation: analysis of warranty data Early detection: key opportunity Time-managed data Early Detection Tool (EDT) for Warranty Data
 Early Detection Tool (EDT) Product Entitlement Warehouse (PEW) Dashboard")
6 Field EDT Scheme Warranty Fails Repair Station Machine Type (MT) 6347 Warranty Repair Data Hard Drive Keyboard... Planar Field Replacement Units (FRU s) Early Detection Tool (EDT) Product Entitlement Warehouse (PEW) Dashboard
7 Sorting schemes Analyses to be run based on sorting with respect to potential root cause Sorting by vintage: - Product ship - Component ship - Calendar time
8 Sorting schemes Component Machine

9 Early Detection Tool (EDT) for Warranty Data A system for detecting unfavorable changes in reliability of components. Multi-layer Dashboard:
10 Nested (2-nd level) display:
11 Typical questions: Is the process of failures on target? If not, is the problem related to vendor s process? Assembly/Configuration process? Customer? single Geo? individual machine type? family of machine types? individual Field Replacement Unit (FRU)? family of FRU s? individual lot? sequence of lots? stable process, but at unacceptably high replacement rate? early fails? increasing failure rate (wearout)? What is the current state of the process?
12 Key Design Issues 1. Data a. Multi-purpose, multi-stream b. Quality / Integrity c. Time managed, DCO 2. Alarms a. False alarms vs. Sensitivity b. Believable and operationally (not statistically) significant c. Prioritization (severity, recentness, etc.) d. User control over the volume of alarms received e. Target setting 3. Modern statistical monitoring methodology a. Reduce the Mean Time to Detection (MTTD) of unfavorable conditions b. Detect various types of changes (shifts, drifts, etc.) c. Detect intermittent problems d. Schemes designed using minimal level of user input
13 Key Design Issues (Cont) 4. Post-alarm activity a. Facilitate diagnostics (incl. graphical analysis) b. Filtering c. Regime / Changepoint identification d. Actions 5. User interface a. Multi-layer dashboards b. Reverse play c. Push / Pull / On-demand d. Communicate to users in a human language 6. Administration a. Ease of use b. Training


14
15 General data structure: sequence of life tests E.g., current point in time: Aug 2, Current point affects data for all vintages, leading to dynamically changing statistics Vintage Sample Lifetimes x x X t x x X x X x x X x X X x individually right-censored lifetimes X globally right-censored
16 Control charts with dynamically changing observations (DCO): Usual control charts: Points observed earlier remain unchanged Time = t Time = t + 1 DCO charts: Points observed earlier could change Time = t Time = t + 1
17 Basic approach Sort data in accordance with vintages of interest Establish target curves for hazard rates. Transform time scale if necessary Characterize lifetime (possibly on transformed time scale) parametrically, e.g., Weibull For every parameter (say, λ), establish sequence of statistics {X i, i = 1, 2, } to serve as a basis of monitoring scheme; (e.g., assume λ = E(X i )) Obtain weights {w i, i = 1, 2, } associated with {X i } Establish acceptable & unacceptable regions λ 0 < λ 1 Establish acceptable rate of false alarms Apply scheme to every relevant data set; flag this data set if out-of-control conditions are present
18 Main test: Repeated Page s scheme Suppose that at time T we have data for N vintages Define the set {S i, i = 1, 2,, N} as follows: S = 0, S = max[0, γ S + w( X k)], 0 i i 1 i i where k ( λ + λ )/2, γ [0.7,1] 1 0 Define S = max [S 1, S 2,, S N ]; Flag the data set at time T if S > h, where h is chosen via: Prob{ S > h N, λ = λ 0 } = 1 α 0 (e.g. = 0.99) Note: Average Run Length (ARL) is not used here!
19 Example1: Failure rate monitoring of a PC component Monitoring Replacement Rate λ = E(X i ) Data view of Oct OBS DATES WMONTHS WFAILS RATES
20
21 Data view of Nov OBS DATES WMONTHS WFAILS RATES
22 Now we have enough evidence to flag the condition:
23 Wearout Monitoring Define Wearout Parameter: E.g. use shape parameter c of Weibull lifetime distribution Establish acceptable/unacceptable levels: c 0 < c 1 Establish Data Summarization Policy: E.g. consolidate data monthly Define the set {S iw, i = 1, 2,, M } as follows: S = 0, S = max[0, γ S + w ( Cˆ k )], 0w iw w i 1, w iw i w where k ( c + c )/2, w 0 1 wiw = number of failures in vintage i Cˆ = Bias - corrected estimate of c based on month i i Define S w = max [S 1w, S 2w,, S Mw ]; Flag the data set at time T if S w > h w, where h w is chosen from: Prob{ S w > h w M, c = c 0 } = 1 α 0 (e.g. = 0.99)
24 Example2: Joint Monitoring of Replacement Rate & Wearout xxx xxxx
25 Some issues Issue#1: for a wide enough window of vintages, the signal level h may get too high to provide desired level of sensitivity with respect to recent events To address: - enforce sufficient separation between acceptable & unacceptable levels, e.g. for λ = E(X i ) require λ 1 / λ 0 > introduce supplemental tests. For example, define active component = component for which shipment record(s) are present within the last L days (L = active range). For such components use supplemental tests: Test1 (based on last value of scheme): Flag the data set if S N > h 1, Test2 (based on failures within the active range): Flag if X (L) > h 2, where X (L) = number of failures within active range Issue#2: unfavorable changes in some parameters can show up on the wrong chart To address: - use special diagnostic procedures - select different quantities to monitor (may affect interpretability) - monitor model adequacy
26 Computational & Monte Carlo Issues 1. Establish on the fly the thresholds for the tests, e.g., solve for h Prob{ S > h N, λ = λ 0 } = 1 α 0 where S = max [S 1, S 2,, S N ]; (a) use parallel (vector) computations taking into account recursive nature of the process S 1, S 2,, S N (b) since the sequence of observed weights {w i } is ancillary for λ, condition on them (c) use simulated replications of S 1, S 2,, S N, observe the set of maxima (d) use asymptotic result (requires existence of first to moments of X i ) Prob{ S > h N, λ = λ 0 } ~ A exp [ - a h], h Scale: 100,000 data sets examined per week
27 Computational & Monte Carlo Issues (cont) 2. For active components, establish on the fly the thresholds for the main and supplemental tests, i.e., find suitable h, h 1, h 2 Prob{ S > h or S N > h 1 or X (L) > h 2 N, λ = λ 0 } = 1 α 0 where S N, X (L) = Supplemental statistics 1, 2 (a) involves policy for type-1 error allocation among tests (b) use parallel simulation (conditioned on weights {w i }) (c) use asymptotic results for S and for S N: Prob{ S N > h N, λ = λ 0 } ~ A 1 exp [ -a 1 h], h
28 Computational & Monte Carlo Issues (cont) 3. Establish index of severity, so that flagged data sets could be ranked based on their newsworthiness Severity = combination of p-values (p 1,p 2,p 3 ) of the main and supplemental tests. E.g. Severity = 1 min{p 1,p 2,p 3 } Estimated via re-sampling techniques 4. Thresholds and severities for wearout index and for Weibull scale parameter 5. Predictions (e.g. of overall fallout) and related bounds 6. Estimation of filtered parameter values and confidence bounds 7. Regimes and change-points
29 Discussion Monitoring reliability characteristics in the presence of dynamically changing observations requires non-standard performance criteria and control schemes (e.g., repeated Weighted Cusum- Shewhart). Design and implementation of these schemes involves extensive use of MC methods. Practical applications are usually associated with a battery of tests (even for a single parameter), as several aspects of detection process need to be taken into account. Of special importance: failure rate and wearout characteristics Generalized approach: in terms of likelihood ratios System based on this approach deployed and proven useful in practice
Regenerative Likelihood Ratio control schemes
 Regenerative Likelihood Ratio control schemes Emmanuel Yashchin IBM Research, Yorktown Heights, NY XIth Intl. Workshop on Intelligent Statistical Quality Control 2013, Sydney, Australia Outline Motivation
Optimal Cusum Control Chart for Censored Reliability Data with Log-logistic Distribution
 CMST 21(4) 221-227 (2015) DOI:10.12921/cmst.2015.21.04.006 Optimal Cusum Control Chart for Censored Reliability Data with Log-logistic Distribution B. Sadeghpour Gildeh, M. Taghizadeh Ashkavaey Department
Contents. Preface to Second Edition Preface to First Edition Abbreviations PART I PRINCIPLES OF STATISTICAL THINKING AND ANALYSIS 1
 Contents Preface to Second Edition Preface to First Edition Abbreviations xv xvii xix PART I PRINCIPLES OF STATISTICAL THINKING AND ANALYSIS 1 1 The Role of Statistical Methods in Modern Industry and Services
Abstract. 1. Introduction
 Abstract Repairable system reliability: recent developments in CBM optimization A.K.S. Jardine, D. Banjevic, N. Montgomery, A. Pak Department of Mechanical and Industrial Engineering, University of Toronto,
Reliability Education Opportunity: Reliability Analysis of Field Data
 Reliability Education Opportunity: Reliability Analysis of Field Data Vasiliy Krivtsov, PhD Sr. Staff Technical Specialist Reliability & Risk Analysis Ford Motor Company 25th Anniversary of Reliability
CHAPTER 10 RELIABILITY
 CHAPTER 10 RELIABILITY Failure rates Reliability Constant failure rate and exponential distribution System Reliability Components in series Components in parallel Combination system 1 Failure Rate Curve
3.6 NCEP s Global Icing Ensemble Prediction and Evaluation
 1 3.6 NCEP s Global Icing Ensemble Prediction and Evaluation Binbin Zhou 1,2, Yali Mao 1,2, Hui-ya Chuang 2 and Yuejian Zhu 2 1. I.M. System Group, Inc. 2. EMC/NCEP AMS 18th Conference on Aviation, Range,
Sequential Detection. Changes: an overview. George V. Moustakides
 Sequential Detection of Changes: an overview George V. Moustakides Outline Sequential hypothesis testing and Sequential detection of changes The Sequential Probability Ratio Test (SPRT) for optimum hypothesis
CS 160: Lecture 16. Quantitative Studies. Outline. Random variables and trials. Random variables. Qualitative vs. Quantitative Studies
 Qualitative vs. Quantitative Studies CS 160: Lecture 16 Professor John Canny Qualitative: What we ve been doing so far: * Contextual Inquiry: trying to understand user s tasks and their conceptual model.
STAT 6350 Analysis of Lifetime Data. Probability Plotting
 STAT 6350 Analysis of Lifetime Data Probability Plotting Purpose of Probability Plots Probability plots are an important tool for analyzing data and have been particular popular in the analysis of life
Demand Forecasting. for. Microsoft Dynamics 365 for Operations. User Guide. Release 7.1. April 2018
 Demand Forecasting for Microsoft Dynamics 365 for Operations User Guide Release 7.1 April 2018 2018 Farsight Solutions Limited All Rights Reserved. Portions copyright Business Forecast Systems, Inc. This
Introduction to Reliability Theory (part 2)
") Introduction to Reliability Theory (part 2) Frank Coolen UTOPIAE Training School II, Durham University 3 July 2018 (UTOPIAE) Introduction to Reliability Theory 1 / 21 Outline Statistical issues Software
Introduction to Reliability Theory (part 2) Frank Coolen UTOPIAE Training School II, Durham University 3 July 2018 (UTOPIAE) Introduction to Reliability Theory 1 / 21 Outline Statistical issues Software
M.Sc. (Final) DEGREE EXAMINATION, MAY Final Year. Statistics. Paper I STATISTICAL QUALITY CONTROL. Answer any FIVE questions.
 DEGREE EXAMINATION, MAY Final Year. Statistics. Paper I STATISTICAL QUALITY CONTROL. Answer any FIVE questions.") (DMSTT ) M.Sc. (Final) DEGREE EXAMINATION, MAY 0. Final Year Statistics Paper I STATISTICAL QUALITY CONTROL Time : Three hours Maximum : 00 marks Answer any FIVE questions. All questions carry equal marks..
(DMSTT ) M.Sc. (Final) DEGREE EXAMINATION, MAY 0. Final Year Statistics Paper I STATISTICAL QUALITY CONTROL Time : Three hours Maximum : 00 marks Answer any FIVE questions. All questions carry equal marks..
Calendarization & Normalization. Steve Heinz, PE, CEM, CMVP Founder & CEO EnergyCAP, Inc.
 Calendarization & Normalization Steve Heinz, PE, CEM, CMVP Founder & CEO EnergyCAP, Inc. Calendarization EnergyCAP Reporting Month Each utility bill is assigned to a reporting month when entered, called
Target Tracking and Classification using Collaborative Sensor Networks
 Target Tracking and Classification using Collaborative Sensor Networks Xiaodong Wang Department of Electrical Engineering Columbia University p.1/3 Talk Outline Background on distributed wireless sensor
Evaluating the value of structural heath monitoring with longitudinal performance indicators and hazard functions using Bayesian dynamic predictions
 Evaluating the value of structural heath monitoring with longitudinal performance indicators and hazard functions using Bayesian dynamic predictions C. Xing, R. Caspeele, L. Taerwe Ghent University, Department
EARLY DEPLOYMENT DATA RETRIEVAL 10-6 ESTIMATES Maximum Likelihood 6-1 Point 6-1
 INDEX ACCEPTANCE CRITERIA 8-4, 8-10 AGE DEPENDENT ANALYSIS (Fixed Configuration) 7-1, 10-3 Supporting Data Base 10-3, 10-10 AUTOMATIC TEST EQUIPMENT (ATE)(see Diagnostic Systems, Automatic) AVAILABILITY
Using the Empirical Probability Integral Transformation to Construct a Nonparametric CUSUM Algorithm
 Using the Empirical Probability Integral Transformation to Construct a Nonparametric CUSUM Algorithm Daniel R. Jeske University of California, Riverside Department of Statistics Joint work with V. Montes
Monthly probabilistic drought forecasting using the ECMWF Ensemble system
 Monthly probabilistic drought forecasting using the ECMWF Ensemble system Christophe Lavaysse(1) J. Vogt(1), F. Pappenberger(2) and P. Barbosa(1) (1) European Commission (JRC-IES), Ispra Italy (2) ECMWF,
Multistate Modeling and Applications
 Multistate Modeling and Applications Yang Yang Department of Statistics University of Michigan, Ann Arbor IBM Research Graduate Student Workshop: Statistics for a Smarter Planet Yang Yang (UM, Ann Arbor)
Verification and performance measures of Meteorological Services to Air Traffic Management (MSTA)
") Verification and performance measures of Meteorological Services to Air Traffic Management (MSTA) Background Information on the accuracy, reliability and relevance of products is provided in terms of verification
Verification and performance measures of Meteorological Services to Air Traffic Management (MSTA) Background Information on the accuracy, reliability and relevance of products is provided in terms of verification
Advanced Forecast. For MAX TM. Users Manual
 Advanced Forecast For MAX TM Users Manual www.maxtoolkit.com Revised: June 24, 2014 Contents Purpose:... 3 Installation... 3 Requirements:... 3 Installer:... 3 Setup: spreadsheet... 4 Setup: External Forecast
Module 7-2 Decomposition Approach
 Module 7-2 Decomposition Approach Chanan Singh Texas A&M University Decomposition Approach l Now we will describe a method of decomposing the state space into subsets for the purpose of calculating the
I I FINAL, 01 Jun 8.4 to 31 May TITLE AND SUBTITLE 5 * _- N, '. ', -;
 R AD-A237 850 E........ I N 11111IIIII U 1 1I!til II II... 1. AGENCY USE ONLY Leave 'VanK) I2. REPORT DATE 3 REPORT TYPE AND " - - I I FINAL, 01 Jun 8.4 to 31 May 88 4. TITLE AND SUBTITLE 5 * _- N, '.
Estimation of Quantiles
 9 Estimation of Quantiles The notion of quantiles was introduced in Section 3.2: recall that a quantile x α for an r.v. X is a constant such that P(X x α )=1 α. (9.1) In this chapter we examine quantiles
Bayesian Reliability Analysis: Statistical Challenges from Science-Based Stockpile Stewardship
 : Statistical Challenges from Science-Based Stockpile Stewardship Alyson G. Wilson, Ph.D. agw@lanl.gov Statistical Sciences Group Los Alamos National Laboratory May 22, 28 Acknowledgments Christine Anderson-Cook
Fleet Maintenance Simulation With Insufficient Data
 Fleet Maintenance Simulation With Insufficient Data Zissimos P. Mourelatos Mechanical Engineering Department Oakland University mourelat@oakland.edu Ground Robotics Reliability Center (GRRC) Seminar 17
Multivariate Process Control Chart for Controlling the False Discovery Rate
 Industrial Engineering & Management Systems Vol, No 4, December 0, pp.385-389 ISSN 598-748 EISSN 34-6473 http://dx.doi.org/0.73/iems.0..4.385 0 KIIE Multivariate Process Control Chart for Controlling e
Practice Problems Section Problems
 Practice Problems Section 4-4-3 4-4 4-5 4-6 4-7 4-8 4-10 Supplemental Problems 4-1 to 4-9 4-13, 14, 15, 17, 19, 0 4-3, 34, 36, 38 4-47, 49, 5, 54, 55 4-59, 60, 63 4-66, 68, 69, 70, 74 4-79, 81, 84 4-85,
The Relationship Between Confidence Intervals for Failure Probabilities and Life Time Quantiles
 Statistics Preprints Statistics 2008 The Relationship Between Confidence Intervals for Failure Probabilities and Life Time Quantiles Yili Hong Iowa State University, yili_hong@hotmail.com William Q. Meeker
Quality Control Using Inferential Statistics In Weibull Based Reliability Analyses S. F. Duffy 1 and A. Parikh 2
 Quality Control Using Inferential Statistics In Weibull Based Reliability Analyses S. F. Duffy 1 and A. Parikh 2 1 Cleveland State University 2 N & R Engineering www.inl.gov ASTM Symposium on Graphite
Introduction to Engineering Reliability
 Introduction to Engineering Reliability Robert C. Patev North Atlantic Division Regional Technical Specialist (978) 318-8394 Topics Reliability Basic Principles of Reliability Analysis Non-Probabilistic
Monte Carlo Simulations and PcNaive
 Econometrics 2 Fall 2005 Monte Carlo Simulations and Pcaive Heino Bohn ielsen 1of21 Monte Carlo Simulations MC simulations were introduced in Econometrics 1. Formalizing the thought experiment underlying
Forecasting Workbench in PRMS TM. Master Production Schedule. Material Requirements Plan. Work Order/ FPO Maintenance. Soft Bill Maintenance
 Forecasting Workbench in PRMS TM SHOP FLOOR CONTROL Work Order/ FPO Maintenance Auto Allocation to Lots Pick Slip Print Master Production Schedule Material Requirements Plan Soft Bill Maintenance Stage
Process Behavior Analysis Understanding Variation
 Process Behavior Analysis Understanding Variation Steven J Mazzuca ASQ 2015-11-11 Why Process Behavior Analysis? Every day we waste valuable resources because we misunderstand or misinterpret what our
INVERTED KUMARASWAMY DISTRIBUTION: PROPERTIES AND ESTIMATION
 Pak. J. Statist. 2017 Vol. 33(1), 37-61 INVERTED KUMARASWAMY DISTRIBUTION: PROPERTIES AND ESTIMATION A. M. Abd AL-Fattah, A.A. EL-Helbawy G.R. AL-Dayian Statistics Department, Faculty of Commerce, AL-Azhar
ELE 491 Senior Design Project Proposal
 ELE 491 Senior Design Project Proposal These slides are loosely based on the book Design for Electrical and Computer Engineers by Ford and Coulston. I have used the sources referenced in the book freely
Outage Coordination and Business Practices
 Outage Coordination and Business Practices 1 2007 Objectives What drove the need for developing a planning/coordination process. Why outage planning/coordination is crucial and important. Determining what
2.830J / 6.780J / ESD.63J Control of Manufacturing Processes (SMA 6303) Spring 2008
 Spring 2008") MIT OpenCourseWare http://ocw.mit.edu 2.830J / 6.780J / ESD.63J Control of Processes (SMA 6303) Spring 2008 For information about citing these materials or our Terms of Use, visit: http://ocw.mit.edu/term
MIT OpenCourseWare http://ocw.mit.edu 2.830J / 6.780J / ESD.63J Control of Processes (SMA 6303) Spring 2008 For information about citing these materials or our Terms of Use, visit: http://ocw.mit.edu/term
Modelling trends in the ocean wave climate for dimensioning of ships
 Modelling trends in the ocean wave climate for dimensioning of ships STK1100 lecture, University of Oslo Erik Vanem Motivation and background 2 Ocean waves and maritime safety Ships and other marine structures
Checking the Reliability of Reliability Models.
 Checking the Reliability of Reliability. INFORMS 007 Puerto Rico. July 8-11. Víctor Aguirre Torres Stat Department Instituto Tecnológico Autónomo de México ITAM Credits. Partially Sponsored by Asociación
Winter Season Resource Adequacy Analysis Status Report
 Winter Season Resource Adequacy Analysis Status Report Tom Falin Director Resource Adequacy Planning Markets & Reliability Committee October 26, 2017 Winter Risk Winter Season Resource Adequacy and Capacity
Data: Singly right censored observations from a temperatureaccelerated
 Chapter 19 Analyzing Accelerated Life Test Data William Q Meeker and Luis A Escobar Iowa State University and Louisiana State University Copyright 1998-2008 W Q Meeker and L A Escobar Based on the authors
IE 303 Discrete-Event Simulation L E C T U R E 6 : R A N D O M N U M B E R G E N E R A T I O N
 IE 303 Discrete-Event Simulation L E C T U R E 6 : R A N D O M N U M B E R G E N E R A T I O N Review of the Last Lecture Continuous Distributions Uniform distributions Exponential distributions and memoryless
10 Introduction to Reliability
 0 Introduction to Reliability 10 Introduction to Reliability The following notes are based on Volume 6: How to Analyze Reliability Data, by Wayne Nelson (1993), ASQC Press. When considering the reliability
Checking the Reliability of Reliability Models.
 Checking the Reliability of Reliability Models. Seminario de Estadística, CIMAT Abril 3, 007. Víctor Aguirre Torres Departmento de Estadística, ITAM Área de Probabilidad y Estadística, CIMAT Credits. Partially
E cient Monte Carlo for Gaussian Fields and Processes
 E cient Monte Carlo for Gaussian Fields and Processes Jose Blanchet (with R. Adler, J. C. Liu, and C. Li) Columbia University Nov, 2010 Jose Blanchet (Columbia) Monte Carlo for Gaussian Fields Nov, 2010
Statistical Prediction Based on Censored Life Data. Luis A. Escobar Department of Experimental Statistics Louisiana State University.
 Statistical Prediction Based on Censored Life Data Overview Luis A. Escobar Department of Experimental Statistics Louisiana State University and William Q. Meeker Department of Statistics Iowa State University
Reliability of Technical Systems
 Main Topics 1. Introduction, Key Terms, Framing the Problem 2. Reliability Parameters: Failure Rate, Failure Probability, etc. 3. Some Important Reliability Distributions 4. Component Reliability 5. Software
Use of extended range and seasonal forecasts at MeteoSwiss
 Federal Department of Home Affairs FDHA Federal Office of Meteorology and Climatology MeteoSwiss Use of extended range and seasonal forecasts at MeteoSwiss Current use and ongoing developments Christoph
Airport Meteorology Analysis
 Airport Meteorology Analysis Alex Alshtein Kurt Etterer October 2014 Presented at ICAO Business Class 2014 ICAO, Montreal, Canada Approved for Public Release: 14-3466. Distribution Unlimited. October 2014
A Step Towards the Cognitive Radar: Target Detection under Nonstationary Clutter
 A Step Towards the Cognitive Radar: Target Detection under Nonstationary Clutter Murat Akcakaya Department of Electrical and Computer Engineering University of Pittsburgh Email: akcakaya@pitt.edu Satyabrata
Fundamentals of Reliability Engineering and Applications
 Fundamentals of Reliability Engineering and Applications E. A. Elsayed elsayed@rci.rutgers.edu Rutgers University Quality Control & Reliability Engineering (QCRE) IIE February 21, 2012 1 Outline Part 1.
A Control Chart for Time Truncated Life Tests Using Exponentiated Half Logistic Distribution
 Appl. Math. Inf. Sci. 12, No. 1, 125-131 (2018 125 Applied Mathematics & Information Sciences An International Journal http://dx.doi.org/10.18576/amis/120111 A Control Chart for Time Truncated Life Tests
Surveillance of BiometricsAssumptions
 Surveillance of BiometricsAssumptions in Insured Populations Journée des Chaires, ILB 2017 N. El Karoui, S. Loisel, Y. Sahli UPMC-Paris 6/LPMA/ISFA-Lyon 1 with the financial support of ANR LoLitA, and
The SAB Medium Term Sales Forecasting System : From Data to Planning Information. Kenneth Carden SAB : Beer Division Planning
 The SAB Medium Term Sales Forecasting System : From Data to Planning Information Kenneth Carden SAB : Beer Division Planning Planning in Beer Division F Operational planning = what, when, where & how F
Integrated Electricity Demand and Price Forecasting
 Integrated Electricity Demand and Price Forecasting Create and Evaluate Forecasting Models The many interrelated factors which influence demand for electricity cannot be directly modeled by closed-form
Preface Introduction to Statistics and Data Analysis Overview: Statistical Inference, Samples, Populations, and Experimental Design The Role of
 Preface Introduction to Statistics and Data Analysis Overview: Statistical Inference, Samples, Populations, and Experimental Design The Role of Probability Sampling Procedures Collection of Data Measures
Step-Stress Models and Associated Inference
 Department of Mathematics & Statistics Indian Institute of Technology Kanpur August 19, 2014 Outline Accelerated Life Test 1 Accelerated Life Test 2 3 4 5 6 7 Outline Accelerated Life Test 1 Accelerated
IBM Research Report. Application of Three-Parameter Lognormal Distribution in EM Data Analysis
 RC368 (W57-13) July 9, 5 Mathematics IBM Research Report Application of Three-Parameter Lognormal Distribution in EM Data Analysis Baozhen Li 1, Emmanuel Yashchin, Cathryn Christiansen 1, Jason Gill 1,
Commissioning and Testing of AVR and PSS
 Commissioning and Testing of AVR and PSS Excitation System Upgrade and commissioning challenges Vetti Bala Principal C&I Engineer G E N E S I S E N E R G Y L I M I T E D Contents Asset Testing - AVR AVR
Unit 20: Planning Accelerated Life Tests
 Unit 20: Planning Accelerated Life Tests Ramón V. León Notes largely based on Statistical Methods for Reliability Data by W.Q. Meeker and L. A. Escobar, Wiley, 1998 and on their class notes. 11/13/2004
Lecture 7. Poisson and lifetime processes in risk analysis
 Lecture 7. Poisson and lifetime processes in risk analysis Jesper Rydén Department of Mathematics, Uppsala University jesper.ryden@math.uu.se Statistical Risk Analysis Spring 2014 Example: Life times of
IMPROVING THE ACCURACY OF RUNWAY ALLOCATION IN AIRCRAFT NOISE PREDICTION
 IMPROVING THE ACCURACY OF RUNWAY ALLOCATION IN AIRCRAFT NOISE PREDICTION David G. Southgate and Jonathan P. Firth Aviation Operations, Dept of Transport and Regional Services (DOTARS), Canberra, Australia
Statistical Analysis of BTI in the Presence of Processinduced Voltage and Temperature Variations
 Statistical Analysis of BTI in the Presence of Processinduced Voltage and Temperature Variations Farshad Firouzi, Saman Kiamehr, Mehdi. B. Tahoori INSTITUTE OF COMPUTER ENGINEERING (ITEC) CHAIR FOR DEPENDABLE
A Unified Approach to Uncertainty for Quality Improvement
 A Unified Approach to Uncertainty for Quality Improvement J E Muelaner 1, M Chappell 2, P S Keogh 1 1 Department of Mechanical Engineering, University of Bath, UK 2 MCS, Cam, Gloucester, UK Abstract To
DEMAND FORECASTING PROTOCOL
 FIRST REPLACEMENT VOLUME NO. II Original Sheet No. 443 DEMAND FORECASTING PROTOCOL FIRST REPLACEMENT VOLUME NO. II Original Sheet No. 444 DEMAND FORECASTING PROTOCOL Table of Contents DFP 1 OBJECTIVES,
Accelerated Life Test of Mechanical Components Under Corrosive Condition
 Accelerated Life Test of Mechanical Components Under Corrosive Condition Cheng Zhang, and Steven Y. Liang G. W. Woodruff School of Mechanical Engineering Georgia Institute of Technology Atlanta, GA 30332,
BAYESIAN MODELING OF DYNAMIC SOFTWARE GROWTH CURVE MODELS
 BAYESIAN MODELING OF DYNAMIC SOFTWARE GROWTH CURVE MODELS Zhaohui Liu, Nalini Ravishanker, University of Connecticut Bonnie K. Ray, IBM Watson Research Center Department of Mathematical Sciences, IBM Watson
Adaptive Binary Integration CFAR Processing for Secondary Surveillance Radar *
 BULGARIAN ACADEMY OF SCIENCES CYBERNETICS AND INFORMATION TECHNOLOGIES Volume 9, No Sofia 2009 Adaptive Binary Integration CFAR Processing for Secondary Surveillance Radar Ivan Garvanov, Christo Kabakchiev
Let us use the term failure time to indicate the time of the event of interest in either a survival analysis or reliability analysis.
 10.2 Product-Limit (Kaplan-Meier) Method Let us use the term failure time to indicate the time of the event of interest in either a survival analysis or reliability analysis. Let T be a continuous random
Control of Manufacturing Processes
 Control of Manufacturing Processes Subject 2.830 Spring 2004 Lecture #8 Hypothesis Testing and Shewhart Charts March 2, 2004 3/2/04 Lecture 8 D.E. Hardt, all rights reserved 1 Applying Statistics to Manufacturing:
A first look at the performances of a Bayesian chart to monitor. the ratio of two Weibull percentiles
 A first loo at the performances of a Bayesian chart to monitor the ratio of two Weibull percentiles Pasquale Erto University of Naples Federico II, Naples, Italy e-mail: ertopa@unina.it Abstract. The aim
Multivariate Regression Model Results
 Updated: August, 0 Page of Multivariate Regression Model Results 4 5 6 7 8 This exhibit provides the results of the load model forecast discussed in Schedule. Included is the forecast of short term system
Ronald Christensen. University of New Mexico. Albuquerque, New Mexico. Wesley Johnson. University of California, Irvine. Irvine, California
 Texts in Statistical Science Bayesian Ideas and Data Analysis An Introduction for Scientists and Statisticians Ronald Christensen University of New Mexico Albuquerque, New Mexico Wesley Johnson University
Time-varying failure rate for system reliability analysis in large-scale railway risk assessment simulation
 Time-varying failure rate for system reliability analysis in large-scale railway risk assessment simulation H. Zhang, E. Cutright & T. Giras Center of Rail Safety-Critical Excellence, University of Virginia,
Uncertainty. Jayakrishnan Unnikrishnan. CSL June PhD Defense ECE Department
 Decision-Making under Statistical Uncertainty Jayakrishnan Unnikrishnan PhD Defense ECE Department University of Illinois at Urbana-Champaign CSL 141 12 June 2010 Statistical Decision-Making Relevant in
Reliability and Availability Simulation. Krige Visser, Professor, University of Pretoria, South Africa
 Reliability and Availability Simulation Krige Visser, Professor, University of Pretoria, South Africa Content BACKGROUND DEFINITIONS SINGLE COMPONENTS MULTI-COMPONENT SYSTEMS AVAILABILITY SIMULATION CONCLUSION
Automated Tuning of Ad Auctions
 Automated Tuning of Ad Auctions Dilan Gorur, Debabrata Sengupta, Levi Boyles, Patrick Jordan, Eren Manavoglu, Elon Portugaly, Meng Wei, Yaojia Zhu Microsoft {dgorur, desengup, leboyles, pajordan, ermana,
UNIVERSITY OF MASSACHUSETTS Dept. of Electrical & Computer Engineering. Fault Tolerant Computing ECE 655
 UNIVERSITY OF MASSACHUSETTS Dept. of Electrical & Computer Engineering Fault Tolerant Computing ECE 655 Part 1 Introduction C. M. Krishna Fall 2006 ECE655/Krishna Part.1.1 Prerequisites Basic courses in
Fleet Asset Management
 Fleet Asset Management Maximum Profit by Minimum Planning April, 2017 1 PERFORMERS Performance is all that matters and that is what Fleet Asset Management is all about Brad Pitt Einstein Old Russian lady
You know I m not goin diss you on the internet Cause my mama taught me better than that I m a survivor (What?) I m not goin give up (What?
 I m not goin give up (What?") You know I m not goin diss you on the internet Cause my mama taught me better than that I m a survivor (What?) I m not goin give up (What?) I m not goin stop (What?) I m goin work harder (What?) Sir David
You know I m not goin diss you on the internet Cause my mama taught me better than that I m a survivor (What?) I m not goin give up (What?) I m not goin stop (What?) I m goin work harder (What?) Sir David
Ensemble Verification Metrics
 Ensemble Verification Metrics Debbie Hudson (Bureau of Meteorology, Australia) ECMWF Annual Seminar 207 Acknowledgements: Beth Ebert Overview. Introduction 2. Attributes of forecast quality 3. Metrics:
FORECASTING: A REVIEW OF STATUS AND CHALLENGES. Eric Grimit and Kristin Larson 3TIER, Inc. Pacific Northwest Weather Workshop March 5-6, 2010
 SHORT-TERM TERM WIND POWER FORECASTING: A REVIEW OF STATUS AND CHALLENGES Eric Grimit and Kristin Larson 3TIER, Inc. Pacific Northwest Weather Workshop March 5-6, 2010 Integrating Renewable Energy» Variable
TNI V1M Standard Update Guidance on Detection and Quantitation
 TNI V1M4 2016 Standard Update Guidance on Detection and Quantitation GUID-3-109-Rev0 January 30, 2019 This material represents the opinion of its authors. It is intended solely as guidance and does not
PDQ Tracker High Level Requirements
 Dominion / PeakRC PDQ Tracker High Level Requirements Purpose 1206 Broad Street Chattanooga, TN 37402 423 702 8136 The purpose of PDQ Tracker is (1) to measure phasor data quality, (2) to disseminate data
Meshed power system reliability estimation techniques
 Energy Production and Management in the 21st Century, Vol. 1 235 Meshed power system reliability estimation techniques S. A. Gusev, O. M. Kotov & V. P. Oboskalov Ural Federal University, Russia Abstract
Semiparametric Regression
 Semiparametric Regression Patrick Breheny October 22 Patrick Breheny Survival Data Analysis (BIOS 7210) 1/23 Introduction Over the past few weeks, we ve introduced a variety of regression models under
Chapter 5 Identifying hydrological persistence
 103 Chapter 5 Identifying hydrological persistence The previous chapter demonstrated that hydrologic data from across Australia is modulated by fluctuations in global climate modes. Various climate indices
Simultaneous Prediction Intervals for the (Log)- Location-Scale Family of Distributions
- Location-Scale Family of Distributions") Statistics Preprints Statistics 10-2014 Simultaneous Prediction Intervals for the (Log)- Location-Scale Family of Distributions Yimeng Xie Virginia Tech Yili Hong Virginia Tech Luis A. Escobar Louisiana
Statistics Preprints Statistics 10-2014 Simultaneous Prediction Intervals for the (Log)- Location-Scale Family of Distributions Yimeng Xie Virginia Tech Yili Hong Virginia Tech Luis A. Escobar Louisiana
Your World is not Red or Green. Good Practice in Data Display and Dashboard Design
 Your World is not Red or Green Good Practice in Data Display and Dashboard Design References Tufte, E. R. (2). The visual display of quantitative information (2nd Ed.). Cheshire, CT: Graphics Press. Few,
An Efficient Ensemble Data Assimilation Approach To Deal With Range Limited Observation
 An Efficient Ensemble Data Assimilation Approach To Deal With Range Limited Observation A. Shah 1,2, M. E. Gharamti 1, L. Bertino 1 1 Nansen Environmental and Remote Sensing Center 2 University of Bergen
Application and verification of ECMWF products 2010
 Application and verification of ECMWF products 2010 Icelandic Meteorological Office (www.vedur.is) Guðrún Nína Petersen 1. Summary of major highlights Medium range weather forecasts issued at IMO are mainly
STA 584 Supplementary Examples (not to be graded) Fall, 2003
 Fall, 2003") Page 1 of 8 Central Michigan University Department of Mathematics STA 584 Supplementary Examples (not to be graded) Fall, 003 1. (a) If A and B are independent events, P(A) =.40 and P(B) =.70, find (i)
Page 1 of 8 Central Michigan University Department of Mathematics STA 584 Supplementary Examples (not to be graded) Fall, 003 1. (a) If A and B are independent events, P(A) =.40 and P(B) =.70, find (i)
Impact of BGA Warpage on Quality. Mike Varnau
 Impact of BGA Warpage on Quality Mike Varnau 5-11-06 Contents What is a Ball in Cup Failure Case Study Background Problem Identification Solution Results Assembly Related Factors Causing Ball in Cup Component
Distinguishing Manufacturing Defects From Variability Induced Faults in Analog Circuits
 Distinguishing Manufacturing Defects From Variability Induced Faults in Analog Circuits Suraj Sindia Vishwani D. Agrawal Dept. of ECE, Auburn University, AL, USA Virendra Singh Indian Institute of Science,
Methods for Estimating the Parameters of the Power Function Distribution
 ISSN 1684-8403 Journal of Statistics Volume 21, 2014. pp. 90-102 Methods for Estimating the Parameters of the Power Function Distribution Abstract Azam Zaka 1, Ahmad Saeed Akhter 2 and Naeem Farooqi 3
Bayesian Modeling of Accelerated Life Tests with Random Effects
 Bayesian Modeling of Accelerated Life Tests with Random Effects Ramón V. León Avery J. Ashby Jayanth Thyagarajan Joint Statistical Meeting August, 00 Toronto, Canada Abstract We show how to use Bayesian
Multilevel Statistical Models: 3 rd edition, 2003 Contents
 Multilevel Statistical Models: 3 rd edition, 2003 Contents Preface Acknowledgements Notation Two and three level models. A general classification notation and diagram Glossary Chapter 1 An introduction
The New MDL Procedure How To s. Presented by: Marcy Bolek - Alloway
 The New MDL Procedure How To s Presented by: Marcy Bolek - Alloway Proposed MDL Revision 2015 MUR How to obtain a copy of the proposed MDL revision? https://www.gpo.gov/fdsys/pkg/fr-2015-02-19/pdf/2015-02841.pdf