Forecasting: Intentions, Expectations, and Confidence. David Rothschild Yahoo! Research, Economist December 17, 2011
|
|
|
- Moses Morrison
- 6 years ago
- Views:
Transcription
1 Forecasting: Intentions, Expectations, and Confidence David Rothschild Yahoo! Research, Economist December 17, 2011
2 Forecasts: Individual-Level Information Gather information from individuals, analyze it, and aggregate that information into forecasts of upcoming events. Make forecasts more efficient. Make forecasts more versatile. Make forecasts more economically efficient.
3 Two Methods of Aggregating Individual- Level Information into Forecast: Polls versus Prediction Markets Sample Selection: random sample of representative group versus self-selected group Question: intention versus expectation Aggregation: average versus weighted by money (proxy for confidence) Incentive: not incentive compatible versus incentive compatible
4 Article 1 Forecasting Elections: Voter Intention versus Expectation When polling individuals in order to forecast an upcoming election, which question creates a more efficient and versatile forecast? Voter Intention: Who would you vote for if the election were held today? Voter Expectation: Who do you think will win the election? Motiving Idea: Intention: individual Expectation: individual, social network, central signal
5 Forecasting the President Year Race Actual result: % voting for winner %Intended to vote for winner %Expect the winner 1952 Eisenhower beat Stevenson 55.4% 56.0% 56.0% 1956 Eisenhower beat Stevenson 57.8% 59.2% 76.4% 1960 Kennedy beat Nixon 50.1% 45.0% 45.0% 1964 Johnson beat Goldwater 61.3% 74.1% 91.0% 1968 Nixon beat Humphrey 50.4% 56.0% 71.2% 1972 Nixon beat McGovern 61.8% 69.7% 92.5% 1976 Carter beat Ford 51.1% 51.4% 52.6% 1980 Reagan beat Carter 55.3% 49.5% 46.3% 1984 Reagan beat Mondale 59.2% 59.8% 87.9% 1988 GHW Bush beat Dukakis 53.9% 53.1% 72.3% 1992 Clinton beat GHW Bush 53.5% 60.8% 65.2% 1996 Clinton beat Dole 54.7% 63.8% 89.6% 2000 GW Bush beat Gore 49.7% 45.7% 47.4% 2004 GW Bush beat Kerry 51.2% 49.2% 67.9% 2008 Obama beat McCain 53.7% 56.6% 65.7% Simple average 57.5% 56.7% %
6 Contribution 1: Expectations Possess Untapped Information Expectation question forecasts winner more often and translates into estimated vote share and probability of victory with more accuracy. Rothschild (2009) Rhode & Strumpf (2004) and Alford (1977)


 Both wrong 45 races (13%) Disagree")
 Intent")
7 Predicting the winner of a state s electoral college The winner was picked by a majority of respondents to the question on: Voter intentions: in 239 / 345 races = 69% Voter expectations: in 279 / 345 races = 81% Difference in proportions: z=3.52*** All Races Both correct 217 races (63%) Both wrong 45 races (13%) Disagree 83 races (24%) Where the methods disagree Expectations correct 63 races (76%) Intent correct 20 races (24%)
8 Root Mean Square Error = Mean Absolute Error = Correlation = degree line Efficient Intention-Based Proportion Forecast: Who Intend E[Vr Vr(hat)] to Vote Democratic:... (Based on Vr(hat) Raw Dem Intention)
9 Root Mean Square Error = Mean Absolute Error = Correlation = degree line Efficient Expectation-Based Proportion Who Forecast: Expect E[Vr Xr(hat)]...(Based the Democrat to Win: on Xr(hat) Raw Dem Expectation)
10 Forecast of Vote Share Efficient Voter Intention: E v r v r Efficient Voter Expectation: E v r x r Root Mean Squared Error (0.005) (0.006) Mean Absolute Error (0.003) (0.002) How often is forecast closer? 37.0% 63.0% (2.6) (2.6) Correlation Encompassing regression: 0.184** 0.913*** v r = α + β v Intention r + β x Expectation r (0.089) (0.067) Optimal weights: 9.5% 90.5%*** v r = βintention r + 1 β Expectation r (6.7) (6.7) Test of Equality t 310 =5.75 (p<0.0001) t 310 =6.09 (p<0.0001) t 310 =4.75 (p<0.0001) F 1,308 =25.5 (p<0.0001) F 1,310 =36.7 (p<0.0001) Notes: ***, **, and * denote statistically significant coefficients at the 1%, 5%, and 10%, respectively. (Standard errors in parentheses). These are assessments of forecasts of the Democrat s share of the twoparty vote in n=311 elections. Comparisons in the third column test the equality of the measures in the first two columns. In the encompassing regression, the constant α = (se=0.030).
11 2008 Data Forecast of Vote Share: Efficient Voter Intention: E v r v r Efficient Voter Expectation: E v r x r Test of equality Root Mean Squared Error Mean Absolute Error How often is forecast closer? 47.1% 52.9% Correlation 61.6% 69.2% t 33 =1.28 (p<0.2105) t 33 =0.92 (p<0.3656) t 33 =0.34 (p<0.7371) Encompassing regression: v r = α + β v Intention r + β x Expectation r (0.291) 0.684*** (0.250) F 1,31 =0.49 (p<0.4891) Optimal weights: 24.7% v r = βintention r + 1 β Expectation r (26.7) 75.3%*** (26.7) F 1,33 =0.89 (p<0.3519) Probabilistic Forecasts: Prob v r > 0. 5 v r Prob v r > 0. 5 x r Root Mean Squared Error How often is forecast closer? 23.5% 76.5% t 344 =1.55 (p<0.1295) t 344 =3.58 (p<0.0011) Encompassing regression: I DemWin r = Φ α + β v Φ 1 Prob I + β x Φ 1 Prob x (1.289) 1.224** (0.520) χ 2 =0.07 (p<0.7952) 19 of 35 Optimal weights: I DemWin r = Φ βφ 1 Prob I + 1 β Φ 1 Prob x 2.4% (39.1) 97.6%** (39.1) χ 2 =0.28 (p<0.5989)
12 Forecast of Winner (Out of Sample) Days Before the Election < Days Before the Election 180 Days Before the Election > 180 Proportion of observations where the winning candidate was correctly predicted by a majority of respondents by: Exp Int Obs Elec Exp Int Obs Elec Exp Int Obs Elec President 89% 81% % 62% % 58% E-C 72% 81% Governor 79% 79% % 50% % 100% 2 1 Senator 82% 91% Mayor 100% 100% % 67% Other 85% 81% % 67% % 50% 2 2 USA Total 85% 81% % 61% % 59% of 35
13 Forecast of Winner (Out of Sample) Days Before the Election < Days Before the Election 180 Days Before the Election > 180 Proportion of observations where the winning candidate was correctly predicted by a majority of respondents by: Exp Int Obs Elec Exp Int Obs Elec Exp Int Obs Elec AUS 89% 42% % 33% % 66% 86 2 GBR 85% 90% % 92% % 63% 62 9 FRA 61% 57% % 20% Other 71% 71% 7 6 0% 0% 1 1 0% 0% 1 1 Non- USA Total 79% 59% % 50% % 64%
14 Contribution 2: Expectation Response Contains Information of Others Structural interpretation of the response shows it to be the equivalent of a multi-person poll. Response has a lot information about social network. Granberg and Brent (1983)
15 Structural Interpretation Each of us runs a private poll of m-1 friends and family Also include yourself in this poll Proportion of your social network intending to vote Democrat s r i ~Binomial v r, v r 1 v r m Probability i expect the Democrat to win Prob s i v r 0.5 r > 0.5 = Φ Φ 2 m v r 0.5 v r 1 v r m Using the normal approximation to binomial distribution And 1/ v r 1 v r 2 in competitive races Probit regression of expectations on vote share yields: m = 11.1 (se=1.1, clustering by state-year)
16 Social Circles Are Not Representative If your social circles has a known partisan bias Probability that someone in your social circle votes Democrat s v r + θ i s r where i θr is the bias in your social circle Your expectations can de-bias E v r v r i ; θ r s i = vr i θ r s i Thus these expectations: v i s r ~Binomial v r, v r + θ i s r 1 v r θ i r /m) You expect the Democrat to win if: Prob v r + η i r > 0.5 Φ 2 m v r 0.5 Known partisan bias yields same results as before Because respondents can de-bias
17 Social Circles with Correlated Shocks If your social circle has correlated (but unobserved) shocks: Probability that someone in your social circle votes Democrat v r + η r i where η r i ~N 0, σ η 2 ) Thus the result of your informal poll of m 1 friends: v r i ~N v r, v r 1 v r m You expect the Democrat to win if: Prob v r + η r i > 0.5 Φ 1 + m 1 2 m m 1 σ η 2 σ η 2 v r 1 v r ) 25 v r 0.5 Implies an equivalence between m randomly-sampled friends and m = m 1 4ρ i x σ2 ε with correlated views 1 4σ 2 ε m If σ 2 η = 0 and m = 11 σ 2 η = 0.5σ2 ε and m = 21
18 A Pilot Survey (with Gallup) Next, I would like you to consider the friends, family members and co-workers with whom you regularly discuss politics on a regular basis and who are likely to vote in the Republican primary for president in New Hampshire next year. As I read each name, please tell me how many of your friends, family members and co-workers are likely to support that candidate in the New Hampshire primary. Just your best guess will do. [IF NECESSARY, READ: We are looking for the total number of people you know who would likely support the candidate] [READ AND ROTATE A-J] Pilot: n=81 in New Hampshire, Iowa, Nevada and South Carolina
19 Histogram: Total number of friends Total number of friends Mean: 21reported Median: Number of friends voting intentions reported 27 Justin Wolfers, Voter Intentions versus
20 Correlated Beliefs within Social Circles 2000 National Election Studies Social Network module: From time to time, people discuss government, elections and politics with other people. I'd like to ask you about the people with whom you discuss these matters. These people might or might not be relatives. Can you think of anyone? How do you think [name] voted in the election? Estimate a random effects model: I v r i = 1 = r r + η r s i + ζ r i Vote Democrat = election-specific constant + social circle random effect + idiosyncratic influences Yields: σ η 2 = and σ ζ 2 = Which implies: m =19.2
21 Extent of Disagreement All info is common = = = = All info is idiosyncratic = Actual Data Actual Democrat vote share 29
22 What Info is Being Aggregated Are voter expectations a function of: Idiosyncratic information about your social circle; OR Common information across respondents? Three approaches: 1. Accuracy and sample size Typically accuracy is a function of n But if we each have m respondents to our own informal polls then accuracy is a function of mn 2. Results of pilot survey 3. Extent of disagreement Formally, a random effects probit model of voter expectations Preliminary findings: All three approaches suggest common information is a minor influence Each respondent has the equivalent of about friends
23 Intentions Correlation: Intent and Expectation Intend to vote Democrat Intend to vote Republican Expect Democrat to win this state 33.9% (68.8%) [71.2%] 13.7% (27.0%) [28.8%] Expectations Expect Republican to win this state 15.4% (31.2%) [29.3%] 37.1% (73.0%) [70.7%] Raw proportions; (% of row in parentheses); [%of column in square brackets] Correlation between people s intentions and expectations = % of people expect their candidate to win Psychologists: Wishful thinking Political scientists: Bandwagon effects 32 Justin Wolfers, Voter My argument: Rational inference based on limited info Intentions versus
24 Correlation: Intent and Expectation Recall that I am one of m observations in my own poll Creates a correlation between voter expectations and intentions Probability a Democrat expects the Democrat to win: Prob 1 + m 1 v r > m 1 2 Φ m + m 1 m v r 0.5 Φ 5.8 v r 0.45 Using normal approximation (ignoring ties) And m=11.1 v r 1 v r m 1 Probability a Republican expects the Democrat to win: Prob 0 + m 1 v r > m 2 Φ m 1 m v r 0.5 Φ 5.8 v r 0.55 v r 1 v r m 1
25 Proportion expecting the Democrat to win among Democrat and Republican voters 1.0 Intend to vote Democrat Model inference for Democrats Intend to vote Republican Model inference for Republicans of Actual Democrat Vote Share Local linear regression estimates, using Epanechnikov kernal and rule-of-thumb bandwidth. Shaded area shows 95% confidence interval.
26 Contribution 3: Sample Selection Expectation-based forecasts from just those who intend to vote Democratic, or just Republican, are more accurate than the forecasts based on the full intention data. Importance: declining landline penetration, unrepresentative online survey, difficulty in contacting working families. Robinson (1937) Berg & Rietz (2006)
27 Standard Intentions-Based Forecast Voter intentions
28 Expectation-Based Forecast Voter expectations
29 Biased Expectation-Based Forecast Account for correlation between intentions and expectations Expectations-based forecast using only Democrats 38
30 Democratic Sample Republican Sample Forecast of Vote Share: E v r v r E v r x r E v r v r E v r x r Root Mean Squared Error (0.005) (0.006) (0.004) (0.004) Mean Absolute Error (0.003) (0.003) (0.003) (0.002) How often is forecast closer? 46.7% (2.9) 53.3% (2.9) 44.0% (2.8) 56.0% (2.8) Correlation Encompassing regression: v r = α + β v Intention r + β x Expectation r 0.625*** (0.078) 0.790*** (0.071) 0.489*** (0.077) 0.786*** (0.065) Probabilistic Forecasts: Prob Prob Prob Prob v r >. 5 v r v r >. 5 x r v r >. 5 v r v r >. 5 x r Root Mean Squared Error (0.006) (0.010) (0.006) (0.013) How often is forecast closer? 28.4% (2.6) 71.5% (2.6) 19.9% (2.3) 80.1% (2.3) Encompassing regression: I DemWin r = Φ α + β v Φ 1 Prob I 1.73*** (0.40) 1.62*** (0.20) 1.29*** (0.41) 1.53*** (0.17) + β x Φ 1 Prob x 306 Elections 307 Elections 39 of 35 Notes: ***, **, and * denote statistically significant coefficients at the 1%, 5%, and 10%, respectively. (Standard errors in parentheses).
31 Discussion Explore new ways to interact with individuals and gather their information. Expand the structural interpretation to cover a national signal and a local signal: Network theory Cost-Benefit: non-random samples are becoming much less expensive than random samples; we need to study how to utilize them. 40 of 32
32 Related Applications Low probability events Estimating civilian deaths in war Department of Labor mine safety Incentives to deceive Cheating in the NCAA Gays in the military Social desirability bias Abortion counts where it is illegal Simpler sampling frames Gallup job creation index Small sample sizes Marketing and focus groups
33 2012 Republican Primary 60% 57% %Intend to vote for candidate 50% 40% %Expect candidate to win 30% 27% 27% 20% 10% 0% 16% 15% 14% 11% 10% 5% 4% 4% 4% 3% 1% 1% 1% Gallup survey November 2-6, n=1054 Republicans or R-leaning independents
34 2012 Republican Primary 50% 47% %Intend to vote for candidate 44% 42% 45% 40% 35% 30% 25% 20% 15% 10% 5% 0% 26% 0% 0% %Expect candidate to win 8% 10% 6% 7% 2% 4% 1% 1% 1% 0% Gallup survey December 1-5, n=1054 Republicans or R-leaning independents
35 Article 2 Expectations: Point- Estimates, Probability Distributions, Confidence and Forecasts Can a new method be used to gather previously untapped information from the respondents? Ariely et al. (2003): Coherent Arbitrariness Can that new information be used to make more efficient and versatile forecasts than the standard information?

36 Point Estimate
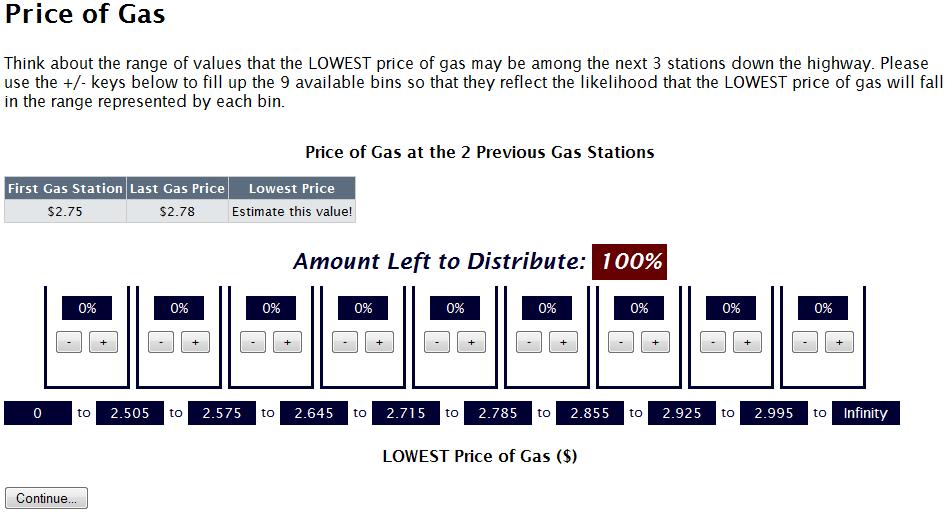

37 Probability Distribution
38 Data Five categories of questions 9 or 10 unique questions Respondent gets 1 randomly assigned question per category and categories are in random order Respondents: Wharton Behavioral Lab and Mechanical Turk Study 1: half standard method and half confidence ranges / stated confidence Study 2: half standard incentive and half incentive compatible
39 Contribution 1: Revealed Confidence Positively Correlated with Accuracy of Expectations. Revealed confidence from the probability distributions demonstrates a sizable and statistically significant positive correlation with the accuracy accompanying expectation. Likert-type Rating Scales: Kuklinski (2000)
40 Confidence and Accuracy Rank error and confidence from smallest to largest in unique question: 0 to 1 Rank Error = α + β Rank σ Within Question: OLS Within Respondent: fixed-effect for the respondent Positive correlation between rank of confidence and rank of accuracy for all three methods Most significant and meaningful with full probability distribution
41 Confidence and Accuracy Rank Error = α + β Rank(σ) OLS (Within Question) Rank Error = α + β Rank(σ) Fixed-Effect (Within Respondent) Stated Confidence (0.038) (0.038) Confidence Range Probability Distribution R *** (0.040) 0.150*** (0.041) ** (0.050) (0.050) *** (0.040) *** (0.051) 0.222*** (0.052) *** (0.052) Note: ***, **, and * denote statistically significant coefficients at the 1%, 5%, and 10% level, respectively. (Standard errors in parentheses). The errors and standard deviations are normalized by their rank within the unique question. The stated confidence and confidence range questions were answered by 129 respondents and the probability distribution by 120. There are a total of 48 unique questions in 5 categories; each respondent answered 5 questions, one in each category.
42 Contribution 2: Forecasts can be confidence-weighted for more accurate point-estimates. Weighing the individual-level estimates by their confidence provides a more accurate forecast than standard methods of aggregation. Aggregating Forecasts: Simple Aggregation: Bates and Granger (1969), Stock and Watson (2004), Smith and Wallis (2009) Prediction Markets: Rothschild (2009)
43 Median of Point-Estimate is Most Accurate Standard Consensus Estimate Study I Study II Categories 5 3 Questions per Category Observations per Question % of Individual-Level Point-Estimate Absolute Errors < Mean Point-Estimate of Question Absolute Errors 36.7 % 38.8 % % of Individual-Level Point-Estimate Absolute Errors < Median Point-Estimate of Question Absolute Errors 24.3 % 27.9 % Note: Point-estimates are all recorded prior to the probability distributions. Study I is randomized between probability distribution method and confidence questions, with 249 respondents. Study II is randomized between flat pay and incentive compatible pay for probability distribution method, with 202 respondents.
44 Confidence-Weighted Forecasts Median of the point-estimates is most efficient forecast from point-estimates. On an individual-level, the mean of probability distribution is more accurate than median, mode, or the point-estimate. Confidence-weighted forecasts of mean of probability distribution are more accurate than median of point-estimate: w i = 1 σ 2 i n 1 j=1 σ 2 i
45 Confidence-Weighted Forecasts: Inverse Variance Weights Category Calories Concert Tickets Gas Prices Movie Receipts Unemployment Weight Median of Point- Estimate Confidence- Weighted Mean ans = α + β 1 PointEst + β 2 ConEst 1 σi 2 1 σi 2 1 σi 2 1 σi 2 1 σi (0.286) (0.822) (0.398) 0.805** (0.319) (1.786) 1.146*** (0.281) (0.677) (0.425) * (0.348) (1.808) Median of Point- Estimate Confidence- Weighted Mean ans = βpointest + 1 β ConEst (0.245) (0.564) (1.133) (0.453) (1.553) 0.948*** (0.245) (0.564) (1.133) (0.453) (1.553) Note: ***, **, and * denote statistically significant coefficients at the 1%, 5%, and 10% level, respectively. (Standard errors in parentheses). There are 48 question total: 10 for calories, 10 for gas prices, and 10 for unemployment, 9 for concert tickets, and 9 for movie receipts.
46 Confidence-Weighted Forecasts Category R 2 from ans = α + β Forecast R 2 with only Median of Point- Estimate R 2 with only Confidence- Weighted Forecast R 2 for Joint Forecast Calories Concert Tickets Gas Prices Movie Receipts Unemployment Note: The confidence-weighted forecast is optimized by category as in the lower half of Table 5. The table is nearly identical regardless of which efficient weighting scheme I utilize.
47 Hybrid Polls/Prediction Markets w/ Probability Distributions What is gained from capturing point-estimates and then probability distributions from non-experts? Expectations: the absorption of information into expectations on an individual level. Forecasts: create more efficient/versatile forecasts. Decisions: test models of individual choice that routinely make strong assumptions about expectations.
48 Yahoo! Signal Experimental Polling Experimental Prediction Games Prediction Markets, Polls, Fundamentals Data Visualizations that non-experts understand Articles tie it all together!

49
Carolyn Anderson & YoungShil Paek (Slide contributors: Shuai Wang, Yi Zheng, Michael Culbertson, & Haiyan Li)
") Carolyn Anderson & YoungShil Paek (Slide contributors: Shuai Wang, Yi Zheng, Michael Culbertson, & Haiyan Li) Department of Educational Psychology University of Illinois at Urbana-Champaign 1 Inferential
Carolyn Anderson & YoungShil Paek (Slide contributors: Shuai Wang, Yi Zheng, Michael Culbertson, & Haiyan Li) Department of Educational Psychology University of Illinois at Urbana-Champaign 1 Inferential
NOWCASTING THE OBAMA VOTE: PROXY MODELS FOR 2012
 JANUARY 4, 2012 NOWCASTING THE OBAMA VOTE: PROXY MODELS FOR 2012 Michael S. Lewis-Beck University of Iowa Charles Tien Hunter College, CUNY IF THE US PRESIDENTIAL ELECTION WERE HELD NOW, OBAMA WOULD WIN.
Advanced Quantitative Research Methodology Lecture Notes: January Ecological 28, 2012 Inference1 / 38
 Advanced Quantitative Research Methodology Lecture Notes: Ecological Inference 1 Gary King http://gking.harvard.edu January 28, 2012 1 c Copyright 2008 Gary King, All Rights Reserved. Gary King http://gking.harvard.edu
CHAPTER 1: Preliminary Description of Errors Experiment Methodology and Errors To introduce the concept of error analysis, let s take a real world
 CHAPTER 1: Preliminary Description of Errors Experiment Methodology and Errors To introduce the concept of error analysis, let s take a real world experiment. Suppose you wanted to forecast the results
How to Use the Internet for Election Surveys
 How to Use the Internet for Election Surveys Simon Jackman and Douglas Rivers Stanford University and Polimetrix, Inc. May 9, 2008 Theory and Practice Practice Theory Works Doesn t work Works Great! Black
EC3224 Autumn Lecture #03 Applications of Nash Equilibrium
 Reading EC3224 Autumn Lecture #03 Applications of Nash Equilibrium Osborne Chapter 3 By the end of this week you should be able to: apply Nash equilibrium to oligopoly games, voting games and other examples.
DS-GA 1002 Lecture notes 11 Fall Bayesian statistics
 DS-GA 100 Lecture notes 11 Fall 016 Bayesian statistics In the frequentist paradigm we model the data as realizations from a distribution that depends on deterministic parameters. In contrast, in Bayesian
CSSS/STAT/SOC 321 Case-Based Social Statistics I. Levels of Measurement
 CSSS/STAT/SOC 321 Case-Based Social Statistics I Levels of Measurement Christopher Adolph Department of Political Science and Center for Statistics and the Social Sciences University of Washington, Seattle
LECTURE 15: SIMPLE LINEAR REGRESSION I
 David Youngberg BSAD 20 Montgomery College LECTURE 5: SIMPLE LINEAR REGRESSION I I. From Correlation to Regression a. Recall last class when we discussed two basic types of correlation (positive and negative).
Political Cycles and Stock Returns. Pietro Veronesi
 Political Cycles and Stock Returns Ľuboš Pástor and Pietro Veronesi University of Chicago, National Bank of Slovakia, NBER, CEPR University of Chicago, NBER, CEPR Average Excess Stock Market Returns 30
Statistics, continued
 Statistics, continued Visual Displays of Data Since numbers often do not resonate with people, giving visual representations of data is often uses to make the data more meaningful. We will talk about a
Discrete Distributions
 Discrete Distributions STA 281 Fall 2011 1 Introduction Previously we defined a random variable to be an experiment with numerical outcomes. Often different random variables are related in that they have
Social Choice and Networks
 Social Choice and Networks Elchanan Mossel UC Berkeley All rights reserved Logistics 1 Different numbers for the course: Compsci 294 Section 063 Econ 207A Math C223A Stat 206A Room: Cory 241 Time TuTh
104 Business Research Methods - MCQs
 104 Business Research Methods - MCQs 1) Process of obtaining a numerical description of the extent to which a person or object possesses some characteristics a) Measurement b) Scaling c) Questionnaire
The Causal Inference Problem and the Rubin Causal Model
 The Causal Inference Problem and the Rubin Causal Model Lecture 2 Rebecca B. Morton NYU Exp Class Lectures R B Morton (NYU) EPS Lecture 2 Exp Class Lectures 1 / 23 Variables in Modeling the E ects of a
Polling and sampling. Clement de Chaisemartin and Douglas G. Steigerwald UCSB
 Polling and sampling. Clement de Chaisemartin and Douglas G. Steigerwald UCSB 1 What pollsters do Pollsters want to answer difficult questions: As of November 1 st 2016, what % of the Pennsylvania electorate
Amherst College Department of Economics Economics 360 Fall 2012
 Amherst College Department of Economics Economics 360 Fall 2012 Monday, December 3: Omitted Variables and the Instrumental Variable Estimation Procedure Chapter 20 Outline Revisit Omitted Explanatory Variable
PS 203 Spring 2002 Homework One - Answer Key
 PS 203 Spring 2002 Homework One - Answer Key 1. If you have a home or office computer, download and install WinBUGS. If you don t have your own computer, try running WinBUGS in the Department lab. 2. The
The Davison Presidential Technique. First presented on May 20, 2008, 2:30 pm MDT, in Denver, CO, at the United Astrology Congress
 The Davison Presidential Technique First presented on May 20, 2008, 2:30 pm MDT, in Denver, CO, at the United Astrology Congress Introduction What is a Davison relationship chart? How is it different from
Supplementary Materials for Congressional Decision Making and the Separation of Powers
 Supplementary Materials for Congressional Decision Making and the Separation of Powers Andrew D. Martin February 19, 2001 1 Table 1: House Hierarchical Probit Estimates Strategic Model (Nominate Second
Regression Discontinuity
 Regression Discontinuity Christopher Taber Department of Economics University of Wisconsin-Madison October 24, 2017 I will describe the basic ideas of RD, but ignore many of the details Good references
Ever since elections for office have been held, people. Accuracy of Combined Forecasts for the 2012 Presidential Election: The PollyVote FEATURES
 FEATURES Accuracy of Combined Forecasts for the 2012 Presidential Election: The PollyVote Andreas Graefe, LMU Munich J. Scott Armstrong, University of Pennsylvania and University of South Australia Randall
Sampling. Benjamin Graham
 Sampling Benjamin Graham Schedule This Week: Sampling and External Validity How many kids? Fertility rate in the US. could be interesting as an independent or a dependent variable. How many children did
Inflation Expectations and Monetary Policy Design: Evidence from the Laboratory
 Inflation Expectations and Monetary Policy Design: Evidence from the Laboratory Damjan Pfajfar (CentER, University of Tilburg) and Blaž Žakelj (European University Institute) FRBNY Conference on Consumer
Introduction to Statistical Data Analysis Lecture 4: Sampling
 Introduction to Statistical Data Analysis Lecture 4: Sampling James V. Lambers Department of Mathematics The University of Southern Mississippi James V. Lambers Statistical Data Analysis 1 / 30 Introduction
Accuracy of Combined Forecasts for the 2012 Presidential Election: The PollyVote
 University of Pennsylvania ScholarlyCommons Marketing Papers Wharton Faculty Research 4-2014 Accuracy of Combined Forecasts for the 2012 Presidential Election: The PollyVote Andreas Graefe J. S. Armstrong
Lecture 20 Random Samples 0/ 13
 0/ 13 One of the most important concepts in statistics is that of a random sample. The definition of a random sample is rather abstract. However it is critical to understand the idea behind the definition,
Marketing Research Session 10 Hypothesis Testing with Simple Random samples (Chapter 12)
") Marketing Research Session 10 Hypothesis Testing with Simple Random samples (Chapter 12) Remember: Z.05 = 1.645, Z.01 = 2.33 We will only cover one-sided hypothesis testing (cases 12.3, 12.4.2, 12.5.2,
Marketing Research Session 10 Hypothesis Testing with Simple Random samples (Chapter 12) Remember: Z.05 = 1.645, Z.01 = 2.33 We will only cover one-sided hypothesis testing (cases 12.3, 12.4.2, 12.5.2,
EconS Nash Equilibrium in Games with Continuous Action Spaces.
 EconS 424 - Nash Equilibrium in Games with Continuous Action Spaces. Félix Muñoz-García Washington State University fmunoz@wsu.edu February 7, 2014 Félix Muñoz-García (WSU) EconS 424 - Recitation 3 February
Final Exam Details. J. Parman (UC-Davis) Analysis of Economic Data, Winter 2011 March 8, / 24
 Analysis of Economic Data, Winter 2011 March 8, / 24") Final Exam Details The final is Thursday, March 17 from 10:30am to 12:30pm in the regular lecture room The final is cumulative (multiple choice will be a roughly 50/50 split between material since the
Final Exam Details The final is Thursday, March 17 from 10:30am to 12:30pm in the regular lecture room The final is cumulative (multiple choice will be a roughly 50/50 split between material since the
Lecture Notes Part 7: Systems of Equations
 17.874 Lecture Notes Part 7: Systems of Equations 7. Systems of Equations Many important social science problems are more structured than a single relationship or function. Markets, game theoretic models,
Regression Discontinuity
 Regression Discontinuity Christopher Taber Department of Economics University of Wisconsin-Madison October 16, 2018 I will describe the basic ideas of RD, but ignore many of the details Good references
Political Economy of Institutions and Development. Lectures 2 and 3: Static Voting Models
 14.773 Political Economy of Institutions and Development. Lectures 2 and 3: Static Voting Models Daron Acemoglu MIT February 7 and 12, 2013. Daron Acemoglu (MIT) Political Economy Lectures 2 and 3 February
Wooldridge, Introductory Econometrics, 4th ed. Appendix C: Fundamentals of mathematical statistics
 Wooldridge, Introductory Econometrics, 4th ed. Appendix C: Fundamentals of mathematical statistics A short review of the principles of mathematical statistics (or, what you should have learned in EC 151).
6.207/14.15: Networks Lecture 24: Decisions in Groups
 6.207/14.15: Networks Lecture 24: Decisions in Groups Daron Acemoglu and Asu Ozdaglar MIT December 9, 2009 1 Introduction Outline Group and collective choices Arrow s Impossibility Theorem Gibbard-Satterthwaite
ST 371 (IX): Theories of Sampling Distributions
: Theories of Sampling Distributions") ST 371 (IX): Theories of Sampling Distributions 1 Sample, Population, Parameter and Statistic The major use of inferential statistics is to use information from a sample to infer characteristics about
ST 371 (IX): Theories of Sampling Distributions 1 Sample, Population, Parameter and Statistic The major use of inferential statistics is to use information from a sample to infer characteristics about
Goals. PSCI6000 Maximum Likelihood Estimation Multiple Response Model 1. Multinomial Dependent Variable. Random Utility Model
 Goals PSCI6000 Maximum Likelihood Estimation Multiple Response Model 1 Tetsuya Matsubayashi University of North Texas November 2, 2010 Random utility model Multinomial logit model Conditional logit model
A Discussion of the Bayesian Approach
 A Discussion of the Bayesian Approach Reference: Chapter 10 of Theoretical Statistics, Cox and Hinkley, 1974 and Sujit Ghosh s lecture notes David Madigan Statistics The subject of statistics concerns
Estimating Dynamic Games of Electoral Competition to Evaluate Term Limits in U.S. Gubernatorial Elections: Online Appendix
 Estimating Dynamic Games of Electoral Competition to Evaluate Term Limits in U.S. Gubernatorial Elections: Online ppendix Holger Sieg University of Pennsylvania and NBER Chamna Yoon Baruch College I. States
1 Introduction Overview of the Book How to Use this Book Introduction to R 10
 List of Tables List of Figures Preface xiii xv xvii 1 Introduction 1 1.1 Overview of the Book 3 1.2 How to Use this Book 7 1.3 Introduction to R 10 1.3.1 Arithmetic Operations 10 1.3.2 Objects 12 1.3.3
Probability and Statistics
 Probability and Statistics Jesse Hoey School of Computer Science University of Waterloo January 9, 2012 Uncertainty Why is uncertainty important? Agents (and humans) don t know everything, but need to
1 Overview. 2 Learning from Experts. 2.1 Defining a meaningful benchmark. AM 221: Advanced Optimization Spring 2016
 AM 1: Advanced Optimization Spring 016 Prof. Yaron Singer Lecture 11 March 3rd 1 Overview In this lecture we will introduce the notion of online convex optimization. This is an extremely useful framework
SPATIAL VOTING (MULTIPLE DIMENSIONS)
") SPATIAL VOTING (MULTIPLE DIMENSIONS) 1 Assumptions Alternatives are points in an n-dimensional space. Examples for 2D: Social Issues and Economic Issues Domestic Spending and Foreign Spending Single-peaked
SPATIAL VOTING (MULTIPLE DIMENSIONS) 1 Assumptions Alternatives are points in an n-dimensional space. Examples for 2D: Social Issues and Economic Issues Domestic Spending and Foreign Spending Single-peaked
Solutions: Monday, October 22
 Amherst College Department of Economics Economics 360 Fall 2012 1. Focus on the following agricultural data: Solutions: Monday, October 22 Agricultural Production Data: Cross section agricultural data
Math 138 Summer Section 412- Unit Test 1 Green Form, page 1 of 7
 Math 138 Summer 1 2013 Section 412- Unit Test 1 Green Form page 1 of 7 1. Multiple Choice. Please circle your answer. Each question is worth 3 points. (a) Social Security Numbers are illustrations of which
Introduction to Statistical Data Analysis Lecture 1: Working with Data Sets
 Introduction to Statistical Data Analysis Lecture 1: Working with Data Sets James V. Lambers Department of Mathematics The University of Southern Mississippi James V. Lambers Statistical Data Analysis
Politician Family Networks and Electoral Outcomes: Evidence from the Philippines. Online Appendix. Cesi Cruz, Julien Labonne, and Pablo Querubin
 Politician Family Networks and Electoral Outcomes: Evidence from the Philippines Online Appendix Cesi Cruz, Julien Labonne, and Pablo Querubin 1 A.1 Additional Figures 8 4 6 2 Vote Share (residuals) 4
Chapter 9: Elementary Sampling Theory
 Chapter 9: Elementary Sampling Theory James B. Ramsey Economics; NYU 2007-2-3 Ramsey (Institute) Chapter 9: 2007-2-3 1 / 20 Sampling Theory is the LINK between Theory & Observation Chapters 1 to 5: Data
Lab 5 for Math 17: Sampling Distributions and Applications
 Lab 5 for Math 17: Sampling Distributions and Applications Recall: The distribution formed by considering the value of a statistic for every possible sample of a given size n from the population is called
Regression Discontinuity Designs
 Regression Discontinuity Designs Kosuke Imai Harvard University STAT186/GOV2002 CAUSAL INFERENCE Fall 2018 Kosuke Imai (Harvard) Regression Discontinuity Design Stat186/Gov2002 Fall 2018 1 / 1 Observational
Intro Prefs & Voting Electoral comp. Political Economics. Ludwig-Maximilians University Munich. Summer term / 37
 1 / 37 Political Economics Ludwig-Maximilians University Munich Summer term 2010 4 / 37 Table of contents 1 Introduction(MG) 2 Preferences and voting (MG) 3 Voter turnout (MG) 4 Electoral competition (SÜ)
HARNESSING THE WISDOM OF CROWDS
 1 HARNESSING THE WISDOM OF CROWDS Zhi Da, University of Notre Dame Xing Huang, Michigan State University Second Annual News & Finance Conference March 8, 2017 2 Many important decisions in life are made
Michigan Results. For 9/21/2012-9/22/2012. Contact: Doug Kaplan,
 Michigan Results For 9/21/2012-9/22/2012 Contact: Doug Kaplan, 407-242-1870 Executive Summary On the afternoon and evenings of September 21 22, 2012, Gravis Marketing, a non-partisan research firm, and
Advanced Quantitative Methods: limited dependent variables
 Advanced Quantitative Methods: Limited Dependent Variables I University College Dublin 2 April 2013 1 2 3 4 5 Outline Model Measurement levels 1 2 3 4 5 Components Model Measurement levels Two components
Exam D0M61A Advanced econometrics
 Exam D0M61A Advanced econometrics 19 January 2009, 9 12am Question 1 (5 pts.) Consider the wage function w i = β 0 + β 1 S i + β 2 E i + β 0 3h i + ε i, where w i is the log-wage of individual i, S i is
Econometrics (60 points) as the multivariate regression of Y on X 1 and X 2? [6 points]
![Econometrics (60 points) as the multivariate regression of Y on X 1 and X 2? [6 points]](/thumbs/72/66990660.jpg "Econometrics (60 points) as the multivariate regression of Y on X 1 and X 2? [6 points]") Econometrics (60 points) Question 7: Short Answers (30 points) Answer parts 1-6 with a brief explanation. 1. Suppose the model of interest is Y i = 0 + 1 X 1i + 2 X 2i + u i, where E(u X)=0 and E(u 2 X)=
Econometrics (60 points) Question 7: Short Answers (30 points) Answer parts 1-6 with a brief explanation. 1. Suppose the model of interest is Y i = 0 + 1 X 1i + 2 X 2i + u i, where E(u X)=0 and E(u 2 X)=
Dummies and Interactions
 Dummies and Interactions Prof. Jacob M. Montgomery and Dalston G. Ward Quantitative Political Methodology (L32 363) November 16, 2016 Lecture 21 (QPM 2016) Dummies and Interactions November 16, 2016 1
CMU Social choice 2: Manipulation. Teacher: Ariel Procaccia
 CMU 15-896 Social choice 2: Manipulation Teacher: Ariel Procaccia Reminder: Voting Set of voters Set of alternatives Each voter has a ranking over the alternatives means that voter prefers to Preference
Sampling distributions and the Central Limit. Theorem. 17 October 2016
 distributions and the Johan A. Elkink School of Politics & International Relations University College Dublin 17 October 2016 1 2 3 Outline 1 2 3 (or inductive statistics) concerns drawing conclusions regarding
Supplementary Information: Network Structure Explains the Impact of Attitudes on Voting Decisions
 Supplementary Information: Network Structure Explains the of Attitudes on Voting Decisions Jonas Dalege, Denny Borsboom, Frenk van Harreveld, Lourens J. Waldorp & Han L. J. van der Maas Department of Psychology,
Game Theory: Spring 2017
 Game Theory: Spring 2017 Ulle Endriss Institute for Logic, Language and Computation University of Amsterdam Ulle Endriss 1 Plan for Today In this second lecture on mechanism design we are going to generalise
Combining forecasts: An application to U.S. Presidential Elections
 Combining forecasts: An application to U.S. Presidential Elections Andreas Graefe, Karlsruhe Institute of Technology J. Scott Armstrong, The Wharton School, University of Pennsylvania Randall J. Jones,
Confidence Intervals for the Mean of Non-normal Data Class 23, Jeremy Orloff and Jonathan Bloom
 Confidence Intervals for the Mean of Non-normal Data Class 23, 8.05 Jeremy Orloff and Jonathan Bloom Learning Goals. Be able to derive the formula for conservative normal confidence intervals for the proportion
Introduction to Game Theory
 COMP323 Introduction to Computational Game Theory Introduction to Game Theory Paul G. Spirakis Department of Computer Science University of Liverpool Paul G. Spirakis (U. Liverpool) Introduction to Game
Probability Models of Information Exchange on Networks Lecture 1
 Probability Models of Information Exchange on Networks Lecture 1 Elchanan Mossel UC Berkeley All Rights Reserved Motivating Questions How are collective decisions made by: people / computational agents
Theory and Applications of A Repeated Game Playing Algorithm. Rob Schapire Princeton University [currently visiting Yahoo!
 Theory and Applications of A Repeated Game Playing Algorithm Rob Schapire Princeton University [currently visiting Yahoo! Research] Learning Is (Often) Just a Game some learning problems: learn from training
Boosting: Foundations and Algorithms. Rob Schapire
 Boosting: Foundations and Algorithms Rob Schapire Example: Spam Filtering problem: filter out spam (junk email) gather large collection of examples of spam and non-spam: From: yoav@ucsd.edu Rob, can you
Chapter Goals. To introduce you to data collection
 Chapter Goals To introduce you to data collection You will learn to think critically about the data collected or presented learn various methods for selecting a sample Formulate Theories Interpret Results/Make
Regression #8: Loose Ends
 Regression #8: Loose Ends Econ 671 Purdue University Justin L. Tobias (Purdue) Regression #8 1 / 30 In this lecture we investigate a variety of topics that you are probably familiar with, but need to touch
Social Choice and Social Networks. Aggregation of General Biased Signals (DRAFT)
") Social Choice and Social Networks Aggregation of General Biased Signals (DRAFT) All rights reserved Elchanan Mossel UC Berkeley 8 Sep 2010 Extending Condorect s Jury Theorem We want to consider extensions
Social Choice and Social Networks Aggregation of General Biased Signals (DRAFT) All rights reserved Elchanan Mossel UC Berkeley 8 Sep 2010 Extending Condorect s Jury Theorem We want to consider extensions
Black White Total Observed Expected χ 2 = (f observed f expected ) 2 f expected (83 126) 2 ( )2 126
 2 f expected (83 126) 2 ( )2 126") Psychology 60 Fall 2013 Practice Final Actual Exam: This Wednesday. Good luck! Name: To view the solutions, check the link at the end of the document. This practice final should supplement your studying;
Psychology 60 Fall 2013 Practice Final Actual Exam: This Wednesday. Good luck! Name: To view the solutions, check the link at the end of the document. This practice final should supplement your studying;
CHOOSING THE RIGHT SAMPLING TECHNIQUE FOR YOUR RESEARCH. Awanis Ku Ishak, PhD SBM
 CHOOSING THE RIGHT SAMPLING TECHNIQUE FOR YOUR RESEARCH Awanis Ku Ishak, PhD SBM Sampling The process of selecting a number of individuals for a study in such a way that the individuals represent the larger
Algorithmic Game Theory and Applications
 Algorithmic Game Theory and Applications Lecture 18: Auctions and Mechanism Design II: a little social choice theory, the VCG Mechanism, and Market Equilibria Kousha Etessami Reminder: Food for Thought:
Section 7.1 How Likely are the Possible Values of a Statistic? The Sampling Distribution of the Proportion
 Section 7.1 How Likely are the Possible Values of a Statistic? The Sampling Distribution of the Proportion CNN / USA Today / Gallup Poll September 22-24, 2008 www.poll.gallup.com 12% of Americans describe
Physics 509: Non-Parametric Statistics and Correlation Testing
 Physics 509: Non-Parametric Statistics and Correlation Testing Scott Oser Lecture #19 Physics 509 1 What is non-parametric statistics? Non-parametric statistics is the application of statistical tests
Learning From Data Lecture 14 Three Learning Principles
 Learning From Data Lecture 14 Three Learning Principles Occam s Razor Sampling Bias Data Snooping M. Magdon-Ismail CSCI 4100/6100 recap: Validation and Cross Validation Validation Cross Validation D (N)
Are data normally normally distributed?
 Standard Normal Image source Are data normally normally distributed? Sample mean: 66.78 Sample standard deviation: 3.37 (66.78-1 x 3.37, 66.78 + 1 x 3.37) (66.78-2 x 3.37, 66.78 + 2 x 3.37) (66.78-3 x
UNIVERSITY OF MARYLAND Department of Economics Economics 754 Topics in Political Economy Fall 2005 Allan Drazen. Exercise Set I
 UNIVERSITY OF MARYLAND Department of Economics Economics 754 Topics in Political Economy Fall 005 Allan Drazen Exercise Set I The first four exercises are review of what we did in class on 8/31. The next
Chapter 5: Statistical Reasoning
 Chapter 5: Statistical Reasoning Section 5.1 Chapter 5: Statistical Reasoning Section 5.1 Exploring Data Terminology: Mean: A measure of central tendency determined by dividing the sum of all the values
Finite Dictatorships and Infinite Democracies
 Finite Dictatorships and Infinite Democracies Iian B. Smythe October 20, 2015 Abstract Does there exist a reasonable method of voting that when presented with three or more alternatives avoids the undue
Understanding Inference: Confidence Intervals I. Questions about the Assignment. The Big Picture. Statistic vs. Parameter. Statistic vs.
 Questions about the Assignment If your answer is wrong, but you show your work you can get more partial credit. Understanding Inference: Confidence Intervals I parameter versus sample statistic Uncertainty
MORE ON MULTIPLE REGRESSION
 DEPARTMENT OF POLITICAL SCIENCE AND INTERNATIONAL RELATIONS Posc/Uapp 816 MORE ON MULTIPLE REGRESSION I. AGENDA: A. Multiple regression 1. Categorical variables with more than two categories 2. Interaction
14.770: Introduction to Political Economy Lectures 1 and 2: Collective Choice and Voting
 14.770: Introduction to Political Economy Lectures 1 and 2: Collective Choice and Voting Daron Acemoglu MIT September 6 and 11, 2017. Daron Acemoglu (MIT) Political Economy Lectures 1 and 2 September 6
Practice Examination # 3
 Practice Examination # 3 Sta 23: Probability December 13, 212 This is a closed-book exam so do not refer to your notes, the text, or any other books (please put them on the floor). You may use a single
15: CHI SQUARED TESTS
 15: CHI SQUARED ESS MULIPLE CHOICE QUESIONS In the following multiple choice questions, please circle the correct answer. 1. Which statistical technique is appropriate when we describe a single population
CHAPTER 2 Estimating Probabilities
 CHAPTER 2 Estimating Probabilities Machine Learning Copyright c 2017. Tom M. Mitchell. All rights reserved. *DRAFT OF September 16, 2017* *PLEASE DO NOT DISTRIBUTE WITHOUT AUTHOR S PERMISSION* This is
Mean/Average Median Mode Range
 Normal Curves Today s Goals Normal curves! Before this we need a basic review of statistical terms. I mean basic as in underlying, not easy. We will learn how to retrieve statistical data from normal curves.
2.57 when the critical value is 1.96, what decision should be made?
 Math 1342 Ch. 9-10 Review Name SHORT ANSWER. Write the word or phrase that best completes each statement or answers the question. 9.1 1) If the test value for the difference between the means of two large
DIFFERENT APPROACHES TO STATISTICAL INFERENCE: HYPOTHESIS TESTING VERSUS BAYESIAN ANALYSIS
 DIFFERENT APPROACHES TO STATISTICAL INFERENCE: HYPOTHESIS TESTING VERSUS BAYESIAN ANALYSIS THUY ANH NGO 1. Introduction Statistics are easily come across in our daily life. Statements such as the average
AP Statistics Review Ch. 7
 AP Statistics Review Ch. 7 Name 1. Which of the following best describes what is meant by the term sampling variability? A. There are many different methods for selecting a sample. B. Two different samples
STA 291 Lecture 16. Normal distributions: ( mean and SD ) use table or web page. The sampling distribution of and are both (approximately) normal
 use table or web page. The sampling distribution of and are both (approximately) normal") STA 291 Lecture 16 Normal distributions: ( mean and SD ) use table or web page. The sampling distribution of and are both (approximately) normal X STA 291 - Lecture 16 1 Sampling Distributions Sampling
STA 291 Lecture 16 Normal distributions: ( mean and SD ) use table or web page. The sampling distribution of and are both (approximately) normal X STA 291 - Lecture 16 1 Sampling Distributions Sampling
Chapter 12: Model Specification and Development
 Chapter 12: Model Specification and Development Chapter 12 Outline Model Specification: Ramsey REgression Specification Error Test (RESET) o RESET Logic o Linear Demand Model o Constant Elasticity Demand
Statistics and Quantitative Analysis U4320. Segment 10 Prof. Sharyn O Halloran
 Statistics and Quantitative Analysis U4320 Segment 10 Prof. Sharyn O Halloran Key Points 1. Review Univariate Regression Model 2. Introduce Multivariate Regression Model Assumptions Estimation Hypothesis
Econometrics in a nutshell: Variation and Identification Linear Regression Model in STATA. Research Methods. Carlos Noton.
 1/17 Research Methods Carlos Noton Term 2-2012 Outline 2/17 1 Econometrics in a nutshell: Variation and Identification 2 Main Assumptions 3/17 Dependent variable or outcome Y is the result of two forces:
I CAN STATEMENTS 6TH GRADE SOCIAL STUDIES
 6TH GRADE SOCIAL STUDIES I can compare historical issues involving rights, roles and statues of individuals. I can describe the relationships among specialization, division of labor, productivity of workers
Probabilities & Statistics Revision
 Probabilities & Statistics Revision Christopher Ting Christopher Ting http://www.mysmu.edu/faculty/christophert/ : christopherting@smu.edu.sg : 6828 0364 : LKCSB 5036 January 6, 2017 Christopher Ting QF
TABLE A-1. Economic Variables Observations Variable Description 3 Month Maturity
 WEB APPENDIX for Fowler, James H. Elections and Markets: The Effect of Partisan Orientation, Policy isk, and Electoral Margins on the Economy, Journal of Politics Tables A-1 and A-2 explain how data are
CS168: The Modern Algorithmic Toolbox Lecture #7: Understanding Principal Component Analysis (PCA)
") CS68: The Modern Algorithmic Toolbox Lecture #7: Understanding Principal Component Analysis (PCA) Tim Roughgarden & Gregory Valiant April 0, 05 Introduction. Lecture Goal Principal components analysis
CS68: The Modern Algorithmic Toolbox Lecture #7: Understanding Principal Component Analysis (PCA) Tim Roughgarden & Gregory Valiant April 0, 05 Introduction. Lecture Goal Principal components analysis
Econ 325: Introduction to Empirical Economics
 Econ 325: Introduction to Empirical Economics Chapter 9 Hypothesis Testing: Single Population Ch. 9-1 9.1 What is a Hypothesis? A hypothesis is a claim (assumption) about a population parameter: population
Sampling : Error and bias
 Sampling : Error and bias Sampling definitions Sampling universe Sampling frame Sampling unit Basic sampling unit or elementary unit Sampling fraction Respondent Survey subject Unit of analysis Sampling