A proportion is the fraction of individuals having a particular attribute. Can range from 0 to 1!
|
|
|
- Barrie Jefferson
- 5 years ago
- Views:
Transcription
1 Proportions
2 A proportion is the fraction of individuals having a particular attribute. It is also the probability that an individual randomly sampled from the population will have that attribute Can range from 0 to 1!
3 Example: 2092 adult passengers on the Titanic; 654 survived Proportion of survivors = 654/
4 Probability that two out of three randomly chosen passengers survived the Titanic
5 Binomial distribution The binomial distribution describes the probability of a given number of "successes" from a fixed number of independent trials, when the probability of success is the same in each trial.
6 Binomial distribution Used when individuals can be divided into two (bi-) mutually exclusive named groups (-nomial). For example: Left handed or right handed Alive or dead University student or not university student We call the two groups successes vs. failures
7 Binomial distribution Probability of obtaining X left-handed flowers out of n = 27 randomly sampled, if the proportion of left-handed flowers in the population is 0.25!
8 n trials; p probability of success Pr[X ] = " $ # n X % ' p X ( 1 p) n X & Probability of X successes in n trials! Probability of a given ordered sequence of successes and failures that yield X successes in n trials! n choose X! The # of unique ordered sequences of successes and failures that yield X successes in n trials!
9 n trials; p probability of success Pr[X ] = " $ # n X % ' p X ( 1 p) n X & " n % $ ' = # X& n! X! ( n X)!
10 n! = n n-1 n ! 6! = = 720 0!=1 1!=1
11 Binomial distribution Assumptions: The number of trials (n) is fixed Separate trials are independent The probability of successes (p) is the same in every trial
12 Probability that two out of three randomly chosen passengers survived the Titanic " Pr[2] = $ 3% ' 0.3 # 2& ( ) 2 ( 1 0.3) 3 2 = 3! 2! 1! ( 0.3)2 ( 0.7) 1 = 3( 0.3) 2 ( 0.7) =0.189
13 Probability that two out of three randomly chosen passengers survived the Titanic " Pr[2] = $ 3% ' 0.3 # 2& Number of ways to get 2 survivors out of 3 passengers! ( ) 2 ( 1 0.3) 3 2 Probability of 2 survivors! Probability of 1 death!
14 Example: Paradise flycatchers A population of paradise flycatchers has 80% brown males and 20% white. Your field assistant captures 5 male flycatchers at random. What is the chance that 3 of those are brown and 2 are white?
15 Call brown success p = 0.8 n = 5 X = 3 Pr[3] = " 5 $ % ' (1 0.8) 5 3 = 120 # 3& (0.2) 2 = 0.205
16 In-class Exercise: What is the probability that 3 or more are brown?!
17 In-class Exercise: What is the probability that 3 or more are brown?! Pr 3 or more are brown [ ] = Pr[3]+ Pr 4 [ ] + Pr 5 [ ]
18 In-class Exercise: What is the probability that 3 or more are brown?! Pr 3 or more are brown [ ] = Pr[3]+ Pr 4 [ ] + Pr 5 [ ] Pr[3] =!!! Pr[4] =!!! Pr[5] =!! # "! # "! # " $ &0.8 3 (1 0.8) 5 3 = % $ &0.8 4 (1 0.8) 5 4 = % $ &0.8 5 = %
19 In-class Exercise: What is the probability that 3 or more are brown?! Pr 3 or more are brown [ ] = Pr[3]+ Pr 4 [ ] + Pr 5 [ ] = = 0.943
20 Assignment #3 Chapter 5: 28, 36, 37 Chapter 6: 16, 18, 19 Due this Friday Oct. 9 th by 2pm in your TA s homework box
21 Assignment #4 Chapter 7: 21, 22, 28 Due next Friday Oct. 16 th by 2pm in your TA s homework box
22 Reading For Today: Chapter 7 For Thursday: Chapter 8
23 Second part of Chapter 6 Review
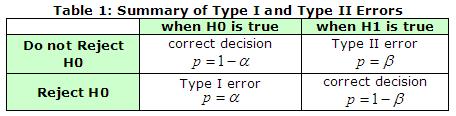
24 Significance level The acceptable probability of rejecting a true null hypothesis Called α For many purposes, α = 0.05 is acceptable
25 Type I error Rejecting a true null hypothesis False Positive Detecting an effect that is not present Probability of Type I error is α (the significance level)
26 Type II error Not rejecting a false null hypothesis False Negative Failing to detect and effect that is present The probability of a Type II error is β. The smaller β, the more power a test has.
27 Power The ability of a test to reject a false null hypothesis Power = 1- β
28
29 H o = No wolf present Type I error: Crying wolf when no wolf is present Type II error: Not crying wolf when there is a wolf present.
30 H o = Red- and blue-shirted athletes are equally likely to win (proportion = 0.5) Type I error: Concluding red- and blueshirted athletes are not equally likely to win, when they actually are. Type II error: Concluding red- and blueshirted athletes are equally likely to win, when they actually are not.
31 One- and two-tailed tests Most tests are two-tailed tests. This means that a deviation in either direction would reject the null hypothesis. Normally α is divided into α/2 on one side and α/2 on the other.
32 2.5% 2.5% Test statistic
33 First part of Chapter 7 Review
34 Binomial distribution The binomial distribution describes the probability of a given number of "successes" from a fixed number of independent trials, when the probability of success is the same in each trial.
35 Binomial distribution Probability of obtaining X left-handed flowers out of n = 27 randomly sampled, if the proportion of left-handed flowers in the population is 0.25!
36 n trials; p probability of success Pr[X ] = " $ # n X % ' p X ( 1 p) n X & Probability of X successes in n trials! Probability of a given ordered sequence of successes and failures that yield X successes in n trials! n choose X! The # of unique ordered sequences of successes and failures that yield X successes in n trials!
37 n trials; p probability of success Pr[X ] = " $ # n X % ' p X ( 1 p) n X & " n % $ ' = # X& n! X! ( n X)!


38 Example: Paradise flycatchers A population of paradise flycatchers has 80% brown males and 20% white. Your field assistant captures 5 male flycatchers at random.
39 In-class Exercise: What is the probability that 3 or more are brown?! Pr 3 or more are brown [ ] = Pr[3]+ Pr 4 [ ] + Pr 5 [ ] Pr[3] =!!! Pr[4] =!!! Pr[5] =!! # "! # "! # " $ &0.8 3 (1 0.8) 5 3 = % $ &0.8 4 (1 0.8) 5 4 = % $ &0.8 5 = %
40 Hypothesis testing on proportions The binomial test!
41 Binomial test The binomial test uses data to test whether a population proportion p matches a null expectation for the proportion. H 0 : The relative frequency of successes in the population is p 0. H A : The relative frequency of successes in the population is not p 0.
42 Binomial distribution Represents the sampling distribution for the number of successes (X) in a random sample of n trials, when the probability of success is the same in each trial Rather than using a computer to simulate a vast number of random samples, we can use this to calculate the null distribution!
43 Binomial distribution Probability of obtaining X left-handed flowers out of n = 27 randomly sampled, if the proportion of left-handed flowers in the population is 0.25!
44 Example An example: Imagine a student takes a multiple choice test before starting a statistics class. Each of the 10 questions on the test have 5 possible answers, only one of which is correct. This student gets 4 answers right. Can we deduce from this that this student knows anything at all about statistics?
45 Hypotheses H 0 : Student got correct answers randomly. H A : Student got more answers correct than random. This is properly a one-tailed test.!
46 Hypotheses H 0 : Student got correct answers randomly. H 0 : p = 0.2 H A : Student got more answers correct than random. H A : p > 0.2
47 N =10, p = 0.2 P = Pr[4] + Pr[5] + Pr[6] Pr[10] " = 10 % $ ' 0.2 # 4 & = 0.12 " ( ) 4 ( 0.8) 6 + $ 10 5 # % ' 0.2 & " ( ) 5 ( 0.8) 5 + $ 10 6 # % ' 0.2 & ( ) 6 ( 0.8) Note: The capital P here is used for the P-value, in contrast to the population proportion with a small p.
48 P = 0.12 This is greater than the α value of 0.05, so we would not reject the null hypothesis.! It is plausible that the student had four answers correct just by guessing randomly.!
49 Estimating Proportions: Proportion of successes in a sample p is the true population proportion! ˆp = X n The hat (^) shows that! this is an estimate of p.!
50 Standard error of the estimate of a proportion is the standard deviation of the sampling distribution σ ˆρ = p ( 1 p ) n
51 We usually don t know p so we estimate the standard error with ˆp SE ˆp = ˆp ( 1 ˆp ) n
52 A proportion is like a mean Yes = 1 No = 0 82/344 = (82* *0)/344 = 0.238
53 Variance of the estimate of a proportion is p(1-p) Case Worth It? Score (X) Mean (X-mean) (X-mean) 2 1 yes no no yes yes yes yes no yes no /10 =.6 (mean of proportion) = 2.4 (sum of squares) Variance = 2.4/10 = 0.6 * 0.4 = 0.24!!
54 We usually don t know p so we estimate the standard error with ˆp SE ˆp = ˆp ( 1 ˆp ) n
55 A larger sample has a lower standard error
56 The law of large numbers The greater the sample size, the closer an estimate of a proportion is likely to be to its true value.! ˆ p Sample size!
57 95% confidence interval for a proportion p " = X + 2 n + 4 $ & % p " 1.96 ( ) p " 1 p " n + 4 ' ) ( p $ p " p " 1 p " & % n + 4 ( ) ' ) ( This is the Agresti-Coull confidence interval!
58 Example: The daughters of radiologists 30 out of 87 offspring of male radiologists are males, and the rest female. What is the best estimate of the proportion of sons among radiologists?!
59 Example: The daughters of radiologists 30 out of 87 offspring of,male radiologists are males, and the rest female. What is the best estimate of the proportion of sons among radiologists?! pˆ = 30/87, or 0.345
60 Example: The daughters of radiologists 30 out of 87 offspring of male radiologists are males, and the rest female. What is the best estimate of the proportion of sons among radiologists? What is the 95% confidence interval for this estimate?! ˆ p = 30/87, or 0.345
61 Example: The daughters of radiologists 30 out of 87 offspring of male radiologists are males, and the rest female. What is the best estimate of the proportion of sons among radiologists? What is the 95% confidence interval for this estimate?! p " = X + 2 n + 4 = = 0.352
62 Example: The daughters of radiologists 30 out of 87 offspring of male radiologists are males, and the rest female. What is the best estimate of the proportion of sons among radiologists? What is the 95% confidence interval for this estimate?! p " = X + 2 n + 4 = = p! ±1.96 ( ) p! 1 p! n + 4 = ± ( ) = ± 0.098
63 Example: The daughters of radiologists 30 out of 87 offspring of male radiologists are males, and the rest female. What is the best estimate of the proportion of sons among radiologists? What is the 95% confidence interval for this estimate?! p " = X + 2 n + 4 = = p " ± Z ( ) p " 1 p " n + 4 = 0.352± ( ) = 0.352± < p < 0.450
CIVL /8904 T R A F F I C F L O W T H E O R Y L E C T U R E - 8
 CIVL - 7904/8904 T R A F F I C F L O W T H E O R Y L E C T U R E - 8 Chi-square Test How to determine the interval from a continuous distribution I = Range 1 + 3.322(logN) I-> Range of the class interval
Chapter 9 Inferences from Two Samples
 Chapter 9 Inferences from Two Samples 9-1 Review and Preview 9-2 Two Proportions 9-3 Two Means: Independent Samples 9-4 Two Dependent Samples (Matched Pairs) 9-5 Two Variances or Standard Deviations Review
STAT Chapter 9: Two-Sample Problems. Paired Differences (Section 9.3)
") STAT 515 -- Chapter 9: Two-Sample Problems Paired Differences (Section 9.3) Examples of Paired Differences studies: Similar subjects are paired off and one of two treatments is given to each subject in
STAT 515 -- Chapter 9: Two-Sample Problems Paired Differences (Section 9.3) Examples of Paired Differences studies: Similar subjects are paired off and one of two treatments is given to each subject in
Single Sample Means. SOCY601 Alan Neustadtl
 Single Sample Means SOCY601 Alan Neustadtl The Central Limit Theorem If we have a population measured by a variable with a mean µ and a standard deviation σ, and if all possible random samples of size
Visual interpretation with normal approximation
 Visual interpretation with normal approximation H 0 is true: H 1 is true: p =0.06 25 33 Reject H 0 α =0.05 (Type I error rate) Fail to reject H 0 β =0.6468 (Type II error rate) 30 Accept H 1 Visual interpretation
Statistical Inference for Means
 Statistical Inference for Means Jamie Monogan University of Georgia February 18, 2011 Jamie Monogan (UGA) Statistical Inference for Means February 18, 2011 1 / 19 Objectives By the end of this meeting,
Chapter. Hypothesis Testing with Two Samples. Copyright 2015, 2012, and 2009 Pearson Education, Inc. 1
 Chapter 8 Hypothesis Testing with Two Samples Copyright 2015, 2012, and 2009 Pearson Education, Inc 1 Two Sample Hypothesis Test Compares two parameters from two populations Sampling methods: Independent
Chapter 5 Confidence Intervals
 Chapter 5 Confidence Intervals Confidence Intervals about a Population Mean, σ, Known Abbas Motamedi Tennessee Tech University A point estimate: a single number, calculated from a set of data, that is
CHAPTER 10 Comparing Two Populations or Groups
 CHAPTER 10 Comparing Two Populations or Groups 10.1 Comparing Two Proportions The Practice of Statistics, 5th Edition Starnes, Tabor, Yates, Moore Bedford Freeman Worth Publishers Comparing Two Proportions
Data Analysis and Statistical Methods Statistics 651
 Data Analysis and Statistical Methods Statistics 651 http://www.stat.tamu.edu/~suhasini/teaching.html Lecture 26 (MWF) Tests and CI based on two proportions Suhasini Subba Rao Comparing proportions in
Inferences About Two Proportions
 Inferences About Two Proportions Quantitative Methods II Plan for Today Sampling two populations Confidence intervals for differences of two proportions Testing the difference of proportions Examples 1
Sampling Distribution of a Sample Proportion
 Sampling Distribution of a Sample Proportion Lecture 26 Section 8.4 Robb T. Koether Hampden-Sydney College Mon, Oct 10, 2011 Robb T. Koether (Hampden-Sydney College) Sampling Distribution of a Sample Proportion
Beyond p values and significance. "Accepting the null hypothesis" Power Utility of a result. Cohen Empirical Methods CS650
 Beyond p values and significance "Accepting the null hypothesis" Power Utility of a result Showing that things are NOT different Example: Oates and Heeringa wanted to show that their grammar induction
6.4 Type I and Type II Errors
 6.4 Type I and Type II Errors Ulrich Hoensch Friday, March 22, 2013 Null and Alternative Hypothesis Neyman-Pearson Approach to Statistical Inference: A statistical test (also known as a hypothesis test)
Mathematical Notation Math Introduction to Applied Statistics
 Mathematical Notation Math 113 - Introduction to Applied Statistics Name : Use Word or WordPerfect to recreate the following documents. Each article is worth 10 points and should be emailed to the instructor
Homework Exercises. 1. You want to conduct a test of significance for p the population proportion.
 Homework Exercises 1. You want to conduct a test of significance for p the population proportion. The test you will run is H 0 : p = 0.4 Ha: p > 0.4, n = 80. you decide that the critical value will be
3. DISCRETE PROBABILITY DISTRIBUTIONS
 1 3. DISCRETE PROBABILITY DISTRIBUTIONS Probability distributions may be discrete or continuous. This week we examine two discrete distributions commonly used in biology: the binomial and Poisson distributions.
CHAPTER 9, 10. Similar to a courtroom trial. In trying a person for a crime, the jury needs to decide between one of two possibilities:
 CHAPTER 9, 10 Hypothesis Testing Similar to a courtroom trial. In trying a person for a crime, the jury needs to decide between one of two possibilities: The person is guilty. The person is innocent. To
Epidemiology Wonders of Biostatistics Chapter 11 (continued) - probability in a single population. John Koval
 - probability in a single population. John Koval") Epidemiology 9509 Wonders of Biostatistics Chapter 11 (continued) - probability in a single population John Koval Department of Epidemiology and Biostatistics University of Western Ontario What is being
Epidemiology 9509 Wonders of Biostatistics Chapter 11 (continued) - probability in a single population John Koval Department of Epidemiology and Biostatistics University of Western Ontario What is being
HYPOTHESIS TESTING. Hypothesis Testing
 MBA 605 Business Analytics Don Conant, PhD. HYPOTHESIS TESTING Hypothesis testing involves making inferences about the nature of the population on the basis of observations of a sample drawn from the population.
Econ 325: Introduction to Empirical Economics
 Econ 325: Introduction to Empirical Economics Chapter 9 Hypothesis Testing: Single Population Ch. 9-1 9.1 What is a Hypothesis? A hypothesis is a claim (assumption) about a population parameter: population
Lecture Slides. Elementary Statistics Eleventh Edition. by Mario F. Triola. and the Triola Statistics Series 9.1-1
 Lecture Slides Elementary Statistics Eleventh Edition and the Triola Statistics Series by Mario F. Triola Copyright 2010, 2007, 2004 Pearson Education, Inc. All Rights Reserved. 9.1-1 Chapter 9 Inferences
Discrete distribution. Fitting probability models to frequency data. Hypotheses for! 2 test. ! 2 Goodness-of-fit test
 Discrete distribution Fitting probability models to frequency data A probability distribution describing a discrete numerical random variable For example,! Number of heads from 10 flips of a coin! Number
Class 24. Daniel B. Rowe, Ph.D. Department of Mathematics, Statistics, and Computer Science. Marquette University MATH 1700
 Class 4 Daniel B. Rowe, Ph.D. Department of Mathematics, Statistics, and Computer Science Copyright 013 by D.B. Rowe 1 Agenda: Recap Chapter 9. and 9.3 Lecture Chapter 10.1-10.3 Review Exam 6 Problem Solving
Chapter 22. Comparing Two Proportions 1 /29
 Chapter 22 Comparing Two Proportions 1 /29 Homework p519 2, 4, 12, 13, 15, 17, 18, 19, 24 2 /29 Objective Students test null and alternate hypothesis about two population proportions. 3 /29 Comparing Two
Performance Evaluation and Comparison
 Outline Hong Chang Institute of Computing Technology, Chinese Academy of Sciences Machine Learning Methods (Fall 2012) Outline Outline I 1 Introduction 2 Cross Validation and Resampling 3 Interval Estimation
Chapter 22. Comparing Two Proportions. Bin Zou STAT 141 University of Alberta Winter / 15
 Chapter 22 Comparing Two Proportions Bin Zou (bzou@ualberta.ca) STAT 141 University of Alberta Winter 2015 1 / 15 Introduction In Ch.19 and Ch.20, we studied confidence interval and test for proportions,
Math 140 Introductory Statistics
 Math 140 Introductory Statistics Extra hours at the tutoring center Fri Dec 3rd 10-4pm, Sat Dec 4 11-2 pm Final Dec 14th 5:30-7:30pm CH 5122 Last time: Making decisions We have a null hypothesis We have
Harvard University. Rigorous Research in Engineering Education
 Statistical Inference Kari Lock Harvard University Department of Statistics Rigorous Research in Engineering Education 12/3/09 Statistical Inference You have a sample and want to use the data collected
GROUPED DATA E.G. FOR SAMPLE OF RAW DATA (E.G. 4, 12, 7, 5, MEAN G x / n STANDARD DEVIATION MEDIAN AND QUARTILES STANDARD DEVIATION
 FOR SAMPLE OF RAW DATA (E.G. 4, 1, 7, 5, 11, 6, 9, 7, 11, 5, 4, 7) BE ABLE TO COMPUTE MEAN G / STANDARD DEVIATION MEDIAN AND QUARTILES Σ ( Σ) / 1 GROUPED DATA E.G. AGE FREQ. 0-9 53 10-19 4...... 80-89
Business Statistics: Lecture 8: Introduction to Estimation & Hypothesis Testing
 Business Statistics: Lecture 8: Introduction to Estimation & Hypothesis Testing Agenda Introduction to Estimation Point estimation Interval estimation Introduction to Hypothesis Testing Concepts en terminology
STAT Chapter 8: Hypothesis Tests
 STAT 515 -- Chapter 8: Hypothesis Tests CIs are possibly the most useful forms of inference because they give a range of reasonable values for a parameter. But sometimes we want to know whether one particular
" M A #M B. Standard deviation of the population (Greek lowercase letter sigma) σ 2
 σ 2") Notation and Equations for Final Exam Symbol Definition X The variable we measure in a scientific study n The size of the sample N The size of the population M The mean of the sample µ The mean of the
Notation and Equations for Final Exam Symbol Definition X The variable we measure in a scientific study n The size of the sample N The size of the population M The mean of the sample µ The mean of the
Lecture Slides. Elementary Statistics. Tenth Edition. by Mario F. Triola. and the Triola Statistics Series
 Lecture Slides Elementary Statistics Tenth Edition and the Triola Statistics Series by Mario F. Triola Slide 1 Chapter 7 Estimates and Sample Sizes 7-1 Overview 7-2 Estimating a Population Proportion 7-3
Chapter 15 Sampling Distribution Models
 Chapter 15 Sampling Distribution Models 1 15.1 Sampling Distribution of a Proportion 2 Sampling About Evolution According to a Gallup poll, 43% believe in evolution. Assume this is true of all Americans.
Chapter 24. Comparing Means
 Chapter 4 Comparing Means!1 /34 Homework p579, 5, 7, 8, 10, 11, 17, 31, 3! /34 !3 /34 Objective Students test null and alternate hypothesis about two!4 /34 Plot the Data The intuitive display for comparing
Hypothesis Testing. ECE 3530 Spring Antonio Paiva
 Hypothesis Testing ECE 3530 Spring 2010 Antonio Paiva What is hypothesis testing? A statistical hypothesis is an assertion or conjecture concerning one or more populations. To prove that a hypothesis is
10.1. Comparing Two Proportions. Section 10.1
 /6/04 0. Comparing Two Proportions Sectio0. Comparing Two Proportions After this section, you should be able to DETERMINE whether the conditions for performing inference are met. CONSTRUCT and INTERPRET
This is particularly true if you see long tails in your data. What are you testing? That the two distributions are the same!
 Two sample tests (part II): What to do if your data are not distributed normally: Option 1: if your sample size is large enough, don't worry - go ahead and use a t-test (the CLT will take care of non-normal
Statistical Inference. Why Use Statistical Inference. Point Estimates. Point Estimates. Greg C Elvers
 Statistical Inference Greg C Elvers 1 Why Use Statistical Inference Whenever we collect data, we want our results to be true for the entire population and not just the sample that we used But our sample
LECTURE 12 CONFIDENCE INTERVAL AND HYPOTHESIS TESTING
 LECTURE 1 CONFIDENCE INTERVAL AND HYPOTHESIS TESTING INTERVAL ESTIMATION Point estimation of : The inference is a guess of a single value as the value of. No accuracy associated with it. Interval estimation
Chapter 6 Estimation and Sample Sizes
 Chapter 6 Estimation and Sample Sizes This chapter presents the beginning of inferential statistics.! The two major applications of inferential statistics! Estimate the value of a population parameter!
STAT 515 fa 2016 Lec Statistical inference - hypothesis testing
 STAT 515 fa 2016 Lec 20-21 Statistical inference - hypothesis testing Karl B. Gregory Wednesday, Oct 12th Contents 1 Statistical inference 1 1.1 Forms of the null and alternate hypothesis for µ and p....................
Chapter Six: Two Independent Samples Methods 1/51
 Chapter Six: Two Independent Samples Methods 1/51 6.3 Methods Related To Differences Between Proportions 2/51 Test For A Difference Between Proportions:Introduction Suppose a sampling distribution were
Chapter 22. Comparing Two Proportions 1 /30
 Chapter 22 Comparing Two Proportions 1 /30 Homework p519 2, 4, 12, 13, 15, 17, 18, 19, 24 2 /30 3 /30 Objective Students test null and alternate hypothesis about two population proportions. 4 /30 Comparing
Topic 3: Sampling Distributions, Confidence Intervals & Hypothesis Testing. Road Map Sampling Distributions, Confidence Intervals & Hypothesis Testing
 Topic 3: Sampling Distributions, Confidence Intervals & Hypothesis Testing ECO22Y5Y: Quantitative Methods in Economics Dr. Nick Zammit University of Toronto Department of Economics Room KN3272 n.zammit
Lecture 11 - Tests of Proportions
 Lecture 11 - Tests of Proportions Statistics 102 Colin Rundel February 27, 2013 Research Project Research Project Proposal - Due Friday March 29th at 5 pm Introduction, Data Plan Data Project - Due Friday,
Introduction to Statistical Hypothesis Testing
 Introduction to Statistical Hypothesis Testing Arun K. Tangirala Power of Hypothesis Tests Arun K. Tangirala, IIT Madras Intro to Statistical Hypothesis Testing 1 Learning objectives I Computing Pr(Type
Sampling Distributions
 Sampling Distributions Sampling Distribution of the Mean & Hypothesis Testing Remember sampling? Sampling Part 1 of definition Selecting a subset of the population to create a sample Generally random sampling
The enumeration of all possible outcomes of an experiment is called the sample space, denoted S. E.g.: S={head, tail}
 Random Experiment In random experiments, the result is unpredictable, unknown prior to its conduct, and can be one of several choices. Examples: The Experiment of tossing a coin (head, tail) The Experiment
AMS7: WEEK 7. CLASS 1. More on Hypothesis Testing Monday May 11th, 2015
 AMS7: WEEK 7. CLASS 1 More on Hypothesis Testing Monday May 11th, 2015 Testing a Claim about a Standard Deviation or a Variance We want to test claims about or 2 Example: Newborn babies from mothers taking
Statistics 135 Fall 2007 Midterm Exam
 Name: Student ID Number: Statistics 135 Fall 007 Midterm Exam Ignore the finite population correction in all relevant problems. The exam is closed book, but some possibly useful facts about probability
Lecture 7: Hypothesis Testing and ANOVA
 Lecture 7: Hypothesis Testing and ANOVA Goals Overview of key elements of hypothesis testing Review of common one and two sample tests Introduction to ANOVA Hypothesis Testing The intent of hypothesis
DETERMINE whether the conditions for performing inference are met. CONSTRUCT and INTERPRET a confidence interval to compare two proportions.
 Section 0. Comparing Two Proportions Learning Objectives After this section, you should be able to DETERMINE whether the conditions for performing inference are met. CONSTRUCT and INTERPRET a confidence
p = q ˆ = 1 -ˆp = sample proportion of failures in a sample size of n x n Chapter 7 Estimates and Sample Sizes
 Chapter 7 Estimates and Sample Sizes 7-1 Overview 7-2 Estimating a Population Proportion 7-3 Estimating a Population Mean: σ Known 7-4 Estimating a Population Mean: σ Not Known 7-5 Estimating a Population
Lab #12: Exam 3 Review Key
 Psychological Statistics Practice Lab#1 Dr. M. Plonsky Page 1 of 7 Lab #1: Exam 3 Review Key 1) a. Probability - Refers to the likelihood that an event will occur. Ranges from 0 to 1. b. Sampling Distribution
Statistical Analysis for QBIC Genetics Adapted by Ellen G. Dow 2017
 Statistical Analysis for QBIC Genetics Adapted by Ellen G. Dow 2017 I. χ 2 or chi-square test Objectives: Compare how close an experimentally derived value agrees with an expected value. One method to
Slides for Data Mining by I. H. Witten and E. Frank
 Slides for Data Mining by I. H. Witten and E. Frank Predicting performance Assume the estimated error rate is 5%. How close is this to the true error rate? Depends on the amount of test data Prediction
Chapter 12 - Lecture 2 Inferences about regression coefficient
 Chapter 12 - Lecture 2 Inferences about regression coefficient April 19th, 2010 Facts about slope Test Statistic Confidence interval Hypothesis testing Test using ANOVA Table Facts about slope In previous
The Components of a Statistical Hypothesis Testing Problem
 Statistical Inference: Recall from chapter 5 that statistical inference is the use of a subset of a population (the sample) to draw conclusions about the entire population. In chapter 5 we studied one
Soc 3811 Basic Social Statistics Second Midterm Exam Spring Your Name [50 points]: ID #: ANSWERS
![Soc 3811 Basic Social Statistics Second Midterm Exam Spring Your Name [50 points]: ID #: ANSWERS](/thumbs/87/95432281.jpg "Soc 3811 Basic Social Statistics Second Midterm Exam Spring Your Name [50 points]: ID #: ANSWERS") Soc 3811 Basic Social Statistics Second idterm Exam Spring 010 our Name [50 points]: ID #: INSTRUCTIONS: ANSERS (A) rite your name on the line at top front of every sheet. (B) If you use a page of notes
Soc 3811 Basic Social Statistics Second idterm Exam Spring 010 our Name [50 points]: ID #: INSTRUCTIONS: ANSERS (A) rite your name on the line at top front of every sheet. (B) If you use a page of notes
Announcements. Final Review: Units 1-7
 Announcements Announcements Final : Units 1-7 Statistics 104 Mine Çetinkaya-Rundel June 24, 2013 Final on Wed: cheat sheet (one sheet, front and back) and calculator Must have webcam + audio on at all
Mathematical Notation Math Introduction to Applied Statistics
 Mathematical Notation Math 113 - Introduction to Applied Statistics Name : Use Word or WordPerfect to recreate the following documents. Each article is worth 10 points and can be printed and given to the
Random Sampling - what did we learn?
 Homework Assignment Chapter 1, Problems 6, 15 Chapter 2, Problems 6, 8, 9, 12 Chapter 3, Problems 4, 6, 15 Chapter 4, Problem 16 Due a week from Friday: Sept. 22, 12 noon. Your TA will tell you where to
Random Sampling - what did we learn? Homework Assignment
 Homework Assignment Chapter 1, Problems 6, 15 Chapter 2, Problems 6, 8, 9, 12 Chapter 3, Problems 4, 6, 15 Chapter 4, Problem 16 Due a week from Friday: Sept. 22, 12 noon. Your TA will tell you where to
Difference Between Pair Differences v. 2 Samples
 1 Sectio1.1 Comparing Two Proportions Learning Objectives After this section, you should be able to DETERMINE whether the conditions for performing inference are met. CONSTRUCT and INTERPRET a confidence
1 Descriptive statistics. 2 Scores and probability distributions. 3 Hypothesis testing and one-sample t-test. 4 More on t-tests
 Overall Overview INFOWO Statistics lecture S3: Hypothesis testing Peter de Waal Department of Information and Computing Sciences Faculty of Science, Universiteit Utrecht 1 Descriptive statistics 2 Scores
Lecture 26 Section 8.4. Wed, Oct 14, 2009
 PDFs n = Lecture 26 Section 8.4 Hampden-Sydney College Wed, Oct 14, 2009 Outline PDFs n = 1 2 PDFs n = 3 4 5 6 Outline PDFs n = 1 2 PDFs n = 3 4 5 6 PDFs n = Exercise 8.12, page 528. Suppose that 60% of
Statistics Primer. ORC Staff: Jayme Palka Peter Boedeker Marcus Fagan Trey Dejong
 Statistics Primer ORC Staff: Jayme Palka Peter Boedeker Marcus Fagan Trey Dejong 1 Quick Overview of Statistics 2 Descriptive vs. Inferential Statistics Descriptive Statistics: summarize and describe data
Charles Geyer University of Minnesota. joint work with. Glen Meeden University of Minnesota.
 Fuzzy Confidence Intervals and P -values Charles Geyer University of Minnesota joint work with Glen Meeden University of Minnesota http://www.stat.umn.edu/geyer/fuzz 1 Ordinary Confidence Intervals OK
Elementary Statistics Triola, Elementary Statistics 11/e Unit 17 The Basics of Hypotheses Testing
 (Section 8-2) Hypotheses testing is not all that different from confidence intervals, so let s do a quick review of the theory behind the latter. If it s our goal to estimate the mean of a population,
Section 6.2 Hypothesis Testing
 Section 6.2 Hypothesis Testing GIVEN: an unknown parameter, and two mutually exclusive statements H 0 and H 1 about. The Statistician must decide either to accept H 0 or to accept H 1. This kind of problem
Hypothesis Tests and Estimation for Population Variances. Copyright 2014 Pearson Education, Inc.
 Hypothesis Tests and Estimation for Population Variances 11-1 Learning Outcomes Outcome 1. Formulate and carry out hypothesis tests for a single population variance. Outcome 2. Develop and interpret confidence
Sections 7.1 and 7.2. This chapter presents the beginning of inferential statistics. The two major applications of inferential statistics
 Sections 7.1 and 7.2 This chapter presents the beginning of inferential statistics. The two major applications of inferential statistics Estimate the value of a population parameter Test some claim (or
Stat 135, Fall 2006 A. Adhikari HOMEWORK 6 SOLUTIONS
 Stat 135, Fall 2006 A. Adhikari HOMEWORK 6 SOLUTIONS 1a. Under the null hypothesis X has the binomial (100,.5) distribution with E(X) = 50 and SE(X) = 5. So P ( X 50 > 10) is (approximately) two tails
Business Statistics MEDIAN: NON- PARAMETRIC TESTS
 Business Statistics MEDIAN: NON- PARAMETRIC TESTS CONTENTS Hypotheses on the median The sign test The Wilcoxon signed ranks test Old exam question HYPOTHESES ON THE MEDIAN The median is a central value
Formulas and Tables. for Essentials of Statistics, by Mario F. Triola 2002 by Addison-Wesley. ˆp E p ˆp E Proportion.
 Formulas and Tables for Essentials of Statistics, by Mario F. Triola 2002 by Addison-Wesley. Ch. 2: Descriptive Statistics x Sf. x x Sf Mean S(x 2 x) 2 s Å n 2 1 n(sx 2 ) 2 (Sx) 2 s Å n(n 2 1) Mean (frequency
Interpret Standard Deviation. Outlier Rule. Describe the Distribution OR Compare the Distributions. Linear Transformations SOCS. Interpret a z score
 Interpret Standard Deviation Outlier Rule Linear Transformations Describe the Distribution OR Compare the Distributions SOCS Using Normalcdf and Invnorm (Calculator Tips) Interpret a z score What is an
1 Hypothesis testing for a single mean
 This work is licensed under a Creative Commons Attribution-NonCommercial-ShareAlike License. Your use of this material constitutes acceptance of that license and the conditions of use of materials on this
INTERVAL ESTIMATION AND HYPOTHESES TESTING
 INTERVAL ESTIMATION AND HYPOTHESES TESTING 1. IDEA An interval rather than a point estimate is often of interest. Confidence intervals are thus important in empirical work. To construct interval estimates,
Summary: the confidence interval for the mean (σ 2 known) with gaussian assumption
 with gaussian assumption") Summary: the confidence interval for the mean (σ known) with gaussian assumption on X Let X be a Gaussian r.v. with mean µ and variance σ. If X 1, X,..., X n is a random sample drawn from X then the confidence
Summary: the confidence interval for the mean (σ known) with gaussian assumption on X Let X be a Gaussian r.v. with mean µ and variance σ. If X 1, X,..., X n is a random sample drawn from X then the confidence
A Probability Primer. A random walk down a probabilistic path leading to some stochastic thoughts on chance events and uncertain outcomes.
 A Probability Primer A random walk down a probabilistic path leading to some stochastic thoughts on chance events and uncertain outcomes. Are you holding all the cards?? Random Events A random event, E,
Chapter 8. Inferences Based on a Two Samples Confidence Intervals and Tests of Hypothesis
 Chapter 8 Inferences Based on a Two Samples Confidence Intervals and Tests of Hypothesis Copyright 2018, 2014, and 2011 Pearson Education, Inc. Slide - 1 Content 1. Identifying the Target Parameter 2.
Summary of Chapters 7-9
 Summary of Chapters 7-9 Chapter 7. Interval Estimation 7.2. Confidence Intervals for Difference of Two Means Let X 1,, X n and Y 1, Y 2,, Y m be two independent random samples of sizes n and m from two
Chapter 16: Understanding Relationships Numerical Data
 Chapter 16: Understanding Relationships Numerical Data These notes reflect material from our text, Statistics, Learning from Data, First Edition, by Roxy Peck, published by CENGAGE Learning, 2015. Linear
Lecture 9 Two-Sample Test. Fall 2013 Prof. Yao Xie, H. Milton Stewart School of Industrial Systems & Engineering Georgia Tech
 Lecture 9 Two-Sample Test Fall 2013 Prof. Yao Xie, yao.xie@isye.gatech.edu H. Milton Stewart School of Industrial Systems & Engineering Georgia Tech Computer exam 1 18 Histogram 14 Frequency 9 5 0 75 83.33333333
COGS 14B: INTRODUCTION TO STATISTICAL ANALYSIS
 COGS 14B: INTRODUCTION TO STATISTICAL ANALYSIS TA: Sai Chowdary Gullapally scgullap@eng.ucsd.edu Office Hours: Thursday (Mandeville) 3:30PM - 4:30PM (or by appointment) Slides: I am using the amazing slides
Difference between means - t-test /25
 Difference between means - t-test 1 Discussion Question p492 Ex 9-4 p492 1-3, 6-8, 12 Assume all variances are not equal. Ignore the test for variance. 2 Students will perform hypothesis tests for two
Module 10: Analysis of Categorical Data Statistics (OA3102)
") Module 10: Analysis of Categorical Data Statistics (OA3102) Professor Ron Fricker Naval Postgraduate School Monterey, California Reading assignment: WM&S chapter 14.1-14.7 Revision: 3-12 1 Goals for this
Module 10: Analysis of Categorical Data Statistics (OA3102) Professor Ron Fricker Naval Postgraduate School Monterey, California Reading assignment: WM&S chapter 14.1-14.7 Revision: 3-12 1 Goals for this
Practice Final Exam ANSWER KEY Chapters 7-13
 Practice Final Exam ANSWER KEY Chapters 7-13 1. 0.0410 (normal) 2. 0.7580 (normal) 3. 66.09 (reverse normal) 4. The critical value for a sample size of n = 6 is 0.888. Since the value of r (0.974) is greater
The t-test: A z-score for a sample mean tells us where in the distribution the particular mean lies
 The t-test: So Far: Sampling distribution benefit is that even if the original population is not normal, a sampling distribution based on this population will be normal (for sample size > 30). Benefit
CHAPTER 8. Test Procedures is a rule, based on sample data, for deciding whether to reject H 0 and contains:
 CHAPTER 8 Test of Hypotheses Based on a Single Sample Hypothesis testing is the method that decide which of two contradictory claims about the parameter is correct. Here the parameters of interest are
Lab #11. Variable B. Variable A Y a b a+b N c d c+d a+c b+d N = a+b+c+d
 BIOS 4120: Introduction to Biostatistics Breheny Lab #11 We will explore observational studies in today s lab and review how to make inferences on contingency tables. We will only use 2x2 tables for today
How do we compare the relative performance among competing models?
 How do we compare the relative performance among competing models? 1 Comparing Data Mining Methods Frequent problem: we want to know which of the two learning techniques is better How to reliably say Model
Statistics for Managers Using Microsoft Excel/SPSS Chapter 8 Fundamentals of Hypothesis Testing: One-Sample Tests
 Statistics for Managers Using Microsoft Excel/SPSS Chapter 8 Fundamentals of Hypothesis Testing: One-Sample Tests 1999 Prentice-Hall, Inc. Chap. 8-1 Chapter Topics Hypothesis Testing Methodology Z Test
y = a + bx 12.1: Inference for Linear Regression Review: General Form of Linear Regression Equation Review: Interpreting Computer Regression Output
 12.1: Inference for Linear Regression Review: General Form of Linear Regression Equation y = a + bx y = dependent variable a = intercept b = slope x = independent variable Section 12.1 Inference for Linear
Sampling Distribution of a Sample Proportion
 Sampling Distribution of a Sample Proportion Lecture 26 Section 8.4 Robb T. Koether Hampden-Sydney College Mon, Mar 1, 2010 Robb T. Koether (Hampden-Sydney College) Sampling Distribution of a Sample Proportion
16.400/453J Human Factors Engineering. Design of Experiments II
 J Human Factors Engineering Design of Experiments II Review Experiment Design and Descriptive Statistics Research question, independent and dependent variables, histograms, box plots, etc. Inferential
Sampling Distributions: Central Limit Theorem
 Review for Exam 2 Sampling Distributions: Central Limit Theorem Conceptually, we can break up the theorem into three parts: 1. The mean (µ M ) of a population of sample means (M) is equal to the mean (µ)
1; (f) H 0 : = 55 db, H 1 : < 55.
 H 0 : = 55 db, H 1 : < 55.") Reference: Chapter 8 of J. L. Devore s 8 th Edition By S. Maghsoodloo TESTING a STATISTICAL HYPOTHESIS A statistical hypothesis is an assumption about the frequency function(s) (i.e., pmf or pdf) of one
Reference: Chapter 8 of J. L. Devore s 8 th Edition By S. Maghsoodloo TESTING a STATISTICAL HYPOTHESIS A statistical hypothesis is an assumption about the frequency function(s) (i.e., pmf or pdf) of one