Two-sample testing with high-dimensional genetic and neuroimaging data
|
|
|
- Laurel Page
- 5 years ago
- Views:
Transcription
1 Two-sample testing with high-dimensional genetic and neuroimaging data Wei Pan Division of Biostatistics, School of Public Health, University of Minnesota, Minneapolis, MN Nov 4, 2016 University of Georgia
2 Outline Introduction: 1. Polygenic testing in GWAS; 2. Functional connectivity (FC). Methods: 2-sample tests for high-dim data, Review: some existing tests; New: SPU/aSPU; (Pan et al 2014, Genetics) Theory: (Xu, Lin, Wei & Pan 2016, Biometrika) Applications and simulations. Discussion.
3 Introduction Application 1: Polygenic testing Example: the International Schizophrenia Consortium (ISC) (2009, Nature) n 1 = 3322 schizophrenia patients, n 2 = 3587 controls. p = 1 million SNPs (single nucleotide polymorphsims) (coded 0, 1 or 2 for each). Any SNP associated with schizophrenia? univariate testing; high cost of multiple tests: genome-wide significance level ; None found! Dark matter in genetics: missing heritability from genome-wide association studies (GWAS); Any association?

4
,")
5 Figure: ISC (2009, Nature), Fig S3.

6

7
8
9 Figure: Our approach and results.
10 Introduction Application 2: functional connectivity (FC) Why? How? Problem: based on fmri data, estimate a functional connectivity (FC) network for each subject using Pearson s (marginal) correlations (or partial correlations or...). Key Q: group comparisons Existinng approaches: univariate testing; network summary statistics;... Powerful/flexible enough?
11

12 Figure: Li and Wang 2015, Front. Neurosci., Fig 2.

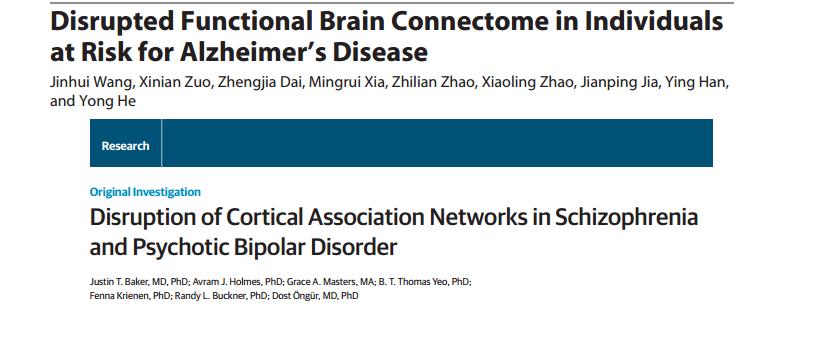
13 Figure: Baker et al 2014, JAMA Psychiatry, Fig 1.

14 Figure: Baker et al 2014, JAMA Psychiatry, Fig 2.

15 Figure: Our approach and results.
16 Problem formulation: two-sample testing Set-up: two samples, {X 1i, i = 1, 2,..., n 1 } and {X 2j, j = 1, 2,..., n 2 } with p > max{n 1, n 2 }. H 0 : µ 1 = µ 2. (Or more generally, H 0 : F 1 = F 2.) Sample means and covariance matrices: n = n 1 + n 2, X k = n k i=1 X ki/n k. S = 2 nk ( k=1 i=1 Xki X ) ( k Xki X ) T k /n. Comment: here we assume Σ 1 = Σ 2 ; not necessary. Classic Hotelling s (1951) T 2 -test, T H = ( X1 X 2 ) T S 1 ( X1 X 2 ). (1) =t-test (or z-test) if p = 1. not working if p > n: S is singular; bad even p n.
17 Review: some existing tests Bai and Saranadasa (1996, Statistica Sinica): T BS = n 1 n 2 n 1 +n ( X1 2 X ) T 2 ( X1 X ) 2 trs (trs 2 n 1 (trs) 2), 2n(n+1) (n 1)(n+2) D Under H 0, T BS N(0, 1). Chen et al (2010, Ann Statist): n1 i j XT 1i X 1j n 1 (n 1 1) + n2 i j XT 2i X 2j n 2 (n 2 1) 2 n1 n2 i=1 j=1 T CQ = XT 1i X 2j, n 1 n 2 (2) which results after removing n k i=1 XT ki X ki for k = 1, 2 from X1 X 2 2. Hence T n µ 1 µ 2 2 Var(Tn ) as n and p. D N(0, 1) (3)
18 Review: some existing tests Cai, Liu and Xia (2014, JRSS-B): T CLX = n 1n 2 n 1 + n 2 ( X(i) max 1 1 i p ) (i) 2 / X 2 σ ii, with σ ii (always) replaced by S ii ; follows an asymptotic extreme value distribution under H 0.
19 Chen, Li and Zhong (2014): T CLZ (s) = p i=1 { n1 n ( X(i) 2 1 n 1 + n 2 I { n1 n ( X(i) 2 1 n 1 + n 2 ) (i) 2 / } X 2 σ ii 1 ) (i) 2 / } X 2 σ ii > λ p (s), T CLZ = max s (0,1 η) T CLZ (s) ˆµ TCLZ (s),0, ˆσ TCLZ (s),0 follows an asymptotic extreme value distribution under H 0.
20 Srivastava and Du (1998, JMA): T SD = ) ( X 1 X 2 np n 2, 2 (tr R 2 p 2 /n) c p,n n 1 n 2 n 1 +n ( X1 2 X ) T 2 D 1 S with D S := diag(s), R := D 1/2 c p,n = 1 + tr R 2 /p 3/2. S SD 1/2 S, and
21 New: SPU and aspu tests Sum of Powered Score (SPU) test: for a positive integer γ, SPU(γ) = p i=1 ( X(i) 1 ) (i) γ X 2. (4) Key: a larger γ makes the rich get richer! SPU(γ) X 1 X 2 γ X 1 X 2 = max X (i) (i) 1 X 2 i as (an even) γ. define Weighting: ( X(i) SPU( ) = max 1 1 i p ( X(i) 1 ) (i) γ X ( X(i) 2 = 1 ) (i) 2 / X 2 σ ii. ) (i) γ 1 X ( X(i) 2 1 ) (i) X 2.
22 New: SPU and aspu tests Remarks: Chen et al (2010): SPU(2); Cai et al (2014): SPU( ); Chen et al (2014): tspu(2) aspu(2)=assu (Pan& Shen 2011, Genet Epi); PRS (Pan et al 2015, Genet Epi); SPU(1) =Sum =Burden test in rare variant (RV) analysis... SPU(2) = KMR/SKAT = MDMR/PERMANOVA if... (Pan 2011, Genet Epi) Q: which γ to use? Key: no uniformly most powerful test. Define an adaptive SPU (aspu) test: e.g., Γ = {1, 2,..., 8, }. aspu = min γ Γ P SPU(γ)
23 Theorem for SPU tests Let Γ be a set of finite positive integers. Under H 0, we have {σ(γ) 1 (SPU(γ) µ(γ)) : γ Γ} d N(0, ξ), and for x R, { P(nSPU( ) a p x) exp 1 ( exp x ) } π 2 as n, p, where a p = 2 log p log log p and n = n 1 n 2 /(n 1 + n 2 ). Moreover, {σ(γ) 1 (SPU(γ) µ(γ)) : γ Γ} and nspu( ) a p are asymptotically independent.
24 P-value calculations Asymptotics: p O = 1 N(0, R O )ds, s=(sγ : odd γ Γ) T T O sγ T O p E = 1 N(0, R E )dt, t=(tγ : even γ Γ) T <tγ T E p min := min{p O, p E, p }, p aspu = 1 (1 p min ) 3. Permutations: permuting group labels.
25 Approximation for µ(γ) µ(γ) = p Under the null hypothesis H 0 : µ 1 = µ 2, 0, i p i=1 σγ/2 ii + o( p ), i n γ/2 γ! γ/2 1 2 γ/2 d=0 d!(γ/2 d)!n1 d nγ/2 d 2 γ/2 γ! d=1 (d 1)!( γ/2 d)!3!2 γ/2 1 i=1 ( m 1i n d+1 1 n γ/2 d 2 m 2i n γ/2 d 1 n d+1 2 ) σ γ/2 1 ii + o( ), n γ/2 +1 where m ki is the third central moment of the[ random variablein component i from group k, i.e., m ki = E (X (i) k µ(i) k ]. )3 p i
26 Approximation for σ(γ) Under some regularity conditions and H 0 : µ 1 = µ 2, when γ = 1, ( 1 σ 2 (1) = + 1 ) 1 T Σ1, n 1 n 2 where 1 is a p-dimensional vector with all elements 1; for γ 2, σ 2 (γ) µ(2γ) 2c 1 +c 3 +2d 1 +d 3 =γ 2c 2 +c 3 +2d 2 +d 3 =γ c 1,c 2,d 1,d 2 0,c 3 +d 3 >0 p [µ (i) (γ)] 2 + i=1 (γ!) 2 i j σc 1+d 1 ii σ c 2+d 2 jj σ c 3+d 3 ij n c 1+c 2 +c 3 1 n d 1+d 2 +d 3 2 c 1!c 2!c 3!d 1!d 2!d 3!2 c 1+c 2 +d 1 +d 2.
27 Simulations Simulation set-ups follow Chen et al (2014). n 1 = n 2 = 50, p = 200. Under H 0, µ 1 = µ 2 = 0; under H 1, µ 1 = 0, and µ 2 has p 1 β non-zero entries of equal value, which are uniformly allocated among {1, 2,..., p}. β = 0, 0.1, 0.2,..., 0.9. The values of the non-zero entries are 2r log p(1/n1 + 1/n 2 ). r = 0, 0.1, 0.2, 0.3, 0.4,... Σ 1 = Σ 2 = Σ = (σ ij ), where σ ij = 0.6 i j. Results: Based on 1000 replicates; all used permutations B = 1000
28 β = 0.1 (# nonzero signals = 117/200) β = 0.2 (# nonzero signals = 69/200) Empirical power aspu CLZ CLX BS CQ SD Empirical power r r β = 0.5 (# nonzero signals = 14/200) β = 0.6 (# nonzero signals = 8/200) Empirical power Empirical power r r β = 0.7 (# nonzero signals = 4/200) β = 0.9 (# nonzero signals = 1/200) Empirical power Empirical power
29 Application 1: polygenic testing WTCCC (Burton et al 2007, Nature); n 1 = 1868 bipolar disorder (BD) patients and n 2 = 2938 controls; After QC, p = 354, 796 SNPs; using Plink to prune to p = SNPs; There are strong polygenic effects (P = for WTCCC data, ISC 2009, Nature), we considered chromosome-specific testing. Permutation (asymptotic) p-values.
30 Chromosome (# SNPs) Test 1 (3340) 4 (2617) 13 (1592) 18 (1421) SPU(1) (0.6355) (0.0017) (0.0375) (0.3287) SPU(2) < (<0.0001) (0.0144) (0.0260) (0.2882) SPU(3) (0.7374) (0.0308) (0.1294) (0.1865) SPU(4) < (<0.0001) (0.0270) (0.0009) (0.3526) SPU(5) (0.7417) (0.3754) (0.3938) (0.2591) SPU(6) (<0.0001) (0.0270) (0.0001) (0.4477) SPU( ) (0.1310) (0.1211) (0.0879) (0.0047) aspu < (<0.0001) (0.0116) (0.0013) (0.0140) CLZ (<0.0001) (0.0957) (0.0017) (0.0559) CLX (0.1310) (0.1211) (0.0879) (0.0047) BS < (<0.0001) (0.0146) (0.0263) (0.2885) CQ < (<0.0001) (0.0148) (0.0268) (0.2896) SD < (<0.0001) (<0.0001) (<0.0001) (<0.0001)
31 Application 1: another dataset Pan et al (2015, Genet Epi); SAGE GWAS on alcohol dependence (Bierut et al 2010); n 1 = 1165 cases and n 2 = 1379 controls; a total of 948,658 SNPs; 607,033 SNPs after QC; None reached the genome-wide significance by univariate testing! Previous twin/familial studies showed heritability of alcohol dependence! Any here? Use Plink to trim to p = 62, 801 nearly uncorrelated SNPs (r with a sliding window of 200 SNPs and a step size of 20 SNPs). Results: based on 10 million permutations!
32 Test P T p-value PRS Bonferroni-adjusted p-value SPU(1) SPU(2) < SPU(3) SPU(4) < SPU(5) SPU(6) SPU(7) SPU(8) SPU( ) aspu
33 Simulations: SNP data Empirical Type I error rate (for OR = 1) and power (for a > 1) for polygenic tests (with sample splitting) and SPU/aSPU tests (without sample splitting) for 1000 independent SNPs, including k 1 causal SNPs (among p = 1000 SNPs) with OR j s U(1, a).
34 Null k 1 = 20 k 1 = 50 k 1 = 100 Test P T a = 1 a = PRS SPU(1) SPU(2) SPU(4) SPU(8) SPU(16) SPU(32) SPU( ) aspu
35 Review: PRS test The Polygenic Risk Score (PRS) test: 1) Divide data D = D 1 D 2 ; 2) w j = w j (D 1 ) = ˆβ M,j I (p j < P T ) from marginal models; 3) s i = j w j(d 1 )X ij (D 2 ); 4) t-test on s i s with i D 2 ; The ISC-PRS is the same as the Sum (Poly-Sum) test on H 0 : α 1 = 0 in Logit[Pr(Y i = 1)] = α 0 + α 1 w j X ij, j=1 with the new genotype score w j X ij and i D 2. Can construct Poly-SSU, Poly-UminP,... Key: use a half of the sample to construct weights w j s; use the other half for hypothesis testing. sample splitting is not efficient!
36 Some algebra (and asymptotics) shows j T PRS(PT ) U j(d 1 )U j (D 2 )I (p j (D 1 ) < P T ), Var(U j (D 1 )) Better to use T tssuw(pt ) = j U j(d)u j (D)I (p j (D) < P T ), Var(U j (D)) Thresholding and inverse-variance weighting are not really effective = T SSU = U j (D)U j (D), j or even better, SPU(γ), and aspu! assu (Pan and Shen 2011, Genetic Epi; Fan 1997, JASA) vs aspu (Pan et al 2014, Genetics)...
37 Application 2: functional connectivity (FC) Kim, Wozniak, Mueller, Shen & Pan (2014, NeuroImage); A rs-fmri dataset (Wozniak et al 2013); Group 1: patients, fatal alcohol spectrum disorder, n 1 = 24; Group 2: controls, n 2 = 31; 74 (sub)cortical ROIs; p = 2701 possible edges; Each subject measured at 180 time points; For each subject i, calculate a N N sample correlation matrix ˆR i, then X i = vech(h(r i )) with h() as Fisher s z-transformation. Then compare two groups of X i s. Remarks: testing H 0 : Σ 1 = Σ 2, Li & Chen (2012, Ann Statist): SPU(2); Cai, Liu & Xia (2013, JASA): SPU( ).
38 Table: P-values after adjusting for age and gender for the FASD data. Test SPU(1) SPU(2) SPU(3) SPU(4) SPU(5) SPU(6) SPU(7) SPU(8) SPU( ) aspu P-value Test MDMR nbs(0.1) nbs(0.25) nbs(0.5) nbs(0.75) CharPath Eclust Eglob Eloc P-value
39 Power aspu aspuw MDMR nbs(0.5) nbs(0.75) Power τ τ Figure: Sparse networks: empirical Type I error (for τ = 1) and power (for τ < 1) based on 1000 simulations.
40 Discussion Genetics can be generalized to GLMs with covariates, RVs, p < n (Pan et al 2014, Genetics); extended to gene- and pathway-based association analysis (Pan et al 2015, AJHG); extended to multiple traits (Zhang et al 2015, NeuroImage; Kim et al 2016, Genetics), to that with only summary statistics (meta-analysis) (Kim et al, 2015, Genet Epi; Kwak and Pan 2016a, 2016b, Bioinformatics). Neuroimaging: generalized to using regularized cov and precision matrices (Kim et al, 2015, NeuroImage: Clinical); neuroimaging genetics: WGCNA/module detection (Gao, Kim & Pan 2017, Pacific Biocomputing Symposium; Kim & Pan (to appear), Genet Epi).
41
42 Acknowledgement This research was supported by NIH: R01 GM (PI: Pan), R01 HL (MPI: Pan/Shen), R01 HL (MPI: Pan/Wei) and R01 GM (MPI: Shen/Pan).. Polygenic testing: Peng Wei (UT-Houston); SPU/aSPU for RVs: Peng Wei (UT-Houston), Junghi Kim, Yiwei Zhang, Xiaotong Shen (UofM Statistics); 2-sample high-dim tests: Lifeng Lin, Gongjun Xu (UofM Statistics). Neuroimaging data: JR Wozniak, BA Mueller (UofM CMRR), ADNI
43 weip Code: weip/prog.html R packages aspu, highmean, GEEaSPU, POMaSPU, MiSPU; prclust, pgmgm, all on CRAN. Thank you!
Testing for group differences in brain functional connectivity
 Testing for group differences in brain functional connectivity Junghi Kim, Wei Pan, for ADNI Division of Biostatistics, School of Public Health, University of Minnesota, Minneapolis, MN 55455 Banff Feb
An Adaptive Association Test for Microbiome Data
 An Adaptive Association Test for Microbiome Data Chong Wu 1, Jun Chen 2, Junghi 1 Kim and Wei Pan 1 1 Division of Biostatistics, School of Public Health, University of Minnesota; 2 Division of Biomedical
Lecture 3. Inference about multivariate normal distribution
 Lecture 3. Inference about multivariate normal distribution 3.1 Point and Interval Estimation Let X 1,..., X n be i.i.d. N p (µ, Σ). We are interested in evaluation of the maximum likelihood estimates
Binomial Mixture Model-based Association Tests under Genetic Heterogeneity
 Binomial Mixture Model-based Association Tests under Genetic Heterogeneity Hui Zhou, Wei Pan Division of Biostatistics, School of Public Health, University of Minnesota, Minneapolis, MN 55455 April 30,
Marginal Screening and Post-Selection Inference
 Marginal Screening and Post-Selection Inference Ian McKeague August 13, 2017 Ian McKeague (Columbia University) Marginal Screening August 13, 2017 1 / 29 Outline 1 Background on Marginal Screening 2 2
On corrections of classical multivariate tests for high-dimensional data
 On corrections of classical multivariate tests for high-dimensional data Jian-feng Yao with Zhidong Bai, Dandan Jiang, Shurong Zheng Overview Introduction High-dimensional data and new challenge in statistics
Genetics Studies of Multivariate Traits
 Genetics Studies of Multivariate Traits Heping Zhang Department of Epidemiology and Public Health Yale University School of Medicine Presented at Southern Regional Council on Statistics Summer Research
Association studies and regression
 Association studies and regression CM226: Machine Learning for Bioinformatics. Fall 2016 Sriram Sankararaman Acknowledgments: Fei Sha, Ameet Talwalkar Association studies and regression 1 / 104 Administration
On corrections of classical multivariate tests for high-dimensional data. Jian-feng. Yao Université de Rennes 1, IRMAR
 Introduction a two sample problem Marčenko-Pastur distributions and one-sample problems Random Fisher matrices and two-sample problems Testing cova On corrections of classical multivariate tests for high-dimensional
TWO-SAMPLE BEHRENS-FISHER PROBLEM FOR HIGH-DIMENSIONAL DATA
 Statistica Sinica (014): Preprint 1 TWO-SAMPLE BEHRENS-FISHER PROBLEM FOR HIGH-DIMENSIONAL DATA Long Feng 1, Changliang Zou 1, Zhaojun Wang 1, Lixing Zhu 1 Nankai University and Hong Kong Baptist University
Statistica Sinica Preprint No: SS
 Statistica Sinica Preprint No: SS-2017-0275 Title Testing homogeneity of high-dimensional covariance matrices Manuscript ID SS-2017-0275 URL http://www.stat.sinica.edu.tw/statistica/ DOI 10.5705/ss.202017.0275
Genetics Studies of Comorbidity
 Genetics Studies of Comorbidity Heping Zhang Department of Epidemiology and Public Health Yale University School of Medicine Presented at Science at the Edge Michigan State University January 27, 2012
Lecture 9: Kernel (Variance Component) Tests and Omnibus Tests for Rare Variants. Summer Institute in Statistical Genetics 2017
 Tests and Omnibus Tests for Rare Variants. Summer Institute in Statistical Genetics 2017") Lecture 9: Kernel (Variance Component) Tests and Omnibus Tests for Rare Variants Timothy Thornton and Michael Wu Summer Institute in Statistical Genetics 2017 1 / 46 Lecture Overview 1. Variance Component
Lecture 9: Kernel (Variance Component) Tests and Omnibus Tests for Rare Variants Timothy Thornton and Michael Wu Summer Institute in Statistical Genetics 2017 1 / 46 Lecture Overview 1. Variance Component
Association Testing with Quantitative Traits: Common and Rare Variants. Summer Institute in Statistical Genetics 2014 Module 10 Lecture 5
 Association Testing with Quantitative Traits: Common and Rare Variants Timothy Thornton and Katie Kerr Summer Institute in Statistical Genetics 2014 Module 10 Lecture 5 1 / 41 Introduction to Quantitative
Theoretical and computational aspects of association tests: application in case-control genome-wide association studies.
 Theoretical and computational aspects of association tests: application in case-control genome-wide association studies Mathieu Emily November 18, 2014 Caen mathieu.emily@agrocampus-ouest.fr - Agrocampus
A novel and efficient algorithm for de novo discovery of mutated driver pathways in cancer
 A novel and efficient algorithm for de novo discovery of mutated driver pathways in cancer Binghui Liu, Chong Wu, Xiaotong Shen, Wei Pan University of Minnesota, Minneapolis, MN 55455 Nov 2017 Introduction
Genetic Studies of Multivariate Traits
 Genetic Studies of Multivariate Traits Heping Zhang Collaborative Center for Statistics in Science Yale University School of Public Health Presented at DIMACS, University of Rutgers May 17, 2013 Heping
Lecture 7: Interaction Analysis. Summer Institute in Statistical Genetics 2017
 Lecture 7: Interaction Analysis Timothy Thornton and Michael Wu Summer Institute in Statistical Genetics 2017 1 / 39 Lecture Outline Beyond main SNP effects Introduction to Concept of Statistical Interaction
The Generalized Higher Criticism for Testing SNP-sets in Genetic Association Studies
 The Generalized Higher Criticism for Testing SNP-sets in Genetic Association Studies Ian Barnett, Rajarshi Mukherjee & Xihong Lin Harvard University ibarnett@hsph.harvard.edu June 24, 2014 Ian Barnett
High Dimensional Covariance and Precision Matrix Estimation
 High Dimensional Covariance and Precision Matrix Estimation Wei Wang Washington University in St. Louis Thursday 23 rd February, 2017 Wei Wang (Washington University in St. Louis) High Dimensional Covariance
The Generalized Higher Criticism for Testing SNP-sets in Genetic Association Studies
 The Generalized Higher Criticism for Testing SNP-sets in Genetic Association Studies Ian Barnett, Rajarshi Mukherjee & Xihong Lin Harvard University ibarnett@hsph.harvard.edu August 5, 2014 Ian Barnett
Jackknife Empirical Likelihood Test for Equality of Two High Dimensional Means
 Jackknife Empirical Likelihood est for Equality of wo High Dimensional Means Ruodu Wang, Liang Peng and Yongcheng Qi 2 Abstract It has been a long history to test the equality of two multivariate means.
SHOTA KATAYAMA AND YUTAKA KANO. Graduate School of Engineering Science, Osaka University, 1-3 Machikaneyama, Toyonaka, Osaka , Japan
 A New Test on High-Dimensional Mean Vector Without Any Assumption on Population Covariance Matrix SHOTA KATAYAMA AND YUTAKA KANO Graduate School of Engineering Science, Osaka University, 1-3 Machikaneyama,
A novel fuzzy set based multifactor dimensionality reduction method for detecting gene-gene interaction
 A novel fuzzy set based multifactor dimensionality reduction method for detecting gene-gene interaction Sangseob Leem, Hye-Young Jung, Sungyoung Lee and Taesung Park Bioinformatics and Biostatistics lab
New Penalized Regression Approaches to Analysis of Genetic and Genomic Data
 New Penalized Regression Approaches to Analysis of Genetic and Genomic Data A DISSERTATION SUBMITTED TO THE FACULTY OF THE GRADUATE SCHOOL OF THE UNIVERSITY OF MINNESOTA BY Sunkyung Kim IN PARTIAL FULFILLMENT
On testing the equality of mean vectors in high dimension
 ACTA ET COMMENTATIONES UNIVERSITATIS TARTUENSIS DE MATHEMATICA Volume 17, Number 1, June 2013 Available online at www.math.ut.ee/acta/ On testing the equality of mean vectors in high dimension Muni S.
Feature selection with high-dimensional data: criteria and Proc. Procedures
 Feature selection with high-dimensional data: criteria and Procedures Zehua Chen Department of Statistics & Applied Probability National University of Singapore Conference in Honour of Grace Wahba, June
Confounder Adjustment in Multiple Hypothesis Testing
 in Multiple Hypothesis Testing Department of Statistics, Stanford University January 28, 2016 Slides are available at http://web.stanford.edu/~qyzhao/. Collaborators Jingshu Wang Trevor Hastie Art Owen
Power and sample size calculations for designing rare variant sequencing association studies.
 Power and sample size calculations for designing rare variant sequencing association studies. Seunggeun Lee 1, Michael C. Wu 2, Tianxi Cai 1, Yun Li 2,3, Michael Boehnke 4 and Xihong Lin 1 1 Department
(Genome-wide) association analysis
 association analysis") (Genome-wide) association analysis 1 Key concepts Mapping QTL by association relies on linkage disequilibrium in the population; LD can be caused by close linkage between a QTL and marker (= good) or by
(Genome-wide) association analysis 1 Key concepts Mapping QTL by association relies on linkage disequilibrium in the population; LD can be caused by close linkage between a QTL and marker (= good) or by
Statistical Inference On the High-dimensional Gaussian Covarianc
 Statistical Inference On the High-dimensional Gaussian Covariance Matrix Department of Mathematical Sciences, Clemson University June 6, 2011 Outline Introduction Problem Setup Statistical Inference High-Dimensional
Relationship between Genomic Distance-Based Regression and Kernel Machine Regression for Multi-marker Association Testing
 Relationship between Genomic Distance-Based Regression and Kernel Machine Regression for Multi-marker Association Testing Wei Pan Division of Biostatistics, School of Public Health, University of Minnesota,
On a General Two-Sample Test with New Critical Value for Multivariate Feature Selection in Chest X-Ray Image Analysis Problem
 Applied Mathematical Sciences, Vol. 9, 2015, no. 147, 7317-7325 HIKARI Ltd, www.m-hikari.com http://dx.doi.org/10.12988/ams.2015.510687 On a General Two-Sample Test with New Critical Value for Multivariate
 Review We have covered so far: Single variant association analysis and effect size estimation GxE interaction and higher order >2 interaction Measurement error in dietary variables (nutritional epidemiology)
Department of Forensic Psychiatry, School of Medicine & Forensics, Xi'an Jiaotong University, Xi'an, China;
 Title: Evaluation of genetic susceptibility of common variants in CACNA1D with schizophrenia in Han Chinese Author names and affiliations: Fanglin Guan a,e, Lu Li b, Chuchu Qiao b, Gang Chen b, Tinglin
The purpose of this section is to derive the asymptotic distribution of the Pearson chi-square statistic. k (n j np j ) 2. np j.
 2. np j.") Chapter 9 Pearson s chi-square test 9. Null hypothesis asymptotics Let X, X 2, be independent from a multinomial(, p) distribution, where p is a k-vector with nonnegative entries that sum to one. That
Chapter 9 Pearson s chi-square test 9. Null hypothesis asymptotics Let X, X 2, be independent from a multinomial(, p) distribution, where p is a k-vector with nonnegative entries that sum to one. That
Quasi-likelihood Scan Statistics for Detection of
 for Quasi-likelihood for Division of Biostatistics and Bioinformatics, National Health Research Institutes & Department of Mathematics, National Chung Cheng University 17 December 2011 1 / 25 Outline for
Vast Volatility Matrix Estimation for High Frequency Data
 Vast Volatility Matrix Estimation for High Frequency Data Yazhen Wang National Science Foundation Yale Workshop, May 14-17, 2009 Disclaimer: My opinion, not the views of NSF Y. Wang (at NSF) 1 / 36 Outline
Computational Systems Biology: Biology X
 Bud Mishra Room 1002, 715 Broadway, Courant Institute, NYU, New York, USA L#7:(Mar-23-2010) Genome Wide Association Studies 1 The law of causality... is a relic of a bygone age, surviving, like the monarchy,
Nonconcave Penalized Likelihood with A Diverging Number of Parameters
 Nonconcave Penalized Likelihood with A Diverging Number of Parameters Jianqing Fan and Heng Peng Presenter: Jiale Xu March 12, 2010 Jianqing Fan and Heng Peng Presenter: JialeNonconcave Xu () Penalized
Chapter 10. Semi-Supervised Learning
 Chapter 10. Semi-Supervised Learning Wei Pan Division of Biostatistics, School of Public Health, University of Minnesota, Minneapolis, MN 55455 Email: weip@biostat.umn.edu PubH 7475/8475 c Wei Pan Outline
Previous lecture. Single variant association. Use genome-wide SNPs to account for confounding (population substructure)
") Previous lecture Single variant association Use genome-wide SNPs to account for confounding (population substructure) Estimation of effect size and winner s curse Meta-Analysis Today s outline P-value
Previous lecture Single variant association Use genome-wide SNPs to account for confounding (population substructure) Estimation of effect size and winner s curse Meta-Analysis Today s outline P-value
Multidimensional heritability analysis of neuroanatomical shape. Jingwei Li
 Multidimensional heritability analysis of neuroanatomical shape Jingwei Li Brain Imaging Genetics Genetic Variation Behavior Cognition Neuroanatomy Brain Imaging Genetics Genetic Variation Neuroanatomy
High-dimensional two-sample tests under strongly spiked eigenvalue models
 1 High-dimensional two-sample tests under strongly spiked eigenvalue models Makoto Aoshima and Kazuyoshi Yata University of Tsukuba Abstract: We consider a new two-sample test for high-dimensional data
CS 4491/CS 7990 SPECIAL TOPICS IN BIOINFORMATICS
 CS 4491/CS 7990 SPECIAL TOPICS IN BIOINFORMATICS * Some contents are adapted from Dr. Hung Huang and Dr. Chengkai Li at UT Arlington Mingon Kang, Ph.D. Computer Science, Kennesaw State University Problems
Chapter 3. Linear Models for Regression
 Chapter 3. Linear Models for Regression Wei Pan Division of Biostatistics, School of Public Health, University of Minnesota, Minneapolis, MN 55455 Email: weip@biostat.umn.edu PubH 7475/8475 c Wei Pan Linear
Analysis of longitudinal neuroimaging data with OLS & Sandwich Estimator of variance
 Analysis of longitudinal neuroimaging data with OLS & Sandwich Estimator of variance Bryan Guillaume Reading workshop lifespan neurobiology 27 June 2014 Supervisors: Thomas Nichols (Warwick University)
Package pfa. July 4, 2016
 Type Package Package pfa July 4, 2016 Title Estimates False Discovery Proportion Under Arbitrary Covariance Dependence Version 1.1 Date 2016-06-24 Author Jianqing Fan, Tracy Ke, Sydney Li and Lucy Xia
Lecture 5: Hypothesis tests for more than one sample
 1/23 Lecture 5: Hypothesis tests for more than one sample Måns Thulin Department of Mathematics, Uppsala University thulin@math.uu.se Multivariate Methods 8/4 2011 2/23 Outline Paired comparisons Repeated
Multiple QTL mapping
 Multiple QTL mapping Karl W Broman Department of Biostatistics Johns Hopkins University www.biostat.jhsph.edu/~kbroman [ Teaching Miscellaneous lectures] 1 Why? Reduce residual variation = increased power
DEGseq: an R package for identifying differentially expressed genes from RNA-seq data
 DEGseq: an R package for identifying differentially expressed genes from RNA-seq data Likun Wang Zhixing Feng i Wang iaowo Wang * and uegong Zhang * MOE Key Laboratory of Bioinformatics and Bioinformatics
GWAS IV: Bayesian linear (variance component) models
 models") GWAS IV: Bayesian linear (variance component) models Dr. Oliver Stegle Christoh Lippert Prof. Dr. Karsten Borgwardt Max-Planck-Institutes Tübingen, Germany Tübingen Summer 2011 Oliver Stegle GWAS IV: Bayesian
GWAS IV: Bayesian linear (variance component) models Dr. Oliver Stegle Christoh Lippert Prof. Dr. Karsten Borgwardt Max-Planck-Institutes Tübingen, Germany Tübingen Summer 2011 Oliver Stegle GWAS IV: Bayesian
Model-Free Knockoffs: High-Dimensional Variable Selection that Controls the False Discovery Rate
 Model-Free Knockoffs: High-Dimensional Variable Selection that Controls the False Discovery Rate Lucas Janson, Stanford Department of Statistics WADAPT Workshop, NIPS, December 2016 Collaborators: Emmanuel
Analysis of variance, multivariate (MANOVA)
") Analysis of variance, multivariate (MANOVA) Abstract: A designed experiment is set up in which the system studied is under the control of an investigator. The individuals, the treatments, the variables
Analysis of variance, multivariate (MANOVA) Abstract: A designed experiment is set up in which the system studied is under the control of an investigator. The individuals, the treatments, the variables
An Approximate Test for Homogeneity of Correlated Correlation Coefficients
 Quality & Quantity 37: 99 110, 2003. 2003 Kluwer Academic Publishers. Printed in the Netherlands. 99 Research Note An Approximate Test for Homogeneity of Correlated Correlation Coefficients TRIVELLORE
Large-Scale Multiple Testing of Correlations
 Large-Scale Multiple Testing of Correlations T. Tony Cai and Weidong Liu Abstract Multiple testing of correlations arises in many applications including gene coexpression network analysis and brain connectivity
Multiple Change-Point Detection and Analysis of Chromosome Copy Number Variations
 Multiple Change-Point Detection and Analysis of Chromosome Copy Number Variations Yale School of Public Health Joint work with Ning Hao, Yue S. Niu presented @Tsinghua University Outline 1 The Problem
GLIDE: GPU-based LInear Detection of Epistasis
 GLIDE: GPU-based LInear Detection of Epistasis Chloé-Agathe Azencott with Tony Kam-Thong, Lawrence Cayton, and Karsten Borgwardt Machine Learning and Computational Biology Research Group Max Planck Institute
Regularization Parameter Selection for a Bayesian Multi-Level Group Lasso Regression Model with Application to Imaging Genomics
 Regularization Parameter Selection for a Bayesian Multi-Level Group Lasso Regression Model with Application to Imaging Genomics arxiv:1603.08163v1 [stat.ml] 7 Mar 016 Farouk S. Nathoo, Keelin Greenlaw,
Missing Data Issues in the Studies of Neurodegenerative Disorders: the Methodology
 Missing Data Issues in the Studies of Neurodegenerative Disorders: the Methodology Sheng Luo, PhD Associate Professor Department of Biostatistics & Bioinformatics Duke University Medical Center sheng.luo@duke.edu
1 Preliminary Variance component test in GLM Mediation Analysis... 3
 Honglang Wang Depart. of Stat. & Prob. wangho16@msu.edu Omics Data Integration Statistical Genetics/Genomics Journal Club Summary and discussion of Joint Analysis of SNP and Gene Expression Data in Genetic
Software for genome-wide association studies having multivariate responses: Introducing MAGWAS
 Software for genome-wide association studies having multivariate responses: Introducing MAGWAS Chad C. Brown 1 and Alison A. Motsinger-Reif 1,2 1 Department of Statistics, 2 Bioinformatics Research Center
On the relative efficiency of using summary statistics versus individual level data in meta-analysis
 On the relative efficiency of using summary statistics versus individual level data in meta-analysis By D. Y. LIN and D. ZENG Department of Biostatistics, CB# 7420, University of North Carolina, Chapel
Sparse Additive Functional and kernel CCA
 Sparse Additive Functional and kernel CCA Sivaraman Balakrishnan* Kriti Puniyani* John Lafferty *Carnegie Mellon University University of Chicago Presented by Miao Liu 5/3/2013 Canonical correlation analysis
Latent Variable Methods for the Analysis of Genomic Data
 John D. Storey Center for Statistics and Machine Learning & Lewis-Sigler Institute for Integrative Genomics Latent Variable Methods for the Analysis of Genomic Data http://genomine.org/talks/ Data m variables
Sample Size Estimation for Studies of High-Dimensional Data
 Sample Size Estimation for Studies of High-Dimensional Data James J. Chen, Ph.D. National Center for Toxicological Research Food and Drug Administration June 3, 2009 China Medical University Taichung,
SNP-SNP Interactions in Case-Parent Trios
 Detection of SNP-SNP Interactions in Case-Parent Trios Department of Biostatistics Johns Hopkins Bloomberg School of Public Health June 2, 2009 Karyotypes http://ghr.nlm.nih.gov/ Single Nucleotide Polymphisms
Statistical inference in Mendelian randomization: From genetic association to epidemiological causation
 Statistical inference in Mendelian randomization: From genetic association to epidemiological causation Department of Statistics, The Wharton School, University of Pennsylvania March 1st, 2018 @ UMN Based
Rerandomization to Balance Covariates
 Rerandomization to Balance Covariates Kari Lock Morgan Department of Statistics Penn State University Joint work with Don Rubin University of Minnesota Biostatistics 4/27/16 The Gold Standard Randomized
Linear Regression (1/1/17)
") STA613/CBB540: Statistical methods in computational biology Linear Regression (1/1/17) Lecturer: Barbara Engelhardt Scribe: Ethan Hada 1. Linear regression 1.1. Linear regression basics. Linear regression
STA613/CBB540: Statistical methods in computational biology Linear Regression (1/1/17) Lecturer: Barbara Engelhardt Scribe: Ethan Hada 1. Linear regression 1.1. Linear regression basics. Linear regression
HERITABILITY ESTIMATION USING A REGULARIZED REGRESSION APPROACH (HERRA)
") BIRS 016 1 HERITABILITY ESTIMATION USING A REGULARIZED REGRESSION APPROACH (HERRA) Malka Gorfine, Tel Aviv University, Israel Joint work with Li Hsu, FHCRC, Seattle, USA BIRS 016 The concept of heritability
BIRS 016 1 HERITABILITY ESTIMATION USING A REGULARIZED REGRESSION APPROACH (HERRA) Malka Gorfine, Tel Aviv University, Israel Joint work with Li Hsu, FHCRC, Seattle, USA BIRS 016 The concept of heritability
Multivariate Regression Generalized Likelihood Ratio Tests for FMRI Activation
 Multivariate Regression Generalized Likelihood Ratio Tests for FMRI Activation Daniel B Rowe Division of Biostatistics Medical College of Wisconsin Technical Report 40 November 00 Division of Biostatistics
Minimax Rate-Optimal Estimation of High- Dimensional Covariance Matrices with Incomplete Data
 University of Pennsylvania ScholarlyCommons Statistics Papers Wharton Faculty Research 9-2016 Minimax Rate-Optimal Estimation of High- Dimensional Covariance Matrices with Incomplete Data T. Tony Cai University
High-Throughput Sequencing Course
 High-Throughput Sequencing Course DESeq Model for RNA-Seq Biostatistics and Bioinformatics Summer 2017 Outline Review: Standard linear regression model (e.g., to model gene expression as function of an
Empirical Likelihood Tests for High-dimensional Data
 Empirical Likelihood Tests for High-dimensional Data Department of Statistics and Actuarial Science University of Waterloo, Canada ICSA - Canada Chapter 2013 Symposium Toronto, August 2-3, 2013 Based on
Correlation. Martin Bland. Correlation. Correlation coefficient. Clinical Biostatistics
 Clinical Biostatistics Correlation Martin Bland Professor of Health Statistics University of York http://martinbland.co.uk/ Correlation Example: Muscle and height in 42 alcoholics A scatter diagram: How
. Also, in this case, p i = N1 ) T, (2) where. I γ C N(N 2 2 F + N1 2 Q)
 T, (2) where. I γ C N(N 2 2 F + N1 2 Q)") Supplementary information S7 Testing for association at imputed SPs puted SPs Score tests A Score Test needs calculations of the observed data score and information matrix only under the null hypothesis,
Supplementary information S7 Testing for association at imputed SPs puted SPs Score tests A Score Test needs calculations of the observed data score and information matrix only under the null hypothesis,
TECHNICAL REPORT # 59 MAY Interim sample size recalculation for linear and logistic regression models: a comprehensive Monte-Carlo study
 TECHNICAL REPORT # 59 MAY 2013 Interim sample size recalculation for linear and logistic regression models: a comprehensive Monte-Carlo study Sergey Tarima, Peng He, Tao Wang, Aniko Szabo Division of Biostatistics,
Penalized Methods for Multiple Outcome Data in Genome-Wide Association Studies
 Penalized Methods for Multiple Outcome Data in Genome-Wide Association Studies Jin Liu 1, Shuangge Ma 1, and Jian Huang 2 1 Division of Biostatistics, School of Public Health, Yale University 2 Department
Portfolio Allocation using High Frequency Data. Jianqing Fan
 Portfolio Allocation using High Frequency Data Princeton University With Yingying Li and Ke Yu http://www.princeton.edu/ jqfan September 10, 2010 About this talk How to select sparsely optimal portfolio?
Bayesian Statistics for Personalized Medicine. David Yang
 Bayesian Statistics for Personalized Medicine David Yang Outline Why Bayesian Statistics for Personalized Medicine? A Network-based Bayesian Strategy for Genomic Biomarker Discovery Part One Why Bayesian
Group exponential penalties for bi-level variable selection
 for bi-level variable selection Department of Biostatistics Department of Statistics University of Kentucky July 31, 2011 Introduction In regression, variables can often be thought of as grouped: Indicator
POWER AND TYPE I ERROR RATE COMPARISON OF MULTIVARIATE ANALYSIS OF VARIANCE
 POWER AND TYPE I ERROR RATE COMPARISON OF MULTIVARIATE ANALYSIS OF VARIANCE Supported by Patrick Adebayo 1 and Ahmed Ibrahim 1 Department of Statistics, University of Ilorin, Kwara State, Nigeria Department
Incorporation of Sparsity Information in Large-scale Multiple Two-sample t Tests
 Incorporation of Sparsity Information in Large-scale Multiple Two-sample t Tests Weidong Liu October 19, 2014 Abstract Large-scale multiple two-sample Student s t testing problems often arise from the
Heritability estimation in modern genetics and connections to some new results for quadratic forms in statistics
 Heritability estimation in modern genetics and connections to some new results for quadratic forms in statistics Lee H. Dicker Rutgers University and Amazon, NYC Based on joint work with Ruijun Ma (Rutgers),
Bayesian construction of perceptrons to predict phenotypes from 584K SNP data.
 Bayesian construction of perceptrons to predict phenotypes from 584K SNP data. Luc Janss, Bert Kappen Radboud University Nijmegen Medical Centre Donders Institute for Neuroscience Introduction Genetic
Approximate and Fiducial Confidence Intervals for the Difference Between Two Binomial Proportions
 Approximate and Fiducial Confidence Intervals for the Difference Between Two Binomial Proportions K. Krishnamoorthy 1 and Dan Zhang University of Louisiana at Lafayette, Lafayette, LA 70504, USA SUMMARY
Genotype Imputation. Biostatistics 666
 Genotype Imputation Biostatistics 666 Previously Hidden Markov Models for Relative Pairs Linkage analysis using affected sibling pairs Estimation of pairwise relationships Identity-by-Descent Relatives
Regularized Estimation of High Dimensional Covariance Matrices. Peter Bickel. January, 2008
 Regularized Estimation of High Dimensional Covariance Matrices Peter Bickel Cambridge January, 2008 With Thanks to E. Levina (Joint collaboration, slides) I. M. Johnstone (Slides) Choongsoon Bae (Slides)
NIH Public Access Author Manuscript Genet Epidemiol. Author manuscript; available in PMC 2014 June 23.
 NIH Public Access Author Manuscript Published in final edited form as: Genet Epidemiol. 2013 January ; 37(1): 99 109. doi:10.1002/gepi.21691. Adjustment for Population Stratification via Principal Components
Adaptive Group-combined P-values Test for Two-sample Location Problem with Applications to Microarray Data
 www.nature.com/scientificreports Received: 8 January 08 Accepted: May 08 Published: xx xx xxxx OPEN Adaptive Group-combined P-values Test for Two-sample Location Problem with Applications to Microarray
Proportional Variance Explained by QLT and Statistical Power. Proportional Variance Explained by QTL and Statistical Power
 Proportional Variance Explained by QTL and Statistical Power Partitioning the Genetic Variance We previously focused on obtaining variance components of a quantitative trait to determine the proportion
A FAST, ACCURATE TWO-STEP LINEAR MIXED MODEL FOR GENETIC ANALYSIS APPLIED TO REPEAT MRI MEASUREMENTS
 A FAST, ACCURATE TWO-STEP LINEAR MIXED MODEL FOR GENETIC ANALYSIS APPLIED TO REPEAT MRI MEASUREMENTS Qifan Yang 1,4, Gennady V. Roshchupkin 2, Wiro J. Niessen 2, Sarah E. Medland 3, Alyssa H. Zhu 1, Paul
Linear Algebra I Lecture 8
 Linear Algebra I Lecture 8 Xi Chen 1 1 University of Alberta January 25, 2019 Outline 1 2 Gauss-Jordan Elimination Given a system of linear equations f 1 (x 1, x 2,..., x n ) = 0 f 2 (x 1, x 2,..., x n
Classification. Chapter Introduction. 6.2 The Bayes classifier
 Chapter 6 Classification 6.1 Introduction Often encountered in applications is the situation where the response variable Y takes values in a finite set of labels. For example, the response Y could encode
On Two-Stage Hypothesis Testing Procedures Via Asymptotically Independent Statistics
 UW Biostatistics Working Paper Series 9-8-2010 On Two-Stage Hypothesis Testing Procedures Via Asymptotically Independent Statistics James Dai FHCRC, jdai@fhcrc.org Charles Kooperberg fred hutchinson cancer
Comparison of Statistical Tests for Disease Association with Rare Variants
 Comparison of Statistical Tests for Disease Association with Rare Variants Saonli Basu, Wei Pan Division of Biostatistics, School of Public Health, University of Minnesota, Minneapolis, MN 55455 November
Bayesian variable selection via. Penalized credible regions. Brian Reich, NCSU. Joint work with. Howard Bondell and Ander Wilson
 Bayesian variable selection via penalized credible regions Brian Reich, NC State Joint work with Howard Bondell and Ander Wilson Brian Reich, NCSU Penalized credible regions 1 Motivation big p, small n
MODEL-FREE LINKAGE AND ASSOCIATION MAPPING OF COMPLEX TRAITS USING QUANTITATIVE ENDOPHENOTYPES
 MODEL-FREE LINKAGE AND ASSOCIATION MAPPING OF COMPLEX TRAITS USING QUANTITATIVE ENDOPHENOTYPES Saurabh Ghosh Human Genetics Unit Indian Statistical Institute, Kolkata Most common diseases are caused by
Introduction to QTL mapping in model organisms
 Introduction to QTL mapping in model organisms Karl W Broman Department of Biostatistics and Medical Informatics University of Wisconsin Madison www.biostat.wisc.edu/~kbroman [ Teaching Miscellaneous lectures]