Thin Sweet Spots Identification in the Duvernay Formation of North Central Alberta*
|
|
|
- Carol Hart
- 6 years ago
- Views:
Transcription
1 Thin Sweet Spots Identification in the Duvernay Formation of North Central Alberta* Ritesh K. Sharma 1 and Satinder Chopra 1 Search and Discovery Article #10902 (2017)** Posted January 16, 2017 *Adapted from oral presentation given at AAPG Annual Convention & Exhibition, Calgary, Alberta, Canada, June 19-22, 2016 **Datapages 2017 Serial rights given by author. For all other rights contact author directly. 1 Arcis Seismic Solutions, Calgary, Alberta, Canada (schopra@arcis.com) Abstract The Duvernay Shale liquids play, running along the foothills east of the Rocky Mountains, possesses all the prerequisites of being a successful unconventional play, and has gained attention of the oil and gas industry in Alberta, Canada. Even though the net shale isopachs range between 25 m and 60 m for the most part within the play, at places it thins out. Considering the poor vertical resolution of the available seismic data, it is not possible to identify and characterize the thin Duvernay sweet spot zones using seismically-derived attributes. In a case study taken up recently, we found it challenging characterizing the thin Duvernay reservoir zone, and consequently developed a workflow that successfully addressed the challenge and identified the thin sweet spots. The workflow entailed extracting the P- and S- reflectivities from prestack seismic data using Fatti et al.'s approximation to the Zoeppritz equations, and then subjecting them to thin-bed reflectivity inversion. The latter process removes the time-varying effect of the wavelet from the data and the output of the inversion process can be viewed as spectrally-broadened seismic data, retrieved in the form of broadband reflectivity which can be filtered back to any desired bandwidth. This usually represents useful information for interpretation purposes. Filtered thin-bed reflectivity, obtained by convolving the reflectivity with a wavelet of a known frequency band-pass, not only provides an opportunity to study reflection character associated with features of interest, but also serves to confirm its close match with the original data. These P- and S-reflectivities with higher bandwidth were inverted into P- and S-impedances using model-based impedance inversion. This workflow enabled us to differentiate between the Upper and Lower Duvernay intervals. Sweet spots were identified based on the constrained volume that was created using multi-attribute analysis. References Cited Fatti, Jan L., George C. Smith, Peter J. Vail, Peter J. Strauss, and Philip R. Levitt, 1994, Detection of gas in sandstone reservoirs using AVO analysis: A 3-D seismic case history using the Geostack technique: Geophysics, v. 59/9, p Rokosh, C.D., S. Lyster, S.D.A. Anderson, A.P. Beaton, H. Berhane, T. Brazzoni, D. Chen, Y. Cheng, T. Mack, C. Pana, and J.G. Pawlowicz, 2012, Summary of Alberta's shale- and siltstone-hosted hydrocarbons: Alberta Geological Survey Open File Report

2 Thin sweet spot Identification in the Duvernay Formation of North Central Alberta Ritesh K. Sharma and Satinder Chopra (Talk delivered at AAPG Annual Convention & Exhibition, Calgary on 21 st June, 2016)
3 Duvernay Formation The Devonian Duvernay shales are proven source rocks for many of the large Devonian oil and gas pools in Alberta including the Leduc discovery in The Duvernay shale basin spans approx. 50,000 sq. miles, with an estimated 7,500 sq. miles within the thermally mature or wet gas window. Holds an estimated 443 trillion cubic feet of gas and 61.7 billion barrels of oil (Source: AER). 2

4 Duvernay Formation In Alberta, the Duvernay shales are found in the East Shale Basin and West Shale Basin, both of which differ in the geological setting and their characteristics. The present case study focuses on a dataset from central Alberta and situated in the West Shale Basin. Index map showing the Duvernay Formation in the province of Alberta (After Rokosh et al., 2012) 3
5 Characteristics of Duvernay Lithology: Fine grained and silica (quartz) rich. Fine grained rocks have increased total surface area which leads to a higher absorbed gas component in organic rich rocks. More brittle and favorable for fracking. TOC: Measure the organic matter that was preserved in the rock. TOC varies from 1-20%. Thickness: required for storage and ultimate economic of the play. Varies from 10-70m. Effective Porosity: Pore space required for storage of hydrocarbon once generated from the organic material contained in the rock. Varies between 3 and 5%. Pressure Gradient: Over-pressured reservoirs allow for increased storage. It is over pressured nature. 4
6 Characteristics of Duvernay Element Desired Duvernay Lithology Fine grained/silica-rich Fine grained/silica-rich Thickness > 40m 10-70m TOC > 1% 1-20% Effective Porosity > 2.5% 3-15 Pressure Gradient > 0.5 psi/ft psi/ft Areal Extent Large 7,500 square miles 5
7 Some key elements for characterization of shale plays 1. Mineralogy 2. Organic richness 3. Maturation 4. Porosity/permeability 5. Faults/fractures 6. Brittleness 7. Pore-pressure/stress 8. Thickness 9. Oil/gas-in-place Can be determined using lab testing of samples, geochemical analysis, and log measurements Can determine using seismic data and log measurements Estimated with knowledge of various parameters 7
8 Sweet spot identification High Ø High porosity is a prerequisite for better reservoir quality. Interval High Brittleness Brittle rocks frac much better than ductile rocks and enhance the permeability of those zones. Organic richness (TOC) Higher the TOC, better the potential for hydrocarbon generation 8
9 Use of seismic for sweet spot identification 1. Properties that help seismic to identify sweet spots. Changes in the porosity of shale formations influence V P, V S, and ρ, thus should be detected on the seismic response. 2. Such influence can be detected on different pairs of attributes I P I S, λρ µρ and I P V P V S etc. 9
10 Location of brittle shale pockets 1. Brittleness of a rock formation can be estimated from the computed Poisson s ratio (strength) and Young s modulus (stiffness) well log curves. 2. Brittle rocks exhibit high Young s modulus and low Poisson s ratio (PR). E = I S 2 3I P 2 4I S 2 ρ(i P 2 I S 2 ) Eρ = I S 2 3I P 2 4I S 2 (I P 2 I S 2 ) σ = I P 2 2I S 2 2(I P 2 I S 2 ) 3. Once P-impedance and S-impedance attributes are determined, different rock parameters can be computed from them. 10
 is only 17m in thickness.")
11 Characterization of Duvernay We begin our characterization exercise with the appropriate well-log curves. Even though the Duvernay Formation is 44m thick, the thickness of the Upper Duvernay (productive zone) is only 17m in thickness. Duvernay =44m 17 m 11
 1600 1700")
12 Well-to-seismic ties Time (ms)
.")
13 Well-to-seismic ties Amplitude spectra of a statistical wavelet (shown above) indicates that the dominant frequency in the data is 20 Hz. This implies the vertical resolution for this data set is approximately 48m (V P = 3800 m/s). It is therefore challenging to characterize a 17m thick formation. 13

14 Workflow for simultaneous inversion Data conditioning Inversion 14

15 Simultaneous inversion output Cross-plot of P-impedance vs S-impedance S-impedance Off the trend Back ground trend P-impedance 15

16 Simultaneous inversion output Cross-plot of P-impedance vs S-impedance S-impedance Off the trend Back ground trend P-impedance 16


17 Crossplot of P-impedance vs S-impedance S-impedance Back projection indicates that the anomalous points are coming from Lower Duvernay formation which is not expected. P-impedance Back projection U. Duvernay L. Duvernay 17


18 Crossplot of Lambda-rho vs Mu-rho Cross-plot of λρ vs µρ Anomalous Similarly, back projection indicates that anomalous points are coming from Lower Duvernay formation. Back projection U. Duvernay L. Duvernay 18

19 New approach followed 19
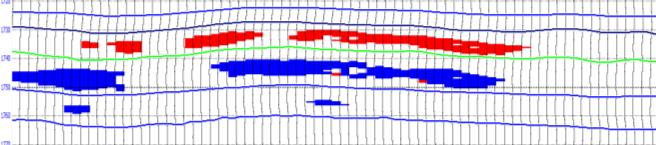
 1900 1800 Time (ms) 1850 U. Duvernay L.")

20 New approach followed a) 1800 Time (ms) 1850 U. Duvernay L. Duvernay b) Time (ms) 1850 U. Duvernay L. Duvernay 1900 P-wave reflectivity section (a) before and (b) after thin-bed reflectivity inversion. Notice the extra events and more detailed information over the zone of interest. 20

21 Quality control Time V P Rho Time (ms) U. Duvernay L. Duvernay To check whether enhancement of frequencies is realistic or not, well-to-seismic tie is carried out 21
 µρ Single cluster in anomalous zone")
22 Lambda-rho vs Mu-rho crossplot (simultaneous inversion) µρ Single cluster in anomalous zone λρ 22
 Two clusters in anomalous zone")
23 Lambda-rho vs Mu-rho crossplot (new approach) Two clusters in anomalous zone µρ λρ 23

24 Lambda-rho vs Mu-rho crossplot (new approach) Here, we are able to differentiate between Upper and Lower Duvernay formations. U. Duvernay L. Duvernay 24

25 Lambda-rho vs Mu-rho crossplot (simultaneous inversion) We were not able to differentiate between Upper and Lower Duvernay formations. U. Duvernay L. Duvernay 25
 E-rho Poisson")
26 E-rho vs Poisson ratio crossplot (simultaneous inversion) E-rho Poisson Ratio 26
 E-rho Poisson Ratio")
27 E-rho vs Poisson ratio crossplot (new approach) E-rho Poisson Ratio 27


28 Constraining the data Simultaneous μρ Eρ Time (ms) λρ U.D. L.D. Time (ms) σ U.D. L.D. New approach μρ Eρ Time (ms) λρ U.D. L.D. Time (ms) σ U.D. L.D. 28
 based on crossplots shown in the previous slides, and further")
29 Constraining the data U. Duvernay L. Duvernay By using a restricted range of values for each of the attributes (E-rho, Poisson s ratio, LR and MR) based on crossplots shown in the previous slides, and further subdividing the output into Upper Duvernay (green) and Lower Duvernay (yellow) the distribution is shown along an inline from the 3D survey. 29
30 Constraining the data 3 km Horizon slice from the constrained attribute data over a 10 ms window below the Duvernay top marker. It shows the distribution of the Upper (green) and Lower (yellow) Duvernay shales. 30
 and Lower (yellow) Duvernay shales in this window, which is lower than the one shown in the")
31 Constraining the data 3 km Horizon slice from the constrained attribute data over a 10 ms window below the Duvernay top + 10ms marker. It shows the distribution of the Upper (green) and Lower (yellow) Duvernay shales in this window, which is lower than the one shown in the previous slide. 31
32 TOC estimation for Duvernay using seismic data Passey et al. (1990) developed the ΔlogR technique for calculating TOC in organic-rich shales using well log curves. This method is based on the porosity-resistivity overlay to locate hydrocarbon bearing shale pockets. 32

 where R-Resistivity")

33 TOC estimation for Duvernay using seismic data logr Compute logr based on the equation logr=log 10 (R/R base ) *(DT - DT base ) where R-Resistivity curve, DT-Sonic Curve R base, DT base are resistivity and sonic values corresponding to overlapping zone. 33
34 TOC estimation for Duvernay using seismic data TOC=ΔlogR 10^( LOM) 34
35 TOC estimation for Duvernay using seismic data Methodology: Cross correlation analysis 1. ΔlogR vs different attributes generated from well data which can be derived from seismic data. 2. The attribute which shows the maximum correlation is selected and cross-plotted against ΔlogR for obtaining a relationship. 3. That relationship is then used for extracting ΔlogR volume from 3D seismic data. 35

36 TOC estimation for Duvernay using seismic data ΔlogR P-impedance 36

37 TOC estimation for Duvernay using seismic data ΔlogR Lambda-rho 37

38 TOC estimation for Duvernay using seismic data ΔlogR Mu-rho 38

39 TOC estimation for Duvernay using seismic data ΔlogR Poisson impedance 39

40 TOC estimation for Duvernay using seismic data ΔlogR V P /V S 40
41 TOC estimation for Duvernay using seismic data ΔlogR λρ/(λρ+2μρ) 41
42 TOC estimation for Duvernay using seismic data 87% correlation is noticed between ΔlogR and λρ/(λρ+2μρ) ΔlogR Lambda-rho and Mu-rho volumes from seismic data were computed first. λρ/(λρ+2μρ) ΔlogR volume was derived using the relationship. 42


43 Identification of sweet spots in Duvernay formation High High 3 km 3 km Low 3 km Low Horizon slice from the ΔlogR volume 10ms interval below the Duvernay top marker. Notice the trend we see for high values of ΔlogR is not very different from what we see on the constrained volume display shown alongside. 43
 Time (ms) 1840 TOC(%) 1845 ΔlogR This was a blind well test.")
 a crossplot between TOC and ΔlogR shows a correlation of 90%, which again lends confidence")
44 Identification of sweet spots in Duvernay formation (a) ΔlogR (inverted) TOC measured from core samples 1835 (b) Time (ms) 1840 TOC(%) 1845 ΔlogR This was a blind well test. (a) The match is seen as good as the increasing and decreasing trends seem to follow each other; (b) a crossplot between TOC and ΔlogR shows a correlation of 90%, which again lends confidence to the analysis. 44
45 Conclusions 1. An attempt has been made to characterize the Duvernay Formation using seismic data. 2. Derived some seismic attributes (λρ-μρ and Eρ-PR) using simultaneous inversion. 3. As the thickness of ZOI was far below the vertical resolution of the seismic data, simultaneous inversion was not found to be suitable for identifcation sweet spots in the Duvernay Formation. 45
46 Conclusions 4. We adopted a new workflow in which P-and S-reflectivities were processed through thin-bed reflectivity inversion before post-stack impedance inversion. 5. We were able to differentiate between Upper and Lower Duvernay using above workflow. 6. Additionally, ΔlogR volume was computed. A reasonably good match between ΔlogR and TOC measured at core sample, enhancing our confidence in the analysis. 46
47 Acknowledgements Arcis Seismic Solutions, TGS, Calgary 47
Identification of sweet spots in shale reservoir formations
 Identification of sweet spots in shale reservoir formations Ritesh Kumar Sharma 1 and Satinder Chopra 1 Abstract The main goal for shale resource characterization is usually the identification of sweet
Unconventional reservoir characterization using conventional tools
 Ritesh K. Sharma* and Satinder Chopra Arcis Seismic Solutions, TGS, Calgary, Canada Summary Shale resources characterization has gained attention in the last decade or so, after the Mississippian Barnett
Seismic characterization of Montney shale formation using Passey s approach
 Seismic characterization of Montney shale formation using Passey s approach Ritesh Kumar Sharma*, Satinder Chopra and Amit Kumar Ray Arcis Seismic Solutions, Calgary Summary Seismic characterization of
AER/AGS Special Report 106. Advanced Rock Properties Study using Pulsed Decay Permeametry on the Duvernay Formation, East Shale Basin
 AER/AGS Special Report 106 Advanced Rock Properties Study using Pulsed Decay Permeametry on the Duvernay Formation, East Shale Basin AER/AGS Special Report 106 Advanced Rock Properties Study using Pulsed
Shale gas reservoir characterization workflows
 Shale gas reservoir characterization workflows Satinder Chopra + *, Ritesh K. Sharma +, James Keay + and Kurt J. Marfurt + Arcis Seismic Solutions, Calgary; The University of Oklahoma, Norman Downloaded
Estimation of density from seismic data without long offsets a novel approach.
 Estimation of density from seismic data without long offsets a novel approach. Ritesh Kumar Sharma* and Satinder Chopra Arcis seismic solutions, TGS, Calgary Summary Estimation of density plays an important
Derived Rock Attributes Analysis for Enhanced Reservoir Fluid and Lithology Discrimination
 IOSR Journal of Applied Geology and Geophysics (IOSR-JAGG) e-issn: 2321 0990, p-issn: 2321 0982.Volume 5, Issue 2 Ver. I (Mar. - Apr. 2017), PP 95-105 www.iosrjournals.org Derived Rock Attributes Analysis
Building more robust low-frequency models for seismic impedance inversion
 first break volume 34, May 2016 technical article Building more robust low-frequency models for seismic impedance inversion Amit Kumar Ray 1 and Satinder Chopra 1* Abstract Seismic impedance inversion
An overview of AVO and inversion
 P-486 An overview of AVO and inversion Brian Russell, Hampson-Russell, CGGVeritas Company Summary The Amplitude Variations with Offset (AVO) technique has grown to include a multitude of sub-techniques,
Downloaded 12/02/14 to Redistribution subject to SEG license or copyright; see Terms of Use at
 Hydrocarbon-bearing dolomite reservoir characterization: A case study from eastern Canada Amit Kumar Ray, Ritesh Kumar Sharma* and Satinder Chopra, Arcis Seismic Solutions, TGS, Calgary, Canada. Summary
Comparative Study of AVO attributes for Reservoir Facies Discrimination and Porosity Prediction
 5th Conference & Exposition on Petroleum Geophysics, Hyderabad-004, India PP 498-50 Comparative Study of AVO attributes for Reservoir Facies Discrimination and Porosity Prediction Y. Hanumantha Rao & A.K.
Workflows for Sweet Spots Identification in Shale Plays Using Seismic Inversion and Well Logs
 Workflows for Sweet Spots Identification in Shale Plays Using Seismic Inversion and Well Logs Yexin Liu*, SoftMirrors Ltd., Calgary, Alberta, Canada yexinliu@softmirrors.com Summary Worldwide interest
Reservoir Characterization using AVO and Seismic Inversion Techniques
 P-205 Reservoir Characterization using AVO and Summary *Abhinav Kumar Dubey, IIT Kharagpur Reservoir characterization is one of the most important components of seismic data interpretation. Conventional
Geological Classification of Seismic-Inversion Data in the Doba Basin of Chad*
 Geological Classification of Seismic-Inversion Data in the Doba Basin of Chad* Carl Reine 1, Chris Szelewski 2, and Chaminda Sandanayake 3 Search and Discovery Article #41899 (2016)** Posted September
Thin-Bed Reflectivity An Aid to Seismic Interpretation
 Thin-Bed Reflectivity An Aid to Seismic Interpretation Satinder Chopra* Arcis Corporation, Calgary, AB schopra@arcis.com John Castagna University of Houston, Houston, TX, United States and Yong Xu Arcis
Induced microseismic fracture prediction
 Predicting hydraulically-induced microseismic fractures from seismic inversion volumes: A North Texas Barnett Shale case study Xavier E. Refunjol*, University of Oklahoma, Joël Le Calvez, Schlumberger,
Multiattribute seismic analysis on AVO-derived parameters A case study
 Multiattriute seismic analysis on AVO-derived parameters A case study SATINDER CHOPRA, Core La Reservoir Technologies, Calgary, Canada DOUG PRUDEN, GEDCO, Calgary, Canada Prospecting for reservoir zones
SEG/New Orleans 2006 Annual Meeting
 Carmen C. Dumitrescu, Sensor Geophysical Ltd., and Fred Mayer*, Devon Canada Corporation Summary This paper provides a case study of a 3D seismic survey in the Leland area of the Deep Basin of Alberta,
SCOOP Woodford. Regional Field Study
 SCOOP Woodford Regional Field Study OVERVIEW The Woodford shale is an organic rich siliceous shale formation of late Devonian and early Mississippian age deposited throughout most of the Anadarko basin
Quantifying Bypassed Pay Through 4-D Post-Stack Inversion*
 Quantifying Bypassed Pay Through 4-D Post-Stack Inversion* Robert Woock 1, Sean Boerner 2 and James Gamble 1 Search and Discovery Article #40799 (2011) Posted August 12, 2011 *Adapted from oral presentation
A New AVO Attribute for Hydrocarbon Prediction and Application to the Marmousi II Dataset*
 A New AVO Attribute for Hydrocarbon Prediction and Application to the Marmousi II Dataset* Changcheng Liu 1 and Prasad Ghosh 2 Search and Discovery Article #41764 (2016) Posted January 25, 2016 *Adapted
Maximize the potential of seismic data in shale exploration and production Examples from the Barnett shale and the Eagle Ford shale
 Maximize the potential of seismic data in shale exploration and production Examples from the Barnett shale and the Eagle Ford shale Joanne Wang, Paradigm Duane Dopkin, Paradigm Summary To improve the success
Application of advance tools for reservoir characterization- EEI & Poisson s impedance: A Case Study
 P-272 Application of advance tools for reservoir characterization- EEI & Poisson s impedance: A Case Study Summary Puja Prakash*, S.K.Singh, Binode Chetia, P.K.Chaudhuri, Shyam Mohan, S.K.Das, ONGC Pore
OTC OTC PP. Abstract
 OTC OTC-19977-PP Using Modern Geophysical Technology to Explore for Bypassed Opportunities in the Gulf of Mexico R.A. Young/eSeis; W.G. Holt, G. Klefstad/ Fairways Offshore Exploration Copyright 2009,
Keywords. PMR, Reservoir Characterization, EEI, LR
 Enhancing the Reservoir Characterization Experience through Post Migration Reprocessed (PMR) Data A case study Indrajit Das*, Ashish Kumar Singh, Shakuntala Mangal, Reliance Industries Limited, Mumbai
Integrating reservoir flow simulation with time-lapse seismic inversion in a heavy oil case study
 Integrating reservoir flow simulation with time-lapse seismic inversion in a heavy oil case study Naimeh Riazi*, Larry Lines*, and Brian Russell** Department of Geoscience, University of Calgary **Hampson-Russell
An empirical method for estimation of anisotropic parameters in clastic rocks
 An empirical method for estimation of anisotropic parameters in clastic rocks YONGYI LI, Paradigm Geophysical, Calgary, Alberta, Canada Clastic sediments, particularly shale, exhibit transverse isotropic
Summary. Simple model for kerogen maturity (Carcione, 2000)
") Malleswar Yenugu* and De-hua Han, University of Houston, USA Summary The conversion of kerogen to oil/gas will build up overpressure. Overpressure is caused by conversion of solid kerogen to fluid hydrocarbons
Malleswar Yenugu* and De-hua Han, University of Houston, USA Summary The conversion of kerogen to oil/gas will build up overpressure. Overpressure is caused by conversion of solid kerogen to fluid hydrocarbons
Recap and Integrated Rock Mechanics and Natural Fracture Study on the Bakken Formation, Williston Basin Abstract Figure 1:
 Recap and Integrated Rock Mechanics and Natural Fracture Study on the Bakken Formation, Williston Basin Cosima Theloy, Department of Geology & Geological Engineering Abstract The late Devonian to early
Integrated Reservoir Characterisation - a successful interdisciplinary working model
 Integrated Reservoir Characterisation - a successful interdisciplinary working model Satinder Chopra*, Scott Singleton*, Craig Hall**, Randy Nickerson + and David Carlson +, *Core Laboratories Reservoir
Osareni C. Ogiesoba 1. Search and Discovery Article #10601 (2014)** Posted May 31, 2014
** Posted May 31, 2014") Seismic Multiattribute Analysis for Shale Gas/Oil within the Austin Chalk and Eagle Ford Shale in a Submarine Volcanic Terrain, Maverick Basin, South Texas* Osareni C. Ogiesoba 1 Search and Discovery Article
Seismic Multiattribute Analysis for Shale Gas/Oil within the Austin Chalk and Eagle Ford Shale in a Submarine Volcanic Terrain, Maverick Basin, South Texas* Osareni C. Ogiesoba 1 Search and Discovery Article
Delineating a sandstone reservoir at Pikes Peak, Saskatchewan using 3C seismic data and well logs
 Delineating a sandston reservoir at Pikes Peak Delineating a sandstone reservoir at Pikes Peak, Saskatchewan using 3C seismic data and well logs Natalia L. Soubotcheva and Robert R. Stewart ABSTRACT To
Geophysical and geomechanical rock property templates for source rocks Malleswar Yenugu, Ikon Science Americas, USA
 Geophysical and geomechanical rock property templates for source rocks Malleswar Yenugu, Ikon Science Americas, USA Summary Sweet spot identification for source rocks involve detection of organic rich,
Fluid-property discrimination with AVO: A Biot-Gassmann perspective
 Fluid-property discrimination with AVO: A Biot-Gassmann perspective Brian H. Russell, Ken Hedlin 1, Fred J. Hilterman, and Laurence R. Lines ABSTRACT This paper draws together basic rock physics, AVO,
Seismic reservoir characterisation
 Seismic reservoir characterisation Unconventional reservoir (shale gas) Robert Porjesz 1 2014 B A K E R H U G H E S I N C O R P O R A TED. A LL R I G H TS R E S E R V E D. TERMS A N D C O N D I TI O N
Optimizing Vaca Muerta Development
 Optimizing Vaca Muerta Development What can be applied from seismic experiences in the Eagle Ford and other unconventional plays? Wednesday, September 19, 2012 4:50 PM Murray Roth, President Transform
QUANTITATIVE INTERPRETATION
 QUANTITATIVE INTERPRETATION THE AIM OF QUANTITATIVE INTERPRETATION (QI) IS, THROUGH THE USE OF AMPLITUDE ANALYSIS, TO PREDICT LITHOLOGY AND FLUID CONTENT AWAY FROM THE WELL BORE This process should make
URTeC: Summary
 URTeC: 2665754 Using Seismic Inversion to Predict Geomechanical Well Behavior: a Case Study From the Permian Basin Simon S. Payne*, Ikon Science; Jeremy Meyer*, Ikon Science Copyright 2017, Unconventional
STACK/STACK EXTENSION MERAMEC /OSAGE/ WOODFORD STUDY
 STACK/STACK EXTENSION MERAMEC /OSAGE/ WOODFORD STUDY FIELD STUDIES OVERVIEW NUTECH has combined its expertise with the emerging interest in North American shale plays in order to develop the most detailed
Exploitation of an oil field using AVO and post-stack rock property analysis methods
 Exploitation of an oil field using AVO methods Exploitation of an oil field using AVO and post-stack rock property analysis methods Andrew J. Royle ABSTRACT Prospecting for new reservoir zones in mature
QUANTITATIVE ANALYSIS OF SEISMIC RESPONSE TO TOTAL-ORGANIC-CONTENT AND THERMAL MATURITY IN SHALE GAS PLAYS
 E: infoikonscience.com W: www.ikonscience.com QUANTITATIVE ANALYSIS OF SEISMIC RESPONSE TO TOTAL-ORGANIC-CONTENT AND THERMAL MATURITY IN SHALE GAS PLAYS Ebrahim Zadeh 12, Reza Rezaee 1, Michel Kemper 2
Reservoir connectivity uncertainty from stochastic seismic inversion Rémi Moyen* and Philippe M. Doyen (CGGVeritas)
") Rémi Moyen* and Philippe M. Doyen (CGGVeritas) Summary Static reservoir connectivity analysis is sometimes based on 3D facies or geobody models defined by combining well data and inverted seismic impedances.
Rémi Moyen* and Philippe M. Doyen (CGGVeritas) Summary Static reservoir connectivity analysis is sometimes based on 3D facies or geobody models defined by combining well data and inverted seismic impedances.
Churning seismic attributes with principal component analysis
 Satinder Chopra + * and Kurt J. Marfurt + Arcis Seismic Solutions, Calgary; The University of Oklahoma, Norman Summary Seismic attributes are an invaluable aid in the interpretation of seismic data. Different
Geophysical and geomechanical rock property templates for source rocks Malleswar Yenugu, Ikon Science Americas, USA
 Malleswar Yenugu, Ikon Science Americas, USA Summary Sweet spot identification for source rocks involve detection of organic rich, high porous facies combined with brittleness, which is prone for hydraulic
Technology of Production from Shale
 Technology of Production from Shale Doug Bentley, European Unconventional, Schlumberger May 29 th, 2012 Johannesburg, South Africa What are Unconventional Reservoirs Shale both Gas & Oil Coal Bed Methane
Downloaded 01/29/13 to Redistribution subject to SEG license or copyright; see Terms of Use at
 The value of production logging combined with 3D surface seismic in unconventional plays characterization John Henry Alzate*, Roderick Perez, Deepak Devegowda, Kurt J. Marfurt, The University of Oklahoma
Quito changing isopach of the sand/shale sequences. This was fundamental to assign a realistic
 Quantitative Interpretation of Neural Network Seismic Facies -Oriente Basin Ecuador A. Williamson *, R. Walia, R. Xu, M. Koop, G. Lopez EnCana Corporation, Calgary, CGG Canada Services Ltd., Calgary, Canada
Quantitative Seismic Interpretation An Earth Modeling Perspective
 Quantitative Seismic Interpretation An Earth Modeling Perspective Damien Thenin*, RPS, Calgary, AB, Canada TheninD@rpsgroup.com Ron Larson, RPS, Calgary, AB, Canada LarsonR@rpsgroup.com Summary Earth models
Post-stack inversion of the Hussar low frequency seismic data
 Inversion of the Hussar low frequency seismic data Post-stack inversion of the Hussar low frequency seismic data Patricia E. Gavotti, Don C. Lawton, Gary F. Margrave and J. Helen Isaac ABSTRACT The Hussar
Geophysical model response in a shale gas
 Geophysical model response in a shale gas Dhananjay Kumar and G. Michael Hoversten Chevron USA Inc. Abstract Shale gas is an important asset now. The production from unconventional reservoir like shale
The Application of Data Conditioning, Frequency Decomposition, and RGB Colour Blending in the Gohta Discovery (Barents Sea, Norway)*
*") Click to View Slides The Application of Data Conditioning, Frequency Decomposition, and RGB Colour Blending in the Gohta Discovery (Barents Sea, Norway)* Syed Fakhar Gilani 1, and Luis Gomez 2, and Ryan
Click to View Slides The Application of Data Conditioning, Frequency Decomposition, and RGB Colour Blending in the Gohta Discovery (Barents Sea, Norway)* Syed Fakhar Gilani 1, and Luis Gomez 2, and Ryan
The Link Between Lithology and Rock Fractures in the Duvernay 2015 Gussow Conference
 The Link Between Lithology and Rock Fractures in the Duvernay 2015 Gussow Conference October 13-15, 2015 Presented by: Amy D. Fox, PhD Geomechanics Director Duvernay Overview Upper Devonian Resource Play
The role of seismic modeling in Reservoir characterization: A case study from Crestal part of South Mumbai High field
 P-305 The role of seismic modeling in Reservoir characterization: A case study from Crestal part of South Mumbai High field Summary V B Singh*, Mahendra Pratap, ONGC The objective of the modeling was to
A Regional Diagenetic and Petrophysical Model for the Montney Formation, Western Canada Sedimentary Basin*
 A Regional Diagenetic and Petrophysical Model for the Montney Formation, Western Canada Sedimentary Basin* Noga Vaisblat 1, Nicholas B. Harris 1, Vincent Crombez 2, Tristan Euzen 3, Marta Gasparrini 2,
Applications of texture attribute analysis to 3D seismic data
 INTERPRETER S CORNER Coordinated by Rebecca B. Latimer Applications of texture attribute analysis to 3D seismic data SATINDER CHOPRA and VLADIMIR ALEXEEV, Arcis Corporation, Calgary, Alberta, Canada In
Rock physics and AVO effects in Mississippian-age rocks: Two case studies
 Rock physics and AVO effects in Mississippian-age rocks: Two case studies Case studies in the shallow carbonates of Saskatchwan's Williston basin illustrate the use of Lambda-Mu-Rho analysis and impedance
Correlation of brittleness index with fractures and microstructure in the Barnett Shale
 Correlation of brittleness index with fractures and microstructure in the Barnett Shale Z. Guo (British Geological Survey), M. Chapman (University of Edinburgh), X.Y. Li (British Geological Survey) SUMMARY
Use of Seismic Inversion Attributes In Field Development Planning
 IOSR Journal of Applied Geology and Geophysics (IOSR-JAGG) e-issn: 2321 0990, p-issn: 2321 0982.Volume 6, Issue 2 Ver. II (Mar. Apr. 2018), PP 86-92 www.iosrjournals.org Use of Seismic Inversion Attributes
An Analytic Approach to Sweetspot Mapping in the Eagle Ford Unconventional Play
 An Analytic Approach to Sweetspot Mapping in the Eagle Ford Unconventional Play Murray Roth*, Transform Software and Services, Denver, Colorado, Murray@transformsw.com Michael Roth, Transform Software
Drill Cuttings Analysis: How to Determine the Geology of a Formation and Reservoir
 Drill Cuttings Analysis: How to Determine the Geology of a Formation and Reservoir Chuck Stringer ASA Manager Southern Region 2015 TECH MKT_2014-BD-REG-1673 1 The one item that has lacked serious consideration
We apply a rock physics analysis to well log data from the North-East Gulf of Mexico
 Rock Physics for Fluid and Porosity Mapping in NE GoM JACK DVORKIN, Stanford University and Rock Solid Images TIM FASNACHT, Anadarko Petroleum Corporation RICHARD UDEN, MAGGIE SMITH, NAUM DERZHI, AND JOEL
MITIGATE RISK, ENHANCE RECOVERY Seismically-Constrained Multivariate Analysis Optimizes Development, Increases EUR in Unconventional Plays
 White Paper MITIGATE RISK, ENHANCE RECOVERY Seismically-Constrained Multivariate Analysis Optimizes Development, Increases EUR in Unconventional Plays SM Seismically-Constrained Multivariate Analysis Optimizes
AFI (AVO Fluid Inversion)
") AFI (AVO Fluid Inversion) Uncertainty in AVO: How can we measure it? Dan Hampson, Brian Russell Hampson-Russell Software, Calgary Last Updated: April 2005 Authors: Dan Hampson, Brian Russell 1 Overview
AFI (AVO Fluid Inversion) Uncertainty in AVO: How can we measure it? Dan Hampson, Brian Russell Hampson-Russell Software, Calgary Last Updated: April 2005 Authors: Dan Hampson, Brian Russell 1 Overview
Sequence Stratigraphy of the Upper Cretaceous Niobrara Formation, A Bench, Wattenberg Field, Denver Julesburg Basin, Colorado*
 Sequence Stratigraphy of the Upper Cretaceous Niobrara Formation, A Bench, Wattenberg Field, Denver Julesburg Basin, Colorado* Lisa E. Remington LaChance 1 and Mark C. Robinson 1 Search and Discovery Article
Downloaded 09/09/15 to Redistribution subject to SEG license or copyright; see Terms of Use at
 Reservoir properties estimation from marine broadband seismic without a-priori well information: A powerful de-risking workflow Cyrille Reiser*, Matt Whaley and Tim Bird, PGS Reservoir Limited Summary
Search and Discovery Article #10532 (2013)** Posted October 21, Abstract
** Posted October 21, Abstract") Utilizing the Delta Log R Method for Determining Total Organic Carbon of the Niobrara Formation, B Bench, Denver-Julesburg Basin, Colorado and Wyoming* Madeline K. Beitz 1, Robert Cunningham 2, and Lisa
Utilizing the Delta Log R Method for Determining Total Organic Carbon of the Niobrara Formation, B Bench, Denver-Julesburg Basin, Colorado and Wyoming* Madeline K. Beitz 1, Robert Cunningham 2, and Lisa
Towards Interactive QI Workflows Laurie Weston Bellman*
 Laurie Weston Bellman* Summary Quantitative interpretation (QI) is an analysis approach that is widely applied (Aki and Richards, 1980, Verm and Hilterman, 1995, Avseth et al., 2005, Weston Bellman and
Rock Physics and Quantitative Wavelet Estimation. for Seismic Interpretation: Tertiary North Sea. R.W.Simm 1, S.Xu 2 and R.E.
 Rock Physics and Quantitative Wavelet Estimation for Seismic Interpretation: Tertiary North Sea R.W.Simm 1, S.Xu 2 and R.E.White 2 1. Enterprise Oil plc, Grand Buildings, Trafalgar Square, London WC2N
RESERVOIR SEISMIC CHARACTERISATION OF THIN SANDS IN WEST SYBERIA
 www.senergyltd.com RESERVOIR SEISMIC CHARACTERISATION OF THIN SANDS IN WEST SYBERIA Erick Alvarez, Jaume Hernandez, Bolkhotivin E.A., Belov A.V., Hakima Ben Meradi,Jonathan Hall, Olivier Siccardi, Phil
Enhancement of seismic data quality and interpretation for mapping base Zubair sands of Southeast Kuwait
 Enhancement of seismic data quality and interpretation for mapping base Zubair sands of Southeast Kuwait Rajive Kumar *, Karam, M. Hafez, Anandan Mudavakkat, Aisha Y. Al-Ghareeb, Thekriat Hussain, Ritesh
An empirical study of hydrocarbon indicators
 An empirical study of hydrocarbon indicators Brian Russell 1, Hong Feng, and John Bancroft An empirical study of hydrocarbon indicators 1 Hampson-Russell, A CGGVeritas Company, Calgary, Alberta, brian.russell@cggveritas.com
Optimising Resource Plays An integrated GeoPrediction Approach
 Optimising Resource Plays An integrated GeoPrediction Approach Edward Hoskin, Stephen O Connor, Scott Mildren, Michel Kemper, Cristian Malaver, Jeremy Gallop and Sam Green Ikon Science Ltd. Summary A mechanical
The reason why acoustic and shear impedances inverted
 SPECIAL The Rocky SECTION: Mountain The Rocky region Mountain region Comparison of shear impedances inverted from stacked PS and SS data: Example from Rulison Field, Colorado ELDAR GULIYEV, Occidental
Determination of Duvernay Formation Reservoir Properties through Probabilistic Petrophysical Analysis calibrated to Core Studies.
 Determination of Duvernay Formation Reservoir Properties through Probabilistic Petrophysical Analysis calibrated to Core Studies. Nasir Rahim, Neil Watson Canadian Discovery Ltd. Summary The petrophysical
Downloaded 09/16/16 to Redistribution subject to SEG license or copyright; see Terms of Use at
 Ehsan Zabihi Naeini*, Ikon Science & Russell Exley, Summit Exploration & Production Ltd Summary Quantitative interpretation (QI) is an important part of successful Central North Sea exploration, appraisal
Search and Discovery Article # (2015) Posted April 20, 2015
 Posted April 20, 2015") Considering the Vertical Variation in Rock Mechanical Properties of a Lithologic Zone Using Laboratory Derived Data Is it Time for Geomechanical Stratigraphy?* Douglas E. Wyatt 1, Jesse Hampton 1, Dandan
Considering the Vertical Variation in Rock Mechanical Properties of a Lithologic Zone Using Laboratory Derived Data Is it Time for Geomechanical Stratigraphy?* Douglas E. Wyatt 1, Jesse Hampton 1, Dandan
Petrophysical Study of Shale Properties in Alaska North Slope
 Petrophysical Study of Shale Properties in Alaska North Slope Minh Tran Tapan Mukerji Energy Resources Engineering Department Stanford University, CA, USA Region of Interest 1.5 miles 20 miles Stratigraphic
Rock Physics of Organic Shale and Its Implication
 Rock Physics of Organic Shale and Its Implication Lev Vernik, Marathon Oil Corporation, Houston, USA lvernik@marathonoil.com Yulia Khadeeva, Marathon Oil Corporation, Houston, USA Cris Tuttle, Marathon
Lithology Evaluation of Bazhenov Formation Reservoir using Seismic and Well Log Analysis
 Lithology Evaluation of Bazhenov Formation Reservoir using Seismic and Well Log Analysis N Y Lomakina Petroleum Learning Centre Tomsk Polytechnic University Tomsk, Russia Abstract Bazhenov formation is
Linearized AVO and Poroelasticity for HRS9. Brian Russell, Dan Hampson and David Gray 2011
 Linearized AO and oroelasticity for HR9 Brian Russell, Dan Hampson and David Gray 0 Introduction In this talk, we combine the linearized Amplitude ariations with Offset (AO) technique with the Biot-Gassmann
3D Seismic Reservoir Characterization and Delineation in Carbonate Reservoir*
 3D Seismic Reservoir Characterization and Delineation in Carbonate Reservoir* M. N. Alamsyah 1, Bambang W. Handono 1, and Andri Syafriya 1 Search and Discovery Article #41760 (2016) Posted January 25,
Modeling Optimizes Asset Performance By Chad Baillie
 MARCH 2016 The Better Business Publication Serving the Exploration / Drilling / Production Industry Modeling Optimizes Asset Performance By Chad Baillie MISSOURI CITY, TX. As more well and completion data
Petrophysical Rock Typing: Enhanced Permeability Prediction and Reservoir Descriptions*
 Petrophysical Rock Typing: Enhanced Permeability Prediction and Reservoir Descriptions* Wanida Sritongthae 1 Search and Discovery Article #51265 (2016)** Posted June 20, 2016 *Adapted from oral presentation
Interpretation and Reservoir Properties Estimation Using Dual-Sensor Streamer Seismic Without the Use of Well
 Interpretation and Reservoir Properties Estimation Using Dual-Sensor Streamer Seismic Without the Use of Well C. Reiser (Petroleum Geo-Services), T. Bird* (Petroleum Geo-Services) & M. Whaley (Petroleum
Simultaneous Inversion of Clastic Zubair Reservoir: Case Study from Sabiriyah Field, North Kuwait
 Simultaneous Inversion of Clastic Zubair Reservoir: Case Study from Sabiriyah Field, North Kuwait Osman Khaled, Yousef Al-Zuabi, Hameed Shereef Summary The zone under study is Zubair formation of Cretaceous
RESERVOIR CHARACTERIZATION FOR UNCONVENTIONAL RESOURCE POTENTIAL, PITSANULOK BASIN, ONSHORE THAILAND. Prat Boonyasatphan
 RESERVOIR CHARACTERIZATION FOR UNCONVENTIONAL RESOURCE POTENTIAL, PITSANULOK BASIN, ONSHORE THAILAND by Prat Boonyasatphan Copyright by Prat Boonyasatphan, 2017 All Rights Reserved A thesis submitted to
Rock Physics of Shales and Source Rocks. Gary Mavko Professor of Geophysics Director, Stanford Rock Physics Project
 Rock Physics of Shales and Source Rocks Gary Mavko Professor of Geophysics Director, Stanford Rock Physics Project 1 First Question: What is Shale? Shale -- a rock composed of mud-sized particles, such
Practical aspects of AVO modeling
 Practical aspects of AVO modeling YONGYI LI, Paradigm Geophysical, Calgary, Canada JONATHAN DOWNTON, Veritas, Calgary, Canada, YONG XU, Arcis Corporation, Calgary, Canada AVO (amplitude variation with
Sensitivity Analysis of Pre stack Seismic Inversion on Facies Classification using Statistical Rock Physics
 Sensitivity Analysis of Pre stack Seismic Inversion on Facies Classification using Statistical Rock Physics Peipei Li 1 and Tapan Mukerji 1,2 1 Department of Energy Resources Engineering 2 Department of
RC 1.3. SEG/Houston 2005 Annual Meeting 1307
 from seismic AVO Xin-Gong Li,University of Houston and IntSeis Inc, De-Hua Han, and Jiajin Liu, University of Houston Donn McGuire, Anadarko Petroleum Corp Summary A new inversion method is tested to directly
Interpretation of baseline surface seismic data at the Violet Grove CO 2 injection site, Alberta
 Violet Grove seismic interpretation Interpretation of baseline surface seismic data at the Violet Grove CO 2 injection site, Alberta Fuju Chen and Don Lawton ABSTRACT Time-lapse seismic technology has
Enhanced Formation Evaluation of Shales Using NMR Secular Relaxation*
 Enhanced Formation Evaluation of Shales Using NMR Secular Relaxation* Hugh Daigle 1, Andrew Johnson 1, Jameson P. Gips 1, and Mukul Sharma 1 Search and Discovery Article #41411 (2014)** Posted August 11,
Fred Mayer 1; Graham Cain 1; Carmen Dumitrescu 2; (1) Devon Canada; (2) Terra-IQ Ltd. Summary
 Devon Canada; (2) Terra-IQ Ltd. Summary") 2401377 Statistically Improved Resistivity and Density Estimation From Multicomponent Seismic Data: Case Study from the Lower Cretaceous McMurray Formation, Athabasca Oil Sands Fred Mayer 1; Graham Cain
2401377 Statistically Improved Resistivity and Density Estimation From Multicomponent Seismic Data: Case Study from the Lower Cretaceous McMurray Formation, Athabasca Oil Sands Fred Mayer 1; Graham Cain
Surface seismic data have proven to be an invaluable
 SPECIAL Practical SECTION: applications Practical of applications anisotropy of anisotropy ARCANGELO SENA, GABINO CASTILLO, KEVIN CHESSER, SIMON VOISEY, JORGE ESTRADA, JUAN CARCUZ, EMILIO CARMONA, and
Recent advances in application of AVO to carbonate reservoirs: case histories
 Recent advances in application of AVO to reservoirs: case histories Yongyi Li, Bill Goodway*, and Jonathan Downton Core Lab Reservoir Technologies Division *EnCana Corporation Summary The application of
Pre-stack (AVO) and post-stack inversion of the Hussar low frequency seismic data
 and post-stack inversion of the Hussar low frequency seismic data") Pre-stack (AVO) and post-stack inversion of the Hussar low frequency seismic data A.Nassir Saeed, Gary F. Margrave and Laurence R. Lines ABSTRACT Post-stack and pre-stack (AVO) inversion were performed
Pre-stack (AVO) and post-stack inversion of the Hussar low frequency seismic data A.Nassir Saeed, Gary F. Margrave and Laurence R. Lines ABSTRACT Post-stack and pre-stack (AVO) inversion were performed
The Marrying of Petrophysics with Geophysics Results in a Powerful Tool for Independents Roger A. Young, eseis, Inc.
 The Marrying of Petrophysics with Geophysics Results in a Powerful Tool for Independents Roger A. Young, eseis, Inc. While the application of new geophysical and petrophysical technology separately can
Reservoir properties inversion from AVO attributes
 Reservoir properties inversion from AVO attributes Xin-gang Chi* and De-hua Han, University of Houston Summary A new rock physics model based inversion method is put forward where the shaly-sand mixture
Multiple horizons mapping: A better approach for maximizing the value of seismic data
 Multiple horizons mapping: A better approach for maximizing the value of seismic data Das Ujjal Kumar *, SG(S) ONGC Ltd., New Delhi, Deputed in Ministry of Petroleum and Natural Gas, Govt. of India Email:
Calculating Total Organic Carbon (TOC) using the Passey Method
 using the Passey Method") Calculating Total Organic Carbon (TOC) using the Passey Method Chris Gent Overview 1. Passey method 2. Importance of TOC and maturity data. 3. Case Study: The Weald, UK. 1. The Passey Method A Practical
Calculating Total Organic Carbon (TOC) using the Passey Method Chris Gent Overview 1. Passey method 2. Importance of TOC and maturity data. 3. Case Study: The Weald, UK. 1. The Passey Method A Practical