USING A GEOGRAPHIC INFORMATION SYSTEM TO PREDICT FLOW DURATION CURVES AT UNGAGED STREAM SITES IN GUAM
|
|
|
- Rodger Gallagher
- 5 years ago
- Views:
Transcription


1 USING A GEOGRAPHIC INFORMATION SYSTEM TO PREDICT FLOW DURATION CURVES AT UNGAGED STREAM SITES IN GUAM Dr. Leroy F. Heitz lheitz@triton.uog.edu Dr. Shahram Khosrowpanah khosrow@triton.uog.edu Water and Environmental Research Institute of the Western Pacific, University of Guam, Mangilao, Guam, USA Page 1


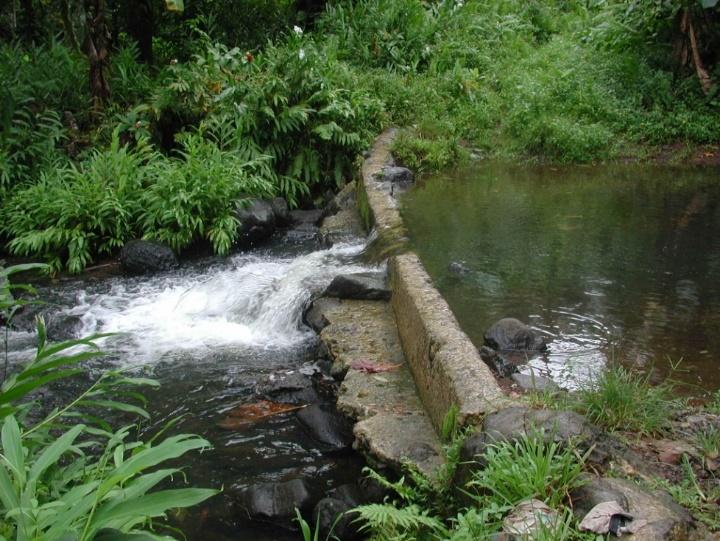
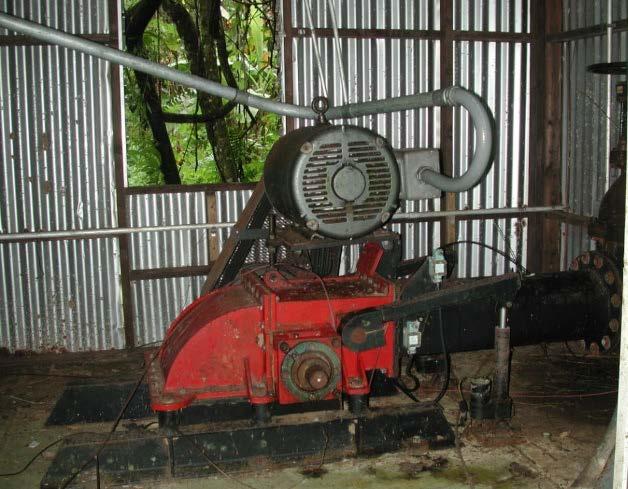
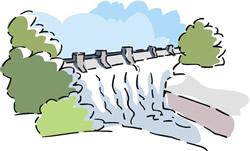
2 ALWAYS A NEED FOR HYDROLOGIC INFORMATION WATER SUPPLY RESERVOIRS INSTREAM FLOWS Page 2 HYDROPOWER
3 HYDROLOGIC DATA NEEDS THAT WE CONCENTRATED ON AVERAGE FLOWS IN STREAMS FLOW VARIABILITY IN STREAMS Page 3
4 WHAT S THIS PROJECT IS ALL ABOUT AGE OLD HYDROLOGY PROBLEM GAGE SITE AT GAGE SITES We Can Compute AVERAGE FLOW AND FLOW VARIABILITY Page 4

5 WHAT S THIS PROJECT ALL ABOUT UN-GAGED STREAM SITES?? NO DATA Page 5
6 PROJECT GOALS DEVELOP AVERAGE FLOW AND FLOW VARIABILITY FOR UN-GAGED STREAM SITES IN SOUTH GUAM FOR ALL POINTS ALONG MAJOR STREAMS FOR SIMILAR SEGMENTS OF STREAMS CALLED REACHES Page 6


7 FIRST STEP WAS TO DEVELOP CURVES THAT DESCRIBE FLOW VARIABILITY AT GAGED SITES Page 7
8 STREAM GAGES USED IN THE PROJECT GUAM STREAMFLOW DATA AVAILABILITY (53-82) MISSING DATA 1/1/1953 1/1/1955 1/1/1957 1/1/1959 1/1/1961 1/1/1963 1/1/1965 1/1/1967 1/1/1969 1/1/1971 1/1/1973 1/1/1975 1/1/1977 1/1/1979 1/1/1981 1/1/1983 Aplacho River 2.3 Umatac River 8.52 La Sa Fua River 4.42 Imong River 9.71 Almagosa River 6.4 Maulap River 5.09 Ugum above Ugum River near Pago River 25.7 Ylig River Finile 1.41 Inarajan Tianaga 5.61 Cetti River 4.34 Geus 3.00 La Sa Fua 4.42 Tolyaeyuus Agat Talofofo Lonfit Page 8
9 UMATAC GAGE FLOW DATA FROM USGS WEB SITE # Data provided for site # DD parameter statistic Description # Discharge, cubic feet per second (Mean) # # Data-value qualification codes included in this output: # A Approved for publication -- Processing and review completed. # e Value has been estimated. # agency_cd site_no datetime 01_00060_01_00060_00003_cd 5s 15s 20d 14n 10s USGS /1/ A USGS /2/ A USGS /3/ A USGS /4/ A USGS /5/ A USGS /6/ A USGS /7/ A USGS /8/ A USGS /9/ A DAILY AVERAGE FLOW CFS Page 9
10 UMATAC GAGE FLOW DURATION CURVE SIMPLE STATISTICAL FLOW VARIABILITY REPRESENTATION UMATAC FLOW DURATON ALL DATA Flow FLOW IN CFS % 10% 20% 30% 40% 50% 60% 70% 80% 90% 100% % of time flow is PERCENT equaled OF TIME FLOW IS EQUALED or exceeded OR EXCEEDED Page 10
11 PARAMETRIC FLOW DURATION CURVE DATA GAGE AVG 0% 10% 30% 50% 80% 95% UMATAC IMONG PAGO YLIG FINILE INARAJAN TINAGO GUESS UGUM NR FROM DURATION CURVES: PICK OFF AVERAGE, 0%, 10%, 30%, 50%, 80%, AND 95% FOR EACH GAGE PLOT ALL: 0% VS AVERAGE, 10% VERSUS AVERAGE, 30%VS AVERAGE, 50% VS AVERAGE, 80% VS AVERAGE, AND 95% VS AVERAGE Page 11
12 PARAMETRIC FLOW DURATION CURVES EXCEEDANCE PERCENT FLOW (CFS) EXCEEDANCE PERCENT FLOW (CFS) PARAMETRIC CURVES ( ) 0 % 10 % 30 % 50 % 80 % 95 % y = x R² = y = 1.876x R² = y = 0.769x R² = y = x R² = y = x R² = y = x R² = AVERAGE FLOW (CFS) AVERAGE FLOW (CFS) 0% 10% 30% 50% 80% 95% Power (0%) Power (10%) Power (30%) Power (50%) Power (80%) Power (95%) WE GET A REGRESSION EQUATION FOR EACH DATA SET Page 12
13 USING PARAMETRIC FLOW DURATION CURVES TO PREDICT DURATION CURVE AT AN UN-GAGED SITE EXCEEDANCE PERCENT FLOW (CFS) EXCEEDANCE PERCENT FLOW (CFS) PARAMETRIC CURVES ( ) 0 % 10 % 30 % 50 % 80 % 95 % y = x R² = y = 1.876x R² = y = 0.769x R² = y = x R² = y = x R² = y = x R² = AVERAGE FLOW (CFS) AVERAGE FLOW (CFS) 25 CFS 0% 10% 30% 50% 80% 95% Power (0%) Power (10%) Power (30%) Power (50%) Power (80%) Power (95%) Page 13
14 RECONSTRUCTED SITE FLOW DURATION CURVE FOR AVG. Q = 25 CFS) SITE FLOW DURATION CURVE FLOW (CFS) FLOW IN CFS % 10% 20% 30% 40% 50% 60% 70% 80% 90% 100% EXCEEDANCE PERCENT EXCEEDANCE PERCENT Page 14
15 WE ARE ½ WAY THERE WHAT WAS NEEDED NEXT WAS A WAY TO PREDICT THE AVERAGE FLOW AT OUR UNGAGED RIVER LOCATIONS Page 15
16 WE USED SOME GIS BLACK MAGIC TO GET THE AVERAGE FLOWS Page 16

17 STARTING POINT WAS NORMAL ANNUAL PRECIPITATION (NAP) LINES from WERI Technical Report 102 By Guard and Lander As Modified by M. Lander Page 17
18 DEVELOPED NORMAL ANNUAL PRECIPITATION GRID FROM NAP LINES USING GIS EACH GRID SQUARE CONTAINS THE VALUE OF THE AVERAGE ANNUAL RAIN FALLING ON THAT SQUARE USED TOPO TO RASTER TOOL Page 18
19 IF WE COULD ADD UP ALL THE RAINFALL FALLING IN A WATERSHED TO A POINT IN A STREAM WE WOULD HAVE THE ANNUAL PRECIPITATION INPUT TO THAT POINT Page 19
20 POSSIBLE THROUGH THE BLACK- MAGIC OF GIS USING GIS HYDROLOGY TOOLS DEVELOPED DRAINAGE PATHWAYS FOR ALL OF THE STREAMS SUMMED UP THE AVERAGE ANNUAL RAINFALL FALLING IN THESE PATHWAYS RESULTS WERE AVERAGE ANNUAL PRECIPITATION INPUT TO THE STREAM Page 20
21 FIRST STEP WAS TO APPLY WATERSHED FUNCTIONS TO A DIGITAL ELEVATION MODEL USING GIS HYDROLOGY TOOLS FILLED SINKS IN DATA GUAM LIDAR DATA CREATED A FLOW DIRECTION GRID CREATED A CELL ACCUMULATION GRID WHICH DEFINED THE STREAM PATHWAYS Page 21

22 COMBINED THE FLOW DIRECTION GRID WITH THE PRECIPITATION GRID USING GIS HYDROLOGY TOOLS CREATED A WEIGHTED ACCUMULATION GRID BY SUMMING AVERAGE PRECIPITATION IN THE STREAM PATHS Page 22

23 RESULTS WAS THE ANNUAL PRECIPITATION INPUT ALONG THE STREAM PATHWAYS PRECIP INPUT CFS-YR ALSO COMPUTED DRAINAGE AREAS ALONG ALL THE STREAMS NOTE: UNITS = AVERAGE ANNUAL FLOW IN CFS REQUIRED TO EQUAL THE POTENTIAL ANNUAL VOLUME OF RAINFALL FLOWING PAST THAT POINT IN ONE YEAR Page 23
24 COMPARED AVERAGE PRECIPITATION INPUT TO AVERAGE ANNUAL FLOW FROM GIS PRECIPITATION INPUT (CFS) AVERAGE FLOW (CFS) RUNOFF FACTOR DRAINAGE AREA (SQ. MILES) UMATAC IMONG PAGO YLIG FINILE INARAJAN TINAGO GUESS UGUM NR TALOFOFO AAAAAAAAAAAAAA FFFFFFFF RRRRRRRRRRRR FFFFFFFFFFFF = PPPPPPPPPPPPPPPPPPPPPPPPPP IIIIIIIIII Page 24
25 DEVELOPED AN AVERAGE FLOW VS PRECIPITATION INPUT RELATIONSHIP 35 GUAM RIVERS PRECIPITATION INPUT VS AVERAGE FLOW DATA AVERAGE FLOW (CFS) AVERAGE FLOW (CFS) y = x R² = AVERAGE ANNUAL PRECIPITATION INPUT (CFS) AVERAGE ANNUAL PRECIPITATION INPUT (CFS) PRECIPITATION INPUT (CFS) AAAAAAAAAAAAAA FFFFFFFF = XX AAAAAAAAAAAA AAAAAAAAAAAA PPPPPPPPPPPPPPPPPPPPPPPPPP RR 2 = Page 25

26 APPLIED THE GIS RASTER CALCULATOR TOOL TO COMPUTE AVERAGE FLOW AVERAGE FLOW CFS AVERAGE FLOW COMPUTED FOR ALL POINTS ALONG ALL STREAMS AAAAAAAAAAAAAA FFFFFFFF = XX PPPPPPPPPPPPPPPPPPPPPPPPPP IIIIIIIIII Page 26
27 USED RASTER CALCULATOR TOOL AGAIN TO COMPUTE FLOW DURATION VALUES ALONG THE STREAMS DURATION VALUES COMPUTED FOR ALL POINTS ALONG ALL STREAMS Page 27
28 FLOWS IDENTIFIED IN ALL STREAMS IN SOUTH GUAM Page 28
29 ROAD BRIDGE ISSUES ROAD FILL FILLED AREA ROAD FILL Page 29
30 ISSUES WITH GIS ACCUMULATION FUNCTION ELEVATION GRID FILE VERY LARGE THE ACCUMULATION FUNCTION WOULD NOT RUN TO COMPLETION WE RESAMPLED THE ELEVATION DATA GUAM LIDAR DATA 1M GRID 1.9 GB Page 30


31 SIMILAR STUDIES DONE FOR POHNPEI AND KOSRAE, FSM 2200 MILES ISLAND OF POHNPEI, FSM ISLAND OF KOSRAE, FSM Page 31
32 FOR MORE DETAILS SEE WERI TECHNICAL REPORTS Prediction of flow duration curves for use in hydropower analysis at ungaged sites in Pohnpei, FSM, Report #129, Prediction of flow duration curves for use in hydropower analysis at ungaged sites in Kosrae, FSM, Report #137, Prediction of Flow Duration Curves at Ungaged Sites on Guam Report #154, Page 32

33 GIS MAPS ON LINE DIGITAL ATLAS OF SOUTHERN GUAM hydroguam.net/ Page 33
34 THANKS TO WERI and the USGS Water Institute Program that funded the project USGS Pacific Island Water Science center who with the support of WERI and the Government of Guam maintain the stream flow gaging net work in Guam Dr. Nathan Habana at WERI for keeping my ARCMAP GIS program updated and helping with the LIDAR Elevation Data All the Government of Guam Agencies who s forward thinking funded the development of the LIDAR Elevation data Page 34
35 THANKS FOR YOUR TIME QUESTIONS OR COMMENTS Page 35
StreamStats: Delivering Streamflow Information to the Public. By Kernell Ries
 StreamStats: Delivering Streamflow Information to the Public By Kernell Ries U.S. Department of the Interior U.S. Geological Survey MD-DE-DC District 410-238-4317 kries@usgs.gov StreamStats Web Application
GIS in Water Resources Exercise #4 Solution Prepared by Irene Garousi-Nejad and David Tarboton
 GIS in Water Resources Exercise 4 Solution Prepared by Irene Garousi-Nejad and David Tarboton 1. Cell length (N-S) in m, width (E-W) in m, area in m 2 for the DEM cells in the merged DEM. N-S y = R e φ
Big Wood River. General Information
 General Information The flows out of the southern portion of the Sawtooth National Recreation Area in central Idaho. The study reach is about a,200 ft length of river about.5 miles upstream from the discontinued
Introducing Iowa StreamStats Version 4, a Redesign of the USGS Application for Estimating Streamflow Stats
 Introducing Iowa StreamStats Version 4, a Redesign of the USGS Application for Estimating Streamflow Stats Presented at the 2016 Iowa Water Conference Ames, IA March 24, 2016 by David Eash U.S. Geological
HYDROLOGIC AND WATER RESOURCES EVALUATIONS FOR SG. LUI WATERSHED
 HYDROLOGIC AND WATER RESOURCES EVALUATIONS FOR SG. LUI WATERSHED 1.0 Introduction The Sg. Lui watershed is the upper part of Langat River Basin, in the state of Selangor which located approximately 20
Table (6): Annual precipitation amounts as recorded by stations X and Y. No. X Y
: Annual precipitation amounts as recorded by stations X and Y. No. X Y") Example: X and Y are two neighboring rainfall stations. Station X has complete records and station Y has some missing values. Find the linear correlation equation between the two series as mentioned in
Example: X and Y are two neighboring rainfall stations. Station X has complete records and station Y has some missing values. Find the linear correlation equation between the two series as mentioned in
Base Level Engineering FEMA Region 6
 Base Level Engineering Over the past five years, has been evaluating its investment approach and data preparation work flow to establish an efficient and effective change in operation, generating an approach
Detailed Storm Rainfall Analysis for Hurricane Ivan Flooding in Georgia Using the Storm Precipitation Analysis System (SPAS) and NEXRAD Weather Radar
 and NEXRAD Weather Radar") Detailed Storm Rainfall Analysis for Hurricane Ivan Flooding in Georgia Using the Storm Precipitation Analysis System (SPAS) and NEXRAD Weather Radar Ed Tomlinson, PhD and Bill Kappel Applied Weather Associates
Detailed Storm Rainfall Analysis for Hurricane Ivan Flooding in Georgia Using the Storm Precipitation Analysis System (SPAS) and NEXRAD Weather Radar Ed Tomlinson, PhD and Bill Kappel Applied Weather Associates
Section 4: Model Development and Application
 Section 4: Model Development and Application The hydrologic model for the Wissahickon Act 167 study was built using GIS layers of land use, hydrologic soil groups, terrain and orthophotography. Within
Leon Creek Watershed October 17-18, 1998 Rainfall Analysis Examination of USGS Gauge Helotes Creek at Helotes, Texas
 Leon Creek Watershed October 17-18, 1998 Rainfall Analysis Examination of USGS Gauge 8181400 Helotes Creek at Helotes, Texas Terrance Jackson MSCE Candidate University of Texas San Antonio Abstract The
used to transport sediments throughout the lands. In this regard, understanding erosion is
 David Rounce GIS in Water Resources 11/23/2010 Erosion Potential in Travis County INTRODUCTION Erosion has played a vital role in the morphology of the Earth as its processes have been used to transport
Objectives: After completing this assignment, you should be able to:
 Data Analysis Assignment #1 Evaluating the effects of watershed land use on storm runoff Assignment due: 21 February 2013, 5 pm Objectives: After completing this assignment, you should be able to: 1) Calculate
Using the Stock Hydrology Tools in ArcGIS
 Using the Stock Hydrology Tools in ArcGIS This lab exercise contains a homework assignment, detailed at the bottom, which is due Wednesday, October 6th. Several hydrology tools are part of the basic ArcGIS
GIS in Water Resources Midterm Quiz Fall There are 5 questions on this exam. Please do all 5. They are of equal credit.
 Page 1 of 7 Name: GIS in Water Resources Midterm Quiz Fall 2004 There are 5 questions on this exam. Please do all 5. They are of equal credit. 1. In exercises in this class you have developed the skills
Napa Watershed Water Year Classification Methodology 1
 Napa Watershed Water Year Classification Methodology 1 Methodology to Classify Water Years An online data management and reporting platform ITAS) is being created for the Napa River Watershed to track
Changes to Extreme Precipitation Events: What the Historical Record Shows and What It Means for Engineers
 Changes to Extreme Precipitation Events: What the Historical Record Shows and What It Means for Engineers Geoffrey M Bonnin National Oceanic and Atmospheric Administration National Weather Service Office
USGS National Hydrography Dataset (NHD) and NHDPlus
 and NHDPlus") + 1 + USGS National Hydrography Dataset (NHD) and NHDPlus Al Rea USGS National Geospatial Program Western States Water Council August 1, 2018 + 2 USGS National Hydrography Datasets Hydrologic networks,
+ 1 + USGS National Hydrography Dataset (NHD) and NHDPlus Al Rea USGS National Geospatial Program Western States Water Council August 1, 2018 + 2 USGS National Hydrography Datasets Hydrologic networks,
Results of Intensity-Duration- Frequency Analysis for Precipitation and Runoff under Changing Climate
 Results of Intensity-Duration- Frequency Analysis for Precipitation and Runoff under Changing Climate Supporting Casco Bay Region Climate Change Adaptation RRAP Eugene Yan, Alissa Jared, Julia Pierce,
REDWOOD VALLEY SUBAREA
 Independent Science Review Panel Conceptual Model of Watershed Hydrology, Surface Water and Groundwater Interactions and Stream Ecology for the Russian River Watershed Appendices A-1 APPENDIX A A-2 REDWOOD
Lecture 2: Precipitation
 2-1 GEOG415 Lecture 2: Precipitation Why do we study precipitation? Precipitation measurement -- depends on the study purpose. Non-recording (cumulative) Recording (tipping bucket) Important parameters
Another 100-Year Storm. October 26, 2016 Mark Dennis, PE, CFM
 Another 100-Year Storm October 26, 2016 Mark Dennis, PE, CFM Agenda Are severe rainfall events becoming more frequent? Is there confusion about the 100-year storm that makes it seem like they happen all
The National Hydrography Dataset in the Pacific Region. U.S. Department of the Interior U.S. Geological Survey
 The National Hydrography Dataset in the Pacific Region U.S. Department of the Interior U.S. Geological Survey The National Map The National Map is built on partnerships and standards The National Map consists
Appendix D. Model Setup, Calibration, and Validation
 . Model Setup, Calibration, and Validation Lower Grand River Watershed TMDL January 1 1. Model Selection and Setup The Loading Simulation Program in C++ (LSPC) was selected to address the modeling needs
Designing a Dam for Blockhouse Ranch. Haley Born
 Designing a Dam for Blockhouse Ranch Haley Born CE 394K GIS in Water Resources Term Paper Fall 2011 Table of Contents Introduction... 1 Data Sources... 2 Precipitation Data... 2 Elevation Data... 3 Geographic
Climatic Change Implications for Hydrologic Systems in the Sierra Nevada
 Climatic Change Implications for Hydrologic Systems in the Sierra Nevada Part Two: The HSPF Model: Basis For Watershed Yield Calculator Part two presents an an overview of why the hydrologic yield calculator
9. PROBABLE MAXIMUM PRECIPITATION AND PROBABLE MAXIMUM FLOOD
 9. PROBABLE MAXIMUM PRECIPITATION AND PROBABLE MAXIMUM FLOOD 9.1. Introduction Due to the size of Watana Dam and the economic importance of the Project to the Railbelt, the Probable Maximum Flood (PMF)
USING GIS TO MODEL AND ANALYZE HISTORICAL FLOODING OF THE GUADALUPE RIVER NEAR NEW BRAUNFELS, TEXAS
 USING GIS TO MODEL AND ANALYZE HISTORICAL FLOODING OF THE GUADALUPE RIVER NEAR NEW BRAUNFELS, TEXAS ASHLEY EVANS While the state of Texas is well-known for flooding, the Guadalupe River Basin is one of
Hydrologic Engineering Applications of Geographic Information Systems
 Hydrologic Engineering Applications of Geographic Information Systems Davis, California Objectives: The participant will acquire practical knowledge and skills in the application of GIS technologies for
CE 394K.3 GIS in Water Resources Midterm Quiz Fall There are 5 questions on this exam. Please do all 5. They are of equal credit.
 Name: CE 394K.3 GIS in Water Resources Midterm Quiz Fall 2000 There are 5 questions on this exam. Please do all 5. They are of equal credit. 1. The ArcView Geographic Information System can display different
PRELIMINARY DRAFT FOR DISCUSSION PURPOSES
 Memorandum To: David Thompson From: John Haapala CC: Dan McDonald Bob Montgomery Date: February 24, 2003 File #: 1003551 Re: Lake Wenatchee Historic Water Levels, Operation Model, and Flood Operation This
Hydrologically Consistent Pruning of the High- Resolution National Hydrography Dataset to 1:24,000-scale
 Hydrologically Consistent Pruning of the High- Resolution National Hydrography Dataset to 1:24,000-scale Lawrence V. Stanislawski 1, Ariel Doumbouya 2, Barbara P. Buttenfield 3, 1 Center for Excellence
HyMet Company. Streamflow and Energy Generation Forecasting Model Columbia River Basin
 HyMet Company Streamflow and Energy Generation Forecasting Model Columbia River Basin HyMet Inc. Courthouse Square 19001 Vashon Hwy SW Suite 201 Vashon Island, WA 98070 Phone: 206-463-1610 Columbia River
ARMSTRONG COUNTY, PA
 ARMSTRONG COUNTY, PA Revised Preliminary DFIRM Mapping March 31, 2013 Kevin Donnelly, P.E., CFM GG3, Greenhorne & O Mara, Inc. Presentation Agenda Armstrong County DFIRM Overview - June 25, 2010 DFIRM
Ed Tomlinson, PhD Bill Kappel Applied Weather Associates LLC. Tye Parzybok Metstat Inc. Bryan Rappolt Genesis Weather Solutions LLC
 Use of NEXRAD Weather Radar Data with the Storm Precipitation Analysis System (SPAS) to Provide High Spatial Resolution Hourly Rainfall Analyses for Runoff Model Calibration and Validation Ed Tomlinson,
SPATIAL DISTRIBUTION OF BADLANDS IN THE UGUM WATERSHED: CHARACTERIZATION AND TEMPORAL ANALYSIS. By Shahram Khosrowpanah Yuming Wen Maria Kottermair
 SPATIAL DISTRIBUTION OF BADLANDS IN THE UGUM WATERSHED: CHARACTERIZATION AND TEMPORAL ANALYSIS By Shahram Khosrowpanah Yuming Wen Maria Kottermair Technical Report No. 126 March 2010 SPATIAL DISTRIBUTION
Squaw Creek. General Information
 General Information is a tributary to the Salmon River. It enters the north side of the river about 0 miles downstream of North Fork, Idaho. The study reach is about a 30 ft length of stream about 2 miles
Valenciano Reservoir Safe Yield Study. Prepared by: CSA Architects & Engineers, LLP
 Valenciano Reservoir Safe Yield Study Prepared by: CSA Architects & Engineers, LLP CSA Group Prepared for: Puerto Rico Aqueduct and Sewer Authority Planning TABLE OF CONTENTS 1 Introduction...1 1.1 Safe
Near Real-Time Runoff Estimation Using Spatially Distributed Radar Rainfall Data. Jennifer Hadley 22 April 2003
 Near Real-Time Runoff Estimation Using Spatially Distributed Radar Rainfall Data Jennifer Hadley 22 April 2003 Introduction Water availability has become a major issue in Texas in the last several years,
ESTIMATING JOINT FLOW PROBABILITIES AT STREAM CONFLUENCES USING COPULAS
 ESTIMATING JOINT FLOW PROBABILITIES AT STREAM CONFLUENCES USING COPULAS Roger T. Kilgore, P.E., D. WRE* Principal Kilgore Consulting and Management 2963 Ash Street Denver, CO 80207 303-333-1408 David B.
Engineering Technical Note No. 3 Rainfall-Frequency and Design Rainfall Distribution for Selected Pacific Islands
 Engineering Technical Note No. 3 Rainfall-Frequency and Design Rainfall Distribution for Selected Pacific Islands Issued September 2008 The U.S. Department of Agriculture (USDA) prohibits discriation in
5/4/2017 Fountain Creek. Gage Analysis. Homework 6. Clifton, Cundiff, Pour, Queen, and Zey CIVE 717
 5/4/2017 Fountain Creek Gage Analysis Homework 6 Clifton, Cundiff, Pour, Queen, and Zey CIVE 717 Introduction: The CIVE 717 class members, Nate Clifton, Susan Cundiff, Ali Reza Nowrooz Pour, Robbie Queen
Determination of Urban Runoff Using ILLUDAS and GIS
 Texas A&M University Department of Civil Engineering Instructor: Dr. Francisco Olivera CVEN689 Applications of GIS to Civil Engineering Determination of Urban Runoff Using ILLUDAS and GIS Tae Jin Kim 03.
Natural Variability in Annual Maximum Water Level and Outflow of Yellowstone Lake
 Natural Variability in Annual Maximum Water Level and Outflow of Yellowstone Lake Phillip E. Farnes Abstract The water level in Yellowstone Lake varies each year in response to differences in the winter
Chapter 5 CALIBRATION AND VERIFICATION
 Chapter 5 CALIBRATION AND VERIFICATION This chapter contains the calibration procedure and data used for the LSC existing conditions model. The goal of the calibration effort was to develop a hydraulic
Regional Drought Decision Support System (RDDSS) Project Update and Product Concepts
 Project Update and Product Concepts") Regional Drought Decision Support System (RDDSS) Project Update and Product Concepts Part of the Red River Basin Decision Information Network (RRBDIN) NEXT-GEN RRBDIN Decision Support for the Red River
Regional Drought Decision Support System (RDDSS) Project Update and Product Concepts Part of the Red River Basin Decision Information Network (RRBDIN) NEXT-GEN RRBDIN Decision Support for the Red River
Lecture 3. Data Sources for GIS in Water Resources
 Lecture 3 Data Sources for GIS in Water Resources GIS in Water Resources Spring 2015 http://www.data.gov/ 1 USGS GIS data for Water http://water.usgs.gov/maps.html Watersheds of the US 2-digit water resource
A GIS-based Approach to Watershed Analysis in Texas Author: Allison Guettner
 Texas A&M University Zachry Department of Civil Engineering CVEN 658 Civil Engineering Applications of GIS Instructor: Dr. Francisco Olivera A GIS-based Approach to Watershed Analysis in Texas Author:
LOMR SUBMITTAL LOWER NESTUCCA RIVER TILLAMOOK COUNTY, OREGON
 LOMR SUBMITTAL LOWER NESTUCCA RIVER TILLAMOOK COUNTY, OREGON Prepared for: TILLAMOOK COUNTY DEPARTMENT OF COMMUNITY DEVELOPMENT 1510-B THIRD STREET TILLAMOOK, OR 97141 Prepared by: 10300 SW GREENBURG ROAD,
Modeling the Effects of Climate and Land Cover Change in the Stoney Brook Subbasin of the St. Louis River Watershed
 Modeling the Effects of Climate and Land Cover Change in the Stoney Brook Subbasin of the St. Louis River Watershed Joe Johnson and Jesse Pruette 214 NASA Research Internship Geospatial Technologies Program
The Stochastic Event Flood Model Applied to Minidoka Dam on the Snake River, Idaho
 The Stochastic Event Flood Model Applied to Minidoka Dam on the Snake River, Idaho K. L. Bullard 1, M. G. Schaeffer 2, B. A. Barker 3, D. Sutley 4, and V. Leverson 5 1 Bureau of Reclamation, Flood Hydrology
Guam Hydrologic Survey (GHS) And. Comprehensive Water Monitoring Program (CWMP) FY Status Report
 And. Comprehensive Water Monitoring Program (CWMP) FY Status Report") Guam Hydrologic Survey (GHS) And Comprehensive Water Monitoring Program (CWMP) FY 2005-2006 Status Report January 2006 PROGRAM SUMMARIES Guam Hydrologic Survey (GHS) The GHS program provides annual funding
Guam Hydrologic Survey (GHS) And Comprehensive Water Monitoring Program (CWMP) FY 2005-2006 Status Report January 2006 PROGRAM SUMMARIES Guam Hydrologic Survey (GHS) The GHS program provides annual funding
Lake Tahoe Watershed Model. Lessons Learned through the Model Development Process
 Lake Tahoe Watershed Model Lessons Learned through the Model Development Process Presentation Outline Discussion of Project Objectives Model Configuration/Special Considerations Data and Research Integration
Intensity-Duration-Frequency (IDF) Curves Example
 Curves Example") Intensity-Duration-Frequency (IDF) Curves Example Intensity-Duration-Frequency (IDF) curves describe the relationship between rainfall intensity, rainfall duration, and return period (or its inverse, probability
Intensity-Duration-Frequency (IDF) Curves Example Intensity-Duration-Frequency (IDF) curves describe the relationship between rainfall intensity, rainfall duration, and return period (or its inverse, probability
Rick Faber CE 513 Building a Base Map Lab #2 6/2/06
 Rick Faber CE 513 Building a Base Map Lab #2 6/2/06 1. Objective & Discussion: By using data for the Guadalupe river basin in Texas, we will get a chance to build a base map of hydrologic features. These
A Cloud-Based Flood Warning System For Forecasting Impacts to Transportation Infrastructure Systems
 A Cloud-Based Flood Warning System For Forecasting Impacts to Transportation Infrastructure Systems Jon Goodall Associate Professor, Civil and Environmental Engineering Associate Director, Link Lab April
An Alternative Temporal Rainfall Distribution for Hydrologic Analysis and Design
 An Alternative Temporal Rainfall Distribution for Hydrologic Analysis and Design Joseph P. Wilson, PE, PH Wilson Hydro, LLC PhD Candidate Missouri University of Science Technology Rolla, Missouri Sorry
4. GIS Implementation of the TxDOT Hydrology Extensions
 4. GIS Implementation of the TxDOT Hydrology Extensions A Geographic Information System (GIS) is a computer-assisted system for the capture, storage, retrieval, analysis and display of spatial data. It
Pompton Lakes Dam Downstream Effects of the Floodgate Facility. Joseph Ruggeri Brian Cahill Michael Mak Andy Bonner
 Pompton Lakes Dam Downstream Effects of the Joseph Ruggeri Brian Cahill Michael Mak Andy Bonner ASFPM 2013: Overview Page 2 Overview Page 3 Overview Page 4 Overview Page 5 Overview - Historical Pompton
Figure 0-18: Dendrogeomorphic analysis of streambank erosion and floodplain deposition (from Noe and others, 2015a)
") Appendix 9A: Stream to River During the development of the Phase 6 Watershed Model, multiple methods for determining coefficients were often attempted. In some cases, the methods are averaged or otherwise
Appendix 9A: Stream to River During the development of the Phase 6 Watershed Model, multiple methods for determining coefficients were often attempted. In some cases, the methods are averaged or otherwise
Stream Discharge and the Water Budget
 Regents Earth Science Unit 6: Water Cycle & Climate Name: Lab # Stream Discharge and the Water Budget Introduction: The United States Geological Survey (USGS) measures and publishes values for the daily
The Use of Synthetic Floods for Defining the Regulated Volume Duration Frequency Curves for the Red River at Fargo, ND
 The Use of Synthetic Floods for Defining the Regulated Volume Duration Frequency Curves for the Red River at Fargo, ND Prepared by the USACE - St. Paul District Hydrology & Water Management Section June
Habitat Monitoring Update Hudson River CAG November 16, 2017
 Habitat Monitoring Update Hudson River CAG November 16, 2017 Habitat Reconstruction Overview: Habitats A habitat replacement program is being implemented in an Adaptive Management context to reconstruct
May 7, Roger Leventhal, P.E. Marin County Public Works Laurel Collins Watershed Sciences
 May 7, 2013 Roger Leventhal, P.E. Marin County Public Works Laurel Collins Watershed Sciences Background Funded in 2009 under EPA 2100 Grant for $30k and managed by SFEP Project Goals: Update original
Chapter 10 - Sacramento Method Examples
 Chapter 10 Sacramento Method Examples Introduction Overview This chapter presents two example problems to demonstrate the use of the Sacramento method. These example problems use the SACPRE and HEC-1 computer
Areal Reduction Factors for the Colorado Front Range and Analysis of the September 2013 Colorado Storm
 Areal Reduction Factors for the Colorado Front Range and Analysis of the September 2013 Colorado Storm Doug Hultstrand, Bill Kappel, Geoff Muhlestein Applied Weather Associates, LLC - Monument, Colorado
 Red River Flooding June 2015 Caddo and Bossier Parishes Presented by: Flood Technical Committee Where the Rain Falls Matters I-30 versus I-20 I-20 Backwater and Tributary Floods (Localized) 2016 Flood
LOMR SUBMITTAL LOWER NEHALEM RIVER TILLAMOOK COUNTY, OREGON
 LOMR SUBMITTAL LOWER NEHALEM RIVER TILLAMOOK COUNTY, OREGON Prepared for: TILLAMOOK COUNTY DEPARTMENT OF COMMUNITY DEVELOPMENT 1510-B THIRD STREET TILLAMOOK, OR 97141 Prepared by: 10300 SW GREENBURG ROAD,
GIS in Water Resources Midterm Exam Fall 2012 There are five questions on this exam. Please do all five.
 Page 1 of 6 Name: Key GIS in Water Resources Midterm Exam Fall 2012 There are five questions on this exam. Please do all five. Question 1 (a) You have worked with the location of Utah State University
GIS in Water Resources Midterm Exam Fall 2008 There are 4 questions on this exam. Please do all 4.
 Page 1 of 8 Name: GIS in Water Resources Midterm Exam Fall 2008 There are 4 questions on this exam. Please do all 4. 1. Basic Concepts [20 points] Find the letter with the best answer for each term: 1.
Suwannee Satilla Basins Flood Control Issues, Opportunities and Assistance
 Suwannee Satilla Basins Flood Control Issues, Opportunities and Assistance Georgia Silver Jackets Meeting Valdosta, GA April 11, 2013 Presentation Outline Basin overview Recent floods: 2009 100 year flood
Recent Analysis and Improvements of the Statistical Water Supply Forecasts for the Upper Klamath Lake Basin, Oregon and California, USA
 Recent Analysis and Improvements of the Statistical Water Supply Forecasts for the Upper Klamath Lake Basin, Oregon and California, USA Jolyne Lea and David Garen, USDA/NRCS, Adam Kennedy, Portland State
3.0 TECHNICAL FEASIBILITY
 3.0 TECHNICAL FEASIBILITY 3.1 INTRODUCTION To enable seasonal storage and release of water from Lake Wenatchee, an impoundment structure would need to be constructed on the lake outlet channel. The structure
Updated Precipitation Frequency Estimates for Minnesota
 1 Updated Precipitation Frequency Estimates for Minnesota Presenter: Authors: (alphabetical order) Sanja Perica, Director Hydrometeorological Design Studies Center (HDSC), Office of Hydrology, National
Due: Monday November 26 th LAB 7: Rivers and Flood Frequency
 1 12.001 Due: Monday November 26 th LAB 7: Rivers and Flood Frequency Overview and Objectives This exercise will provide some hands-on experience with methods used for predicting flood frequency and magnitude.
Multi-scale modeling of species distributions, hydrology, & gene flow
 Multi-scale modeling of species distributions, hydrology, & gene flow Douglas R. Leasure PhD. Candidate University of Arkansas Department of Biological Sciences BIG data in GIS http://www.gap.uidaho.edu/portal/datadownload.html
Napa Valley Groundwater Sustainability: A Basin Analysis Report for the Napa Valley Subbasin
 Napa Valley Groundwater Sustainability: A Basin Analysis Report for the Napa Valley Subbasin December 13, 2016 Napa County Board of Supervisors By Vicki Kretsinger Grabert and Reid Bryson Basin Analysis
Lower Tuolumne River Accretion (La Grange to Modesto) Estimated daily flows ( ) for the Operations Model Don Pedro Project Relicensing
 Estimated daily flows ( ) for the Operations Model Don Pedro Project Relicensing") Lower Tuolumne River Accretion (La Grange to Modesto) Estimated daily flows (1970-2010) for the Operations Model Don Pedro Project Relicensing 1.0 Objective Using available data, develop a daily time series
Lower Tuolumne River Accretion (La Grange to Modesto) Estimated daily flows (1970-2010) for the Operations Model Don Pedro Project Relicensing 1.0 Objective Using available data, develop a daily time series
The Importance of Snowmelt Runoff Modeling for Sustainable Development and Disaster Prevention
 The Importance of Snowmelt Runoff Modeling for Sustainable Development and Disaster Prevention Muzafar Malikov Space Research Centre Academy of Sciences Republic of Uzbekistan Water H 2 O Gas - Water Vapor
Presented by Jerry A. Gomez, P.E. National Hydropower Association Northeast Regional Meeting - September 17, 2009
 Presented by Jerry A. Gomez, P.E. National Hydropower Association Northeast Regional Meeting - September 17, 2009 Defining Probable Maximum Precipitation (PMP) PMP is the theoretically greatest depth of
Stochastic Modeling of Extreme Floods on the American River at Folsom Dam
 US Army Corps of Engineers Hydrologic Engineering Center Stochastic Modeling of Extreme Floods on the American River at Folsom Dam Appendix D - Procedures Implemented for Conducting Storm Analyses in Support
Lab 1: Landuse and Hydrology, learning ArcGIS II. MANIPULATING DATA
 Lab 1: Landuse and Hydrology, learning ArcGIS II. MANIPULATING DATA As you experienced in the first lab session when you created a hillshade, high resolution data can be unwieldy if you are trying to perform
Chapter 6. Fundamentals of GIS-Based Data Analysis for Decision Support. Table 6.1. Spatial Data Transformations by Geospatial Data Types
 Chapter 6 Fundamentals of GIS-Based Data Analysis for Decision Support FROM: Points Lines Polygons Fields Table 6.1. Spatial Data Transformations by Geospatial Data Types TO: Points Lines Polygons Fields
Pequabuck River Flooding Study and Flood Mitigation Plan The City of Bristol and Towns of Plainville and Plymouth, CT
 Pequabuck River Flooding Study and Flood Mitigation Plan The City of Bristol and Towns of Plainville and Plymouth, CT Raymond Rogozinski and Maged Aboelata The City of Bristol and Towns of Plainville and
INFLOW DESIGN FLOOD CONTROL SYSTEM PLAN 40 C.F.R. PART PLANT YATES ASH POND 2 (AP-2) GEORGIA POWER COMPANY
 GEORGIA POWER COMPANY") INFLOW DESIGN FLOOD CONTROL SYSTEM PLAN 40 C.F.R. PART 257.82 PLANT YATES ASH POND 2 (AP-2) GEORGIA POWER COMPANY EPA s Disposal of Coal Combustion Residuals from Electric Utilities Final Rule (40 C.F.R.
INFLOW DESIGN FLOOD CONTROL SYSTEM PLAN 40 C.F.R. PART 257.82 PLANT YATES ASH POND 2 (AP-2) GEORGIA POWER COMPANY EPA s Disposal of Coal Combustion Residuals from Electric Utilities Final Rule (40 C.F.R.
Table 1 PRISM/OB1 data summary in this study. PI400-2 Table 2 PRISM/OB1 data summary in this study. 2'#7-#/ :> 8>?= B-/"# 899:;98;<= :> 8A89
 PI400-1 EVALUATION ANALYSIS FOR DIGITAL TERRAIN MODELS GENERATED FROM ALOS/PRISM -OB2 DATA PI No. 400 Tomohito Asaka (PI) 1, Yoshiyuki Yamamoto (CI) 2 1 Nihon University, Izumi 1-2-1, Narashino Chiba,
New NOAA Precipitation-Frequency Atlas for Wisconsin
 New NOAA Precipitation-Frequency Atlas for Wisconsin #215966 Presentation to the Milwaukee Metropolitan Sewerage District Technical Advisory Team January 16, 2014 Michael G. Hahn, P.E., P.H. SEWRPC Chief
Folsom Dam Water Control Manual Update
 Folsom Dam Water Control Manual Update Public Workshop April 3, 2014 Location: Sterling Hotel Ballroom 1300 H Street, Sacramento US Army Corps of Engineers BUILDING STRONG WELCOME & INTRODUCTIONS 2 BUILDING
Overview of Data for CREST Model
 Overview of Data for CREST Model Xianwu Xue April 2 nd 2012 CREST V2.0 CREST V2.0 Real-Time Mode Forcasting Mode Data Assimilation Precipitation PET DEM, FDR, FAC, Slope Observed Discharge a-priori parameter
Development and Land Use Change in the Central Potomac River Watershed. Rebecca Posa. GIS for Water Resources, Fall 2014 University of Texas
 Development and Land Use Change in the Central Potomac River Watershed Rebecca Posa GIS for Water Resources, Fall 2014 University of Texas December 5, 2014 Table of Contents I. Introduction and Motivation..4
NRC Workshop - Probabilistic Flood Hazard Assessment Jan 2013
 Regional Precipitation-Frequency Analysis And Extreme Storms Including PMP Current State of Understanding/Practice Mel Schaefer Ph.D. P.E. MGS Engineering Consultants, Inc. Olympia, WA NRC Workshop - Probabilistic
3D Elevation Program- Status and Updates. Oklahoma GI Council Meeting November 2, 2018 Claire DeVaughan US Geological Survey
 + 1 3D Elevation Program- Status and Updates Oklahoma GI Council Meeting November 2, 2018 Claire DeVaughan US Geological Survey + 2 3D Elevation Program (3DEP) Goals Complete acquisition in 8 years Address
LOCATED IN INDIAN RIVER COUNTY PREPARED FOR S.J.R.W.M.D. AND F.W.C.D. DECEMBER, 2003 Updated 2007 Updated May 2014 PREPARED BY
 FELLSMERE WATER CONTROL DISTRICT EAST MASTER DRAINAGE PLAN AND STORMWATER HYDROLOGIC ANALYSIS OF THE GRAVITY DRAINAGE SYSTEM LOCATED BETWEEN THE EAST BOUNDARY, LATERAL U, THE MAIN CANAL, AND DITCH 24 LOCATED
Current Water Conditions in Massachusetts January 11, 2008
 Current Water Conditions in Massachusetts January 11, 2008 December precipitation was above normal December streamflows were below normal and normal December ground-water levels were below normal and normal
Modeling Storm Surge for Emergency Management
 Modeling Storm Surge for Emergency Management Study Area: Guam is the southern-most island of the Mariana Archipelago and is located at 13 28 N, 144 47 E. It has a total area of 541.3 sq. km. and the highest
FEMA Hazards Loss Modeling Task Force (MOTF) Situation Report #14. Colorado Spring Flood Risk ***FINAL REPORT***
 Situation Report #14. Colorado Spring Flood Risk ***FINAL REPORT***") FEMA Hazards Loss Modeling Task Force (MOTF) Situation Report #14 Colorado Spring Flood Risk FEMA Modeling Task Force (MOTF) Denver Federal Center, Building 710A Denver, Colorado 80225 Email: FEMA-MOTF@fema.dhs.gov
FEMA Hazards Loss Modeling Task Force (MOTF) Situation Report #14 Colorado Spring Flood Risk FEMA Modeling Task Force (MOTF) Denver Federal Center, Building 710A Denver, Colorado 80225 Email: FEMA-MOTF@fema.dhs.gov
Basin characteristics
 Basin characteristics From hydrological processes at the point scale to hydrological processes throughout the space continuum: point scale à river basin The watershed characteristics (shape, length, topography,
USGS Hydrography Overview. May 9, 2018
 + 1 USGS Hydrography Overview May 9, 2018 + 2 The National Geospatial Program Provides the geospatial baseline of the Nation s topography, natural landscape and built environment through The National Map,
GIS feature extraction tools in diverse landscapes
 CE 394K.3 GIS in Water Resources GIS feature extraction tools in diverse landscapes Final Project Anna G. Kladzyk M.S. Candidate, Expected 2015 Department of Environmental and Water Resources Engineering
Recurrence Interval for the 2006 Flood Delaware and Otsego County, New York
 Recurrence Interval for the 2006 Flood Delaware and Otsego County, New York Les Hasbargen Dept. of Earth Sciences SUNY Oneonta Ouleout Creek, flood scars Picture From : http://www.co.delaware.ny.us/flood_2006/crop%20&%20land%20photos/default.htm
PECKMAN RIVER BASIN, NEW JERSEY FLOOD RISK MANAGEMENT FEASIBILITY STUDY. Hydrology Appendix. New York District
 PECKMAN RIVER BASIN, NEW JERSEY FLOOD RISK MANAGEMENT FEASIBILITY STUDY Hydrology Appendix New York District May 2018 Table of Contents 1.0 OBJECTIVE OF STUDY... 1 2.0 WATERSHED DESCRIPTION... 1 3.0 PRIOR