Pyrolysis Resource CD. Application Booklets. Processed Materials. Application Products. Basic Materials. Functional Materials.
|
|
|
- Sara Miles
- 5 years ago
- Views:
Transcription


1 Pyrolysis Resource CD Application Booklets Frontier 3030D Brochure Frontier 3030 Specifications Processed Materials Application Products Technical note keyword Search click here Frontier Tandem micro- Reactor System Basic Materials Frontier Consumable Parts Catalog Functional Materials Frontier Auto-Rx Disc for Reactive Pyrolysis Quantum Analytics 2014 Product Guide Additives Solving Analytical Problems Financing Technology 3400 East Third Avenue The contents of this CD are published by Quantum Analytics with publications and data from Frontier Labs and Quantum Analytics. Quantum Analytics 2014
2 Characterization and Determination of Irganox 1076 and 1010 in Polyethylene using Thermal Desorption and Reactive Pyrolysis GC/MS Itsuko Iwai, R.R. Freeman and Dave Randle, Frontier Laboratories Terry Ramus, Diablo Analytical Introduction Literally thousands of different chemicals are used in polymer formulations. Some are added to alter the physical and chemical properties of the polymer, others are added to modify the durability of the polymer, still others are used to improve efficiency of the production process. The impact of each additive is a function of its concentration; consequently, it is important that the concentration of each additive be within well defined limits. A number of different analytical techniques are used to monitor additive concentrations. Two of the more commonly used antioxidants, Irganox 1076 and 1010, are phenolic primary antioxidants used to provide long term thermal stability to the end product. They are widely used in polyolefins such as polyethylene, polypropylene, polybutene and copolymers such as polyurethane. Analysis of 1076 and 1010 is difficult because each is highly resistant to conventional extraction and has a very low vapor pressure. The structural similarities can be seen in figure 1. Irganox 1010 H H Irganox 1076 H H This report details a GC/MS based analytical method for the qualitative and quantitative determination of Irganox 1076 and 1010 in polyethylene. Figure 1. Structures of Irganox 1010 and Note that both additives have the exact same phenolic group in the ratio of 4:1
3 verview of the thermal desorption and reactive pyrolysis GC/MS methods Analytical methods Thermal Desorption (TD) 1 Irganox 1076: Several very small (mesh 45 µm) particles of the sample are placed in an 80µL sample cup (Eco cup) and weighed. The cup is then placed in the autosampler (Auto Shot) carousel interfaced to an EGA/PY 3030D Multi functional pyrolyzer. The sample is subsequently dropped into the furnace which is at 320⁰C. The Irganox 1076 thermally desorbs from the polyethylene matrix and is flushed onto the analytical separation column. Thermal desorption is conceptually and operationally very simple. Sufficient heat must be available to vaporize the target compounds. Generally speaking the smaller the sample particle size (high surface area to weight ratio), the better the precision. Small particles are easy to obtain from solid polymer samples by simply filing with a metal file. Reactive Pyrolysis (RxPy) 2,3 Irganox 1076 and 1010: Several very small (mesh 45 µm) sample particles are placed in an 80µL sample cup (Eco cup) and weighed; several microliters of an organic alkali (TMAH in methanol) are added to the cup and the solvent is allowed to evaporate. When the sample + reagent are dropped into the furnace which is at 260⁰C, the ester bond isothermally hydrolyzes and the resulting radicals are methylated. Irganox 1076 Irganox 1010 Thermal Desorption (TD) MS spectrum of Irganox 1076 (without TMAH) Abunda 530 nce m/z--> Reactive Pyrolysis (RxPy) (TMAH) 515 MS spectrum of TMAH derivative of Irganox 1076 and min) 02_1076_1000ppm_wTMAH.D\ Figure 2. Irganox 1076 can be thermally desorbed from polyethylene at 320⁰C. The mass spectrum has a base peak of m/z 530 representing the molecular ion. Both 1076 and 1010 have an ester linkage which can be thermally hydrolyzed and methylated using tetramethylammonium hydroxide (TMAH). The derivatized product is the same for both 1010 and 1076; the mass spectra of the derivatized additives are also identical and exhibit large peaks at m/z 291 & 306. The stoichiometric ratio of the derivatized product compound for Irganox 1010 is 4:1 compared to Irganox Reactive pyrolysis alone cannot be used to differentiate Irganox 1076 and 1010.
4 Reactive pyrolysis (RxPy) optimization Selecting the furnace temperature Two series of experiments were run to ascertain the effect of the reaction temperature on the signal to noise ratio of m/z 306, which is the quant ion chosen from the reaction product spectrum for Irganox 1010 and Figure 3 clearly shows that the best signal to noise is obtained when the RxPy is done at 260⁰C. Keep in mind that this temperature is dependent on the organic alkali being used and, to a lesser extent, the polymer matrices, and the sample particle size (or surface area to weight ratio). Selecting the reagent amount A set of experiments were performed to determine the effect of increasing the amount of reagent to a fixed amount of Irganox 1010 in polyethylene. The test sample was 100 µg of polyethylene spiked with 1 µg of Irganox The results are shown in Figure 4. As the amount of TMAH increases, the peak area of the quant ion (m/z 306) increases. Peak Area ⁰C Reaction Temp ( C) Figure 3. Reaction temperature vs. peak area Abundance run #1 run #2 30µL TMAH 20µL TMAH 10µL TMAH These two studies clearly indicate that reactive pyrolysis should be done at 260⁰C and that a minimum of µl of tetramethylammonium hydroxide (TMAH) reagent should be combined with 100 µg of polyethylene sample for optimal results µl TMAH Figure 4. The effect of increasing the amount of organic alkali on peak area. Sample is 100 µg of polyethylene + 1 µg Irganox 1010
5 Reactive pyrolysis (RxPy): Irganox 1010 in polyethylene A polyethylene sample was analyzed using reactive pyrolysis (RxPy). A portion of the EIC (m/z=306) chromatogram is shown in Figure 5. Included in Figure 5 are the three spike levels used in the standard addition calibration. Analytical Instruments and Conditions: Frontier Lab EGA/PY 3030 Multi shot Pyrolyzer Agilent 7890, 5975 Performance Turbo GC/MS Reaction Temp: 260⁰; Interface = 300⁰C Column: UA 5; 30m X 0,25mm i.d., film = 0.25µm Flow 1 ml/min; split ratio 30:1 40⁰C (2min) 320⁰C(7 Sample: 100µg polyethylene particles, Reagent: TMAH 5% in methanol (12µL) SIM or EIC ions m/z 291 & 306 Abundance EIC m/z 306 Add 1000ng Add 500ng Add 100ng PE sample only Quantitation of Irganox 1010: The four point Irganox 1010 calibration is shown in Figure 5. Standard addition is used because it provides the best way to eliminate non target interference in the sample. The coefficient of determination (R 2 )* for Irganox is The analysis of the polyethylene using reactive pyrolysis indicated that the concentration of Irganox 1010 in sample PE #1 is 1053 ppm which compares favorably with the known concentration (1000 ppm) of Irganox Analysis (ppm) Actual (ppm) % Error Table 1. Analysis amount vs. actual amount (ppm) and accuracy (% error) of Irganox 1010 in PE #1 by RxPy. *R 2 is a statistical measure of how well a regression line approximates real data points; an r squared (R 2 ) of 1.0 (100%) indicates a perfect fit. Peak area y = x R² = Sample Concentration 109.5ng/0.104mg = 1053 ppm Irganox 1010 (standard addition) weight (ng) 1000 Figure 5. Top trace is the EIC (m/z 306) plot of Irganox 1010 after reactive pyrolysis. Bottom trace is the standard addition calibration used for Irganox 1010.
6 Irganox 1076 Reactive pyrolysis and thermal desorption Previously, it was shown that Irganox 1076 could be determined in a polymeric matrix using either thermal desorption or reactive pyrolysis. If thermal desorption is used, the quant ion is m/z 530, which is the base peak in the mass spectrum (see Fig. 2, upper spectrum). If reactive pyrolysis is used, the quant ion is m/z 306 which is the base peak of the derivatized product following hydrolysis and methylation (see Fig. 2, lower spectrum). Figure 6 shows that the SIM chromatograms in either mode are free of interference from other peaks. Analytical Conditions for Thermal Desorption (TD): Frontier Lab EGA/PY 3030 Multi shot Pyrolyzer Agilent 7890, 5975 Performance Turbo GC/MS Desorption Temp: 320⁰; Interface = 300⁰C Column: UA 5; 30m X 0,25mm i.d., film = 0.25µm Flow 1 ml/min; split ratio 30:1 ven Temp. Program: 40⁰C (2min) 150⁰C at 10⁰C/min 150⁰C 320⁰C (7 min) at 20⁰C/min Sample: 100µg polyethylene particles SIM ion = m/z 530 and 219. Thermal desorption (TD) Abundance TIC: [BSB1]04_1076_10000ppm_woTMAH01D\datasim.ms SIM mode m/z Time--> Reactive pyrolysis (RxPy) Abundance TIC: 02_1076_1000ppm_wTMAH.D\DATASIM.MS SIM mode m/z Time--> Figure 6. Top SIM chromatogram is the plot of m/z 530 when Irganox 1076 is thermally desorbed (furnace temp: 320⁰C). The bottom SIM trace (m/z 306) is obtained when Irganox 1076 is analyzed using reactive pyrolysis (using 260 ⁰C).
 using reactive pyrolysis. (RxPy). Sample prep steps are shown in Fig. 7a.")

7 Analysis of Irganox 1076 in polyethylene using thermal desorption and reactive pyrolysis A polyethylene sample was analyzed using thermal desorption (TD) and reactive pyrolysis (RxPy). The SIM mode chromatograms are shown in Figure 7b. The sample was also analyzed in duplicate (n=2) using reactive pyrolysis. (RxPy). Sample prep steps are shown in Fig. 7a. Simple Sample Prep for TD and RxPY Thermal desorption SIM (m/z 530) Add 500ng Add 100ng PE sample only TD Steps 1. Weigh sample into cup 2. Drop into furnace at 320ᵒC Sample weights ca mg RxPy Steps 1. Weigh sample into cup 2. Add ca µl TMAH 3. Drop into furnace at 260ᵒC EGA/PY 3030D Multi shot Pyrolyzer Reactive pyrolysis SIM (m/z 306) Add 250ng Sample Cup Add 65ng Furnace Temp. TD = 320ᵒC Figure 7a. He Furnace Temp. RxPy = 260ᵒC µ Furnace Interface Heater Interface Needle S/SL GC Inlet PE sample only (n=2) Figure 7b. Top chromatogram is the SIM trace (m/z 530) of Irganox 1076 in polyethylene at different spike levels. Bottom trace is SIM trace (m/z 306) analysis of Irganox 1076 in PE after reactive pyrolysis at different spike levels.
8 Quantitation of Irganox 1076 using standard addition The three point standard addition calibrations plots are shown in Figure 8. Note that the coefficient of determination (R 2 ) is or better which underscores the quality of the extrapolated x axis intercept. The tables shown below compares the calculated Irganox 1076 analysis values with the known or actual concentration of 1076 in the polyethylene sample PE #3. Table 2 shows TD data. Table 3 shows RxPy data. Thermal desorption (TD) Irganox 1076 Analysis (ppm) Actual (ppm) % Error Table 2. Analysis amount vs. actual amount (ppm) and accuracy (% error) of Irganox 1076 in PE #3 by thermal desorption (TD). Reactive pyrolysis (RxPy) Irganox 1076 Analysis (ppm) Actual (ppm) % Error Table 3. Analysis amount vs. actual amount (ppm) and accuracy (% error) of Irganox 1076 in PE #3 by reactive pyrolysis (RxPy). peak area y = 4203x R² = Sample Concentration 188.7ng/0.505mg = 374 ppm Irganox 1076 STD weight (ng) Peak Area y = x R² = 1 Sample Concentration 78.5ng/0.2mg = 393 ppm Irganox 1076 STD weight (ng) Figure 8. Irganox 1076 standard addition calibration: The plot on top is the thermal desorption calibration; the lower plot is the reactive pyrolysis calibration; ppm is calculated based on actual sample weight.
9 Thermal Desorption of Irganox 1076 in polyethylene Figure 9 shows overlays from 4 runs of the full scan ( amu) total ion chromatogram (TIC) of a polyethylene sample containing a number of additives. The peak around 26.4 minutes is Irganox The sample was analyzed four times; see inset for the amounts of Irganox spiked in the sample prior to analysis. The concentration of 1076 in the PE unknown sample was determined using the standard addition calibration and found to be 476 ppm. Peak Area 238 y = x R² = Irganox 1076 Standard Amount (ng) Sample concentration 238ng/.500mg = 476ppm Abundance BHT dimer Abundance Irganox 1076 Add 500ng Add 500ng Add 250ng Add 250ng Add 100ng Sample only Add 100ng BHT Time--> PE sample only Time--> Figure 9. Total ion chromatogram (TIC) of polyethylene (PE). Thermal desorption temperature is 320⁰C. Standard addition calibration of Irganox 1076 in PE is shown at top of page
10 Precision and accuracy for Irganox 1010 & 1076 in PE It is a relatively simple process to identify and quantitate both Irganox 1010 and 1076 in polyethylene. Analysis of the sample using reactive pyrolysis (RxPy) yields the total ppm of the two additives. A second analysis of the sample using thermal desorption quantitates the Irganox Simply subtracting the two numbers is all that is necessary to find the amount of Irganox 1010: 1010 &1076 (RxPy) total 1076 (TD) = 1010 amount. Example shown in Table 5 for the PE Unknown Sample where the calculated amount of 1010 is 1406 ppm. Compound Technique RSD (%) Irganox 1010 (in PE #2) Irganox 1076 (in PE #3) Reactive pyrolysis (RxPy) (260⁰C) Thermal desorption (TD) (320⁰C) 7.9 (n=5) 3.6 (n=5) Table 4. Reproducibility (RSD%) of the RxPy technique for 1010 and the TD technique for 1076 for five runs (n=5). Abundance Time--> 007_3mix_noadd_py260_tmah20.D 007_3mix_100add_py260_tmah12.D 007_3mix_250add_py260_tmah20.D Irganox Irganox 1076 (Total amount) Add 250ng Add 100ng PE sample only Figure 10. SIM (m/z=306) chromatogram of polyethylene sample containing both Irganox 1076 and 1010 using reactive pyrolysis (RxPy). PE Sample # Actual Amt. (ppm) Irganox 1010 Irganox 1076 Calculated Amt. (ppm) by RxPy % Error Actual Amt. (ppm) Calculated Amt. (ppm) by TD Calculated Amt. (ppm) by RxPy Ave. Amt. (ppm) % Error PE # % PE # % PE # % PE unknown Table 5. Results summary of the analysis of four polyethylene (PE) samples for Irganox 1010 and For samples with a known amount of additives the accuracy of the quantitative technique is indicated by the % error comparing the actual amount vs. calculated amount.


11 Summary Complex samples can rarely be fully characterized using a single analytical technique; consequently, the analyst must analyze the simple a number of times using different analytical tools. This work clearly illustrates the value of having a chromatographic system that can be configured to perform multiple analytical techniques. The EGA/PY 3030 Multi shot Pyrolyzer from Frontier Laboratories can be used to characterize a sample using evolved gas analysis, pyrolysis, multi zone thermal desorption, and reactive pyrolysis. Both liquid and solid samples can be analyzed directly; conventional sample prep regimes are unnecessary. References: 1. Rapid and Simple Determination of phthalates in plastic toys by a thermal desorption GC/MS method, T. Yuzawa, C. Watanabe, R. Freeman and S. Tsuge, Anal.Sci., Vol. 25, pages Review: the development and applications of thermally assisted hydrolysis and methylation reactions, J.M. Challinor, J. Anal. and Appl Pyrolysis, 61(2001), Characterization of Condensation Polymers by pyrolysis GC in the presence of organic alkali, H. htani and S. Tsuge, Applied Pyrolysis Handbook, Second Edition, pages The analysis of Irganox 1076 and 1010 is difficult because of their low volatility. It is not unusual for a laboratory to use HPLC or LC/MS for these two additives. Using a Frontier EGA/PY 3030D interfaced to a GC/MS will immediately increase laboratory productivity. A single EGA/PY 3030D & GC/MS can be used to qualitatively and quantitatively determine the additives of interest, in a variety of polymeric materials. This simplifies the operation of the laboratory and gives the quantitative data internal consistency. The entire process can be automated. Both liquid and solid samples can be analyzed directly, thus eliminating the need for complicated, time consuming sample preparation. Data quality (precision and accuracy) compares favorability with that obtained using other analytical techniques. For Sales, Consumables, and Support: Ask for the Free Pyrolysis Resource CD, packed with over 140 application notes utilizing GC and GC/MS pyrolysis, ultraviolet irradiation pyrolysis, reactive pyrolysis, evolved gas analysis (EGA), MicroJet Cryo Trap, thermal desorption, and more. Quantum Analytics, 3400 East Third Avenue,
12 A fast, easy and green thermal desorption-gc/ms method for the analysis of phthalate esters in PVC A discussion of the central factors that influence data quality when using ASTM D (1) for the determination of phthalates in polymeric substrates R. Freeman, A. Hosaka, I. Watanabe, D. Randle, and C. Watanabe, Frontier Laboratories Introduction Phthalates, which are esters of phthalic acid, have been used in the manufacture of a wide range of consumer products. They are added to plastics to make them more flexible and harder to break. Although the wide-spread use of phthalates in the manufacturing of polymeric products has been largely discontinued, they continue to pose a risk to human health. Phthalates are easily released into the environment because they are not covalently bonded to the polymer; consequently, exposure can be through direct contact, food, water and the atmosphere. Several phthalates are tightly regulated on a global scale. The United States (2), Canada, the European Union, Japan and many other nations have banned the use of and passed regulations designed to monitor for the concentration of phthalates in consumer products. In the US, Congress has permanently banned three phthalates (DEHP, DBP, BBP) in any amount greater than 0.1 percent (per plasticized component part of a children s toy or child care article). There is also an interim ban on DINP, DIDP and DNP, which only applies to children's toys that can be placed in a child's mouth (3,4). Although a number of different analytical techniques can be used to determine the presence of phthalates, most laboratories use solvent based techniques to extract the phthalates from the polymer matrix. The extract is then analyzed using GC or HPLC to separate and quantitate the individual phthalates. "Traditional" sample preparation is, at best, cumbersome, time consuming, costly and does not always completely isolate the phthalates from the polymer matrix. Thermal desorption (TD) is a viable alternative to traditional solvent-based sample preparation. Thermal desorption is based on the fact that there is free volume within the polymer structure through which small molecules (e.g., phthalates) are free to move. The motion is due to intermolecular collisions (i.e., Brownian motion). Random motion from regions of high concentration to regions of lower concentration is called diffusion. Factors affecting the rate of diffusion are the solubility and diffusivity of the small molecules in the polymer. Increasing the temperature of a polymer causes the small molecules on the surface to vaporize and the concentration gradient across the polymer to increase. In addition, the permeability of the polymer increases with temperature. These two factors result an even greater flux of small molecules to the surface. The phthalate vapors are analyzed using GC/MS. Phthalates are identified using both retention data and compound specific ions. The entire process can be automated. 1


13 verview of ASTM D Virtually all analytical methods consist of four steps: sample preparation, method calibration, sample analysis and data processing. Most of the actual sample manipulation occurs during sample preparation and it is during this process that there is the highest probability of introducing error into the determination. Potential sources of errors include: (1) processing a non-representative portion of the sample. (2) sample contamination (e.g., glassware, reagents or solvents) and (3) deviations from the procedure prescribed in the method. Also, it is important to note that sample preparation also represents most of the costs associated with a given analytical procedure. Ideally, the sample should be analyzed as is. Direct analysis of the sample increases laboratory productivity and improves the overall data quality. Sample preparation ASTM D is based on the thermal desorption (thermal extraction ) of the phthalates from a polymeric substrate. The method specifically calls for the dissolution of the polymer in a suitable solvent such as THF; however, subsequent studies have shown that meaningful data can also be obtained when the polymer is analyzed directly. Analysis of the solid is often referred to as a direct method. Analysis of a microliter aliquot of a quantitative solution of the sample is referred to as a thin film method. The entire sample preparation protocol is summarized in Figure 1. Each step is described in the ASTM method. Thin film method Solvent (ml) Sample (µl) Evaporate Sample Crush & powder (cryo-mill) mg mg/ml Sample cup TD-GC/MS analysis Direct method (200 µg) Sample cup Figure 1. Quick, simple and green sample preparation. The thin film method requires that a quantitative solution of the sample be prepared. An aliquot of the THF solution is placed in the sample cup. Comment 1: The accuracy of the measurement is highly dependent upon three factors: (1) the homogeneity of the portion of the sample selected for analysis, (2) the accuracy of the analytical balance and (3) the accuracy and/or precision of the device (e.g., syringe) used to transfer the dissolved sample into the sample cups. Sample homogeneity is accomplished using a variety of methods including cryo-milling, grinding and sieving, averaging the results from the analysis of multiple samples and/or dissolving the entire sample in a known volume of solvent. Regardless of how the sample is homogenized, microgram quantities are actually analyzed. The ability of the balance to accurately weigh microgram quantities will directly affect the accuracy of the phthalate determination. The analytical precision obtained using the thin film and direct sampling methods is compared in Figure 2. The thin film method is an aliquot of a solution that is, by definition, homogeneous, whereas the direct method is a random sampling of particles, which will inherently lack sample-to-sample reproducibility. 2
14 Thin film method Direct method DEHP: %RSD = 1.15 (n=4) DINCH DEHP: %RSD = 4.79 (n=4) DINCH DEHP DEHP min min Figure 2. Influence of the sample preparation method on analytical precision. Sample: 0.5 mg plastic toy (PVC & DINCH); Thin film: 20 µl THF solution. Direct sampling: powder < 45 mesh. Determination of the EGA thermal desorption zone Evolved gas analysis (EGA) MS (5,6) is used to define the thermal desorption zone for the phthalates. This is a simple method that utilizes the temperature programmability of the Frontier EGA/PY-3030D (or 2020iD) pyrolyzer. A deactivated stainless steel tube (2.5 M x 0.15 mm i.d.) connects the injection port to the MS. The sample is heated from a low temperature to a high temperature. As the temperature increases, constituents in the sample vaporize, pass through the tube and are detected by the MS. A plot of sample temperature vs. detector signal is referred to as an EGA thermogram. The EGA thermogram of a polyvinyl chloride sample that is heated from 100 to C/min. is presented in Figure 3. Extracted ion chromatograms are used to delineate the thermal zone over which the phthalates evolve. Ion 149, which is common to all of the phthalates of interest, is used to identify the phthalate envelope. In this example, DA [Di(2-ethylhexyl) adipate] which is a common plasticizer used in the manufacturing of flexible plastic toys, medical devices and food packaging desorbs along with the phthalates. In order to identify and quantitate the phthalates in the sample, it is necessary to either chromatographically separate the DA isomers from the phthalates of interest or use ions that are present in the phthalate mass spectra and not found in the DA spectra m/z DA / Phthalates DA / HCL m/z PVC Aromatics m/z min DA (Ion 129) HCL (Ion 36) Phthalates (Ion 149) Thermal Desorption Zone Figure 3. Using extracted ion chromatograms (EIC) to determine the phthalate thermal desorption zone. Sample: PVC + DA. 3
15 Advantages of thermal desorption vs. conventional sample preparation and analysis ne of the most important advantages that thermal desorption has over samples prepared using conventional solvent-based techniques is that only the portion of the sample that is desorbed is transported to the column. Look closely at the thermal desorption zone for the phthalates in Figures 3 and 4. You ll notice that only the phthalates (and other additives) thermally evolve from the sample at 320 C. This means that the polymer remains in the sample cup and is not introduced into the GC inlet, column, or MS. Because the bulk of the sample (i.e. the polymer fraction) remains in the cup, more total sample can be placed in the sample cup. This improves the signal to noise (S/N) of the target compounds. Because only the volatile fraction of the sample is injected, there is no need for a postrun bake out, more samples can be analyzed per unit time and sample-to-sample carry over is virtually non-existent. This has a major positive impact on both data quality and laboratory productivity. Comment 2: In order to avoid any thermal degradation of the phthalates due to thermal shock, it is important that the desorption temperature be increased over time (7). The current method uses a furnace ramp of 100 to C/min. Even a program rate of 40 C/min. is better than an instantaneous increase to 320 C. Comment 3: ASTM D is written specifically for phthalates in polyvinyl chloride. However, the solubility and diffusivity of phthalates in most non-crystalline polymers is the same; consequently, the thermal desorption temperature range is independent of the polymer substrate (see Figure 4). When using TD to isolate additives that are beyond the scope of ASTM D or are incorporated into a polymeric base that has not been evaluated, it is wise to verify the thermal desorption zone using EGA-MS. Various Polymers Phthalates Polycarbonate; (PC) H C(CH 3 ) 2 C n Polystyrene; (PS) CH 2 CH(C 6 H 5 ) n Figure 4. Phthalate thermal desorption zone for four different polymers. Poly(vinyl chloride); (PVC) CH 2 CHCl ºC Thermal Desorption Zone Polyethylene (PE) CH 2 CH 2 n Figure 4 shows the EGA thermograms of four different polymers. The phthalate thermal desorption zone is the same for all four polymers: C. Clearly, it is not necessary to perform an EGA on each batch of samples. Samples arrive in the laboratory essentially ready for analysis. The instrument configuration and GC method will be the same for a wide variety of sample types. n 4
16 Analysis In practice, the samples are prepared as previously discussed. If the samples are analyzed directly, approximately 100 µg are placed in a sample cup. If the samples will be analyzed using the thin film method, µl of the quantitative solution are added into a sample cup. The solvent is evaporated leaving a thin film of the sample on the cup surface. TD-GC/MS combines the sample preparation (i.e., TD) with GC/MS analysis. This work was performed using a Frontier Lab EGA/PY-3030D or 2020iD multi-functional pyrolyzer with a 48 position autosampler (Frontier Auto-Shot AS-1020E) interfaced via a split/splitless injection port to a GC/MS. The cup is dropped into the furnace, which is at 100 C. The temperature increases at 20 C/min until it reaches 320 C. The initial column temperature is 80 C, which is low enough to facilitate the condensation of the desorbed vapors into a narrow band at the head of the column. A typical total ion chromatogram (TIC) and the extracted ion chromatograms (EIC) for the six regulated phthalates are shown in Figure 5. The analytical precision (n=6) obtained for each phthalate is shown in Table I DINCH DBP BBP DEHP DNP DINP DIDP min DINCH (Ion 155) Phthalates (Ion 149) DBP (Ion 223) BBP (Ion 206) DEHP, DNP (Ion 279) DINP (Ion 293) DIDP (Ion 307) Figure 5. TD-GC/MS analysis of a PVC-DINCH polymer spiked with the six regulated phthalates. The phthalates are identified based upon their relative retention time and the presence of the phthalatespecific quant ion. The thin film sample preparation as described in D was used for this analysis. Instrument and analytical conditions: Frontier Laboratories EGA/PY-3030D or 2020iD Pyrolyzer; thermal desorption zone: 100 to 320 C at 20 C/min. PY interface: 320ᵒC (Auto mode); GC injector: 300ᵒC, GC oven: 80ᵒC (1 min) 200ᵒC (50ᵒC/min) 350ᵒC (15ᵒC/min, 2 min hold); Solvent delay: 6 min.; Column: UA- 5 (5 % Diphenyl-95 %dimethyl polysiloxane) 30 m, 0.25 mm i.d, 0.25 µm film); Column He flow: 1.2 ml/min; Split ratio: 1/20; Mass range: m/z; Scan speed: 2.57 scans/sec; Threshold: 50; MS Transfer Line Temp.: 300ᵒC; Ion Source (EI) Temp.: 230ᵒC; Sample wt.: ca. 200 µg. 5
17 Phthalate Quant Ion DBP m/z=223 BBP m/z=206 DEHP m/z=279 DNP m/z=279 DINP m/z=293 DIDP m/z=307 Replicates (n=6) (n=6) (n=6) (n=6) (n=6) (n=6) % RSD Table I. Analytical precision based upon the area of the phthalate-specific quant ion for six replicates (n=6) of a PVC/DINCH sample. Calibration f the four calibration methods most often used for quantitation, standard addition is the method of choice. Polymeric products are often very complex blends of additives, co-polymers and oligomers. Many different chemical species can be desorbed along with the phthalates. For example, Figure 5 shows that DA desorbs with the phthalates. ther common plasticizers, such as Mesamoll II (Alkylsulphonic acid phenyl esters (ASE)) and DINCH (1,2-Cyclohexane dicarboxylic acid di-isononyl ester), also desorb with the phthalates. The potential for interference is significant. Another issue that must be considered is that it is not unusual for a GC/MS to struggle with long term contamination, most of which is inconsequential to the analysis being performed. For example, m/z 207 is a common polysiloxane associated with modern day cross-linked stationary phases. m/z 207 is not an ion that is associated with any of the phthalates of interest; however, very often the system contamination is, in fact a phthalate; standard addition will help mitigate the error associated with the phthalate background. Standard addition is the best calibration protocol when interference is an issue. The calibration is done using the sample matrix in the same time frame as the sample analysis. Interferences and background contamination will be constant for all analyses and its effect on the calculated concentration is negated. DBP BBP DEHP DNP DINP DIDP 1,800,000 1,600,000 1,400,000 1,200,000 y = x R 2 = y = x R 2 = y = x R 2 = Peak area 1,000, ,000 y = x R 2 = y = x R 2 = , ,000 y = x R 2 = , ,500 1, ,000 1,500 (ppm) Phthalate Figure 6 is a typical set of single point standard addition calibration curves for the six regulated phthalates in PVC - DA. The number of calibration points can be increased as specified in the laboratory s data quality objectives (DQ) documents or a project specific Work Plan. 6
18 PVC DA Quant Ion DBP m/z=223 BBP m/z=206 DEHP m/z=279 DNP m/z=279 DINP m/z=293 DIDP m/z=307 ng ppm %RSD (n=6) Table II. Calculated amounts of the six regulated phthalates determined using the standard addition calibration method. Example calculation: Equation of the DBP calibration curve is: y = mx + b y = x (R 2 =0.9979). When y=0 then x = / = ng. Concentration in ppm is given by : Value of DBP Assumed content of PVC-DA = (ng)/200 (μg) = (ng/μg) = 909 (ng/mg) = 909 (ppm). Comment 4: A list of the most commonly encountered phthalates is shown in Table III The regulated and monitored phthalates are in red. Note that both DIDP and DINP are technical mixtures because of the isomeric nature of the alcohols used to prepare the phthalates. The peaks in the mixtures need to be integrated and summed together. Comment 5: ne of the obvious advantages of using standard addition to calculate the concentration of the individual phthalates is that it eliminates the need for primary, polymeric phthalate standards. Standard addition calibration plots are essentially generated in the same time frame as the analysis are performed which minimizes the impact that changes in the chromatographic system may have on the data quality. Preparation of the calibration line: 1. Prepare a quantitative solution of the target phthalates in a suitable solvent. 2. Combine a volume (e.g., 10µL) of the phthalate solution with an aliquot of the sample. The sample amount must be the same in both analysis (analytical and calibration) 3. Vary the spike volume to generate a mufti-point calibration line. The calibration points are, by definition, in-matrix and accurately represent what truly happens during the desorption process. When using the thin film method, the analyst must be aware that the volatile components of the sample (e.g, DBP) may evaporate from the surface over time. Evaporation will manifest itself by a decrease in precision (i.e., an increase in the %RSD) and higher than expected concentrations. Evaporation results in a lower [area/dbp concentration] which results in an artificially higher concentration for DBP. f course, losses will be lower if the laboratory s temperature is less than 25 C. 7
19 Section 11.8 (ASTM method) cautions about the possible co-elution of DNP and DTP ASTM method D includes a chromatographic method for the quantitative determination of six regulated phthalates in PVC. Individual phthalates are identified using both retention and mass spectral data; however, attention must be given to the possibility that there are similar compounds which coelute and have similar mass spectra to the phthalate of interest. ne such compound is dioctyl terephthalate (DTP) (CAS# ) which is very similar to DNP ( ). The presence of plasticizers such as DINCH may also preclude the accurate determination of DNP. Figure 7 clearly shows that DNP and DTP are based lined resolved using the GC method described in D ; the areas are easily and accurately integrated even though both compounds co-elute with various DINCH isomers, m/z 279 is free of interference. In addition, DTP has an 261 ion; DNP and DINCH do not, which provides a confirming ion for DTP. This chromatogram demonstrates that the GC conditions specified in the ASTM method are the best place to start when working with phthalates in a polymeric matrix not specifically addressed in ASTM D TIC DINCH DTP DNP m/z: m/z: Figure 7. Extracted ion chromatogram (m/z=149; 279) of a DTP/DINCH standard spiked with a methylene chloride solution of the six CPSIA phthalates. The sample was analyzed as described in ASTM D : Thermal desorption temperature: 20ᵒC/min GC ven: ᵒC (@20ᵒC/min) 300ᵒC (@20ᵒC/min, 1 min hold) 320ᵒC (@20ᵒC/min, 2.5 min hold) Column: Ultra ALLY-5 (MS/HT) 30m X 0.25mm i.d., 0.5µm film Column Flow: 1.2 ml/min 8
20 Extending ASTM D There is near universal interest in monitoring phthalates in a number of consumer products. Many private sector companies, in anticipation of regulations directed at a number of common phthalates, have implemented in-house phthalate monitoring programs that are able to report as many as 15 phthalates see Table III. Although ASTM D is written specifically for the six regulated phthalates in PVC; it can easily be extended to include a larger number of phthalates in a number of different polymeric matrices. A simple EGA clearly shows that Thermal Desorption (TD) GC/MS can effectively extract the phthalates listed in Table III. In essence, the only change to D is a modification of the GC oven temperature profile. The initial temperature is lowered to 40 C, in order to ensure that the volatiles remain trapped at the head of the column during the desorption process, and to ensure the chromatographic separation of all 15 phthalates. RT Name Acronym CAS No Dimethyl phthalate DMP Diethyl phthalate DEP Di-n-propyl phthalate DRPR Diisobutyl phthalate DIBP Dibutyl phthalate DBP Di-n-pentyl phthalate DPP di-n-hexyl phthalate DHP Benzyl butyl phthalate BBP Diisoheptyl phthalate DIHP * Dicyclohexyl phthalate DCHP Bis(2-ethylhexyl) phthalate DEHP Diisooctyl phthalate DIP * Di-n-octyl phthalate DNP Diisononyl phthalate DINP * 19 + Diisodecyl phthalate DIDP * Table III. These 15 phthalates have been determined using ASTM D The six regulated phthalates are highlighted in red. (* DIHP, DIP, DIDP and DINP are technical mixtures. Care should be taken to ensure that the correct standards are used). Also note that these mixtures will have multiple peaks that need to be integrated and summed together. The column temperature program specified in D is modified to ensure resolution of the extended list. GC oven: ᵒC (at 40 ᵒC/min), ᵒC (at 5 ᵒC/min, 1 min hold), ᵒC (at 20 ᵒC/min, 2.5 min hold). Retention times are provided to give the reader a sense of the relative retention of each phthalate using a 5% phenyl/methyl stationary phase column. 9
21 Phthalates identified in a power cord sheath using ASTM D (modified) The outer PVC material of a power cord was analyzed for an extended list of phthalates using ASTM D ther than the change in the initial column temperature, the samples were analyzed as described in D Commercial standard mixtures of 15 phthalates in methylene chloride ( µg/ml) were used to prepare the standard addition solution. The standard addition method per ASTM D was used. The extracted ion chromatogram (m/z 149) of the sample is shown in Figure 8. bviously, there are a number of phthalates present in the sample. However, it is also clear that the level of DEHP exceeds the linear range of the detector and the sample will have to be diluted and reanalyzed. Concentrations as high as this always raise concerns about carryover and strongly suggest that a series of blank runs be made, in order to ensure that there is no carryover, before proceeding with sample analysis BHT (originate from THF solvent) DEP DIBP DBP Unknown phthalate Unknown phthalate Isomer of DEHP Unknown phthalate DEHP DIDP Figure 8. Extracted ion chromatogram (m/z=149) of the power cord sample (200 µg in sample cup). Analytical method: Thermal desorption temperature: 20ᵒC/min GC Injection port: 300ᵒC GC ven: ᵒC (@20ᵒC/min) 300ᵒC (@20ᵒC/min, 1 min hold) 320ᵒC (@20ᵒC/min, 2.5 min hold) Column: Ultra ALLY-5 (MS/HT) 30m X 0.25mm i.d., 0.5µm film Column Flow: 1.2 ml/min Split ratio: 1/20 Scan speed: 4 scans/sec Sample weight: 2.1 & 200 mg dissolved in 10 ml THF ; µg in sample cup 10
22 The concentration of DEHP is determined by a re-analysis of the sample in which the amount of sample is reduced from 200 to 2.1 µg, or a hundred-fold decrease in the amount of sample analyzed. Figure 9 shows the total ion chromatogram and extracted ion chromatogram (m/z=279) used to quantitate DEHP. Note this actual sample contained a whopping 17.13% DEHP! TIC EIC m/z 279 DEHP amount in sample: 17.13% Standard addition Sample Name Sample amount (µg) Standard addition (ng) Area PVC Sample PVC Sample + spike Quant value (%) % Figure 9. Total ion chromatogram and extracted ion chromatogram (m/z=279) of 2.15 µg of the power cord. GC oven profile: ᵒC (at 40ᵒC/min) - 280ᵒC (at 20ᵒC/min) 320ᵒC (at 10 ᵒC/min, 2.5 min hold) to 320ᵒC. DEHP was calculated to be % using the two point standard addition calibration method. Comment 7: Samples, such as this power cord sheath, can have an immediate and potentially disastrous effect on the instrumentation. High level system contamination is common and will requires time and effort to eliminate. If possible, unknown samples should be screened using Infrared (IR) Spectroscopy (8). At a minimum, this will flag the sample and it can be initially analyzed at a very high dilution like was done with the power cord sheath. 11
23 Comment 8: Although MDL studies yield values for several phthalates in the low ppm range, it may be wise to use the practical quantitation limit (PQL). ther laboratories have selected a reporting limit that be achieved for all targeted phthalates. A value of ppm is common. This takes into account changes in the instrument performance and varying levels of contamination that occur as the number of samples analyzed increases. The impact of these changes is somewhat mitigated by using standard addition. Phthalates Identified DEP DIBP DBP DEHP DINP DIDP Phthalate amount 22 ppm 24 ppm 76 ppm % 140 ppm 3900 ppm Sample amount analyzed (µg in sample cup) 200 µg 200 µg 200 µg 2.1 ug 200 µg 200 µg Table IV. Quantitative results for each phthalate found in the power cord sheath. Comparing the TD-GC/MS method with the traditional liquid extraction-gc/ms method Figure 10 summarizes the differences in data quality (accuracy and precision) between the thermal desorption/standard addition and solvent extraction/external standard methods. Wet chemical methods often result in low values for the concentration of the volatile phthalates; These can be attributed to losses during sample preparation. High concentration values for DNP, DINP and DIDP are due to interference from the co-eluting DINCH. The TD-standard addition method gives an almost constant response for all six phthalates with an average precision of 1.8 (%RSD). (%) 0.20 Solvent-extraction & ESTD (8.3) (10.7) 1.3e+07 DBP BBP DEHP DINCH (1.4) (13.2) (1.5) (9.3) (2.5) (10.4) DBP BBP DEHP DNP DINP (11.8) (1.6) (1.3) (2.5) TD & Standard Addition DIDP 60,000 m/z 279 DEHP, DNP 6,000 m/z 293 DINP 4,000 m/z 307 DIDP min Figure 10. Quantitation and precision using solvent extraction and external standard calibration and thermal desorption and standard addition calibration. %RSD (n=4) values are shown in parenthesis. Phthalate concentrations = 1,025 ppm 12
24 SUMMARY ASTM D is based on thermal desorption (TD) GC/MS. The method is suitable for an extended list of phthalates in a wide range of polymeric materials. The entire analytical sequence is performed in a single step: a known weight of sample (i.e., a known weight of solid sample or a known volume of a quantitative solution is placed in a sample cup which in turn is placed in the auto sampler carousel.) Thermal desorption eliminates conventional sample prep regimes; the sample is heated to a point that the phthalates desorb from the polymer. It is fast, uses a minimal volume of solvent, and eliminates the need for expensive glassware. Calibration is based on the areas of specific quant ions for each phthalate which virtually eliminates the interference that may occur from co-eluting non-target chemicals. Quantitation is done using standard addition which takes into account any impact the sample matrix may have on the process. It also ensures that the calibration and sample analysis are performed under identical instrumental conditions. Standard addition does require that each sample be analyzed at least twice, but the benefits far out weigh the investment in the second analysis, especially given the fact that the entire process is automated. References 1. ASTM D , Standard Test Method for the Determination of Low Level, Regulated Phthalates in Poly (Vinyl Chloride) Plastics by Thermal Desorption - Gas Chromatography/Mass Chromatography. 2. Section 108: Products Containing Certain Phthalates Di-(2-ethylhexyl) phthalate (DEHP), Dibutyl phthalate (DBP), and Benzyl butyl phthalate (BBP). Diisononyl phthalate (DINP), Diisodecyl phthalate (DIDP), and Di-n-octyl phthalate (DNP). 4. Consumer product safety commission, Test Method: CPSC-CH-C Standard perating Procedure for Determination of Phthalates, April 1, Applications of a multifunctional pyrolyzer for evolved gas analysis and pyrolysis-gc of various synthetic and natural materials: part 2, S. Tsuge, H. htani, Chu Watanabe and Y. Kawahara, American Laboratory, 35, 32-37,March, Rapid and Simple Determination in Plastic Toys by a Thermal Desorption-GC/MS Method, T. Yuzawa, Chu Watanabe, R. Freeman and S. Tsuge, Anal. Sci., September, 25, , Development of a new pyrolyzer for thermal desorption and/or pyrolysis gas chromatography of polymeric materials, C.Watanabe, K.Teraishi, S.Tsuge, H.htani; J. HRC&CC, 14, , ASTM D (2004) 5, Standard Test Method for Analysis of Components in Poly(Vinyl Chloride) Compounds Using an Infrared Spectrophotometric Technique. Financing Technology 3400 East Third Avenue toll free fax v

25 Identify additives in polyethylene using heart cutting EGA GC/MS and reactive pyrolysis Itsuko Iwai, R.R. Freeman and Dave Randle, Frontier Laboratories Terry Ramus, Diablo Analytical Introduction Subtle differences in polymer formulations are common, but they rarely influence the overall performance of the final product. However, there are instances where the product will suddenly be more brittle, easily deformed or actually fail in routine use. When this occurs the search for differences begins. Detailed analyses of the good and bad polymer will often reveal differences in The additive package, the presence of unwanted contaminates or unexpected chemical linkages. Frontier has developed a method map that guides the analyst through the maze of analytical techniques used to characterize a polymeric material. The first step is to analyze a small aliquot ( 100µg) of the sample using Evolved Gas Analysis (EGA) MS (1,2). The EGA thermogram provides a thermal profile of the sample. Average MS, extracted ion chromatograms and library search results are used to map the analytical sequence, which will provide valuable information about The constituents of the sample. Figure 1. Method map for Materials Characterization Fig. 1 Techniques. EGA: Evolved Gas Analysis; TD: Thermal Desorption; HC: Heart Cutting; PY: Pyrolysis; RxPy: Reactive Pyrolysis Introduction to the method map The Frontier method map will provide the most information about the chemical composition of the samples in the least amount of time. The sequence of analyses is based upon the analysis of the EGA thermogram. All of the various analytical methods can easily be automated. The process is straightforward. All samples are analyzed using EGA MS. Depending on the questions being asked (e.g., are these samples different or what is the polymer being used), EGA may be sufficient. The EGA tube is removed and an analytical column is installed. Using the information extracted from the thermogram, the sample can be pyrolyzed, or each segment or zone can be desorbed and analyzed using thermal desorption (TD) GC/MS, or the sample constituents can be thermally hydrolyzed and methylated (RxPY). Two polyethylene samples are used to demonstrate how the method map enables an analyst to quickly and efficiently characterize polymeric materials. The question being asked is These two polyethylene samples perform differently; is there a difference in the chemical composition of the two samples? 1
26 Thermal characterization using Evolved Gas Analysis (EGA) MS Evolved Gas Analysis (EGA) EGA requires only that a deactivated tube connect the injection port and the detector. The GC oven is set to 320 C. The sample is dropped in the furnace, which is at a low temperature, that is subsequently programmed to a high temperature. There is no analytical column. The EGA thermograms of the two samples are virtually identical. If the average MS of the signal is compared to a database of EGA spectra, the samples are confirmed as being polyethylene. A second piece of useful information is that the degradation process is complete around 600 C. This is the best temperature to use for the next step, which is flash pyrolysis. Higher temperatures result in excessive degradation, which makes it harder to identify the polymer. Lower temperatures do not completely degrade or pyrolyze the polymer. Abundance Temp--> 1e+07 1e Zone A Zone B Zone C Zone D Sample #1 Pyrolysis temperature Sample #2 Figure 2. EGA thermograms of each sample. Four thermal zones are indicated. Method conditions: Frontier Lab EGA/PY 3030D Multi Shot Pyrolyzer, furnace temperature program: o C@20 o C/min, UADTM 2.5N (deactivated) EGA tube 2.5m x 0.15mm i.d., Injection port and GC oven: 300 o C, Split 50:1, Helium at 1mL/min, MS scan range: m/z, MS scan speed: 0.17scan/sec 2
27 Pyrograms (TIC) of each sample PY: 600 C Abundance C25 C30 Sample #1 2e+07 1e+07 C6 C7 C8 C9 C10 C11 C12 C13 C14 C15 C16 C20 C35 C38 Time--> e+07 Sample #2 1e Figure 3. Single Shot pyrograms are shown. The pyrolysis temperature of 600ᵒC was chosen from the EGA profile. Most of the pyrolyzates are dienes, alkenes and alkanes; normal for PE polymers. The profiles of the pyrograms for both samples are the same, indicating that similar cross linking and branching characteristics likely occur in these two PE samples. Ultra ALLY 5: 30m x 0.25mm i.d. x 0.25 µm film, 40 o C(2min) 10 o C/min 150 o C 20 o C/min 320 o C(3min),Split 50:1, Helium at 1mL/min, m/z, 2.57scan/sec 3

28 F Search (Polymer PyGC MS Library) Search Results for sample #1 Library search results Both samples are tentatively identified as polyethylene with a very high match quality Figure 4. Heart cutting of EGA thermal zones Based on the two pyrograms, it appears that the polymeric fractions of the samples are very similar, so any compositional differences may be due to the compounds in the volatile fraction of the polymer. The volatile fraction includes residual solvents, monomers, oligomers and additives. The thermograms can be sectioned into thermal zones as shown in Figure 2. Zones A, B and C are sequentially desorbed using a selective sampler (SS). Each zone is analyzed independently which produces three chromatograms one for each thermal zone. Thermal desorption of EGA thermal zones occurs over time. Therefore, it is necessary to cryo trap the desorbed compounds as the sample is heated. This ensures that the desorbed compounds are held in a narrow band prior to separation. Cryo trapping is accomplished using the MicroJet Cryo Trap, and the entire analytical sequence is controlled by the Frontier software. Polyethylene (high density) Match Quality 97% Figure 4. Search results for sample #1. The MS data file was processed using F Search software and the results were compared with the known pyrograms residing in the F Search polymer library. 4

29 Using the Selective Sampler (SS) for heart cutting EGA GC/MS How the SS works The selective sampler consists of two elements: a Tee fitting that attaches to the bottom of the splitter and a gas control module. When gas flows through the Tee, flow to the column is maintained and vapors from the injection port are backflushed through the split vent see Figure 5. The column sees only carrier gas no sample. When the SS valve is rotated, there is no flow through the Tee fitting and vapors from the pyrolyzer are split a portion goes to the column and a portion goes to the vent. The flow through the TEE is set and controlled by a flow controller. The timing of the on/off function is controlled by the Frontier operating software see Figure 6. Sample vapors split & analyzed Closed Vent He Carrier Gas (He/Air) All sample vapors vented GC Inlet SS sampling adapter pen Pyrolyzer Selective sampler flow controller Split vent He GC GC MicroJet Cryo-trap Figure 5. Two operating positions of the selective sampler (SS): valve closed and valve open. 5 5

30 Using the Selective Sampler (SS) for heart cutting EGA GC/MS EGA Temp. Ramp Interface Temp. Analyze Analyze Analyze Leave in cup Figure 6. Screen shot of the Heart cut sampling table. = collect and analyze the fraction as the furnace executes the Sampling program. Procedure for setting up the analysis of each thermal zone of interest The furnace temperature program for the EGA is shown in the method box see Figure 6. Four thermal segments have been entered into the sampling table. The checked boxes under Sampling and Cryo Trap indicate that these segments will be collected and analyzed using both the Selective Sampler and the MicroJet Cryo Trap. Leaving the box open instructs the system to deactivate the device during the desorption of this fraction of the sample. Each polyethylene sample will be segmented into 4 fractions 3 of which will be analyzed. Two samples will generate six chromatograms. The sample will be heated from 100 to 160 C. rganics evolving from the sample will be trapped and analyzed. Upon completion of the GC analysis, the column temperature is reset to 40 C and the sample is heated from C, which generates a second chromatogram. Finally, the sample is heated from C, which generates the third chromatogram. Zone A (ºC) Zone B (ºC) Zone C (ºC) Zone D (ºC) Temp Analyze Yes Yes Yes No, remains in sample cup 6
31 Heart Cut Chromatograms (TIC) of Sample #1 Abundance Zone A ( C) Sample #1 (0.98mg) Zone B ( C) C18 C22 C24 C20 C26 C30 C Zone C ( C) Figure 7. The chromatograms of the three thermal zones are shown above. The samples was heated in exactly the same fashion as was used for the EGA. The GC column, gas flows, temperature profiles and MS parameters are the same as those used for the pyrolysis analysis. Because most of the sample is polyethylene, it desorbs above 430 C and therefore remains in the sample cup. This means that the amount of sample analyzed can be increased beyond 100µg without overloading the column or the MS. Note that in this example close to a milligram (0.98mg) of polyethylene is analyzed. 7
32 Heart Cut Chromatograms (TIC) of Sample #2 Abundance Zone A ( C) Sample #2 (0.98mg) Zone B ( C) C22 C24 C20 C18 C26 C30 C28 peak #1 Bis(2 ethyl hexyl) Phthalate (RT:20.72) Zone C ( C) Figure 8. The chromatograms of the three thermal zones are shown above. The samples were heated in exactly the same fashion as the EGA. The GC column, gas flows, temperature profiles and MS parameters are the same as those used for the pyrolysis analysis. SUMMARY: Sample #2 has bis (2 ethyl hexyl) phthalate, which is not present in sample #1. 8
33 Expansion of zone B: precision of the phthalate analysis Sample #1: m/z=149 Sample #2: m/z= n= n= n= bis (2 ethyl hexyl) phthalate Peak area: n= Peak area: n= n= Peak area: n= Peak area: n= n= Peak area: n= Figure 9. Aliquots of each sample were placed in five sample cups. nly Zone B was analyzed. The analysis sequence is (1) heat the sample: C at 20 C/min. Using the selective sampler vent Zone A, desorbed vapors are vented. Set the furnace Temp. to 160 C; desorb Zone B and leave fractions C and D in the sample cup. The precision (%RSD) of the phthalate determination is
34 Reactive Pyrolysis of each sample: a search for ester linkages Reactive Pyrolysis (RxPY) using TMAH at 260ᵒC enables the analyst to search for additives that cannot be determined using thermal desorption due to chemical or thermal instability. (3,4) RxPY, which is in essence thermally assisted hydrolysis, followed by methylation, will provide information on those additives with an ester or ether linkage as shown in the equations below. R 1 C R 2 TMAH R 1 C CH 3 + H 3 C R 2 R 3 C R 4 TMAH R 3 CH 3 + H 3 C R 4 + C 2 RxPY is useful for many condensation polymers. Both samples contain carboxylic acid and methyl esters, which emanate from the PE. The acids have carbon chain lengths from C14 to C18. Irganox 1076 is also detected (using the SIM mode) in both samples Hexadecenoic acid methyl (C17) C# : Alkane Methyl Palmitate(C17) C# : Fatty Acid Methyl Ester Methyl myristate (C15) ctadecenoic acid methyl(c19) C20 Methyl Stearate (C19) C16 C18 C22 C24 C26 C28 Sample #1 (C Sample # Figure 10. TIC of each sample after hydrolysis and methylation using TMAH. 10
35 Reactive Pyrolysis SIM Chromatograms for STD Spike & Samples 1 & 2 PY: 260 C Abundance Irganox 1076 Standard Time--> Sample #1 n= Sample #1 n= Sample #2 n= Sample #2 n= Figure 11. Duplicate SIM (m/z = 306) analysis of each sample following RxPY. These results confirm the presence of either Irganox 1076 and/or Irganox 1010 in both samples. They are present at similar levels in both PE samples. Should the amount of Irganox be of interest, it can easily be quantitated using the standard addition calibration method. See reference (5) for an excellent discussion on how to differentiate and quantitate Irganox 1076 and 1010 using the Frontier pyrolyzer. 11
36 Summary References When using the Frontier method map, the characterization of all unknown samples starts with Evolved Gas Analysis (EGA). EGA MS provides a quick and simple thermal characterization of the sample. The Frontier method map utilizes the information observed from the EGA thermogram to suggest a series of analyses, which will ultimately enable the analyst to report their findings in a timely manner. nce the EGA work is complete and the EGA tube is replaced with a GC column, subsequent analyses flash pyrolysis, EGA heart cutting and RxPy are used to fully characterize the samples. In this example, the analyst was asked to identify the differences in two polyethylene samples. Within a few hours it was determined that the basic polymeric formulations were the same and that one sample contained bis(2 ethyl hexyl) phthalate. Both samples also contained similar levels of a series of hydrocarbons (wax), carboxylic acids (C14 C18) and Irganox 1076 and/or If necessary, each additive can be quantitated using standard addition. The entire sequence of analysis can be automated. 1. M. Schilling, M. Bouchard, H. Khanjian, T. Learner. A. Phenix & R. Rivenc, Application of chemical and thermal analysis methods for studying cellulose ester plastics, Accounts of Chemical Research 43[6](2010), Chu Watanabe, A. Hosaka, Y. Kawahara, P. Tobias, H. htani & S. Tsuge, GC MS analysis of heart cut fractions during evolved gas analysis of polymeric materials, LCGC NRTH AMERICA. 20 (2002), R.R. Freeman, T. Yuzawa & Chu Watanabe, Reactive pyrolysis GC: a simple, one step, quantitative method for the analysis of fatty acids in natural products, Lipid Tech., 23[11](2011), K. ba, Y. Ishida, Y. Ito, H. htani & S. Ysuge, Characterization of Branching and/or Cross Linking Structures in Polycarbonate by Reactive Pyrolysis Gas Chromatography in the Presence of rganic AlkaliY. Macromolecules, 2000, 33 (22), pp Characterization and Determination of Irganox 1076 and 1010 in Polyethylene using Thermal Desorption and Reactive Pyrolysis GC/MS, Frontier Laboratories, This work was done using a EGA/PY 3030D Multi Shot pyrolyzer, with five accessories: Vent free adapter, Auto Shot sampler, MicroJet Cryo trap, Selective Sampler and F Search (EGA and polymer libraries). Financing Technology 3400 East Third Avenue toll free fax V
37 Double-Shot Pyrolyzer Application Note (PYA1-001E) Analysis of Residual ligomers in Polystyrene (PS) Part 1 : Thermal Extraction in Evolved Gas Analysis (EGA) Solvent extraction is generally used in analysis of residual olgomers in PS; however, complicated pretreatment is required. Therefore, simpler method is desired. Using our Double-Shot Pyrolyzer, a quantitative analysis by simpler thermal extraction was performed. The analysis requires 100% extraction of the target components without any interfering components. However, PS produces oligomers in trace amounts upon heating to 300ºC. Thermal extraction conditions must be carefully determined. Fig. 1 shows the setup of evolved gas analysis (EGA). As shown in Fig. 2, a tiny peak originating from the residual oligomers in PS is observed in 100ºC to 260ºC region. Thermal extraction conditions for the residual components will be studied in the technical note that follows. Double-Shot pyrolyzer EGA tube GC oven (isothermal at 300ºC) Detector such as MS Fig. 1. Double-Shot Pyrolyzer and Evolved Gas Analysis with GC/MS Residual oligomers (less than 1% of major component) Thermal decomposition products of polystyrene X 100 X ºC Fig. 2 Evolved Gas Analysis of PS Pyrolysis furnace temp.: 100ºC 600ºC (20ºC/min), Carrier gas: He 50kPa, 60ml/min, Split ratio: ca. 1/50 EGA tube: 0.15mm id, Length 2.5m (UADTM-2.5N), GC oven temp.: 300ºC, Injection port temp.: 320ºC Sample: ca. 0.2mg, Detector: MS, PY-GC interface temp.: 320ºC (AUT mode) ºC 25min Keyword : ligomer, Polystyrene, Thermal Extraction, Evolved Gas Analysis Application : Environmental Pollution, Manufacturing Process, Polymers : Registered trademark of
38 Double-Shot Pyrolyzer Application Note (PYA1-002E) Analysis of Residual ligomers in Polystyrene (PS) Part 2 : Thermal Extraction Conditions and Quantitative Analysis Fig. 1 shows the chromatogram of components obtained by thermal extraction of residual oligomers observed in the previous Evolved Gas Analysis of PS. Among the components observed here, quantitative analysis of styrene monomer and styrene trimer was performed. Under the thermal extraction conditions shown in Fig. 2, thermal extraction of a sample was repeatedly performed, and it was found that at temperatures above 220ºC, styrene oligomers produced by decomposition of PS were interfering the analysis. Thermal extraction at 200ºC for 20 min was therefore found to give styrene monomer and trimer in 100% yield without thermal decomposition of PS. Quantitative analysis was done under the conditions found, and repeated five times. The results are shown in Table 1. As indicated, quantitative analysis could be made with excellent reproducibility (RSD < 2%). Extraction yield (%) Final Temp 150ºC ºC 220ºC 240ºC min Extraction time Fig. 2 Efficiency of Thermal Extraction Heating program : 40ºC Final temp (20ºC/min) 0 Styrene monomer Styrene trimer Styrene dimer Silicon oligomers min Fig. 1 Analysis of Residual ligomers in PS Pyrolysis furnace temp.: 40ºC 20ºC/min 200ºC (20min) Carrier gas : He 140kPa, 80ml/min, Split ratio : ca. 1/80 Column : 5% diphenyldimethylpolysiloxane, 30m, 0.25mm id, 0.25µm (UA5-30M-0.25F, ) GC oven temp.: 40ºC (1min) 20ºC/min 320ºC Trap temp.: -196ºC (MJT-1030E, ) Injection port temp.: 320ºC, Sample : 0.2mg, Detector : FID PY-GC interface temp.: 320ºC (AUT mode) Table 1. Results of Styrene Monomer/Trimer Sample : 200µg, Temp. 40ºC 20ºC/min 200ºC(20min) n=5 Average RSD Monomer Trimer 232 ppm 913 ppm 1.9% 1.2% Keyword : ligomer, Polystyrene, Thermal Extraction, Quantitative Analysis, Reproducibility Application : Environmental pollution, Manufacturing Process, Polymers : Registered trademark of
39 Double-Shot Pyrolyzer Application Note Analysis of Acrylonitrile Butadiene Rubber (NBR) by Double-Shot Technique (PYA1-003E) Because polymeric materials are generally blends of basic polymers and additives, pyrograms obtained by conventional single-shot technique (instant pyrolyis) include both additives and thermal decomposition products of the basic polymer, and this often makes analysis difficult. n the other hand, double-shot technique (multistep pyrolysis) is useful because volatile components are thermally desorbed at the fist stage, then instant pyrolysis of the basic polymer follows. Analysis of NBR is described here as an example. Fig 1 shows a pyrogram of NBR by single-shot method. Thermal decomposition products and additives are shown on a single pyrogram, it is difficult to distinguish the peaks of basic polymer from those of additives. In the double-shot technique (Fig. 2); however, volatiles and additives are eluted off in the first step, whereas thermal decomposition products of basic polymer come off in the second step, allowing much easier identification of peaks. Conditions for thermal desorption and pyrolysis can be determined from EGA curve obtained in evolved gas analysis technique. See PYA3-001E for details. Fig. 1. Pyrogram of NBR by Single-Shot Technique (Total ion chromatogram) PY: Double-Shot Pyrolyzer (PY-2020D), Detector : MS, Scan range : m/z=29~400 Pyrolysis temp.: 550ºC, Carrier gas : He, Column flow rate : 1.0ml/min, Carrier total flow rate : 100ml/min Separation column : Ultra ALLY-5 (5% phenyldimethylpolysiloxane), 30m, 0.25mm id, Film thickness : 0.25µm GC oven temp.: 40ºC 3min 10ºC/min 300ºC (3min), GC injection port temp.: 320ºC, Sample : 0.31mg a. First stage : Thermal desorption (100 20ºC/min 300ºC (5min)) DA DP DS b. Second stage : Instant pyrolysis (550ºC) DA : Dioctyladipate DP : Dioctylphthalate DS : Dioctyl sebacate Keyword : Double-Shot Technique, NBR, Additives, Thermal Extraction, Thermal Desorption Analysis, DA, DP, DS Application : General Polymer Analysis Fig. 2. Pyrogram of NBR by Double-Shot Technique Analytical conditions are the same as above (Fig. 1.) : Registered trademark of
40 Double-Shot Pyrolyzer Application Note (PYA1-004E) Analysis of Antioxidants in Acrylonitrile Butadiene Rubber (NBR) Part 1 : Study of Thermal Extraction by Evolved Gas Analysis (EGA) When additives in polymer materials are analyzed by instant pyrolysis, interferences from thermal decomposition of polymer backbone are often seen on the pyrogram, in addition, thermal decomposition of additives can also degrade the quality of the analysis. Thermal desorption technique can solve these problems. Described here is quantitative analysis of commonly used antioxidants for NBR, i.e., NCRAC 810-NA and NCRAC 6C (chemical structures and mass spectra shown below). Conditions for thermal desorption must first be determined. Evolved gas analysis is an excellent tool for this purpose. Shown in Fig. 2A is an evolved gas curve (TIC) of NBR obtained by programmed heating from 50ºC to 600ºC. A broad peak (A-1) in 120~320ºC range arising from volatile components of the additives and a peak (A-2) in 320~520ºC range from the decomposition of polymer were observed. Mass chromatograms of characteristic ions for NCRAC 810-NA and NCRAC 6C are shown in Fig. 2B, showing clearly that these were all eluted off below 350ºC. Based on the results, the thermal desorption condition was determined to be 100ºC 10ºC/min 350ºC (5min). The following report (PYA-005) will describe quantitative analysis by employing the thermal desorption condition obtained here as well as the reproducibility. H N 77 NCRAC 810-NA 105 H N CH3 CH CH H N NCRAC 6C H N CH3 CH CH CH3 CH 268 CH (m/z) (m/z) Fig. 1. Chemical Structures and Mass Spectra of Antioxidants A : TIC Elution of Additives A-1 Decomposition of Polymer Backbone A-2 B : Mass Chromatogram NCRAC 810-NA m/z=226 NCRAC 6C m/z= ºC Fig. 2. Evolved Gas Analysis of NBR Pyrolysis temp. : 50ºC 600ºC (10 /min) Carrier gas : He 50kPa, 60ml/min, Split ration : ca. 1/50 EGA tube : 0.15mm id, 2.5m (UADTM-2.5N), GC oven temp. : 300ºC, Injection temp. : 320ºC, Sample : ca. 0.5mg, Detector : MS, Scan range : m/z=29~400, Scan rate : 0.1 Scans/sec, Py-GC interface temp. : 320ºC (AUT mode) Keyword : NBR, Thermal Desorption, Quantitative Analysis, Additives, Antioxidant, NCRAC 810-NA, NCRAC 6C, Evolved Gas Analysis Application : General Polymer Analysis, Rubber Related Industry : Registered trademark of 363 Vintage Park Drive
41 Double-Shot Pyrolyzer Application Note (PYA1-005E) Analysis of Antioxidants in Acrylonitrile Butadiene Rubber (NBR) Part 2 : Reproducibility in Quantitative Analysis Volatile components in NBR were thermally desorbed using conditions developed in Technical Note PYA1-004E (Furnace programmed from 100ºC to 350ºC at 10ºC/min, then holding for 5min). The chromatogram is shown in Fig. 1. Quantitative analysis was performed on the antioxidants NCRAC 810-NA and NCRAC 6C by the internal standard method. Table 1 shows the results. The concentrations of NCRAC 810-NA and NCRAC 6C were both determined to be about 3,000ppm, with reproducibilities of 1.98% and 1.27%, respectively. This demonstrates the excellent reproducibility obtained from the Double-Shot Pyrolyzer. Table 1. Reproducibility of Area Ratios (vs ISTD) of NBR additives ISTD n NCRAC 810-NA NCRAC 6C Aver RSD 1.98 % 1.27 % NCRAC 810-NA NCRAC 6C min Fig. 1 Chromatogram of Thermally Desorbed Components from NBR Pyrolyzer : Double-Shot Pyrolyzer (PY-2020D), Detector: Flame ionization detector (FID) Furnace temp.: ºC/min 350ºC (5min) Carrier gas : He, Column flow rate: 1.2ml/min, Carrier gas flow rate: 150ml/min Separation column : Ultra ALLY + -1 (dimethypolysiloxane), Length :30m, 0.25mm id, Layer thickness : 0.25µm GC oven temp.: 40 20ºC/min 320ºC (1min), Injection port temp. :320ºC, Sample : ca.1mg Keyword Application : NBR, Thermal Desorption, Quantitative Analysis, Reproducibility, Additive, Antioxidant, NCRAC 810-NA, NCRAC 6C : General polymer analysis, Rubber industry : Registered trademark of
42 Double-Shot Pyrolyzer Application Note (PYA1-006E) Analysis of ffensive dor Components in Polypropylene (PP) Pellets Some residual oligomers and additives in plastics can be objectionable or even harmful to humans. This is especially important in the food packaging industry. Here is an example of the determination of offensive odor components produced during the injection molding of polypropylene (PP), using the Double-Shot Pyrolyzer, PY- 2020D. Fig. 1 shows chromatograms of components released from PP when heated from 50ºC to 100ºC. Both good material and defective material which produces offensive odors were analyzed. This temperature range was determined using Evolved Gas Analysis (EGA), Technical Note PYA The results in Fig.1show that similar patterns of oligomers are detected in both good and defective material. However, some low-boiling alcohols were observed only in the defective products, and were identified as the cause of the odors. This example demonstrates the value of thermal desorption-gc/ms coupled with EGA in resolving problems with odor and other harmful evolved material in plastics. A. Good product C 9 C 12 C 15 C 18 C 21 B. Defective product iso-butanol ethyl tert-butyl ether tert-pentanol 4-methylheptene C9 n-c9 Fig. 1. Comparison of Volatiles in PP Pellets of Good and Defective Material PY : Double-Shot Pyrolyzer (PY-2020D), Cold trap : Microjet Cryo-Trap (MJT-1030E) Detector : Mass spectrometer (mass scan range: m/z=29-400), Thermal desorption temperature : 50 10ºC/min 100ºC (5min) Carrier gas : He, Column flow rate : 1.0ml/min, Split ratio : 1/20 Separation column : Ultra ALLY + -5 (5% diphenylpolysiloxane), Length 30m, 0.25mm id., Layer thickness 0.25µm GC oven temperature : 40 20ºC/min 240ºC, GC injection temperature : 320ºC, Sample : ca. 7mg Keyword : Polypropylene, ffensive dor, Volatile Components, Thermal Desorption min Application : General Polymer Analysis, Manufacturing Process Management, Quality Assurance : Registered trademark of
43 Double-Shot Pyrolyzer Application Note (PYA1-007E) Analysis of Alkylketene Dimers (AKD) in Paper In paper manufacturing, various additives are used, often at minute concentrations. While GC, LC, IR, and NMR are available for analyzing paper additives, these methods require a pretreatment to extract the additives. This can be a cumbersome and time-consuming process. However pyrolysis gas chromatography (Py-GC) is a simpler method, since an extraction step is not necessary. The analysis of alkylketene dimers, AKD, used as a sizing agent in the paper industry, is described here. AKDs exist in three forms: unreacted, ketones resulting from hydrolysis, and AKDs bonded to cellulose by hydroxyl groups. Py-GC analysis revealed that in this sample all the AKDs were converted to dialkylketones by hydrolysis, as shown in Fig. 1. Fig. 2. is a pyrogram of paper with AKD added. Within 8 minutes, three dialkylketones originating from AKD were eluted. This example demonstrates the speed and ease with which Py-GC can analyze AKD without any pretreatment. Reference : Yano, T., hotani, H., Tsuge, S., ANALYST., 1992, 5, 849. R CH C CH R C AKD + H2 heat R CH2 C R CH C H -C2 R CH2CCH2 R dialkylketone Fig. 1 Ketone Formation by Hydrolysis of AKD Levoglucosan, etc. R CH2CCH2 R 1 R:C16, R :C16 2 R:C16, R :C18 3 R:C18, R :C min Keyword : Paper, Size, AKD, Flash Pyrolysis Application : Paper Manufacturing Fig. 2 Analysis of AKD in Paper by Pyrolysis-GC Pyrolysis temp. : 600ºC, Carrier gas : He, Column head pressure : 140kPa, Split ratio : 1/50 Separation column : Ultra ALLY + -1 (dimethylpolysiloxane), Length 30m, 0.25mm id., Layer thickness 0.25µm GC oven temp. : ºC/min 330ºC, GC injection port temp. : 320ºC, Sample : 2mg, Detector : FID : Registered trademark of
44 Double-Shot Pyrolyzer Application Note (PYA1-008E) Analysis of Stereoregularity of Polymethyl Methacrylate (PMMA) NMR is generally used to analyze stereoregularity of polymers, however; it can hardly be applied to cross linked polymers that are insoluble in solvents. n the other hand, pyrolysis gas chromatography (Py-GC) can be applied to polymer samples in any form. Shown below are analysis examples of stereoregularity of cross linked PMMA. Fig. 1 shows a pyrogram of PMMA and blowup of the MMA tetramer region. Total of four characteristic peaks are observed in the tetramer region. These arise from two tetramers A and B (shown in Fig. 2) in which the position of double bond differs. Each of these tetramers gives two diastereomers, therefore giving two separate peaks. The stereoregularity obtained by relative strength of these meso and racemic species were in a good agreement with that obtained by NMR analysis (Fig. 3). Therefore, the Py-GC technique is found to be an extremely powerful tool in analysis of stereoregularity of cross linked polymers, otherwise unattainable by NMR analysis. Monomer Dimer region Trimer m : Meso r : Racemic Tetramer A m r m Tetramer B r Tetramer region Fig. 1 Pyrogram of PMMA Pyrolysis temp: 500ºC, Column: 5% diphenylpolysiloxane, Length: 30m, 0.32mm id, Film thickness: 0.25µm Tetramer A (m) CH3 CH3 CH3 CH3 CH3 C CH2 C CH2 C CH C CCH3 CCH3 CCH3 CCH3 Tetramer B (m) CH3 CH3 CH3 CH2 CH3 C CH2 C CH2 C CH2 C CCH3 CCH3 CCH3 CCH3 Fig. 2 Two Tetramers of Meso Species Py-GC (m%) NMR (m%) Fig. 3 Analysis Results of Meso Species by Py-GC and NMR Excerpt from Few Recent Applications of Py-GC by Kiura, Wakabayashi of Mitsubishi Rayon, 2nd Pyrolysis Gas Chromatography Seminar (hosted by Frontier Lab Ltd.) Keyword : Polymethylmethacrylate, PMMA, Stereoregularity, NMR Application : Fiber industry, Chemical industry, General polymer analysis : Registered trademark of
45 Double-Shot Pyrolyzer Application Note (PYA1-009E) Composition Analysis of a Multi Component Acrylate Copolymer NMR is used in composition analysis of polymers, however; its resolution is often inadequate for analysis of multi component copolymers. NMR alone therefore will not be good enough for detailed analysis. In these situations, Py-GC technique is extremely useful as a supplemental analytical tool. Fig. 1 shows 1 H-NMR spectrum of an acrylate copolymer which comprises of eight components as shown in Table 1. Because of poor resolution, peaks are heavily overlapping, making the analysis difficult. n the other hand, a pyrogram of the same sample obtained by Py-GC is shown in Fig. 2. Each peak is found to be well defined with all the components (except for AA) detected. As shown here, Py-GC technique coupled with NMR makes detailed analysis possible. Table 1. Monomers of Acrylate Copolymer and Their Abbreviations CH 3 CH 2 =CCCH 3 MMA CH 3 CH 2 =CCEtH HEMA CH 2 =CHCH AA CH 2 =CHCEtH HEA -CH=CH 2 Et CH 2 =CHCCH 2 CHC 4 H 9 2EHA ST MMA BMA HEMA BA CH 3 CH 2 =CCC 4 H 9 BMA CH 2 =CHCC 4 H 9 BA HEA HEMA MMA BA BMA 2EHA BA BMA ST 2EHA BMA BA 10ppm 5 Fig. 1 1H-NMR Spectrum of 8-Component Acrylate Copolymer 0 C 4 H 10 H MMA Et CH 2 =CC 4 H 10 BA ST HEA C 4 H 10 Et 2 H HEMA Et BM A HCH 2 CHC 4 H 10 2EH A Scan Fig. 2 Pyrogram of 8-Component Acrylate Copolymer (Amount of sample: 0.02mg, Pyrolysis : 550ºC) Reference : N. Sato, 2nd PY seminar in 1998 (hosted by Frontier Lab), page 6-6 Keyword : Acrylate, Copolymer, Composition Analysis, NMR Application : General Polymer Analysis : Registered trademark of
46 Double-Shot Pyrolyzer Application Note (PYA1-010E) Analysis of Ceramic Composite Materials with Double-Shot Pyrolyzer and Peripheral Devices Part 1 : Evolved Gas Analysis (EGA) and Library Search using EGA-MS Polymer Library EGA-MS, a combination of mass spectrometer and evolved gas analysis, which is a thermal analytical technique using Double-Shot pyrolyzer, is a very useful technique as the primary search method for unknown samples. An example shown here is analysis of a ceramic composite material in which various additives have been added to aluminum oxide during the manufacturing process. Fig. 1. shows the EGA curve and average spectra of peaks A, B, C, and D observed for the composite material. Background (BG) noise has been subtracted from the average spectra. Figs. 1a and 1b show the results of library search using EGA-MS of Frontier for the spectra obtained. Peaks C and D were found, with high hit rates, to be PBMA and PS, respectively. Peak A and B are considered to be of low boiling compounds because of their lower elution temperatures. Therefore, upon searching normal MS library (Wiely 275), peak A was judged to be a phthalate ester, and peak B, saturated hydrocarbons. Library search with a combination of MS library and EGA-MS LIB as shown here is extremely useful as the primary search method to estimate the composition of unknown polymers. Fig. 1a Library Search Result for Peak C Name Qual 1. Poly(n-butyl methacrylate) (PBMA) : Poly(2-hydroxyethyl methacrylate) : : 4 3. Higher methacrylate copolymer : 2 Fig. 1b Library Search Result for Peak D Name Qual 1. Polystyrene (PS ) : Styrene-ethylene-butadiene-styrene-block copolymer : Modified poly(phenylene oxide) : m/z BG of peaks C &D D A BG of peak A B BG of peak B C ºC Fig. 1 EGA Curve of Ceramic Composite Material (Injection molding) Pyrolysis furnace temp : 100ºC~500ºC (20C/min), Carrier gas : He 50kPa, Split ratio : ca. 1/50 EGA capillary tube : 0.15mm id, length 2.5m (UADTM-2.5N), GC oven temp : 300ºC Injection port temp : 320ºC, Amount of sample : ca. 0.5mg, Detector : MS (m/z=29-400, 0.1 scan/sec) PY-GC interface temp : 320ºC (AUT mode) Keyword : Evolved Gas Analysis, Library Search, Ceramic Composite Material, Primary Search Application : General Polymer Analysis : Registered trademark of
47 Double-Shot Pyrolyzer Application Note (PYA1-011E) Analysis of Ceramic Composite Materials with Double-Shot Pyrolyzer and Peripheral Devices Part 2 : Data Analysis by EGA-MS with Mass Chromatogram Method Using EGA-MS technique coupled with Evolved Gas Analysis and mass spectrometer (MS), then obtaining a mass chromatogram by selecting characteristic ions of a compound of interest, characteristic thermal properties of a sample being heated can be obtained. Fig. 1 shows characteristic mass chromatograms of peaks A through D, estimated main components, observed on the EGA curve of the ceramic composite material described in Double-Shot Pyrolyzer Technical Note, PYA For example, since peak B is the result of overlapping of ions m/z=57 and m/z=69, it is judged that saturated hydrocarbon and butyl methacrylate have been generated. However, because such ions can be produced from other compounds, further analysis is required. For this purpose, EGA-GC/MS is used, in which evolved gas components from each temperature region are introduced into a GC/MS and analyzed. (See Double-Shot Pyrolyzer Technical Note, PYA1-012E) D TIC A B C Phthalate ester m/z=149 Saturated hydrocarbon m/z=57 Butyl methacrylate m/z=69 Styrene m/z= ºC Fig. 1 EGA Curve of Ceramic Composite Material and Mass Chromatograms of Characteristic Ions See Double-Shot Pyrolyzer Technical Note, PYA1-010E for analytical conditions. Keyword : Evolved Gas Analysis, Mass Chromatogram, Ceramic Composite Material Application : General Polymer Analysis : Registered trademark of
48 Double-Shot Pyrolyzer Application Note (PYA1-012E) Analysis of Ceramic Composite Materials with Double-Shot Pyrolyzer and Peripheral Devices Part 3 : Analysis by Heart cutting EGA-GC/MS Technique In cases where multiple peaks are observed on an evolved gas analysis (EGA) curve, EGA-GC/MS technique is most useful to determine the origin of each peak. In this technique, a Selective Sampler and Microjet CryoTrap (MJT-1030E) are used. Species generated in each temperature region are selectively introduced into a separation column, and trapped. This is followed by GC/MS analysis. Since four peaks (A through D) were observed on the EGA curve of the ceramic composite material described in Double-Shot Pyrolyzer Technical Note PYA1-010E, evolved gases produced in each of four temperature regions were introduced into a GC in programmed heating mode. This gave chromatograms shown in Fig. 2. It was found that peak A was due to dibutyl phthalate (DBP); peak B, butyl methacrylates (iso-bma, n-bma), i.e. a thermal decomposition product of polybutylmethacrylate and C 25 ~C 40 saturated hydrocarbon; peak C, iso-bma and n-bma; peak D, styrene monomer (S), dimer (SS), and trimer (SSS), i.e. thermal decomposition products of polystyrene. As shown in this example, further analysis can be made by GC/MS analysis of each temperature region of EGA curve. D A B C Fig. 1 EGA Curve of a Material Used for Injection Molding (See Double-Shot Pyrolyzer Technical Note PYA1-010E for analytical conditions.) 500 DBP A B iso-bma n-bma Wax (C25 ~ C40) C S D SS SSS min Fig. 2 Chromatograms of Evolved Gas Composition from Each Temperature Region Pyrolysis furnace temp : 100ºC~500ºC (20ºC/min), Column head pressure : 140kPa, Split ratio : 1/50 Separation column : Ultra ALLY + -5 (5% diphenylpolysiloxane), Length : 30m, 0.25mm id, Film thickness : 0.25µm GC oven temp : 40ºC~320ºC ( 10ºC/min), Sample : 300µg, Detector : MS (m/z=29-400, 2 scans/sec) Keyword : Selective Sampler, Microjet Cryo-Trap, Ceramic Composite Material, EGA, EGA-GC/MS Application : General Polymer Analysis Excerpt from A. Hosaka, K. Sato, C. Watanabe, H. htani, S. Tsuge, J. Mass Spectrom. Soc. Jpn., 46, 332 (1998) : Registered trademark of 363 Vintage Park Drive
49 Double-Shot Pyrolyzer Application Note (PYA1-013E) Composition Analysis of Adhesives Using Double-Shot Pyrolyzer and Peripheral Devices Part 1: EGA and Library Search with EGA-MS LIB The EGA-MS library search is a combination of Evolved Gas Analysis, a thermal analysis technique using Double-Shot Pyrolyzer, and mass spectrometry; and is very useful as a primary searching technique for unknowns. An example shown below is analysis of an adhesive with unknown composition. Shown in Fig. 1 are the EGA curve of the adhesive and averaged spectra obtained from regions A, B, and C with the background (BG) subtracted. Peak A was considered to arise from a low boiling component by its elution temperature, and was found to be a compound shown in Fig. A by a normal MS library search (Wiley275). Wiley275 library search was also performed on peak B, which was found mainly to be of acetic acid which could be produced by scission of the polymer side chain. Table 1 shows library search results by EGA-MS LIB performed on peak C, and various vinyl polymers were found. Because peak B contains acetic acid, the material should contain vinyl acetate. As shown in this example, EGA-MS technique and library search with EGA-MS LIB are extremely useful as a primary library search technique for determination of composition of unknown samples. See Double-Shot Pyrolyzer Tech Note PYA1-014E for the analysis of regions A~C by EGA-GC/MS technique. Table 1: Library Search Result of Peak C Fig. A Name Qual. 1. Poly (vinyl chloride) ; PVC : Poly (vinyl acetate) ; PVAc : Poly (vinyl alcohol) ; PVA : H m/z m/z m/z A B BG of peak A BG of peak B ºC Fig. 1 EGA Curve of the Adhesive Pyrolysis temp.: 100ºC~600ºC (20ºC/min), Carrier gas : He 50kPa, Split ration : ca. 1/50 EGA capillary tube : 0.15mm id, 2.5m (UADTM-2.5N), GC oven temp.: 300ºC Injection temp.: 320ºC, Amt. of sample : ca. 1.0mg, Detector : MS (m/z=29-400, 0.1scan/sec PY-GC interface temp.: 320ºC (AUT mode) Keyword : Adhesive, Evolved Gas Analysis, Library, Search Applications : General Polymer Analysis, Adhesive Industry C : Registered trademark of
50 Double-Shot Pyrolyzer Application Note (PYA1-014E) Composition Analysis of Adhesives Using Double-Shot Pyrolyzer and Peripheral Devices Part 2: Analysis by EGA-GC/MS Technique If more than one peak are observed in an evolved gas (EGA) curve, EGA-GC/MS is a useful technique to determine the composition of each peak observed. In this technique, components in each temperature region are introduced into a GC column and temporary trapped at the front of the column using Selective Sampler (SS-1010E) and MicroJet Cryo-Trap (MJT-1030E). They are then separated by GC and finally identified with MS. In the EGA curve of an adhesive described in Double-Shot Pyrolyzer Application Note PYA1-013E, three peaks, A, B, and C are observed (see Fig. 1). Fig. 2 shows chromatograms of three temperature regions obtained by GC analysis of each temperature region. Peak A was found to contain a phthalate ester, while peak B was found to contain acetic acid, butyl acetate, and butyl acrylate. Acetic acid is considered to arise from polyvinyl acetate (PVAc), and butyl acrylate from thermal decomposition of polybutyl acrylate. Peak C contained a variety of aromatic compounds derived from thermal decomposition of polyene structure of the polymer backbone. As demonstrated in this example, detailed analysis of polymers can be achieved by GC/MS analysis of each temperature regions of an EGA curve using a capillary column. A B C ºC Fig. 1 EGA Curve of an Adhesive See Double-Shot Pyrolyzer Application Note PYA1-013E for analytical conditions A H H B C min Fig. 2 Chromatograms of Each Temperature Region of Evolved Gas Curve Pyrolysis temp.: 40ºC~600ºC (20ºC/min), Column flow rate : 1ml/min (fixed flow rate), Split ratio : 1/50 Separation column : Ultra ALLY + -5 (5% diphenyl polysiloxane), 30m, 0.25mm id, Film thickness 0.25µm GC oven temp.: 40ºC~320ºC (20ºC/min), Sample : 0.8mg, Detector : MS (m/z=29-400, 2scans/sec) Keyword : Adhesive, Selective Sampler, MicroJet Cryo Trap, EGA, EGA-GC/MS Applications : General Polymer Analysis, Adhesive Industry : Registered trademark of
51 Double-Shot Pyrolyzer Application Note (PYA1-015E) Analysis of Compounded Rubber by Double-Shot Technique Fig. 1 shows an evolved gas curve of a compounded rubber. Weak peaks are observed in 100~300ºC region due to the thermal desorption of various additives. In 300~500ºC region, a broad peak due to thermal decomposition of the rubber is observed. From this result on hand, thermal desorption, the first stage of doubleshot analysis, was performed from 100 to 300ºC (20ºC/min), and flash pyrolysis, the second stage, was done at 550ºC. Fig. 2 shows results of analysis. In the chromatogram of thermal desorption shown in Fig. 2a, cyclic siloxanes (D3~D6) originated from silicon coupling agent, benzothiazole (vulcanization accelerator), higher aliphatic acid (vulcanizing agent), and waxes (antioxidants, marked with *) were observed. Because isoprene and limonene were mainly observed in the pyrogram shown in Fig. 2b, the major component of this sample is natural rubber; further, it contains butadiene rubber since a small amount of butadiene was also observed. Polymer main chain Volatile components ºC Fig. 1 Evolved Gas Curve of a Compounded Rubber Pyrolysis temp.: 100~700ºC (20ºC/min), Carrier gas : He 50kPa, Split ratio : ca. 1/20 EGA capillary tube : 0.15mm id, 2.5m (UADTM-2.5N), GC oven temp.: 300ºC Injection temp.: 320ºC, Sample : ca. 5µg, Detector : MS (m/z=29-400) Fig.2a. Thermal Desorption Chromatogram (100~300ºC (20ºC/min) 2-mercapto thiobenzothiazole C 16 acid 2-methyl thiobenzothiazole X10 D 3 D 4 D 5 D 6 Nocrac 6C DP * * * * * * * n-c 30 H 62 n-c 31 H 64 * * Fig.2b. Pyrogram (550ºC ) butadiene isoprene dimer (limonene) trimer tetramer min Fig. 2 GC/MS Analysis of Compounded Rubber by Double-Shot Technique Column flow rate : 1ml/min (fixed flow rate), Split ratio : 1/20 Separation column : Ultra ALLY + -5 (5% diphenyl polysiloxane), 30m, 0.25mm id, Film thickness : 0.25µm GC oven temp.: 40~300ºC (20ºC/min), Sample : 5µg, Detector : MS (m/z=29-400, 2scans/sec) Keyword : Double-Shot Technique, Rubber, Coupling Agent, Vulcanizing Agent, Antioxidant Applications : General Polymer Analysis : Registered trademark of
52 Double-Shot Pyrolyzer Application Note (PYA1-016E) Analysis of Thermoset Resin Using Double-Shot Pyrolyzer and Peripheral Devices Part 1 : Evolved Gas Analysis (EGA) and Library Search with EGA-MS LIB The EGA-MS library search is a combination of Evolved Gas Analysis, a thermal analysis technique using Double-Shot Pyrolyzer, and mass spectrometry; and is very useful as a primary search technique for unknowns. Described below is an analysis example of a thermoset resin. Fig. 1 shows the EGA curve of the thermoset resin and averaged spectra obtained from regions A, B, and C. The result of library search on these spectra using EGA-MS LIB is shown in Table 1. Cresol and phenol resins were found in region B, and a cresol resin was found in region C with high quality. Because of low elution temperature of region A, therefore low boiling species, a library search was done using Wiley275, a commonly used MS library and Triphenylphosphineoxide, a reaction catalyst, was found. As described here, EGA-MS technique and library search using EGA-MS LIB are extremely useful for composition analysis of unknown polymer materials as a primary search method. Triphenylphosphineoxide Table 1 EGA-MS Library Search for Regions B and C Region B Name Ref No. Qual 1. Cresol formaldehyde resin (Novolak) # Cresol formaldehyde resin (Novolak) # Phenol formaldehyde resin (Novolak) : PF # Region C Name Ref No. Qual 1. Cresol formaldehyde resin (Novolak) # Poly-m-phenyleneisophthalamide # Poly(phenylene oxide) : PP # P m/z m/z m/z B A C 100 Keyword : Thermoset Resin, Evolved Gas Analysis, EGA-MS Library, Reaction Catalyst Applications : General Polymer Analysis ºC Fig. 1 EGA Curve of a Flame Retardant Resin Furnace temp: 100~600ºC (20ºC/min), Carrier gas : He 50kPa, Split ratio : ca. 1/50 EGA capillary tube : 0.15mm id, 2.5m (UADTM-2.5N), GC oven temp.: 300ºC Injection temp.: 320ºC, Sample : ca. 0.5mg, Detector : MS (m/z=10-400, 0.1Scans/sec) PY-GC interface temp.: 320ºC (AUT mode) : Registered trademark of
53 Double-Shot Pyrolyzer Application Note Analysis of Thermoset Resin Using Double-Shot Pyrolyzer and Peripheral Devices Part 2 : Analysis by EGA-GC/MS Technique (PYA1-017E) If more than one peak are observed in an evolved gas (EGA) curve, EGA-GC/MS is a useful technique to determine the composition of each peak observed. In this technique, components in each temperature region are introduced into a GC column and temporary trapped at the front of the column using Selective Sampler (SS- 1010E) and MicroJet Cryo-Trap (MJT-1030E). They are then separated by GC and finally analyzed by MS. Using this technique, analysis of components in each peak allows detailed characterization of polymers. Fig. 2 shows chromatograms of three temperature regions, A, B, and C observed in the EGA curve of a thermoset resin described in Double-Shot Pyrolyzer Technical Note PYA1-016E. Triphenylphosphineoxide, a reaction catalyst, was found in peak A, while various phenols, thermal decomposition products of phenol resin, and styrene monomer, thermal decomposition product from polystyrene, were found in peaks B and C. As shown here, analysis of each temperature region of an EGA Curve offers detailed information on polymers. A B C ºC Fig. 1 EGA Curve of a Flame Retardant Resin See Double-Shot Pyrolyzer Technical Note PYA1-016E for analytical conditions P A benzene toluene phenol styrene o-cresol p-cresol 2,6-dimethyl phenol 2,4-dimethyl phenol 2,4,6-trimethyl phenol dimer trimer B C min Keyword : Thermoset Resin, EGA-GC/MS, EGA, Selective Sampler, MiroJet Cryo-Trap Applications : General Polymer Analysis Fig. 2 Chromatogram of Each Temperature Region of EGA Curve Separation column : Ultra ALLY + -5 (5% diphenyl polysiloxane) 30m, 0.25mm id, Film thickness : 0.25µm Sample : 500µg, Detector : MS (m/z=10-400, 2scans/sec) : Registered trademark of
54 Double-Shot Pyrolyzer Application Note (PYA1-018E) Analysis of Printer Toner Using Double-Shot Pyrolyzer and Peripheral Devices Part 1 : Evolved Gas Analysis (EGA) and Library Search by EGA-MS LIB The EGA-MS library search is a combination of Evolved Gas Analysis, a thermal analysis technique using Double-Shot Pyrolyzer, and mass spectrometry is very useful as a primary searching technique for unknowns. As an example, analysis of printer toner is described below. Fig. 1 shows the EGA curve of a printer toner and the average spectra of temperature regions A, B, and C of the curve. Judging from the elution temperatures, regions A and B are originating from the desorption of low molecular weight compounds. Region C is considered arising from thermal decomposition of polymers. Hence, a library search using EGA-MS LIB was performed on the MS spectrum of region C (Table 1), and various styrene copolymers were found as plausible polymers. As shown here, the EGA- MS and the library search by EGA-MS Table 1 Results of EGA-MS Library Search of Region C LIB are very useful to determine the Ref No. Qual composition of unknown polymers as a 1. Methyl methacrylate-butadiene-styrene copolymer # primary searching method. Also see 2. Styrene-ethylene-butadiene-styrene-block copolymer # Double-Shot Pyrolyzer Application 3. Styrene-divinylbenzene copolymer # Note PYA1-019E for results of detailed analysis by GC/MS m/z m/z m/z B C A X ºC Fig. 1 EGA Curve of Printer Toner and Mass Spectra of Each Region Pyrolysis temp.: 100~600ºC (20ºC/min), Carrier gas : He 50kPa, Split ratio : ca. 1/50 EGA capillary tube : 0.15mm id, 2.5m, (UADTM-2.5N), GC oven temp.: 300ºC Injection temp.: 320ºC, Sample : 0.5mg, Detector : MS (m/z=50-400, 0.1Scans/sec) PY-GC interface temp.: 320ºC (AUT mode) Keyword : Toner, Polystyrene Compounds, Evolved Gas Analysis, EGA-MS Library Applications : General Polymer Analysis, Printing and Related Industries : Registered trademark of
55 Double-Shot Pyrolyzer Application Note Analysis of Printer Toner Using Double-Shot Pyrolyzer and Peripheral Devices Part 2 : Analysis by Heart Cut EGA-GC/MS Technique (PYA1-019E) If more than one peak are observed in an evolved gas (EGA) curve, EGA-GC/MS is a useful technique to determine the composition of each peak observed. In this technique, components in each temperature region are introduced into a GC column and temporary trapped at the front of the column using Selective Sampler (SS- 1010E) and MicroJet Cryo-Trap (MJT-1030E). They are then separated by GC and finally analyzed by MS. Using this technique, analysis of components in each peak allows detailed characterization of polymers. Fig. 2 shows chromatograms of evolved gases in regions A, B, and C of the EGA curve of a printer toner (Fig. 1) described in Double-Shot Pyrolyzer Application Note PYA1-018E. 1.0mg each of sample from regions A and B was used for analysis because of low intensities, while 0.5mg from region C was used. A variety of nitrile compounds were found in region A, and region B contained methyl methacrylate (MMA) in addition to various aromatics (marked by *) such as styrene (S), styrene dimer (SS), and styrene trimer (SSS). Thermal decomposition products of styrene-methyl methacrylate copolymer were detected in region C. (B) (C) (A) X ºC Fig.1 Heart Cutting region of EGA Curve of a Printer Toner N N N N N N (A) (B) MMA S SS SSS S (C) MMA SS SSS min Fig. 2 Chromatograms of Each Temperature Regions of Evolved Gas Curve Pyrolysis temp.:100~600ºc (20ºC/min), Split ration : 1/50 Separation column : Ultra ALLY + -5 (5% diphenyl polysiloxane), 30m, 0.25mm id, Film thickness 0.25µm GC temp.: 40~320ºC (2min, 20ºC/min), sample : (A),(B) 1.0mg, (C) 0.5mg, Detector : MS (m/z=29-400, 2scans/sec) Keyword : Toner, Selective Sampler, MicroJet Cryo-Trap, EGA, EGA-GC/MS, styrene Applications : General Polymer Analysis, Printing and Related Industries : Registered trademark of
56 Frontier-Lab Technical Note (PYA1-020E) Characterization of Polysiloxanes by (Py-GC/MS) [Background] Polysiloxanes have been widely used in industry. The physical and chemical properties depend on the structure and composition of pendent and end groups. It is therefore important to establish the structureproperty relationship of polysiloxanes. High resolution PyGC-MS, one of the most powerful technique for structure and thermal degradation studies, was used for this study. [Experimental] Several polysiloxane samples were used (some are listed in Table 4.). A vertical micro-furnacetype pyrolyzer was directly attached to a GC with an FID detector. 0.2mg each of polymer samples was pyrolyzed under nitrogen at 600 C. A fused-silica capillary column coated with immobilized poly(5%-phenyl)- methylsiloxane was used. The oven temperature was programmed from 0 C to 320 C at 5 C/min The peak identification was made using a directly coupled GC-MS with EI and CI sources. [Results]. Figure 1 shows the pyrograms of a polysiloxane sample utilized. Table 1 summarizes the compositions of various siloxane copolymers determined from the pyrograms along with the reference nominal ones. The estimated compositions are in fairly good agreement with the nominal values. These results suggest that the composition of a siloxane copolymer can be accurately determined by high-resolution PyGC under the given experimental conditions. Table 1 Nominal and estimated composition of siloxane copolymer Sample Nominal Composition mol% Estimated Composition mol% V-3 DM:MP = 80:20 DM:MP = 82.5:17.5 V-7 DM:MP = 60:40 DM:MP = 61.8:38.2 V-11 DM:MP = 30:70 DM:MP = 31.1:68.9 V-25 MP:DP = 50:50 MP:DP = 46.5:52.5 SE-52 DM:DP = 95: 5 DM:DP = 94.9: 5.1 XE-60 DM:MC = 50:50 DM:MC = 45.3:54.7 * DM Dimethylsiloxane, MP Methylphenylsiloxane, DP Diphenylsiloxane, MC 2-Cyanoethylmethylsiloxane Figure 1. Typical pyrograms of dimethyl- and/or methylphenyl-substituted polysiloxanes. A Polydimethylsiloxane; B Poly(dimethyl-methylphenylsiloxane); C Poly(methylphenylsiloxane). Keyword : Polysiloxane, PyGC-MS, Characterization Applications : General polymer analysis Related technical notes : *Contents excerpted from S. Fujimoto, H. htani, S. Tsuge, Fresenius Z. Anal. Chem. 1988, 331, : Registered trademark of
57 Double-Shot Pyrolyzer Technical Note (No. PYA1-021E) Quantitative Analysis of Trace Amount of Butadiene Rubber in High Impact Polystyrene (HIPS) High impact polystyrene (HIPS) is a polystyrene (PS) copolymerized with a few percents of butadiene rubber in order to increase impact resistance of PS. Pyrolysis GC is used as a tool for quality control of HIPS. Quantitative analysis of a trace amount of butadiene present in HIPS is described here using Double-Shot Pyrolyzer. Fig. 1 shows a pyrogram of HIPS obtained at 550ºC. Butadiene (B) and styrene (S), monomer components of HIPS, have been detected. Table 1 shows peak area ratios of B and S (B/S) in the pyrograms obtained repeatedly. The excellent reproducibility of 0.62% was obtained. In the actual quantitative analysis, various mixing ratios of samples are used to produce a calibration curve. Table 1. Peak Area Ratios of Butadiene (B) and Styrene (S) and Reproducibility butadiene n Average RSD (%) B/S(%) toluene 4-vinylcyclohexene styrene min Fig. 1. Pyrogram of HIPS Pyrolysis temp: 550ºC, Split ratio: 1/50, GC oven temp: 40~320ºC at 20ºC/min) Separation column: Ultra ALLY + -5 (5% diphenylpolysiloxane), Length 30m, Id 0.25mm, Film thickness 0.25µm Sample amount : 100µg, Detector : Hydrogen flame detector (FID) Keyword : Impact Resistance, Polystyrene, Butadiene, Quantitative Analysis, Reproducibility Applications : Plastics and Rubber Industry, General Polymer Analysis : Registered trademark of
58 Double-Shot Pyrolyzer Technical Note (PYA1-022E) Analysis of Food Wrap Film Using Double-Shot Pyrolyzer Part 1 : Analysis with Evolved Gas Analysis (EGA) Table 1. Basic Polymers and Additives of Various Food Wrap Films Basic Polymer PVDC PVC PE PP+nylon Additives Fatty acids derivatives, Epoxidized vegetable oils Aliphatic esters, Epoxidized vegetable oils Calcic compounds, Silver antibiotics None Aliphatic hydrocarbon resins, Fatty acids derivatives Analysis of thermal properties of food wrap films is important in that food wrap films may directly contact foods at elevated temperatures and volatile components from films can elute off into foods, causing adverse effects to human body in prolonged exposures. Temperatures at which volatile materials evolve from various food wrap films were determined by the EGA technique employing Double-Shot Pyrolyzer. Wrap films made of Polyvinylidene chloride (PVDC), polyvinyl chloride (PVC), and polypropyrene+nylon (PP+nylon) were tested, and abroad peaks due to volatiles from the films were observed in 100 to 250ºC range. From the results elution temperatures of volatile components and their percentages against basic polymers were found. Also, mass spectra of volatiles can give insights into the chemical structures of the materials. Volatile components Thermal decomposition of PVDC PVDC Volatile components PVC Elimination of HCl by thermal degradation of PVC Thermal decomposition of PE TIC Thermal degradation of polyenes derived from elimination of PVC PE Volatile components Thermal decomposition of PP and nylon PP+nylon Keyword : Food wrap films, Volatile components, Evolved Gas Analysis (EGA) Applications : Film manufacturing, General polymer analysis Fig. 1. EGA Curves of Various Food Wrap Films Pyrolysis furnace temp: 40~600ºC (20ºC /min), Carrier gas : He 50kPa, Split ratio: ca.1/50 EGA capillary tube: id 0.15mm, Length 2.5m (UADTM-25N), GC oven temp.: 300ºC Injection port temp: 320ºC, Sample size: 0.25cm 2, MS scan range : m/z=29~400, Scan rate : 0.1scan/sec : Registered trademark of 363 Vintage Park Drive
59 Double-Shot Pyrolyzer Technical Note (PYA1-023E) Analysis of Food Wrap Films Using Double-Shot Pyrolyzer Part 2: Analysis of Polyvinylidene chrolide (PVDC) by EGA Heart-Cut GC/MS Technique Polyvinylidene chloride food wrap films were analyzed using EGA-GC/MS technique. Fig. 1 shows an EGA profile obtained by programmed pyrolysis from 40ºC~600ºC at 20ºC/min, while Fig. 2 shows results of GC/MS analysis of temperature zones A (40~200ºC), B (200~240ºC), and C (240~500ºC) employing MicroJet Cryo-Trap (MJT-1030E). In Zone A, butanol, tributyl aconitate, and tributyl acetylcitrate (CITRFLEX A-4), a plasticizer, as low boiling components were found. In Zone B, tributyl acetylcitrate, tributyl aconitate, and HCl, which had been arisen from elimination of hydrogen chloride from polyvinylidene chloride, were found. Also found in low volatile Zone C were, in addition to HCl, aromatics and chlorine containing aromatics such as dichlorobenzene derived from the polyene structure. Zone A Zone B Zone C (40~200ºC) (200~240ºC) (240~500ºC) Fig. 1 EGA Profile of Polyvinylidene Chloride Pyrolysis temp: 40~600ºC (30ºC/min), carrier gas: He Interface: deactivated metal capillary column (length: 2.5m, id: 0.15mm) Injection port pressure: 50kPa ºC Zone A (40~200ºC) acetic acid butanol tributyl aconitate tributyl acetylcitrate CITRFLEX A-4 Zone B (200~240ºC) HCL Zone C (240~500ºC) chlorobenzene dichlorobenzene benzene trichlorobenzene min Fig. 2 Analysis Results of Zones A, B, and C of Polyvinylidene Chloride Carrier gas: He, column flow rate: 1ml/min, Split injection, separation column: Ultra ALLY-5 (5% diphenyl dimethyl polysiloxane), length: 30m, id: 0.25mm, film thickness: 0.25µm, GC oven temp: 40ºC (1min hold) ~ 320ºC (20ºC/min), injection port temp: 320ºC, Cryo trap temp: -196ºC, sample: 0.25cm 2 Reference: Hosaka et.al., 49th Japan Analytical Society Meeting (2000) Keyword : Food Wrap Film, Evolved Gas, Plasticizer Applications : Film manufacturer, Food producer, General polymer analysis : Registered trademark of
60 Double-Shot Pyrolyzer Technical Note (PYA1-024E) Analysis of Food Wrap Films Using Double-Shot Pyrolyzer Part 3: Analysis of Polypropylene (PP) + Nylon by EGA GC/MS Technique Polypropylene (PP) + Nylon food wrap films were analyzed using EGA-GC/MS technique. Fig. 1 shows an EGA profile obtained by programmed pyrolysis from 40ºC~600ºC at 30ºC/min. Fig. 2 shows results of GC/MS analysis of temperature zones A (100~320ºC), and B (200~600ºC) employing MicroJet Cryo-Trap (MJT-1030E). In Zone A, volatile acetic acid, and fatty acids and their derivatives as plasticizer were found. In Zone B, olefinic hydrocarbons of C 6,C 9,C 12, and C 15 derived from pyrolysis of polypropylene, and ε-caprolactam, monomer of nylon-6, were found. Zone A Zone B Fig. 1 EGA Profile of Polypropylene + Nylon Pyrolysis temp: 40~600ºC (30ºC/min), carrier gas: He Interface: deactivated metal capillary column (length: 2.5m, id: 0.15mm) Injection port pressure: 50kPa ºC Zone A (100~320ºC ) acetic acid ε-caprolactam :fatty acid ester Zone B (320~600ºC) n-c min Fig. 2 Analysis Results of Zones A, B, and C of Polypropylene + Nylon Carrier gas: He, column flow rate: 1ml/min, total carrier gas flow rate: 40ml/min, separation column: Ultra ALLY-5 (5% diphenyl dimethyl polysiloxane), length: 30m, id: 0.25mm, film thickness: 0.25µm, GC oven temp: 40ºC (1min hold) ~ 320ºC (20ºC/min), injection port temp: 320ºC, Cryo trap temp: -196ºC, sample: 0.25cm 2 Keyword : Food Wrap Film, Evolved Gas, Plasticizer Applications : Film manufacturer, Food producer, General polymer analysis Reference: Hosaka et.al., 49th Japan Analytical Society Meeting (2000) : Registered trademark of
61 Double-Shot Pyrolyzer Technical Note (PYA1-025E) Analysis of Food Wrap Films Using Double-Shot Pyrolyzer Part 4: Analysis of Evolved Gases Components at 100ºC Analysis of food wrap films for the evolved gases at high use temperature is important for safety reasons. Using Double-Shot Pyrolyzer, evolved gases from various food wrap films that were exposed to 100ºC for 10min were analyzed. Table 1 shows basic polymers of the food wrap films analyzed and organic additives labeled on the package. Fig. 1 shows chromatograms obtained by GC/MS analysis of evolved gases collected with MicroJet Cryo Trap. Upon quantitative analysis, it was found that levels of each component was 100ppm or less. Table 1 Additives of Food Wrap Films Basic polymer rganic additives labeled on the package PVDC Fatty acid derivatives, Epoxidized vegetable oil PVC Chlorinated fatty acid esters, Epoxidized vegetable oil PE None PP+Nylon lefinic hydrocarbons, fatty acid derivatives tributyl aconitate tributyl acetylcitrate PVDC PVC triethylene glycol H H fatty acid ester adipic acid ester n- C 14 PE n- C 12 n- C 16 PP+Nylon acetic acid caprolactam triacetin fatty acid ester min Fig. 1 Chromatograms of Evolved Gases from Food Wrap Films Exposed to 100ºC for 10min PY: double-shot Pyrolyzer (PT-2020D), Furnace temp: 100ºC, Carrier gas: He, column flow rate: 1.0ml/min, carrier gas total flow rate: 60ml/min,Cryo trap: 10min, separation column: Ultra ALLY + -5 (5% diphenyl dimethyl polysiloxane), length: 30m, id: 0.25mm, film thickness: 0.25µm, GC oven temp: 40ºC~ 320ºC (20ºC/min), GC injection port temp: 320ºC, sample: 9cm 2, MS scan rage: m/z=29~400, scan rate: 2 scans/sec Keyword : Food Wrap Film, Evolved Gas, Plasticizer Applications : Film manufacturer, Food producer, General polymer analysis : Registered trademark of
62 Double-Shot Pyrolyzer Technical Note (PYA1-026E) Analysis of Additives in Polybutylene Terephthalate (PBT) For electronic applications, polyolefin modifier is often added to Polybutylene terephthalate (PBT) resin to improve hydrolysis and thermal shock resistances. It is of importance to analyze additives in PBT resin in order to ascertain its performance. Here, a new analysis technique, which is a combination of Double-Shot and reactive pyrolysis, is described. In the first step, a pyrogram was obtained by reactive pyrolysis of PBT at 400ºC in the presence of tetra-methyl ammonium hydroxide (TMAH) (Fig. 1). In the second step, a pyrogram was obtained by instant pyrolysis of residual polyolefin modifiers at 550ºC (Fig. 2). A methyl derivative of terephthalic acid, a constituent monomer of PBT, was observed in the first step; and sets of 3 peaks for straight chain hydrocarbons of diolefins, olefins, and paraffin were observed in the second step. These results demonstrated that polyolefin additives in the PBT resin could be separated and identified using this technique. 1,4-Dimethoxybutane H 3 C CH 3 1-Butyleneglycolmonomethyl ether H 3 C H THF Dimethyl terephtalate H C C 3 2 C 2 CH 3 First step Reactive pyrolysis temp: 400ºC Sample size: 0.1mg Reagent: 2µL of 25% methanol solution of TMAH min. Fig. 1 Pyrogram btained by Reactive Pyrolysis of PBT lefin chains Second step Pyrolysis temp: 550ºC min. Fig. 2 Pyrogram of Residue (550ºC) Analytical conditions: carrier gas: He, Injection port pressure: 103kPa, Split ratio: 1/60, Separation column: Ultra ALLY + -5 (5% diphenyldimethylpolysiloxane) Length: 30m, Id: 0.25mm, Film thickness: 0.25µm, GC oven temp: 38ºC~300ºC(20ºC/min), GC injection port temp: 320ºC Material excerpted from 5. A few recent applications of Py-GC, Kiura, Wakabayashi (Mitsubishi Rayon), 2nd Pyrolysis Gas Chromatography (hosted by Frontier Lab Ltd.) Keyword: Polybutylene terephthalate, PBT, Additive, Modifier Applications: General Polymer Analysis : Registered trademark of
63 Frontier-Lab Technical Note (PYA1-030E) Py-GC/MS Analysis of Crude Drug Propolis From Different Areas [Background] Composition and activity of crude drug propolis vary depending on factors such as species, collecting time, production area, and individual species. Flash pyrolysis (Py)-GC/MS technique was employed here to analyze propolis from two different producing areas, and the compositions were compared. [Experimental] Py-GC/MS technique was used to obtain pyrograms of two propolis samples obtained from different areas. [Results] Fig. 1 shows pyrograms of two different samples of propolis. Phenols, aromatic acids, sesquiterpenes, ethyl esters of C16-C18 aliphatic acids, and various flavonoids were observed in the pyrograms. The peak distributions for aromatic acids and phenols derived from these two kinds of propolis showed a similarity, while the peak distributions for ethyl esters of C16- C18 aliphatic acids and flavonoids showed a large difference. Aromatics and phenols Flavonoids H Sample 1 H H Sesquiterpenes Ethyl esters of C16-C18 acids C16:0 C18:2 Sample min Fig 1. TIC pyrograms of two different propolis samples Double-Shot Pyrolyzer : PY-2020iD, Pyrolysis temperature: 550ºC, Column head pressure : 50kPa, Split ratio : 1/50 Separation column : Ultra ALLY+-5(5% diphenyl 95% dimethylpolysiloxane), L=30 m, id=0.25 mm, DF=0.25 µm GC oven temperature: 40ºC~300ºC (10ºC/min), Sample size : 300 µg, Detector : MS (m/z:29-550, 2 scans/sec) Keywords : Crude drug (galenical), Propolis, Py-GC/MS, Simple and quick identification analysis Applications : General crude drug analysis Related Technical Notes : PYA1-031E, PYA1-032E : Registered trademark of
64 Frontier-Lab Technical Note (PYA1-031E) Heart-cut EGA-GC/MS Analysis of Crude Drug Propolis from Different Areas [Background] The compositions and activities of crude drugs depend on various factors such as species, harvest time, producing area, and individual species. Here, evolved gas analysis (EGA-MS) and heart-cut EGA-GC/MS techniques were employed to determine the compositions of propolis harvested from two different areas, and the results were compared. [Experimental] Selective sampler and Micro-Jet cryo trap were used to heart-cut zones that showed difference between the two EGA thermograms obtained from two propolis samples, and each zone was analyzed by GC/MS. [Results] Fig. 1 shows EGA thermograms for the two propolis samples. Zone A (temperature range from 50 to 180ºC) showed a definite difference in the thermogram profile and average mass spectra. Zone A was heart-cut and analyzed by GC/MS. The results are shown in Fig. 2. It is found that there are discernible differences in peak intensity between the two samples in the region of low boiling essential oils, which represent antibiotics, and free volatile flavonoids. Average MS spectrum of Zone Sample Zone A Sample 1 Sample m/z Sample m/z ºC Fig. Thermograms of two different propolis Essential oils Sesquiterpenes CH 3 CH 2 H Sample 1 CH 3 CH H 例 ) H Fravonoids 例 ) H H Sample 2 10 Fig. 2 Chromatograms of Zone A of EGA thermograms for 2 different propolis min Pyrolysis temperature.: 50~700ºC (20ºC/min), Column head pressure : 50 kpa, Split ratio : 1/50. Separation column : Ultra ALLY + -5 (5 % diphenyl 95 % dimethylpolysiloxane), id 0.25 mm, L= 2.5 m, GC oven temperature.: ºC(10ºC/min), Sample size : 300 µg, Detector : MS (m/z=29~550, 0.2 scans/sec Keywords : Crude drug (galenical), Propolis, Evolved gas analysis, Heart-cut EGA Applications : General crude drug analysis Related technical notes : PYA1-030E, PYA1-032E : Registered trademark of
65 Frontier-Lab Technical Note (PYA1-032E) Heart Cut-EGA GC/MS Analysis of Evolved Gases From Crude Drug Propolis [Background] Composition and activity of crude drugs depend on various factors including species, producing area, harvest time, individual species, etc. A simple analysis technique that can determine subtle differences of compositions is desired. Here, the evolved gas analysis (EGA) was used to obtain a thermogram, in which multiple temperature zones were heart-cut and each zone was separated by a separation column, followed by GC/MS analysis. [Experimental] By using the Selective Sampler and MicroJet Cryo Trap, multiple temperature zones of the thermogram were heat-cut and each zone was analyzed by GC/MS equipped with a separation column. [Results] Fig. 1 shows the thermogram for propolis which is comprised of three Zones, A through C. Fig. 2 shows the analysis result of each zone obtained by the heart cut GC/MS. Zone A contained volatiles such as acetic acid and essential oils, while Zone B contained free phenols, and aromatic acids, in addition to various flavonoids, representatives of antibiotics. In Zone C, flavonoids and aromatic products presumably generated by decomposition of flavonoids were observed. Zone A Zone B Zone C Fig. 1 Thermogram of propolis ºC Zone A CH 3 CH H H CH Essential oils Sesquiterpenes e.g. H CH Ethyl esters of aliphatic acids C16:0 C18:2 Flavonoids e.g. H H Zone B H H CH CH H H 3C CH 3 CH 3 Zone C Fig. 2 Heart cut GC/MS chromatograms of Zones A, B, and C of Thermogram shown in Fig. 1 Pyrolysis temperature: 50~700ºC (20ºC/min), Column head pressure : 50 kpa, Split ratio : 1/50, Separation column : Ultra ALLY + -5 (5 % diphenyl 95 % dimethylsiloxane), L=30 m, Id 0.25 mm, DF= 0.25 µm, GC oven temperature: 40ºC~300ºC (10ºC/min), Sample size : 300 µg, Detector : MS (m/z=29~550, 2 scans/sec) Keywords : Crude drug (galenical), Propolis, Evolved gas analysis, Heart cut EGA-GC/MS Applications : General crude drug analysis Related technical notes : PYA1-030E, PYA1-031E min : Registered trademark of
66 Frontier-Lab Technical Note (PYA1-034E) Studies on Curing Process of Epoxy Resins by Py-GC - Cured with 1-Benzyl-2-Methyl Imidazole (1B2MZ) - [Background] Curing process of epoxy resins has been often studied by IR, FT-IR, or NMR by looking at the spectral changes of chemical species formed during the course of curing process. DSC has also been used to study the curing reactions by evaluating the heat of reaction. n the other hand, high resolution Py-GC is another technique that can be applied for studying systems with insoluble species and various additives. [Experimental] A pyrolyzer with a vertical micro-furnace was directly attached to a GC equipped with a high resolution capillary column (0.2mm id, 24m long) coated with methyl phenylsilicone. Samples of a diglycidyl ether of bis-phenol A (DGEBA, Mn 340) prepolymer with various amounts of 1B2MZ were cured at 180 C for 3 hours and were analyzed by Py-GC at 590 C. [Results]. Figure 1 shows typical pyrograms of DGEBA cured with various amounts of 1B2MZ at 180 C for 3 hrs. Relationships between intensities of observed peaks and the amounts of catalysts added are shown in Figure 2. It was found that the yields of the pyrolyzates with epoxide groups decreased with increase of the degree of cure, while those of various phenols, characteristic of prepolymer skeleton increased. The results observed corresponded well to the those deduced from Tg measurements by DSC. Figure 1. High-resolution pyrograms of epoxy resins cured with various amounts of imidazole catalyst at 180 C for 3h. Keyword : Py-GC, Epoxy Resin, Curing Process Applications : General polymer analysis Related technical notes : Figure 2. Changes of characteristic products from epoxy resins as a function of catalyst amount. *Contents excerpted from H. Nakagawa, S. Wakatsuka, S. Tsuge, T. Koyama, Polymer. J. No. 1, pp : Registered trademark of
67 Frontier-Lab Technical Note (PYA1-035E) Studies on Curing Process of Epoxy Resins by Py-GC - Cured with Hexahydrophthalic Acid Anhydride (HHPA) - [Background] Curing process of epoxy resins has been often studied by IR, FT-IR, or NMR by looking at the spectral changes of chemical species formed during the course of curing process. DSC has also been used to study the curing reactions by evaluating the heat of reaction. n the other hand, high resolution Py-GC is another technique that can be applied for studying systems with insoluble species and various additives. [Experimental] A pyrolyzer with a vertical micro-furnace was directly attached to a GC equipped with a high resolution capillary column (0.2mm id, 24m long) coated with methyl phenylsilicone. Diglycidyl ether of bisphenol A (DGEBA, Mn 340) prepolymer and HHPA cured at 100 C for various cure-times were analyzed by Py- GC at 590 C. [Results]. Figure 1 shows typical pyrograms of DGEBA cured with HHPA at 100 C for various cure-times. Relationships between the peak intensities of pyrolyzates and cure-time are shown in Figure 2. It was observed that the yields of the pyrolyzates with epoxide groups decreased with increase of the degree of cure, while those of various phenols, characteristic of prepolymer skeleton increased. The results observed corresponded well to the those deduced from Tg measurements by DSC. Figure 1. High-resolution pyrograms of epoxy resins cured with HHPA at 100 C for various cure-time Keyword : Py-GC, Epoxy Resin, Curing Process Applications : General polymer analysis Related technical notes : Figure 2. Changes of characteristic products from epoxy resin as a function of cure-time *Contents excerpted from H. Nakagawa, S. Wakatsuka, S. Tsuge, T. Koyama, Polymer. J. No. 1, pp 9-16,1992 : Registered trademark of
68 Frontier-Lab Technical Note (PYA1-036E) Characterization of Polymerization Reagents Incorporated into Poly(methyl methacrylate) Chains by Py-GC [Background] In radical polymerization, the fragments of initiators are incorporated into the resulting polymer chains as end groups. The end groups formed sometimes greatly affect the properties of the polymers. However, the characterization of polymerization reagents incorporated into polymers is not easy because of the low concentrations. Pyrolysis-gas chromatography (PyGC) is a simple, but extremely sensitive technique which often provides unique structural information to that obtained by spectroscopic methods. [Experimental] PMMA samples were prepared both with and without polymerization reagents. A vertical microfurnace pyrolyzer maintained at 460 C was directly attached to a GC with an FID or a flame photometric detector (FPD). A fused silica capillary column coated with polydimethylsiloxane was used. Identification of peaks on the pyrograms was done using a GC-MS with both EI and CI sources to which the pyrolyzer was directly attached. [Results] Figure 1 shows the pyrograms of samples prepared both (a) in the presence and (b) in the absence of polymerization reagents at 460 C. Since PMMA tends to depolymerize mostly into the original monomer at elevated temperatures around 500 C, the main pyrolysis product on the pyrograms (>90%) was the MMA monomer. The peak assignments are summarized in Table 1 along with their molecular weights and estimated structures obtained by PyGC-MS. As noted, peaks A through I are not observed on the pyrogram (b). Therefore, they can be assigned to the fragments of the polymerization reagents incorporated into the polymer chain. Figure 1. of paper here Figure 1. Pyrograms of poly(methyl methacrylate): (a) prepared in toluene Table 1 Peak assignment in the pyrograms of PMMA with 0.3% of benzoyl peroxide and 1.5% of dodecanethiol; and (b) thermally estimated by PyGC-MS polymerized in bulk without any polymerization reagent. *Contents excerpted from H. htani, S. Ishiguo, M. Tanaka, S. Tsuge, Polym. J. 1989, 21, Keyword : Pyrolysis, PyGC-MS, PMMA, Polymerization Reagent Applications : General polymer analysis Related technical notes : : Registered trademark of
69 Frontier-Lab Technical Note (PYA1-037E) Structual Characterization of Hydrogenated Acrylonitrile-Butadiene Rubbers by Py-GC [Background] Acrylonitrile-butadiene rubbers (NBRs) have their high oil-resistant properties and are used in a variety of applications. However, NBRs have relatively low thermal stability due to the presence of double bonds from butadiene (BD). Hence, hydrogenation is required to improve the thermal stability. It is therefore important to characterize their microstructures and hydrogenation mechanism. [Experimental] Hydrogenated NBRs were prepared by dissolving NBR in THF followed by hydrogenation in the presence of Pd catalyst. The high-resolution Py-GC system had a vertical micro-furnace and was directly attached to a GC with an FID. About 70µg each of samples was pyrolyzed at 550 C under nitrogen carrier gas (50mL/min). The identifications of peaks were done by a directly coupled GC-MS with both EI and CI sources. [Results]. Figure 1 shows the pyrograms of NBR samples at 550 C before and after the hydrogenation that were obtained using a fused silica capillary column with poly(dimethylsiloxane) stationary phase. Characteristic peaks in the pyrogram of N-37(0) were butadiene (BD) monomer, BD dimer, and acrylonitrile (AN) monomer; whereas those of hydrogenated NBR consisted of a series of linear mononitriles (MN(A)s) up to C 12, each of which consisted of a doublet corresponding to an α-olefinic MN(A) (the former) and a saturated MN(A) (the latter). Another series of mononitrile positional isomers (MN(B)s) are also observed. HC peaks of each carbon number consisted of a triplet corresponding to to an α,ω-diolefine, and α-olefin, and a n-alkane. Figure 1. Pyrograms of NBRs before and after hydrogenation at 550 C separated by a poly(dimethylsiloxane) column: (a) N- 37(0); (b) N-37(44); (c) N-37(98). See Table 1 for abbreviations. Numbers indicate carbon numbers of compounds. Keyword : NBR, Py-GC, Hydrogenation, Pyrogram Applications : General polymer analysis Related technical notes : Table 1 Characteristic Degradation Products from Hydrogenated NBR compound class abbreviation sequence Butadiene BD B Butadienen dimer VC BB (4vinylcyclohexane) Acrylonitrile AN A Hydrocarbons HC EE EEE Mononitriles MN(A) EA EEEA MN(B) EA EEA MN(C) EAE MN(D) BA Dinitriles DN AEA B = 1,4-butadiene unit; A = acrylonitrile; E = hydrogenated 1,4-butadiene unit *Contents excerpted from A.Kondo, H. htani, Y. Kosugi, S. Tsuge, Y. Kubo, N. Asada, H. Inaki, A. Yoshioka, Macromolecules 1988, 21, : Registered trademark of
70 Frontier-Lab Technical Note (PYA1-038E) Studies on End Groups in Radically Polymerized Poly(methyl methacrylate) (PMMA) by Py-GC [Background] It is known that subtle differences of the chain ends of a polymer can cause significant changes in property of the polymer such as thermal stability and transparency. Also, the chain end information provides excellent clues for the polymerization mechanism. However, the identification and determination of of end groups is no easy task because of complexity and low concentration. In this work PyGC technique was used to characterize the end groups of PMMA samples which had been radically polymerized in toluene with BP. [Experimental] PMMA samples were prepared by a standard procedure. A vertical microfurnace pyrolyzer was directly attached to a GC with an FID. 0.5mg of the polymer sample was pyrolyzed at 460 C under nitrogen. A fused silica capillary column coated with polydimethylsiloxane was used for GC separation of pyrolyzates. Identification of peaks on the pyrograms was done using a GC-MS to which the pyrolyzer was directly attached. Figure 1. Pyrograms of PMMA samples at 460 C; (a) polymerized in toluene, (b) polymerized in benzene, and (c) polymerized without any initiator. Keyword : Pyrolysis, PyGC-MS, PMMA, Benzoyl peroxide, End group, Polymers Applications : General polymer analysis Related technical notes : [Results] Figures 1a, b and c show the pyrograms of PMMA samples polymerized with 0.3% of BP as the initiator in toluene, in benzene, and thermally polymerized without any reagents, respectively. Generally, the main pyrolysis product (>95%) is the MMA monomer formed through the depolymerization reaction. Among these, several peaks (A through F) on the pyrogram (a) are identified as the products having a phenyl ring, all of which are scarcely observed on the pyrogram (c). Also, peaks B (toluene), C (styrene) and F are exclusively observed in (a). Therefore, these three products should be derived mainly from the solvent fragments incorporated into the chain ends through the chain transfer to toluene. n the other hand, initiatorincorporating chain ends are divided into two groups be-cause the thermal dissociation of BP provides both benzoyloxy and phenyl radicals. Thus peaks E and G should be related to phenyl-initiated chain ends while peak D is related to benzoyloxyinitiated ones. *Contents excerpted from H. htani, M. Tanaka, S. Tsuge, J.Anal. Appl. Pyrolysis 15, , (1989) : Registered trademark of
71 Frontier-Lab Technical Note (PYA1-039E) Determination of short-chain branches in PVC by pyrolysis-hydrogenation-gc (Py-HGC) [Background] Morphology and physical properties of PVC are known to be dependent upon the kind and amount of shortchain branches (SCB) along the polymer backbone. Here, various hydrogenation catalysts were examined for Py-HGC and several calculation methods were tested for the observed pyrograms. Experimental conditions to obtain comparable values of the kind and the amount of branches estimated by 13 C NMR have been established. [Experimental] Nine PVC samples of various conversions were synthesized. They were reductively dehalogenated into PE skeletal structures using tri-n-butyltin hydride (Bu 3 SnH), giving methyl(c 1 ), ethyl(c 2 ), and butyl(c 4 )branches.thepy-hgc system equipped with a capillary column and with FID and MS as detector was used to pyrolyze ca. 200µg of samples at 650 under hydrogen carrier gas.the glass insert tube in the injection port was packed with hydrogenation catalyst and was maintained at 200 C. Catalysts used were 5wt% Pt, 2wt% Pd, and 5wt% Ni. [Results]. Figure 1 shows a typical pyrogram of dehalogenated PVC (PVC-6) at 650 C where Ni catalyst is used for the in-line hydrogenation. The pyrogram that mainly consists of serial n-alkane peaks is basically the same as that of PE. Minor peaks such as 2M, 3M, and 5M in the C 10 region are isoalkanes which reflect the branch structures in the polymer chain. Each branch content in the dehalogenated PVCs was determined by the peak simulation using well-defined ethylene-α-olefin model copolymer with known amounts of branch structure. Branch contents were calculated based on relative peak intensities of C 10 - isoalkanes to n-decane (n-c 10 ) in the pyrograms. Calculated SCB contents are summarized in Table 1. As shown, the branch contents calculated by the C 10 fragment data obtained by Ni catalyst proved to be much closer to those estimated by 13 CNMR. Also it exhibits a tendency that C 2 and C 4 contents increase with the increase of the conversion. Table 1. SCB contents in PVC obtained by Py- HGC using hydrogenation catalysts together with reference data obtained by 13 C NMR. Fragment region Sample Conv. (%) Branch contents/1000 chloride monomers Ni C1 C2 C4 C 10 PVC (1.6) 0.5(0.2) 0.4(0.3) PVC (3.0) 0.5(0.3) 0.7(0.5) PVC (5.0) 0.7(0.5) 1.0(0.7) PVC (4.1) 0.9(0.5) 1.1(0.8) PVC (3.1) 0.9(0.4) 1.1(0.8) PVC (3.6) 1.0(0.7) 1.1(0.7) PVC (4.1) 1.0(0.8) 1.2(0.7) PVC (3.7) 1.1(0.8) 1.6(1.5) PVC (4.4) 1.4(1.1) 1.7(1.7) * The SBC contents determined by 13 C NMR are given in parentheses. Figure 1. Typical pyrogram of a reductively dehalogenated PVC at 650 C observed after in-line hydrogenation using Ni catalyst. Sample: PVC-6, n-c n : n-alkane with carbon number n; 2M, 2-methylnonane, 3M, 3-methylnonane, 5M, 5-methylnonane. Keyword : Polyvinylchoride (PVC), Py-HGC, Short-Chain Branch (SCB), Dehydrogenation Applications : General polymer analysis Related technical notes : *Contents excerpted from S. Mao, H. htani, S. Tsuge, H. Niwa, M. Nagata, Polymer J. Vol. 31, No (1999) : Registered trademark of
72 Frontier-Lab Technical Note (PYA1-040E) Ring Structure of Cyclic Poly(2-vinylpyridine) Proved by Py-GC/MS [Background] Ring polymers having no chain end are expected to have quite different natures from those of the corresponding linear ones. However, the ring structures of the cyclic polymers have not been directly proved through the characterization of the chemical structures yet. In this work, the ring structure of cyclic poly(2-vinylpyridine) (P2VP) was confirmed by the Py-GC/MS method. [Experimental] A P2VP with two living ends was prepared by anionic polymerization of 2VP. The cyclization was carried out by reacting the living P2PV with dibromo-p-xylene as an initiator followed by terminating with excess P2VP. Three kinds of linear P2VP model polymers (L-1 through L-3) with different junction structures were prepared for comparison. Determination of molecular weight and fractionation were done with size extrusion chromatography. Analysis was done by a GC equipped with a capillary column and with an FID detector and MS. [Results]. Figure 1 shows the pyrogram of the fractionated P2VP sample, R-1. P2VP monomer, dimer, and trimer were observed. It is considered that the possible smallest characteristic fragments reflecting the coulpling moiety in the cyclic P2VP should be in the trimer region. The expanded pyrogram n the trimer region consists of a number of peaks in addition to the strongest 2VP trimer (VVV). Figure 2 shows the observed partial pyrograms in the trimer region for L-1, L-2, L-3 and R-1. The entire pyrograms of R1 and the model linear P2VPs were almost identical. The trimers observed on the pyrogram of L-2, however are missing on that of L-3 can be the candidates of VXV. By the logical comparison of the pyrograms of the three model polymers (L-1, L-2 and L-3), it was deduced that the peaks 1, 2, and 3 appearing on the pyrograms of L-2 should clearly be attributed to the peaks of the key trimers of VXV having a ring structure. Figure 1. Pyrogram of poly(2-vinylpyridine) [P2VP] Figure 2. Detailed pyrograms in the trimer region of containing cyclic polymer fraction (sample R-1) at 650 C. poly-(2-vinylpyridine) [P2VP] containing cyclic polymer fraction (sample R-1) and model linear P2VP (L-1 to L- 3) *Contents excerpted from H. htani, H. Kotsuji, H. Momose, Y. Matsushita, I. Noda, S. Tsuge, Macromolecules, 1999, 32, Keyword : Py-GC/MS, Cyclic Poly(2-vinylpyridine), Detection of Cyclic Structure Applications : General polymer analysis Related technical notes : : Registered trademark of
![Frontier-Lab Technical Note (PYA1-041E) Characterization of within-tree variation of lignin components in Eucalyptus camaldulensis by Py-GC [Background] Lignin in hardwoods such as Eucalyptus and](/docs-images/87/96064649/images/73-1.jpg "beech consists of guaiacylpropane units (G) and syringylpropane units (S) containing one and two methoxy groups, respectively.")
73 Frontier-Lab Technical Note (PYA1-041E) Characterization of within-tree variation of lignin components in Eucalyptus camaldulensis by Py-GC [Background] Lignin in hardwoods such as Eucalyptus and beech consists of guaiacylpropane units (G) and syringylpropane units (S) containing one and two methoxy groups, respectively. It is known that the lignin content and its chemical structure have a significant influence in the pulping process, in particular, the ratio of syringyl and guaiacyl units (S/G ratio) in hardwood lignin affects not only the pulping efficiency but also the strength of manufactured pulp and papers. In this work Py-GC was applied to the determination of the S/G ratio in samples from a given Eucalyptus. bserved S/G ratios were compared with those obtained by TAM (thioacidolysis method). [Experimental] Eucalyptus camaldulensis tree from Western Australia was used in this work. Debarked wood disks were obtained by cutting the trunk from 0.3m above the ground at 1m intervals. Then wood blocks obtained were cryo-milled into a finely powdered sample. About 100µg of wood sample were pyrolyzed under a flow of He carrier gas at 450 C. Analysis was done by a GC equipped with a capillary column and with an FID or MS as a detector. The lignin S/G ratio was determined by TAM based on the GC peak intensity ratio reflecting the syringyl- and guaiacylpropane units. [Results] Figure 1 shows a typical pyrogram of a Eucalyptus sample at 450 C observed by FID. Pyrolyzates derived from lignin were observed as peaks 1 through 26. Table 1 shows the assignment of these peaks and also summarizes the relative molar yields among the 26 pyrolyzates from lignin for radial samples A-1 through A-7. The distribution of each pyrolyzate in samples A-1 through A-7 showed a similar tendency. The within-tree variation of the S/G ratio in the radial direction at 0.3m above the ground obtained on the basis of the molar yields of the pyrolyzates showed the highest S/G ratio of 2.13 for sample A-1 at the extreme pith side. The S/G ratio then decreased gradually towards the bark with the lowest value of 1.57 for sample A-7. It was found the values obtained by Py-GC were always higher than those obtained by TAM. The within-tree axial variations were similarly determined. Figure 1. A typical pyrogram of Eucalyptus obtained at 450 C (Peak assignments were given in Table 1) Table 1. Radial variation of pyrolyzates for samples at 0.3m above the ground (S: syringyl unit, G: guaiacyl unit) *Contents excerpted from H. Yokoi, Y. Ishida, H. htani, S. Tsuge, T. Sonoda, T. na, Analyst, 1999, 124, Keyword : Py-GC/MS, TAM, Lignin, Syringyl and Guaiacyl units, S/G ratio, Within-tree variation, Eucalyptus Applications : Natural polymer analysis Related technical notes : : Registered trademark of
74 Frontier-Lab Technical Note (PYA1-042E) Discriminative analysis of Eucalyptus camaldulensis grown from seeds of various origins based on lignin components measured by Py-GC [Background] Lignin is a natural cross-linked polymer consisting of various phenyl propane units. The lignin in hardwoods such as Eucalyptus consists of syringyl propane units (S) and guaiacyl propane units (G). It is known that the lignin content and its composition, particularly S/G ratio, often vary depending on origins and growth conditions of the trees as well as genera and species. In this work the Py-GC method for lignin characterization previously developed was applied to the discriminative analysis of the origins of seeds for Eucalyptus Camaldulensis trees of varied origins grown at the same field, in which the principal component analysis (PCA) was used for data reduction. [Experimental] Eleven wood samples taken from 2-year-old Eucalyptus camaldulensis trees grown under the same condition and grown from the seeds collected from four different habitats in Australia were cryo-milled into fine powders prior to Py-GC analysis. About 100µg of the wood sample was pyrolyzed at 450 C under He carrier gas. A metal capillary column was used for GC separation. The distribution of lignin-derived pyrolyzates was processed using the PCA software. [Results] Fig. 1 shows a pyrogram of a Eucalyptus sample grown from the seed collected from Murchison River. Pyrolyzates derived from lignin were observed as peaks S-1 through S-13 and G-1 through G-13. ther samples yielded similar pyrograms and the distribution of the pyrolyzates for all samples showed a similar tendency. The discriminative analysis among the samples was first attempted on the basis of S/G ratio obtained from the relative molar yields between syringyl (S) and guaiacyl (G) related pyrolyzates. However, it was found it difficult to make unequivocal specification for the origin of the seeds by the observed S/G ratio alone. Therefore, the PCA method was applied in which information extracted from multivariate data was converted into individual variables, rather than reducing the whole data into a single value (S/G ratio). Fig. 2 shows a score plot of the first and second principal components for the 11 Eucalyptus samples grown from the seeds obtained at the 4 different origins, showing rough grouping of the samples according to the origin of the seeds. Fig. 1. Pyrogram of Eucalyptus (M-1) obtained at 450 C observed by FID. Fig. 2. Score plot of the first and second principal components for the trees. P, Petford; M,Murchison River; W, Wrotham Park; K,Katherine River *Contents excerpted from H. Yokoi, T. Nakase, Y. Ishida, H. htani, S. Tsuge, T. Sonoda, T. na, J. Anal. Appl. Pyrolysis, 2001, 57, Keyword : Py-GC, S/G ratio, PCA method, Eucalyptus camaldulensis, Lignin, Discriminative analysis Applications : General polymer analysis Related technical notes : : Registered trademark of
![Frontier-Lab Technical Note (PYA1-046E) Photodegradative changes in chemical structures of silk studied by Py-GC with sulfur chemiluminescene detection [Background] Silk is readily damaged and](/docs-images/87/96064649/images/75-0.jpg "weakened by exposure to light, making its deterioration mechanism of interest.")
75 Frontier-Lab Technical Note (PYA1-046E) Photodegradative changes in chemical structures of silk studied by Py-GC with sulfur chemiluminescene detection [Background] Silk is readily damaged and weakened by exposure to light, making its deterioration mechanism of interest. In this work photodegradative changes in the chemical structures of silk were examined by focusing on the changes in the sulfur-containing amino acid residues such as methionine (Met) and Cys and Cys-Cys residues by means of Py-GC with sulfur chemiluminescence detection (Py-GC/SCD). [Experimental] Photodegradation of silk samples was performed by exposure to simulated sunlight in a weather-meter at 46ºC and 60 ±5% relative humidity for 5, 27 and 52 days. A vertical microfurnace pyrolyzer (PY-2020D, Frontier Lab), which enables pre-heating free pyrolysis at desired temperatures for thermally labile samples such as proteins, was directly attached to a GC with a fused-silica capillary column. The column effluents were selectively detected by a sulfur chemiluminescence detector (SCD). About 200 g each of silk samples was pyrolyzed at 600ºC under a flow of He carrier gas. [Results] To create calibration curves for the determination of sulfur-containing amino acid residues, four standard protein enzymes were measured by Py-GC/SCD. Figure 1 shows the pyrograms of (a) unirradiated silk sample, and silk samples exposed for (b) 5 days, (c) 27 day and (d) 52 days. The intensities of most of the key peaks apparently decrease with increase in irradiation time. The contents of Met, Cys, and Cys-Cys residues in the silk samples were then estimated from the corresponding key peak intensities using the calibration curves. The quantitative results thus obtained for the silk samples are summarized in Table 1. The observed amino acid compositions for both Cys and Met residues of the control sample were about 0.2%, which are in a good agreement with those inferred from DNA sequencing. The RSD for the Cys residue determination was ca. 5% for three repeated runs for the control sample, indicating adequate reproducibility. Table 1. Content of the sulfur-containing amino acid residues contained in exposed silk samples determined by Py-GC with SCD Figure 1. Pyrograms of photo degraded silk samples at 600ºC observed by SCD: (a) not exposed; (b) exposed for 5 days; (c) exposed for 27 days; (d) exposed for 52 days. *Contents excerpted from S. Tsuge, H. Yokoi, Y. Ishida, H. htani, M.A. Becker, Polymer Degradation and Stability 69 (2000) Key word : Silk, Photodegradation, Disulf ide bond, Py -GC, Sulf ur chemiluminescene detection (SCD) Applications : General poly mer analy sis Related technical notes : : Registered trademark of 3400 East Third Avenue
76 Double-Shot Pyrolyzer Technical Note (PYA1-047E) Compositional Analysis of Isoprene-butadiene-styrene Blend Rubber by Py-GC [Background] The compositional analysis of multi-component blend rubber is very important in quality control. The Py-GC technique is a useful tool to provide rapid compositional analysis of blend polymers. Here, a compositional analysis of a blend rubber consisting of polybutadiene (PB)-polyisoprene (PI)-polystyrene (PS), as a typical example, is described. [Experimental] A Py-GC system used in this study was a Double-Shot Pyrolyzer which was directly coupled with the split/splitless injection port of a GC and was connected to a FID via a metal capillary column. A calibration curve was created using standard samples (A~C) shown in Table 1 and was used to obtain the composition ratios of unknown sample D. It was later compared with the composition ratio of the starting materials in Table 2. [Results] Figure 1 shows a pyrogram of PB-PI-PS 3-components blend rubber obtained at 550ºC. Major pyrolyzates such as butadiene (BD), isoprene (IP), and styrene (ST) were observed as main constituent monomers. A good linear calibration curve was obtained from the relative peak areas of monomers and the composition ratios of starting standard material. An example shown in Fig. 2 is a calibration curve for PB component. Calibration curves for PI and PS components were similarly obtained. As an example shown in Table 2 in which the composition ratio of unknown D obtained from the calibration curve and that of the starting material are compared, this technique demonstrates that blend compositions can be determined with a high precision. Table 1. Composition ratio of standard and peak ratio of monomers Composition ratio of standard (wt.%) Relative peak area (%) Sample PB PI PS BD IP ST Total A B C Table 2. Compositional ratios of unknown D PB PI PS Composition ratio determined(wt. %) Composition ratio of starting material (wt. %) Isobutene Butadiene Isoprene Styrene Relative peak area (%) R 2 = min Fig. 1 A pyrogram of standard sample Pyrolysis temp.: 550ºC, detector: FID, sample: standard sample A Separation column: Ultra ALLY+-5 (5% diphenyl 95% dimethylpolysiloxane) Length: 60m, id: 0.25mm, film thickness: 1.0µm GC oven temp.: 50ºC (7min hold) 280ºC (10ºC/min), carrier gas: He Injection port pressure: 175kPa, split ratio: 1/60, sample size: ca.200µg Starting composition ratio (wt. %) Fig. 2 Calibration curve for PB composition Keyword : Blend rubber, Composition analysis, Butadiene, Isoprene, Styrene Applications : Rubber industry Related technical notes : PYA1-021E, PYA1-048E : Registered trademark of
77 Double-Shot Pyrolyzer Technical Note Effects of Separation Conditions to Analysis Accuracy in Composition Analysis of A Blend Rubber by Py-GC Technique IB+BD IP ST (PYA1-048E) Background] The Py-GC technique is a useful analytical tool which offers facile and prompt compositional analysis of various blend polymers.1) With this technique, however, not only peaks due to constituent monomers, but peaks due to various byproducts are also observed on the pyrograms and those peaks often overlap, causing the analytical accuracy to be deteriorated. For example, in analysis of a three-dimensional blend rubber such as polybutadiene(pb) - polyisoprene(pi) - polystyrene(ps), depending on the analytical conditions, peaks for butadiene, the monomer of PB, and isobutene, a pyrolysis by-product may not be well resolved on the pyrogram. Here, in this report such effects to the analytical accuracy were studied. [Experimental] In the Py-GC system, a Double-Shot Pyrolyzer directly attached to the split/splitless injection port of a GC was connected to an FID via a capillary separation column. The GC separation conditions used were conditions recommended by IS7270 (Condition A) and those used to separate isobutene and butadiene in this study (Condition B). Composition ratios of unknowns are determined using a calibration curve generated from three standard samples of varied composition ratios. [Results] Fig. 1 shows a pyrogram of the PB-PI-PS blend rubber obtained using Condition A, while Fig. 2 shows a pyrogram obtained using Condition B. n both pyrograms, peaks due to the constituent monomers of butadiene (BD), isoprene (IP), and styrene (ST) are observed as major peaks, however, in the pyrogram obtained with Condition A, peaks for IB and BD were not resolved, so it is difficult to obtain the peak area of each peak by integration using a vertical drop line. Therefore, in calculation of composition ratio, peak area was obtained from two peak areas combined and was used as peak area for BD. n the other hand, in Table 1. Composition ratios for unknowns and starting the pyrogram obtained with Condition B, peaks for IB and BD are material (wt%) marginally resolved, thus the peak area of each was obtained by integration using a vertical drop line. Table 1 shows starting PB PI PS composition ratios and composition ratios obtained with both Starting composition ratio conditions. In the results obtained with Condition A, composition With Condition A ratios were obtained with fairly good accuracy, but with regard to PB, relatively large error of -0.8wt% are shown. n the other hand, (error) (-0.8) (+0.2) (+0.6) composition ratios obtained with Condition B gave a good accuracy With Condition B and even the largest error made was mere +0.2wt% for PS. (error) (-0.1) (-0.1) (+0.2) 2 3min min Figure 1. Pyrogram of a blend rubber obtained with conditions recommended by IS7270 (Condition A) Pyrolysis temp. : 550ºC, Detector : FID, Separation column : Ultra ALLY+-5 (5%-diphenyl-95%-diphenyl-95%-dimethylpolysiloxane) Length 30m, id 0.25mm, Film thickness 1.0µm GC oven temp. : 50ºC (2min hold) 280ºC (10ºC/min), Injection port pressure : 175kPa, Split ratio : 1/60, Sample size : ca.200µg IB BD IP ST min min Figure 2. Pyrogram of a blend rubber obtained with conditions used in this study (Condition B) Separation column : Ultra ALLY+-5 (5%-diphenyl-95%-dimethylpolysiloxane), Length 60m, id 0.25mm, Film thickness 1.0µm GC oven temp. : 50ºC (7min hold) 280ºC (10ºC/min), ther conditions are the same as those in Fig. 1. Keyword : Blend rubber, Composition analysis, Butadiene, Isoprene, Styrene Applications : Rubber industry Related technical notes : PYA1-047E : Registered trademark of
78 Double-Shot Pyrolyzer Technical Note (PYA1-049E) [Background] Various cationic polymers with a quaternary ammonium salt are used as dye fixing agents and antimicrobials in textile, paper, and film industries. Because the amount of ammonium salt added to the products greatly influence the product performance, the quantitative analysis of the ammonium salt is very important. However, comsssplicated pretreatments such as solvent extractions of interfering species are usually required, because coexisting organic compounds may interfere the analysis. Therefore, the development of a simpler analytical methodology has long been desired. Here, a simple quantitative analysis of a quaternary ammonium salt by Py-GC/MS requiring no pretreatments is described. [Experimental] A quaternary ammonium salt, polyquaternium-4 (PQ-4) with a chemical structure shown in Fig. 1, was used for this study. For the EGA-MS system used, a pyrolyzer (Frontier Lab. Ltd.) attached to the GC injection port, was connected to a quadrupole MS through a deactivated stainless-steel transfer capillary (Frontier Lab. Ltd.). In the thermal desorption-ms, a separation column was used in place of a transfer capillary. Also at the head of the separation column, MicroJet Cryo-Trap (Frontier Lab Ltd.) was attached to collect volatile components from the sample. They were later analyzed by GC/MS. [Results] An EGA curve for PQ-4 is shown in Fig. 2. As shown in the blowup of 250~300ºC region, the formation of chloromethane was observed. Thus, the quantitative analysis of PQ-4 was attempted by the amount of chloromethane formed. Fig. 3 shows the chromatogram of the thermally desorbed components of PQ-4 between 100~340ºC obtained by GC/MS. At the retention time of about 1.5min, a peak due to chloromethane is markedly observed. This was repeated 8 times and the reproducibility of the peak area of chloromethane is shown in Table 1. The relative standard deviation was found to be 3.44% and this demonstrates that this is valid quantitative analytical method for PQ-4. CCH 2 CH 2 H H H Simple Quantitative Analysis of A Cationic Polymer with A Quaternary Ammonium Salt by Py-GC/MS Technique x CCH 2 CH 2 H H H y CH 3 Cl CH 3 Cl m/z Thermal decomposition of cellulose skeleton m/z: 50 N + Cl - CH 3 CH 3 z Fig. 1 Structure of PQ-4 & chloromethane formation ºC Fig. 2 EGA curve for PQ-4 Pyrolysus temp.: ºc (20ºC/min), carrier gas : He 50kPa, split ratio : ca.1/50 EGA tube : id 0.15mm, length : 2.5m (UADTM-2.5N), GC oven temp.: 300ºC Sample size : ca. 0.2mg, MS scan range : (m/z), scan rate : 0.2 scan/sec TIC C 2 CH 3 Cl acetaldehyde chloropropene min Fig. 3 Chromatogram of PQ-4 obtained by thermal desorption-gc/ms Pyrolyzer furnace temp.: ºC (20ºC/min, 2min hold), flow rate : 1ml/min, split ratio : 1/50 Separation column : Ultra ALLY5+ (5% diphenyl 95% dimethylpolysiloxane, length 30m id 0.25mm, film thickness : 1.0µm), GC oven temp.: 40ºC (2min hold) - 300ºC (20ºC/min) Sample size : 5.64µg, MS scan range : (m/z), scan rate : 2 scan/sec Table 1 Reproducibility of chloromethane peak area n Peak area (x10 5) Average 5.92 RSD (%) 3.44 Keyword : Cationic polymer, quaternary ammonium salts, polyquaternium, EGA, Thermal desorption Applications : Paper industry, Film manufacture, General polymer analysis Related technical notes : PYA1-050E, PYT-004E, PYT-007E, PYT-014E : Registered trademark of
79 Double-Shot Pyrolyzer Technical Note (PYA1-050E) Quantitative Analysis of A Cationic Polymer Having A Quaternary Ammonium Salt on A Polymer Sheet by Py-GC/MS [Background] Various cationic polymers with a quaternary ammonium salt are used as dye fixing agents and antimicrobials in textile, paper, and film industries. Because the amount of ammonium salt added to the products greatly influence the product performance, the quantitative analysis of the ammonium salt is very important. However, complicated pretreatments such as solvent extractions of interfering species are usually required, because coexisting organic compounds may interfere the analysis. Therefore, the development of a simpler analytical methodology has been long been desired. Previously, a simple quantitative analytical method using thermal desorption-gc/ms as an application of a Double-Shot Pyrolyzer has been developed (PYA1-049E). Here, this analytical method was applied to real samples. [Experimental] As real samples, standard samples( A~C) in which ca ppm of polyquaternium-4 (PQ-4) was coated on three polyethylene terephthalate (PET) sheets, each coated with different concentrations, were used. For the Py-GC/MS system, a Double-Shot Pyrolyzer (Frontier Lab. Ltd.) directly attached to the split/splitless GC injection port was connected to a MS via a separation column. At the head of the separation column, a MicroJet Cryo-Trap was attached to cold-trap volatile components. [Results] Fig. 1 shows a chromatogram of thermally desorpted components of ca. 10mg of PET sheet coated by 345ppm of PQ-4 obtained at temperatures up to 340ºC. A peak for chloromethane was observed at a retention time of about 1min. The reproducibility of the peak area for chloromethane s characteristic ion at m/z 50 in the mass spectrum was found to be 3.46%. Further, as shown in Fig. 2, a good linear calibration curve was created from varied concentrations of coatings on sample sheets and its correlation coefficient was found to be These results indicate that this is a powerful quantitative analytical method for PQ-4. C 2 acetaldehyde ethylene glycol chloromethane formaldehyde ethylene oxide ethanol m/z: min Peak area counts of chloromethane per sample weight (Mass chromatogram at m/z: 50) x R 2 = min Fig. 2 Chromatogram of a PET sheet coated by PQ-4 obtained by thermal desorption-gc/ms Pyrolyzer furnace temp.: ºC (20ºC/min, 2min hold), Flow rate : 1ml/min, split ratio : 1/50 Separation column : Ultra ALLY5+ (5% diphenyl 95% dimethylpolysiloxane, length 30m id 0.25mm, film thickness : 1.0µm), GC oven temp.: 40ºC (2min hold) - 300ºC (20ºC/min) Sample size : 5.64µg, MS scan range : (m/z), Scan rate : 2 scan/sec Keyword : Cationic polymer, quaternary ammonium salts, polyquaternium, Thermal desorption Applications : Paper industry, Film manufacture, General polymer analysis Related technical notes : PYA1-049E, PYT-004E, PYT-007E, PYT-014E PQ-4 coating concentration on PET sheet (ppm) Fig. 2 Calibration curve for PQ-4 coated on PET sheets : Registered trademark of
80 Double-Shot Pyrolyzer Technical Note (PYA1-051E) Quantitative Analysis of Brominated Flame Retardant by Thermal Desorption-GC Technique [Background] Brominated flame retardants are widely used and contained in electric and electronic devices, and are to be controlled under the Restriction of Hazardous Substances (RoHS directive). If the quantitative analysis of them is done by thermal desorption-gc technique (TD-GC), a various measurement parameters need to be optimized. Fig. 1 shows the construction of the TD-GC system. In this report, the temperature optimization for Py-GC interface (ITF) and GC injection port is described. [Experimental] The Double-Shot Pyrolyzer which is temperature programmable microfurnace pyrolyzer was directly attached to the split/splitless injection port of a GC equipped with a FID detector. The sample solution was prepared by adding ca. 5% (based on PS) of DeBDE into a THF solution containing 10 µg/µl of polystyrene (PS), then an aliquot (5µL) of the sample solution was placed in a sample cup and was allowed to dry prior to analysis. The thermal desorption temperature employed was 100~350ºC (20ºC/min), which was determined based on the EGA results. [Results] Fig. 2 shows the peak intensity change of DeBDE contained in PS obtained by TD-GC technique as a function of the temperature of the Py-GC ITF and the GC injection port between 250 and 400ºC. It was found that between 300 and 370ºC, the peak intensity stayed constant, however, at temperatures below 300ºC and above 400ºC, the intensity decreased. At temperatures below 300ºC, DeBDE might have been absorbed in the flow path, and at temperatures above 400ºC DeBDE might have 10 been thermally decomposed. Fig. 3 shows the reproducibility of the 4 15 peak intensity plotted against the temperatures of the Py-GC ITF and the GC injection port. At temperatures between 300 and 370ºC, good RSD values of ca. 2% were obtained, while below 300 and above ºC, the reproducibilities were deteriorated. Based on these results, the optimum temperature for Py-GC ITF and GC injection port was found to be 320ºC, at which temperature DeBDE absorption and 5 thermal decomposition can be avoided. He Sample cup DeBDE peak intensity Temperature of Py-GC ITF and GC injection port (ºC) Figure 2 DeBDE peak area vs. Py-GC ITF and GC injection port temperatures Furnace temp/: 100~350ºC (20ºC/min), sample size: 50µg (4.8% DeBDE contained) Separation column: UA-PBDE (polydimethylsiloxane, length 15m, id 0.25mm, film thickness 0.05µm), Column flow rate: 1mL/min, split ratio: 1/50, detector: FID (360ºC) Heating furnace Py-GC interface GC injection port Separation column To detector Figure 1 Construction of sample introduction section of Py-GC system Reproducibility of DeBDE peak intensity (RSD, %, n=5) Temperature of Py-GC ITF and GC injection port (ºC) Figure 3 Reproducibility of DeBDE peak area vs. Py-GC ITF and GC injection temperatures (analysis conditions are the same as above) Contents excerpted from A. Hosaka, C. Watanabe, S. Tsuge, Anal. Sci., 2005, 21, 1145 Keyword : Brominated flame retardant, RoHS directive, thermal desorption, decabromodiphenyl ether Applications : Electrical and electronics industry, environmental analysis, general polymer analysis Related technical notes : 1) PYA1-052E, 2) UAT-006E : Registered trademark of
81 Double-Shot Pyrolyzer Technical Note (PYA1-052E) Analysis of Brominated Flame Retardant in a Waste Plastics by Thermal Desorption-GC/MS Technique [Background] In the analysis of brominated flame retardants, to be controlled under the Restriction of Hazardous Substances (RoHS directive), GC analysis is generally conducted after solvent extraction, although, it involves cumbersome operations. Therefore, simpler analytical technique needed to be developed. Here, the analysis of decabromodiphenyl ether (DeBDE), a most commonly used brominated flame retardant is achieved by thermal desorption (TD)-GC/MS technique. [Experimental] A TD-GC system in which a Double-Shot Pyrolyzer was directly attached to the split/splitless injection port of a GC was used. A polystyrene (PS) based waste plastic containing brominated flame retardants was used as a sample, and an aliquot (5 µl) of THF solution (10 µg/µl) was placed in a sample cup for analysis. The temperature of the PY-GC interface and the GC injection port was set to 320ºC, at which temperature no absorption or thermal decomposition of DeBDE has been reported. 1) A metal capillary column specifically designed for brominated flame retardants 2) [Ultra ALLY-PBDE] with highly deactivated inner wall was used. [Result] Fig. 1 shows evolved gas analysis (EGA) curves of waste plastic, which was obtained in order to find optimum thermal desorption conditions. The major peak between 400 and 500ºC proved to be derived from thermal decomposition of the base polymer PS. Also a small peak observed between 250 and 350ºC showed m/z 799 and m/z 959 (molecular ion) on the average mass spectrum, hence it was considered to be due to thermally desorbed DeBDE. From this result, the optimal thermal desorption temperature for DeBDE was determined to be 200~400ºC (20 ºC/min). With this thermal desorption condition, the quantitative analysis of DeBDE in the waste plastic was performed by the TD-GC/MS technique. Fig 2. shows a chromatogram obtained, giving well-resolved peaks without interferences from coexisting species. By this method, it was confirmed that the waste plastic contained 7.1 wt% of DeBDE, with a good reproducibility (RSD=3.5%) Thermal decomposition of PS m/z x (a) TIC 3 Residual solvents and oligomers Desorption of DeBDE x ºC x (b) m/z: ºC Figure 1 EGA curve of waste plastic Pyrolysis furnace temp.: ºC (20ºC/min), GC oven temp.: 300ºC,column flow rate: 1 ml/min, split ratio: 1/50, GC/MS ITF temp.: 320ºC MS ion source temp.: 250ºC, scan range: (m/z), scan rate: 0.2 scan/sec, sample size: 50µg Peak area of DeBDE (x 10 6, m/z: 799) Average RSD (n=5) 3.5 % Styrene trimer Quantity determined: 7.1% DeBDE NoBDE min Figure 2 Chromatogram of waste plastic obtained by TD-GC/MS Pyrolysis furnace temp.: ºC (20ºC/min), Separation column: UA-PBDE (polydimethylsiloxane, length 15m, id 0.25mm, film thickness 0.05 µm), Sample size: 50 µg Column flow rate: 1mL/min, Split ratio: 1/50, GC/MS ITF temp.: 320ºC, MS ion source temp.: 230ºC, Scan range: (m/z), Scan rate: 3 scans/sec Keyword : Brominated flame retardant, RoHS directive, thermal desorption, decabromodiphenyl ether Applications : Electric and electronics industry, environmental analysis, general polymer analysis Related technical notes : 1) PYA1-051E, 2) UAT-006E Contents excerpted from A. Hosaka, C. Watanabe, S. Tsuge, Anal. Sci., 2005, 21, 1145 : Registered trademark of
82 Double-Shot Pyrolyzer Technical Note (PYA1-053E) Stereoregularity of Poly(methyl methacrylate)s Studied by Pyrolysis-Gas Chromatography/Mass Spectroscopy [Background] Py-GC has been successfully applied to the analysis of the stereoregularity of various vinyl polymers. Stereoregularity is a function of the diastereoisomers which are larger than the tetramers, which have at least two asymmetric centers. Moreover, Py-GC results are used to characterize the tacticity of vinyl polymers consisting of relatively larger monomer units, such as polystyrenes (PSs) and poly(methyl methacrylate)s (PMMAs). This note presents the study of the tacticity of PMMA samples. [Experimental] A series of PMMA samples with known and tacticity values, determined by 1 H NMR, are analyzed. About 400 µg of the sample is subjected to Py-GC at 500 ºC. A deactivated metal capillary column is temperature programmed from 50 to 340 ºC which facilitates the separation of the diastereoisomers. [Results] Figure 1 shows a typical pyrogram of the PMMA sample (m : r = 24.0 : 76.0) obtained when pyrolyzed at 500 ºC. This pyrogram clearly contains minor peaks for MMA dimers, trimers, tetramers (about 0.1%) and even pentamers (about 0.03%) in addition to the main monomer peak. The chemical structures of the two tetramers, A and B, are estimated using their EI and CI mass spectra. Additionally, the small peaks (A and B ) appearing a little earlier than those of the main tetramers (A and B) are identified as the corresponding diastereoisomers. Thus, estimated tacticity values, calculated using the peak intensities of either the tetramer pair, A and A, or B and B, agree with those obtained by 1 H-NMR. (racemo; r) (m) (r) (m) (r) (racemo; r) Keyword : Stereoregularity, Poly(methyl methacrylate)s, Deactivated metal capillary column Applications : Vinyl polymer analysis Related technical notes : Figure 1. Typical pyrogram of PMMA sample (m : r = 24.0 : 76.0). Desorption temp. : 500ºC, GC oven temp. : 50ºC-(4 ºC/min)-340ºC Separation column : Poly(dimethylsiloxane), Length 50 m, 0.25 mm i.d., Film thickness 0.15 µm Carrier gas flow : 50 ml/min, Column flow : 1.0 ml/min, Detector : FID *Contents excerpted from T. Nonobe, S. Tsuge, H. htani, T. Kitayama, K. Hatada, Macromolecules 1997, 30, : Registered trademark of
83 Double-Shot Pyrolyzer Technical Note (PYA1-054E) Qualitative Analysis of Additives in a Recycled Polypropylene Using a New MS Library for Additives (ADD-MS06 Library) [Background] Commercially available MS libraries are generally used to identify compounds detected by GC/MS; however, the number of additives for polymeric materials stored is not sufficient for practical use. Therefore, a new MS library with commercially available 329 major additives was constructed by use of pyrolysis-gc/ms(py-gc/ms). The library can be useful estimate additives contained in polymeric materials. [Experimental] The ADD-MS06 Library was constructed by : (a) directly from analyzed data including pyrograms forthe standard additive samples obtained by Py-GC/MS at 600ºC, (b) mass spectra for the major peaks observed on each pyrogram, and (c) retention 0 indices (RI) of the major peaks for the additive itself and/or its pyrolyzates. Using this library, additive components of a recycled polypropylene (PP) were estimated from its chromatogram obtained by thermal desorption (TD) from 100 to 300ºC at 20ºC/min followed by GC/MS separation. (a) Recycled PP TIC Peak A (RI : 3430) Peak B (RI : 4453) [min] Chromatograms stored in the additive library (b) tris(2,4-di-t-butylphenyl) phosphite (c) tetrakis(2,4-di-t-butylphenyl)-4,4'-biphenylene diphosphonite [Results] Fig. 1(a) shows the observed TIC for the recycled PP obtained by TD-GC/MS analysis. The (d) decabromodiphenyl ether search results of the mass spectra for the peaks A and B are shown in Table 1. The both peaks were estimated by narrowing down their candidates by use [min] of the degree of similarity and RI value comparison. Fig. 1 Chromatograms of PP, and additives strored in MS library Pyrograms of additives stored in the ADD-MS06 TD: ºC(20ºC/min), GC ven: ºC(20ºC/min, 4 min) - 340ºC(10ºC/min), Library are shown in Figs. 1(b), (c), and (d). Comparing He: 1.0 ml/min, Split ratio: 1/50, Amount: 0.3 mg, Col : UA5-30M-0.25F these data, additives contained in the recycled PP could be estimated as, (1) tris(2,4-di-t-butylphenyl) phosphite, or tetrakis(2,4-di-t-butylpheny)-4,4 - Table 1 Additive MS library search results biphenylene diphosphonite, an antioxidant for the peak Candidates compounds Degree of similarity[%] RI A component, and (2) decabromodiphenyl ether 1. tris(2,4-di-t-butylphenyl) phosphite Peak A 2. 2,4,8,10-tetra-t-butyl-5,7-dioxa- (DeBDE), a flame retardant for the peak B component RI: phospha-dibenzo[a,c]cyclohepten-6-ol respectively t-butyl-6-methyl-4-ethenylphenol 1. decabromodiphenyl ether Peak B 2. isomer of bromophenyl RI:4453 heptabromodiphenyl ether tetrabromo phthalimide Keywords : Additives, MS Library, RoHS, DeBDE, PBDE, Recycled PP Applications : General Polymer Analysis, Additives Related technical notes : : Registered trademark of
84 Double-Shot Pyrolyzer Technical Note (PYA1-055E) Analysis of butylhydroxytoluene (BHT) in polyethylene (PE) by Thermal Desorption Gas Chromatography (TD-GC) [Background] When flash pyrolysis is used for the analysis of additives in a polymer, interferences caused by the pyrolyzates of the polymer backbone and/or the pyrolysis of the additives themselves often leads to poor analytical precision. Data quality will dramatically improve by using TD-GC, which utilizes lower temperatures to extract the additives of interest. In addition, TD/GC does not require cumbersome sample preparation; the sample is analyzed as is. This eliminates errors associated with conventional sample preparation techniques (e.g. solvent extraction). This Technical Note presents the quantitative analysis of BHT (chemical structure and its mass spectrum are shown in Fig. 1.), a common antioxidant additive used in PE using TD-GC/MS. [Experimental] A piece of the PE sample (1 x 1 x 3mm in size, ca. 3mg) is placed in a sample cup. Note that the shape (surface area to sample weight ratio) is known to affect analytical precision. The ramifications of using pieces of sample on data quality will be reported elsewhere(1). The thermogram of a PE sample containing ca. 500ppm of BHT is obtained using evolved gas analysis (EGA): ºC. Extracted ions are used to determine the TD zone for the analysis of BHT. [Results] The thermogram of the PE sample, obtained by EGA, is shown in Fig. 2. In the TIC chromatogram, only a single peak, emanating from the pyrolysis of PE, is observed. Extracted ion chromatograms: m/z 205 and 220 which are characteristic ions for BHT, are observed in the temperature range ºC. This defines the thermal desorption conditions ( ºC at 20ºC/min, 3 min hold) for determining BHT in PE. Fig. 3 shows a typical chromatogram obtained by TD-GC using these conditions. The peak area of BHT / weight of PE gives a reproducibility less than 3% RSD. The BHT concentration is 510 ppm based upon an ESTD calibration curve obtained under the same conditions H BHT m/z Fig. 1 Chemical structure of BHT and its mass spectrum Zone A (100~200ºC) Pyrolysis of PE BHT H TIC m/z: 205 m/z: ºC Fig. 2 Thermograms of a PE Sample Furnace temp. : ºC, (20ºC/min), split ratio : 1/50 Sample size : about 0.5mg, detector : MS min Fig. 3 Chromatogram of thermally desorbed components from a PE sample Furnace temp.; ºC (20ºC/min, 3min hold), flow rate : 1 ml/min, split ratio : 1/50, GC oven temp.: ºC (20ºC/min), sample size : about 3mg, detector : FID, separation column : Ultra ALLY-5 (5%-diphenyl 95%-dimethyl polysiloxane, L=30m, id=0.25mm, df=0.25µm) Keyword : Additives, Thermal desorption, BHT, Antioxidant, Polyethylene Applications : General polymer analysis Related technical notes : PYA1-056E : Registered trademark of
85 Double-Shot Pyrolyzer Technical Note (PYA1-056E) Notes on the analysis of volatile additives in polymers by Thermal Desorption Gas Chromatography (TD-GC) [Background] The quantitative analysis of volatile additives such as BHT in polymers, is adversely effected by additive losses at or near room temperature. Analytical precision decreases due to a multitude of factors (storage temperature, time between prep and analysis, surface area/sample weight, etc), many of which are not easily controlled. This Note illustrates the magnitude of the losses due to evaporation of volatile additives from the polymer surface and suggests a simple way to minimize the losses. The quantitative analysis of BHT in PE by TD-GC is used as a test sample. [Experimental] Two PE samples, containing ca. 500ppm of BHT, were prepared - one by cutting the PE chunk into 20 pieces of ca mm (method 1), and the other by cutting a single piece of PE ca. 1 x 1 x 3mm (method 2). The two samples were placed in separate sample cups, and quantitatively analyzed by TD-GC. Also, the effect of elapsed time from sample preparation to the start of the analysis is examined. [Results] A typical chromatogram, obtained by TD-GC, is shown in Fig. 1. The level of BHT determined by five replicate analyses are 456 ppm (RSD=5.3%) - method 1, and 510 ppm (RSD=2.5%) with - method 2. These results indicate that during sample preparation, BHT loss from the sample surface is less if a single chuck of sample (method 2) is analyzed: 510 vs. 456 ppm (% difference = 11). The influence of elapsed time from cutting the sample to the start of the analysis is shown in Fig. 2. As the elapsed time increases, the BHT level decreases and eventually stabilizes. About an 8% decrease in the BHT level is observed in the first hour, this increases to 13% in the next 2 hours. The BHT level remains fairly constant after 3 hours. This may be best explained by the fact that the BHT distributed inside the PE matrix does not migrate to the polymer surface at room temperature. These results clearly show that when performing quantitative analysis of volatile polymer additives such as BHT by TD-GC, it is particularly important that (1) the surface area to sample weight ratio be as low as possible, and (2) the samples should be analyzed immediately after the polymer is cut and placed in the sample cup. 520 BHT H H BHT conc. (ppm) min Fig. 1 Chromatogram of thermally desorbed components from the PE sample Furnace temp.: ºC, (20ºC/min, 3min hold), gas flow rate : 1 ml/min, Split ratio : 1/50, GC oven temp.: ºC (20ºC/min), sample size : ca. 3mg, Sample pretreatment : method 2, detector FID, Separation column : Ultra ALLY-5 (5% diphenyl 95% dimethyl polysiloxane, L = 30 m, id = 0.25 mm, df = 0.25 µm) Keywords : Additives, Thermal desorption, BHT, antioxidant, polyethylene Application : General polymer analysis Related technical notes : PYA1-055E Elapsed time from sample prep to start of analysis (hour) Fig. 2 BHT conc. plotted against Elapsed Time from Sample Preparation Analytical conditions are identical to those shown in Fig. 1 : Registered trademark of
86 Double-Shot Pyrolyzer Technical Note (PYA1-057E) Identification of an Unknown Antidegradant in a Rubber Sample using the Expanded Additive MS Library [Background] Impurities originally contained in the antidegradants and their decomposed products from during the manufacturing process often provide valuable information when analyzing antidegradants found in various rubber formulations. However, conventional MS libraries such as Wiley do not contain information on the impurities or decomposed products of the antidegradants. Frontier Laboratories MS additive library information on 37 typical antidegradants. [Library structure] The expanded additive MS library includes mass spectral data for the major peaks found in the chromatograms of the antidegradants obtained by thermal desorption (TD)-GC/MS. In addition, the fragment names, retention indices (RI), the chemical names of the original antidegradants and the total ion chromatograms are reported. [Test sample] A compounded rubber, which had been kneaded and vulcanized, containing approximately 1% of an unknown antigradant, was analyzed to illustrate the capabilities of the library. [Results] Fig.1(a) shows the chromatogram of the vulcanized rubber sample obtained using TD-GC/MS and the MS spectra of peaks (A)~(C). Based on their RI and the similarities of the mass spectra obtained using the MS library, three major peaks are identified, see Fig.1(b). Furthermore, the chromatogram in the expanded additive library in Fig.1(b) can be used to identify the antidegradant candidate associated with these 3 peaks as p-(p-toluene sulfonylamido) diphenylamine. The additive MS library which contains data about the major peaks in the chromatograms as well as those of the original antidegradants is useful for identifying antidegradants in rubber. (a) Chromatogram of the volatile components in the unknown rubber sample. RI:1989 (A) RI: [m/z] [m/z] (B) RI: [m/z] (C) min (b) Chromatogram of p-(p-toluene sulfonylamido) diphenylamine in the MS library. RI:1986 N-phenyl-1,4- benzenediamine RI:1084 H p-toluenthiol N SH H2N RI:3338 p-(p-toluene sulfonylamido) diphenylamine H N S NH min Keywords : Rubber, Antdegradants, Thermal desorption Applications : General polymer analysis, Rubber and associated industries Related technical notes : PYA1-054E Fig. 1 Chromatograms obtained by TD-GC/MS technique Furnace temp.: 340ºC (1 min), GC oven temp.: ºC (20ºC/min, 10 min) Column: Ultra ALLY-5 (MS/HT) (30 m, 0.25 mm, film thickness 0.25 µm), sample amount: 1.0 mg Ref : K. Matsui, et al., 12th Polymer Analysis & Characterization Japan 2007 I-16 : Registered trademark of
87 Double-Shot Pyrolyzer Technical Note (PYA1-058E) Identification of Unknown Polymeric Materials using a Polymer MS Library [Background] The qualitative analysis of unknown polymeric materials has historically been based on the identification of the major peaks in the pyrogram using a general-purpose MS library such as NIST. However, relatively high molecularweight pyrolyzates which often reflect the polymeric structure are often not found in general-purpose libraries. In response to this deficiency, Frontier Laboratories has developed a pyrolyzate MS library for 165 typical polymers. [Library structure] The new MS library includes approximately 4,000 mass spectra of compounds found in the pyrograms of 165 polymers when pyrolyzed at 600ºC. Compound names, retention indices (RI), polymer names and the individual pyrograms, are included in the pyrozate library. [Results] Figure 1, shows the major peaks (A)-(G) found in the pyrogram of an unknown polymer sample. Each peak is identified using the newly constructed MS library. (C)-(G) are relatively high molecular-weight pyrolyzates and can be used to tentatively identify the backbone structure of the polymer. The new library contains data on the parent polymer as well as the pyrolyzates identified in the pyrograms. Four candidate polymers, see Figure 2, are reported. Comparing the peaks on the four pyrograms, especially the hybrid trimers eluting around 12 min, suggests that the unknown polymer is Acrylonitrilestyrene copolymer. Further confirmation can be obtained using Frontier Laboratories EGA-MS library. This simple example illustrates how the new pyrolyzates library can assist in polymer identification. Acrylonitrile N (A) ASA hybrid trimer SSA hybrid trimer (B) N N N SA hybrid dimer Styrene N SAS hybrid trimer (E) (G) N AS hybrid dimer N (C)(D) (F) AAS Unknown polymer monomer dimer trimer Styrene ASA SAA Acrylonitrile Toluene [min] 4 candidate polymers [min] Fig. 1 Pyrogram of unknown polymer sample and peak identifications Furnace temp.: 600ºC, GC oven temp.: 40(2 min)-320ºc(20ºc/min, 10 min) Column: Ultra ALLY-5 (MS/HT) (length 30 m, id 0.25 mm, film thickness 0.25 µm) Table 1 Searching compounds for peak (A) Rank Compound Polymer Quality[%] Acrylonitrile Acrylonitrile Acrylonitrile Acrylonitrile Acrylonitrile Acrylonitrile Acrylonitrile-EPDM-styrene copolymer Acrylonitrile styrene copolymer Acrylonitrile-styrene alternating copolymer Acrylonitrile-acrylate-styrene copolymer Acrylonitrile-methyl acrylate copolymer Acrylonitrile-vinyl chloride copolymer Ref : K. Matsui et al., 12th Polymer Analysis & Characterization Japan 2007 II-15 Keywords : Polymer, MS Library Applications : General polymer analysis Acrylonitrile-EPDM styrene copolymer Acrylonitrile styrene copolymer Acrylonitrile-styrene alternating copolymer Acrylonitrile-acrylatestyrene copolymer Butanol 1-Butene [min] Fig. 2 Comparison of pyrograms of unknown and candidate polymers : Registered trademark of
88 Double-Shot Pyrolyzer Technical Note ( PYA1-062E ) Pyrolysis GC/MS of Tobacco in air and helium [Background] It is often instructive to compare the pyrogram of a material pyrolyzed in an inert atmosphere (e.g. He) with one obtained in an oxidative atmosphere (e.g. air). The comparison often yields information on the degradation process. Differences in the two pyrograms can be attributed to the oxidation of some sample constituents during the pyrolysis at elevated temperatures. Exposure to pyrolyzates found in the emissions of a material as it is burned may have health effects and be of general interest. Such is the case for tobacco. Temperatures reached during the burning of tobacco often exceed 700ºC. Here, the pyrolysis of tobacco was performed and pyrolyzates were examined. [Experimental] Pyrograms were obtained in air and He at 600 and 800ºC using PY-GC/MS. See below for analysis conditions. The peak identifications are based upon MS data. [Results] There are significant differences between the left (He) and right (air) pyrograms below. Nicotine found in He at 600ºC is thermally decomposed to nicotinonitrile, and the peak for acetic acid is greatly reduced at 800ºC. In an oxidative atmosphere, nicotine is degraded to 3-vinylpyridine and the formation of benzene is evident at 800ºC. In He nicotine In Air nicotine acetic acid 600ºC 600ºC acetic acid acrylonitrile benzene nicotinonitrile 1,3-pentadiene 800ºC 800ºC benzene toluene 3-vinylpyridine toluene styrene Figure 1 Pyrograms of tobacco obtained at 600ºC and 800ºC in air and in helium Pyrolyzer temperature: 600/800ºC, GC injection port: 320ºC, GC oven : 40(2 min hold)-320ºc (20ºC/min), Separation column : Ultra ALLY-1 30m x 0.25mm i.d., 0.5µm film, Column flow :1.0 ml/min, Split ratio: 1/50, Sample wt.: ca 0.5 mg, ther devices : Carrier Gas Selector, Selective Sampler, MicroJet Cryo-Trap Keyword : Tobacco, xidative pyrolysis, 600ºC, 800ºC Applications : Combustion gas, Atmosphere analysis, Smoke hazard Related technical notes : Please forward your inquiries via our web page or send us a fax message. R&D and manufactured Saikon, Koriyama by : Frontier Fukushima-ken Laboratories Ltd. JAPAN, Fukushima JAPAN Phone: : Registered (81) trademark Fax: of (81) Double-Shot Pyrolyzer is a registered trademark of Your dealer:
89 Double-Shot Pyrolyzer Technical Note ( PYA1-063E ) Analysis of phthalates in PVC by thermal desorption GC/MS Part 1: Determination of thermal desorption temperature zone by EGA [Background] Phthalates are widely used as plasticizers in the plastic industry to enhance product durability. It has been determined that many of the phthalates have a detrimental effect on human health. The phthlates listed in Table 1 are now regulated by the EU (Directive 2005/84/EC) and the US (Consumer Product Safety Improvement Act, Section 108). All the current methodologies for the determination of these six phthalates are based on solvent extraction, filtration and concentration. These methods are cumbersome, time-consuming and often produce data of limited value. This note describes how evolved gas analysis (EGA)-MS is used to determine the thermal zone in which the target compounds evolve as the sample is heated. [Experimental] The conditions for the EGA-MS analysis are found in the figure below. The Sample consisted of small pieces of a PVC toy taken from ten different locations using a Harris Micropuncher (2 mm in diameter). They were dissolved in 1 ml of THF (50 mg/ml). Six different phthalates were added to the THF solution. 10µL of the THF spiked solution was added to a sample cup; the solvent was evaporated leaving a thin film of the sample on the surface of the cup (ca. 0.5mg). [Results] Fig. 1, Extracted ion chromatograms (EICs) are used to determine the thermal zone for each of the phthalates and the hydrogen chloride that is generated as PVC is heated. Using average mass spectrum, the first peak is identified as DINCH (1,2 cyclohexane dicarboxylic acid di-isononyl ester). It is critical to ensure that the ions used to monitor the six phthalates can be differentiated from ions produced by non-target additives, like DINCH. The EICs clearly show that the temperature range in which all six phthalates are thermally desorbed is 100 to 350ºC. (The quantitative determination of phthalates in the toy sample by TD-GC/MS is described in Technical Note PYA1-064E.) x riginates from additives Mass spectrum m/z riginates from PVC 1,2-Cyclohexane dicarboxylicacid di-isononyl ester (DINCH) 299 C 9 H 19 C 9 H 19 Table 1. Use restricted phthalates (0.1% upper limit by Directive 2005/84/EC) m/z 36: PVC (HCl) m/z 149: phthalic ester common ion m/z 206: BBP m/z 223: DBP m/z 279: DEHP, DNP Di(2-ethylhexyl)phthalate (DEHP) Dibutylphthalate (DBP) Butylbenzylphthalate (BBP) Diisononylphthalate (DINP) Diisodecylphthalate (DIDP) Di(n-octyl)phthalate (DNP) m/z 293: DINP m/z 307: DIDP Thermal desorption zone:100~350 ºC Fig. 1 TIC thermogram and extracted mass chromatograms of PVC, to which 1% of each phthalate was added Pyrolyzer: ºC (20ºC/min), GC oven temp.: 300ºC, EGA tube: UADTM-2.5N (L=2.5 m, i.d.=0.15 mm), Column flow rate: 1 ml/min; He, Split ratio: 1/20, Inj. port temp.: 320ºC Keyword : Restricted phthalates, plastic toy, thermal desorption temperature, EGA, thermogram Applications : Restricted phthalates, plasticizer Related technical notes : PYA1-064E Ref: T. Yuzawa, et al., Anal. Sci., 25 (2009),1057 Please forward your inquiries via our web page or send us a fax message. R&D and manufactured Saikon, Koriyama by : Frontier Fukushima-ken Laboratories Ltd. JAPAN, Fukushima JAPAN Phone: : Registered (81) trademark Fax: of (81) Double-Shot Pyrolyzer is a registered trademark of 363 Vintage Park Drive
90 Double-Shot Pyrolyzer Technical Note ( PYA1-064E ) Analysis of phthalates in PVC by thermal desorption GC/MS Part 2: Effect of sample form on reproducibility [Background] It has been reported (PYT-018) that the reproducibility depends on the sample form (fine power/thin film). This technical note illustrates how sample form influences reproducibility when performing TD-GC/MS. [Experimental] The TD-GC/MS system consists of a double-shot pyrolyzer interfaced directly to the split/splitless injection port of a GC/MS. Solid samples were milled to 45 mesh, and thin films were prepared by solvent casting (adding a liquid to the sample cup and then evaporating the solvent as described in technical note PYA1-063E). The thermal desorption for the phthalates of interest was ºC, as described in PYA1-063E. The concentration of the phthalates in the sample were calculated using an absolute area calibration. [Results] Fig. 1 shows a TIC chromatogram obtained by TD-GC/MS. DINCH, a non-phthalate plasticizer, was identified as the major component in the minute retention window. Compounds having fragment ions m/z 149, 223, 273 were found at 11 and 16 min. Based on the mass spectra and retention times, these peaks are identified as DBP and DEHP. The concentration of the two phthalates is ca. 50 and ca. 300 ppm, respectively. The reproducibility (n=5) of the DEHP concentration is 5% RSD for the powder, and 1% for the thin film. The difference between the two can be attributed to the lack of homogeneity of the solid sample. This simple example clearly shows that TD-GC/MS is a viable technique and that a thin films yield the best analytical precision (i.e., reproducibility). DBP(dibutyl phthalate) : ca. 50 ppm DEHP (di-2-ethylhexyl phthalate) : ca. 300 ppm C 9 H 19 C 9 H 19 x C 4 H 9 C 4 H iso C 8 H 17 iso C 8 H ,2-Cyclohexane dicarboxylic acid di-isononyl ester (DINCH) Non-phthalate plasticizer m/z m/z 0.5 TIC min m/z 149: Phthalates (common ion) m/z 223: DBP m/z 279: DEHP min Fig. 1 TIC and extracted ion chromatograms of a PVC sample obtained by TD-GC/MS Thermal desorption temp: ºC (40ºC/min, 3 min), GC oven temp: ºC (10ºC /min, 6 min), Separation column*: Ultra ALLY + -1 (polydimethylsiloxane, L=30 m, i.d.= 0.25 mm, df=0.05 µm), Column flow rate: 1 ml/min He, Split ratio: 1/20 * For separation column, please use Ultra ALLY + -5 (5% diphenyl Ref: T. Yuzawa, et al., Anal. Sci., 25 (2009), % dimethylpolysiloxane, L=30 m, i.d.=0.25 mm, df=0.25µm). Keyword : Phthalates, Simple TD-GC/MS quantitative analysis, Reproducibility, Sample form (power, thin film) DBP, DEHP, Toy Applications : Additive analysis, Simple quantitative analysis, Sample form Related technical notes : PYA1-063E, PYT-018 Please forward your inquiries via our web page or send us a fax message. R&D Frontier and manufactured Laboratories by : Ltd., Fukushima JAPAN Phone: (81) Fax: (81) : Registered trademark of Double-Shot Pyrolyzer is a registered trademark of
91 Double-Shot Pyrolyzer Technical Note Identification of the additives in polystyrene using the F-Search additive library ( PYA1-066E ) [Background] Polymeric materials generally contain a variety of additives such as antioxidants, UV absorbers, etc. The method of choice for characterizing the various additives in a given polymeric matrix is thermal desorption (TD)-GC/MS. The sample is analyzed directly which means that cumbersome and time-consuming sample pretreatments (e.g., solvent extraction, filtration, etc.) are unnecessary. Generally, compounds are identified using commercial mass spectral (MS) libraries such as Wiley or NIST; however, these general purpose MS libraries contain very few entries for pyrolyzates and additives which severely limits their utility for polymer characterization. This note illustrates how the F-Search additive library (ADD-MS08B) can be used to identify unknown additives in polystyrene (PS). The library includes both chromatographic and mass spectral data for 358 additives. [Experimental] A double-shot pyrolyzer (model 2020iD) was installed on a GC/MS. Both the deactivated metal capillary tube (EGA) and the metal capillary separation column (TD) were interfaced to the MS using a vent-free GC/MS adaptor. 50µL of a 20 mg/ml dichloromethane solution was added to a sample cup and the solvent was allowed to evaporate prior to analysis. The analytical conditions are provided in the figure captions. [Results] (EGA)-MS was utilized to determine the thermal desorption zone of the volatile additives - see Fig. 1. This thermal zone (( ºC) was analyzed using TD-GC/MS. Each peaks was tentatively identified using the F-Search additive library. Ten additive were identified based on mass spectral match quality and retention indices. TD-GC/MS: total ion chromatogram Styrene 1) Dibromophenol 2) BHT Styrene dimers 3) Tunuvin P 4) Triphenylphosphate 5) Sumilizer MDP-S Styrene trimers 6) Tinuvin 770 x10 Additives ºC Fig.1 EGA Thermogram of PS PS ºC Py furnace temp.: ºC (20ºC/min), GC oven temp.: 300ºC, EGA tube: UADTM-2.5N(L=2.5 m, i.d mm), column flow rate: 1 ml/min He, split ratio: 1/50, sample: 0.1 mg (Paraffin oil) 7) Irgafos 168 8) Irganox ) Adecastab PEP-36 10) Brominated compound min Fig. 2 Library search results Pyrolyzer temp.: ºC (20ºC/min, 5 min), GC oven temp.: 40ºC (2 min) - 320ºC (20ºC/min), separation column: Ultra ALLY + -5 (5% diphenyl 95% dimethylpolysiloxane) (L=30 m, i.d.=0.25 mm, df=0.05 µm), column flow rate: 1 ml/min He, split ratio: 1/20, scan rate: 2 scans/sec, scan range: (m/z), sample: 1 mg Reference: K. dagiri et al., 13 th Polymer Analysis and Characterization (2008), II-11 Keyword : F-Search, Additives MS library, Polystyrene, Additive, Thermal desorption analysis, Evolved gas analysis Applications : Additives analysis Related technical notes : PYA1-054E, PYA1-057E Please forward your inquiries via our web page or send us a fax R message. & D and manufactured by: R&D and manufactured Saikon, Koriyama by : Frontier Fukushima-ken Laboratories Ltd. JAPAN, Fukushima JAPAN Phone: : Registered (81) trademark Fax: of (81) Double-Shot Pyrolyzer is a registered trademark of
92 Double-Shot Pyrolyzer Technical Note ( PYA1-067E ) Using a MS library to differentiate black ballpoint pen inks by Py-GC/MS [Background] Black ballpoint pens are one of the most widely used writing instruments; therefore the characterization of the ink is of interest to forensic chemists. Inks can often be differentiated based upon the their pyrograms. The pyrograms of 35 commercially available inks were used to create an ink library. An unknown ink was then analyzed and identified using the newly created library. [Experimental] Each ink was scribed onto copy paper. A 5mm square of the marked paper was punched out and placed in a sample cup. 50 µl of dichloromethane was added to extract the ink components. The paper was subsequently removed and the solvent was evaporated using N 2. The sample was pyrolyzed at 550ºC. The integration-summation (INT-SUM) mass spectrum was calculated for each pyrogram. These were used to construct an ink MS library. ne arbitrarily selected ink was used to test the viability of the library. [Results] Pyrograms of the unknown and four inks stored in the library are shown in Figure 1. The major components of each ink are solvents such as phenoxyethanol and dimethyl aniline. All elute before 7 min on the pyrogram. Inks A through D showed similar pyrograms; however, small peaks are observed after 7 min. These are dyes and additives and differ from ink to ink. It is difficult to differentiate the inks using only the INT-SUM* mass spectra (Fig. 2(a)), because of the presence of ions m/z 77, 94, and 138 which are from the phenoxyethanol. Thus, a second INT-SUM mass spectra was created from components eluting after 7 min on the pyrogram (Fig. 2 (b)). Now, significant differences in match quality are observed and the unknown ink can easily be identified as Ink C. ne way to differentiate samples with similar major components is to exclude the common components when constructing the library. (*JP Pat: ) Dimethyl aniline Phenoxyethanol Methyl aniline Benzyl alcohol Unknown : Common ions for major components of inks such as phenoxyethanol Ink A Unknown Ink A Match quality: 88% Match quality: 6% Ink B Ink B Match quality: 94% Match quality: 23% Ink C Ink C Match quality: 99% Match quality: 99% Ink D Ink D Match quality: 95% Match quality: 67% min Fig. 1 Pyrograms of oil-based black ballpoint pen inks Pyrolysis temp.: 550ºC, GC oven: ºC (20ºC/min) Separation column: Ultra ALLY + -5 (5% diphenyl 95% dimethylpolysiloxane, L=30 m, i.d.=0.25 mm, df=0.25 µm), Carrier gas: 1 ml/min, He Split ratio: 1/50, sample: ca. 200 µg m/z (a) Mass spectra created from entire pyrogram (0-20 min) m/z (b) Mass spectra created from pyrograms of components eluting after 7 min. Fig. 2 Comparison of mass spectra created (a) from entire pyrogram and (b) from components eluting after 7 min. Ref: Watanabe et al., 8 th annual meeting of Japan Association of Forensic Science and Technology (2002) Keyword : il-based black ballpoint ink, Water soluble, non soluble black ink, Forensic discrimination, MS library Applications : Identification, Forensic investigation, Printing Related technical notes : PYA3-013E Please forward your inquiries via our web page or send us a fax message. R&D and manufactured Saikon, Koriyama by : Frontier Fukushima-ken Laboratories Ltd. JAPAN, Fukushima JAPAN Phone: : Registered (81) trademark Fax: of (81) Double-Shot Pyrolyzer is a registered trademark of
93 Multi-functional Pyrolyzer Technical Note ( PYA1-068E ) Determination of phthalates in PVC by thermal desorption-gc/ms Part 1: Determination of the thermal desorption temperature zone by EGA [Background] Phthalates are widely used in the plastic industry; the six phthalates listed in Table 1 are regulated by the EU and the US when used in toys and other childcare products. In Japan, the Health, Labor and Welfare Ministry guideline No.336 issued on September 6, 2010 regulates the six phthalates listed in Table 1; consequently, the analysis of phthalates is becoming commonplace and there is a near universal interest in a simple, accurate method for analyzing phthalates in polyvinyl chloride (PVC). Traditional (e.g. solvent extraction, filtration, etc.) sample preparation techniques are cumbersome, time consuming and suffer from analyst-to-analyst variability. Thermal desorption (TD)-GC/MS. 1) is a simple, one-step technique which appears to be ideally suited to the analysis of phthalates in PVC. PVC often contains a large amount of other plasticizers (several tens of percent) which co-elute with the phthalates of interest. This so-called matrix interference many lead to either false positives or false negatives. In addition, matrix interference makes an accurate determination of the co-eluting phthalates problematic, at best. This report describes how Evolved Gas Analysis (EGA) GC/MS is used to define the optimal thermal desorption temperature zone for the phthalates of interest. [Experimental] A sheet of PVC containing DINCH at 40% (Fig. 1) and six restricted phthalates at 0.1% each was analyzed. Small pieces ( 20mg) sampled from several different locations were dissolved in 1 ml of THF (20 mg/ml). 10 µl of the solution was placed in a sample cup and the solvent evaporated leaving a thin film of the sample on the surface of the cup. EGA-MS analysis was performed on this sample using a Multi-shot pyrolyzer: EGA/PY-3030D. [Results] The EGA thermogram of the PVC sheet is shown in Fig. 2. It contains peaks originating from the plasticizers, HCl (thermal decomposition of PVC), and aromatic compounds (which are attributed to the thermal decomposition of polyenes upon the dehydro-chlorination of PVC). Characteristic ions for DINCH, HCl, and the phthalates of interest are used to define the optimal thermal desorption temperature zone: ºC. See Technical note PYA1-059E which describes the determination of phthalates in PVC using TD-GC/MS. Table 1. Restricted phthalates (0.1 % upper limit by Directive 2005/84/EC) Di(2-ethylhexyl)phthalate (DEHP) Dibutylphthalate (DBP) Butylbenzylphthalate (BBP) Diisononylphthalate (DINP) Diisodecylphthalate (DIDP) Di(n-octyl)phthalate (DNP) 1,000,000 DINCH / Phthalates PVC min ,000 Sample Temperature m/z 155: DINCH 155 C 9 H 19 C 9 H 19 20,000 6,000 m/z 36: HCl m/z 149: Phthalates m/z min Thermal desorption zone: ºC (20ºC/min, 5 min hold) Fig. 1 Structure and mass spectrum of DINCH DINCH: 1,2-Cyclohexane dicarboxylic acid di-isononyl ester Ref. 1) Yuzawa, et al., Anal. Sci., 25 (2009) 1057 Fig. 2 EGA thermogram and mass fragmentgrams of PVC sample Pyrolyzer: ºC (20ºC/min), GC oven: 300ºC EGA tube: UADTM-2.5N (L=2.5 m, i.d.=0.15 mm) Column flow rate: 1 ml/min He, split ratio: 1/20, injection port temp.: 320ºC Keyword : Use restricted phthalate, infant plastic toy, thermal desorption temperature, EGA, thermogram, PVC Applications : Restricted phthalate, plasticizer Related technical notes : PYA1-063E, PYA1-064E, PYA1-069E Please forward your inquiries via our web page or send us a fax message. R&D and manufactured by : Frontier Fukushima-ken Laboratories Ltd. JAPAN, Fukushima JAPAN Phone: (81) Fax: (81) : Registered trademark of : A registered trademark of 363 Vintage Park Drive
94 Multi-functional Pyrolyzer Technical Note ( PYA1-0069E) Determination of phthalates in PVC by thermal desorption-gc/ms Part 2: Calibration using absolute calibration method and standard addition [Background] Using the thermal desorption temperature zone described in PYA1-068E, two different calibration methods (absolute calibration and standard addition) were evaluated in order to determine which method most effectively reduces or eliminates the matrix effects caused by the presence of a large amount of plasticizers in the sample. [Experimental] The thermal desorption (TD)-GC/MS system consisted of a Multi-shot pyrolyzer (EGA/PY-3030D) interfaced to the split/splitless injection port of a GC/MS. A thin film (0.2mg) of the PVC-DINCH sample was prepared as described in PYA1-068E. The thermal desorption temperature zone was ºC. A calibration standard (Ph-Mix) containing 0.1% of each phthalates was used. Identification was based on the retention time of the each phthalate s characteristic ion and the common m/z149 ion. Quantitation was based on the peak area of the characteristic ion. [Results] No DINCH interferences were observed for DBP, BBP, and DEHP, and both methods gave similar results Fig.1. However, DNP, DINP, and DIDP co-elute with the DINCH peak envelop which potentially will degrade the accuracy of the phthalate concentration determination. Specifically, if there is no DINCH in the sample the retention time of DNP shifts and the peak width at half-height is double what it is when the sample contains DINCH. In addition, the peak height is 60% lower when DINCH is present; consequently, when the absolute calibration method is used, the concentrations of DNP, DINP, and DIDP are higher than the true value of 0.1% n the other hand, the concentration of the phthalates obtained using the standard addition method are very close to the true value of 0.1%. The results show that standard addition is the preferred method when quantitating phthalates in PVC using TD-GC/MS. Standard addition minimizes the interference when high concentrations of plasticizers which co-elute with the phthalates of interest are present. DINCH 1.0e+07 60,000 DBP BBP DEHP DNP DINP DIDP TIC min m/z 223: DBP 1.0e+07 60,000 DBP BBP DEHP DNP DINP DIDP TIC min m/z 223: DBP 100,000 m/z 206: BBP 100,000 m/z 206: BBP 60,000 m/z 279: DEHP, DNP 60,000 m/z 279: DEHP, DNP 2,000 m/z 293: DINP 6,000 m/z 293: DINP 2,000 4,000 m/z 307: DIDP m/z 307: DIDP min min (a) Ph-Mix (0.1% each) (b) PVC-DINCH (Contains 0.1% each Ph) Fig.1 TD chromatograms of samples and effects of DINCH interference to phthalates (TD: ºC/min, 5 min hold) Table 1 Reproducibility of the phthalate peak area when using two calibration methods Phthalate: 0.1% each DBP BBP DEHP DNP DINP DIDP %RSD (n=5) Quantified value (%) Absolute calibration Standard addition Keyword : Restricted phthalate, plasticizer, absolute calibration, standard addition, thermal desorption, infant plastic toy Applications : Restricted phthalates, plasticizer Related technical notes : PYA1-063E, PYA1-064E, PYA1-068E Please forward your inquiries via our web page or send us a fax message. R&D and manufactured Saikon, Koriyama by : Frontier Fukushima-ken Laboratories Ltd. JAPAN Saikon, Koriyama, Fukushima JAPAN Phone: : Registered (81) trademark Fax: of (81) : A registered trademark of
95 Multi-functional Pyrolyzer Technical Note Analysis of surface active agent in mineral oil by Heart-cut EGA-GC/MS ( PYA1-070E ) [Background] Mineral oils are widely used as raw materials in the production of lubricants and cosmetics. Depending on the application, a variety of additives such as surface active agents are added to modify the properties of the mineral oil. The additives in the oil are analyzed by GC/MS; however, mineral oils are complex hydrocarbons mixtures. ften the additive of interest is difficult to identify and quantitate due to the hydrocarbon interference. This report describes the analysis of a surface active agent in mineral oil by using the Heart-cut EGA-GC/MS technique. The heart cut is chosen so that only the portion of the sample containing the target compounds are transferred to the separation column. The portion of the sample eluting before the target compound(s) is vented. The portion of the sample eluting after the target compound(s) remains in the sample cup. [Experimental] The sample was a mineral oil: Hygold 100 (Ergon Refining, USA). Hygold 100 contains about 500 ppm of sodium di(2-ethylhexyl)sulfosuccinate (DESS) as a surface active agent. The Double-Shot pyrolyzer included a selective sampler. The selective sampler enables the analyst to either vent or analyze individual EGA thermal zones. [Results] The EGA thermograms of Hygold 100 and DESS are shown in Fig. 1. The hydrocarbons which make up the bulk of Hygold 100 evolve between ºC. DESS decomposes between ºC to give di(2-ethylhexyl)fumarate (DEF). Fig. 2 shows the assumed mechanism in which NaS 3 is eliminated from DESS to form DEF. Based on this result and using the peak of DEF formed during the thermal desorption between ºc, the quantitative analysis of DESS in Hygold 100 can be done. However, when a Hygold 100 sample containing about 500 ppm of DESS was analyzed by thermal desorption GC/MS without heart-cutting, the DEF peak co-eluted with the hydrocarbons present in Hygold 100 as shown in Fig. 3-a; consequently DEF could not be identified using the TIC. The only indication that DEF was present was the mass chromatogram (m/z 112), with a S/N of 11. The impact of the interfering compounds on the DEF determination was reduced by heart-cutting the temperature zone over which DEF is formed. The result obtained by heart-cutting the ºC zone (Fig. 1) is shown in Fig. 3-b. Interference with the DEF peak was almost eliminated. DFE could be clearly observed even on the TIC. n the mass chromatogram, the S/N ratio was improved by a factor of 10. Reproducibility was 4.7 %RSD (n=5) which was well within project s DQ (data quality objectives). The heart-cutting technique can easily be automated using the Multi-Shot Pyrolyzer with Auto-Shot sampler. Hygold100 (Mineral oil) DESS (Surfactant) 160 ºC Mass Spectrum of DEF m/z ºC 10 ºC/min Fig. 1 EGA thermograms of DESS and Hygold100 a. Without Heart-cut ºC b. With Heart-cut TIC m/z: 112 TIC DEF S/N: 11 Hydrocarbons from Hygold 100 DESS DEF S 3 Na Heat - NaS ºC 160 m/z: 112 S/N: min Fig. 3. Quantitative analysis of DESS (500 ppm) contained in Hygold100 using Heart cut GC/MS Pyrolysis temp.: ºC ( 10 ºC/min), GC oven temp.: ºC (20 ºC/min, 4 min ) Separation column: Ultra ALLY + -5 ( 5 % diphenyl 95 % dimethylpolysiloxane, L = 30 m, i.d. = 0.25 mm, df = 0.25 µm ), Column flow rate: 1 ml/min He, split ratio: 1/20, sample: 100 µg Fig. 2 Thermal decomposition of DESS Keyword : Mineral oil, surface active agent, Heart-cut, Thermal desorption, GC/MS Applications : Fats and oils, Cosmetics Related technical notes : PYA1-012E, PYA1-031E Please forward your inquiries via our web page or send us a fax message. R&D Frontier and manufactured Laboratories by : Ltd., Fukushima JAPAN Phone: (81) Fax: (81) : Registered trademark of : A registered trademark of

96
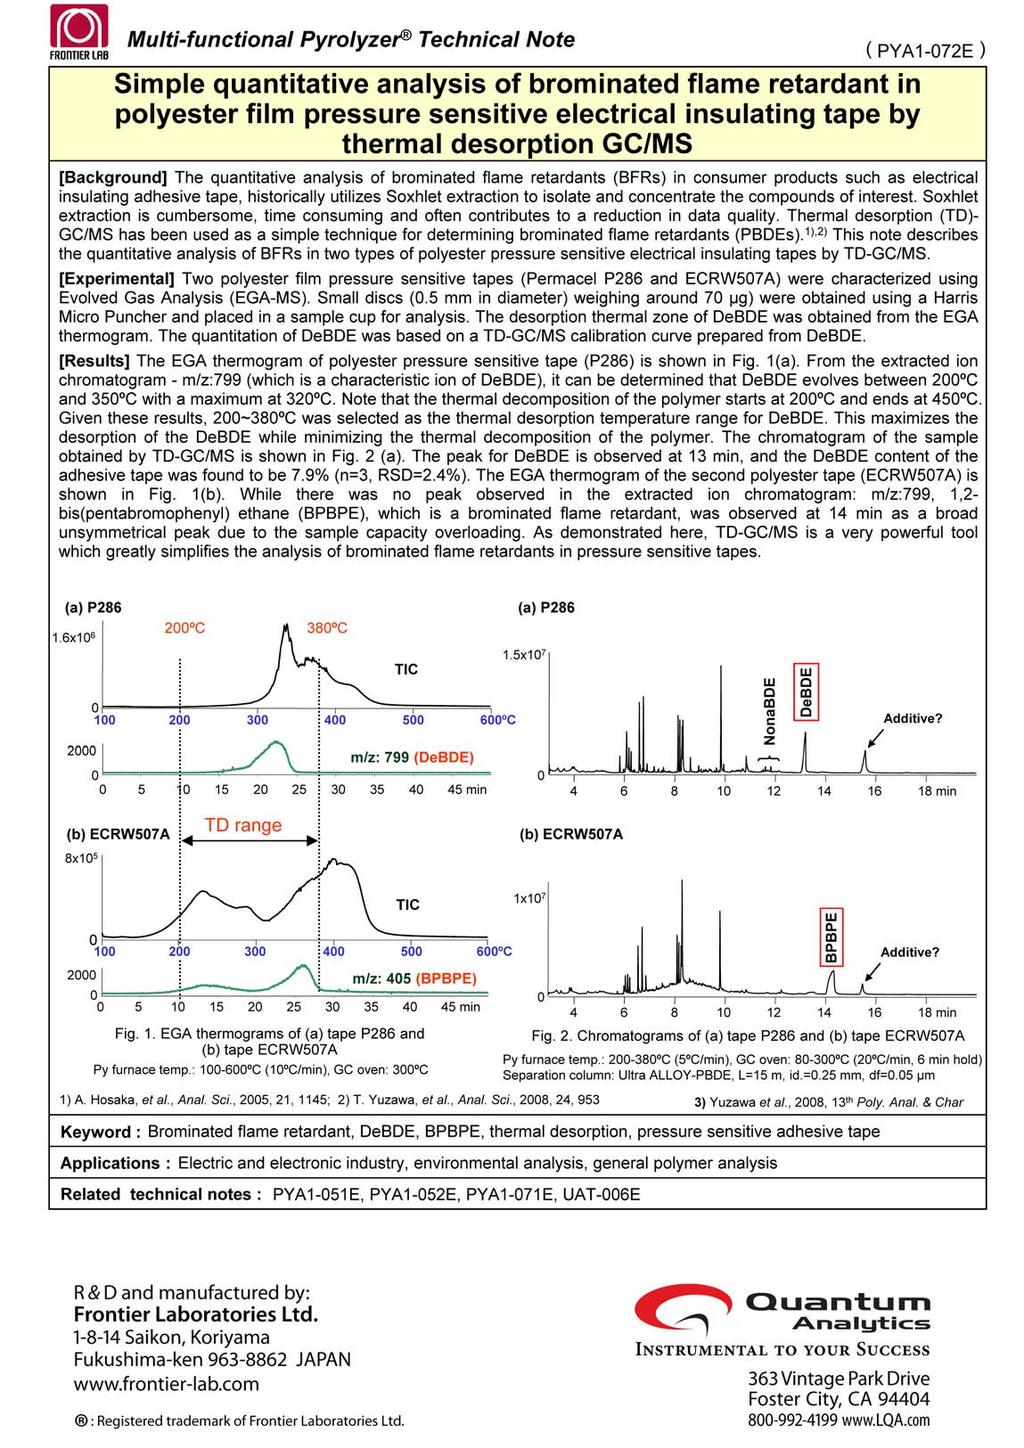
97
98 Multi-functional Pyrolyzer Technical Note ( ) PYA1-073E Thermal desorption GC/MS of brominated flame retardant - ptimization study of PY/GC interface and GC injector temperatures for EGA/PY-3030D - [Background] With regard to the analysis of brominated flame retardant (eg. PBDE) using thermal desorption GC/MS, extended studies on the optimization of analytical conditions have been reported. 1,2 ) However, such studies have been done using the previous model Double-Shot Pyrolyzer (PY-2020iD). The Multi-Shot Pyrolyzer (EGA/PY-3030D) has been significantly improved in terms of the pyrolyzer-gc injector interface design; therefore, it was considered that temperatures of the pyrolyzer-gc injector interface (PY/GC-ITF) and of the GC injector could be lowered without deterioration of performance. Lowered temperatures help not only reduce the thermal decomposition of target compounds in the flow path, but also extend the life of the injector septum. [Experimental] A certified polystyrene standard (obtained from AIST, Japan) containing 317 ppm of decabromodiphenylether (DeBDE) was used for analysis, and the previously recommended conditions (PY ITF: 340ºC, GC injector: 320ºC ) for PY-2020iD was compared, in terms of reproducibility of repeated runs of DeBDE samples, with new conditions for EGA/PY-3030D (PY ITF: 300ºC, GC injector 300ºC). [Results] A chromatogram obtained by thermal desorption GC/MS is shown in Fig. 1. The peak for the characteristic ion of DeBDE (m/z 799) is clearly observed in the extracted ion chromatogram. The peak area counts obtained by eight repeated runs for both methods are shown in Table 1. As clearly seen, similar results were obtained for both methods with good reproducibilities of less than 5 % RSD. This indicates that when using EGA/PY-3030D, PY ITF and GC injector temperatures can be as low as 300ºC, lower than those recommended for PY-2020iD. x Styrene trimers 2 x 10 6 DeBDE Waxes m/z 799 TIC min Fig. 1 Chromatogram of certified polystyrene standard obtained by thermal desorption GC/MS Pyrolyzer furnace temp.: ( 20 ºC/min ) 340ºC ( 5 ºC/min, 1 min hold ) GC oven temp.: ºC ( 20 ºC/min, 3 min hold ) Separation column: Ultra ALLY-PBDE ( dimethylpolysiloxane, L=15 m, id=0.25 mm, df=0.05 µm ) Carrier gas: He, 1 ml/min, split ratio: 1/20, sample amount: 500 µg Table 1 Comparison of peak areas and reproducibilities of DeBDE n LD *1 NEW * Average RSD (%) *1 ld: PY ITF 340ºC, GC injector 320ºC *2 New: PY ITF 300ºC, GC injector 300ºC 1 ) A. Hosaka, et al., Anal. Sci., 2005, 21, 1145; 2 ) T. Yuzawa, et al., Anal. Sci., 2008, 24, 953 Keyword : Brominated flame retardants, Decabromodiphenylether, RoHS directive, TD-GC/MS, PY/GC-ITF temp., GC injector temp. Applications : Electrical / Electronic industry, Environmental analysis, General polymer analysis Related technical notes : PYA1-071E, PYA1-072E : Registered trademark of 3400 East Third Avenue
99 Double-Shot Pyrolyzer Application Note (PYA2-001E) Analysis of Terminal Groups of Polycarbonate (PC) by Reactive Pyrolysis Determining the structure and distribution of a polymer s terminal groups is important, because these groups have a large influence on the material properties. Pyrolysis gas chromatography (Py-GC) is a rapid and effective technique for determining terminal groups. But in the simple pyrolysis of polymers such polyesters, the pyrolysis products from the terminal groups are masked by a large peak arising from polar material in the polymer. To analyze such samples, reactive pyrolysis with tetramethyl ammonium hydroxide, TMAH, is used. Strongly basic TMAH selectively cleaves the ester bond, allowing the resultant products to immediately undergo methyl esterification, resulting in a simplified pyrogram. Fig. 1 figure shows a pyrogram of reactive pyrolysis of polycarbonateusing TMAH. Bisphenol A, is formed from the polymer main chain, and a methylester of p-tert-butylphenol is formed from terminal groups. In Table 1, the determination of the terminal group shows an extremely high reproducibility of 0.61% RSD. This analysis is best done with a pyrolyzer with a vertical furnace with rapid gravity-driven sample introduction, so that the sample temperature can be kept at ambient, then very rapidly raised to the pyrolysis temperature. This avoids sample loss or decomposition by secondary reactions during slow heating. C C C C C C C C n CH3 Table 1. Quantification of Terminal Group and Reproducibility n Peak area of methyl p-tert-butylphenol (%) C H3C C C C C H3C C C Average RSD 0.61% Fig. 1 Cleavage Mechanism of PC in Reactive Pyrolysis, and Pyrogram Pyrolysis temp.: 400ºC, Carrier gas : He 140kPa, 80ml/min, Column : 5% diphenyldimethylpolysiloxane, 30m, 0.25mm id. Layer thickness 0.25µm, (Ultra ALLY + -5, ) GC oven temp. : 40ºC (1min) 220ºC/min 320ºC, GC injection temp.: 320ºC, Sample: 20µg, TMAH : 3uL, Detector : FID Keyword : Reactive Pyrolysis, Polycarbonate, Terminal Group, TMAH Application : General Polymer Analysis : Registered trademark of
100 Double-Shot Pyrolyzer Application Note (PYA2-002E) Analysis of Diethylene Glycol (DEG) in Polyethylene Terephthalate (PET) PET contains a small amount of residual dimerized DEG which is produced by dehydration of ethylene glycol (EG) during polymerization process. It is essential to determine the amount of DEG for the quality and process management, because the property of PET is greatly influenced by the amount of residual DEG. Conventionally, hydrazinolysis has been used for this analysis, however; problems with this method are: (1) time consuming sample pretreatment is required, and (2) the process is complicated. n the other hand, the reactive pyrolysis using tetramethyl ammonium hydroxide [TMAH: (CH3)4NH] (See PYA2-001E) is a quick and easier analytical technique requiring no pretreatment. A pyrogram obtained by reactive pyrolysis of PET is shown in Fig. 1. Peaks originated from EG, the main component, and terephthalate are observed, in addition to smaller peaks originated from DEG (underscored). Fig. 2 shows DEG/EG ratios determined both by the reactive pyrolysis and hydrazinolysis. It is evident that both of these methods give almost the same results. These results demonstrate that the reactive pyrolysis is an easy and convenient technique, replacing conventional methods. 0.1 CH3CH2CH2CH3 (EG origin) Reactive Peak are of Pyrolyzate (DEG/EG molar ratio) 0.05 CH32C C2CH Hydrazinolysis (DEG/E molar ratio) Fig. 2 Reactive Pyrolysis and Hydrazinolysis CH3CH2CH2H (EG origin) CH3CH2CH2CH2CH2CH3 (DEG origin) Fig. 1 Pyrogram of PET by Reactive Pyrolysis Pyrolyzer : PY-2020D (), Pyrolysis temp.: 400ºC) Some Recent Applications of Py-GC by Kiura, Wakabayashi of Mitsubishi Rayon, 2nd Pyrolysis GC Seminar in 1998 (hosted by Frontier Lab Ltd.) Keyword : Diethylene glycolpet, Reactive Pyrolysis, TMAH, Hydrazinolysis Application : General Polymer Analysis, Fiber Industry, Quality Management, Process Management : Registered trademark of
101 Double-Shot Pyrolyzer Application Note (PYA2-003E) Simple Determination of Cellulose by Reactive Pyrolysis in Presence of Cobalt Sulfate (CoS 4 ) Cellulose is used in pharmaceutics, cosmetics, foods, paints, etc. in addition to paper products. Infrared spectrometer or pyrolysis gas chromatography (Py-GC) has been used for quantification of cellulose, however, results are not always satisfactory. Fig. 1a shows a pyrogram obtained by conventional Py-GC technique. Pyrolyzates of cellulose shows up as complicated peak pattern consisting of over 50 peaks with levoglucosan as the major component, and it therefore results in poor reproducibility of about 30% relative standard deviation (RSD). Hence, 5µl of a cobalt sulfate solution (140µg/µl) was added to 0.2mg of sample. The resulting sample was dried, then was subjected to reactive pyrolysis. Fig. 1b shows simplified pyrogram thus obtained, showing furfural as the major component. Quantitative analysis of cellulose using the peak area of furfural gave a satisfactory reproducibility of 2.7% RSD. This demonstrates that Py-GC utilizing reactive pyrolysis in the presence of CoS 4 can favorably be applied to the determination of cellulose contained in various samples. C a. Conventional method (Pyrolysis temp: 550ºC) Levoglucosan C H H C C H C Furfural C C CH C C b. Reactive pyrolysis with CoS 4 (Pyrolysis temp: 550ºC) min Fig. 1 Simplification of Pyrogram of Cellulose by CoS 4 PY : Double-Shot Pyrolyzer (PY-2020D), Detector : Flame ionization detector (FID) Carrier gas : He, Flow rate : 1.2ml/min, Split ratio : 1/80 Separation column : Ultra ALLY + -5 (5% diphenyldimethylpolysiloxane), Length : 30m, Id : 0.25mm, Film thickness : 0.5µm GC oven temp. : 40 ~ 320ºC (2min) at 20ºC/min, GC injection port temp. : 320ºC, Sample : ca. 0.2mg, Amt. of CoS4 added : 1.4mg Keyword : Reactive Pyrolysis, Cobalt Sulfate, Cellulose, Quantitative Analysis Application : Paper Industry, Pharmaceutics, Cosmetics, Foods, Chemical Industry : Registered trademark of
102 Double-Shot Pyrolyzer Application Note (PYA2-004E) Composition Analysis of Fully Aromatic Polyester by Py-GC Utilizing Reactive Pyrolysis In analysis of polyesters and other condensation polymers by the Py-GC technique, reactive pyrolysis in the presence of tetramethyl ammonium hydroxide (TMAH) is very useful. Ester bonds of fully aromatic polyesters, in particular, are almost completely hydrolyzed with this method to give corresponding methylesters quantitatively. For example, Fig. 1 shows a pyrogram of reactive pyrolysis of a fully aromatic polyester made from p-hydroxy benzoic acid (PHB), terephthalic acid (TA) and 4,4-bisphenol (BP). nly the peaks of methyl derivatives of monomers are observed, indicating that the polyester is completely hydrolyzed into monomers. Fig. 2 shows the analysis result of another polyester prepared from the same monomers at different feed ratios. It is evident that the result is in a good agreement with the feed ratios. These results demonstrate that Py-GC utilizing reactive pyrolysis is a particularly useful technique for composition analysis of fully aromatic polyesters. molar content determined by PyGC (%) Fig. 2 TA BP PHB molar content in feed (%) PHB TA,BP Correlation of Composition Analysis Result and Monomers Feed Content of Fully Aromatic Polyester by Reactive Pyrolysis 3HC CCH3 (Dimethyl PHD) 3HCC CCH3 (Dimethyl TA) H3C CH3 (Dimethyl BP) Methanol and TMAH Keyword min Fig. 1 Pyrogram of a Fully Aromatic Polyester by reactive pyrolysis Pyrolyzer furnace temp.: 400ºC, Carrier gas: N 2, Flow rate: 0.6mL/min, Split ratio: 1/80, Column: 5% diphenylpolysiloxane, Length: 30m, id: 0.25mm, Film thickness: 0.25µm, GC oven temp.: 80~280ºC (at 8ºC/min), Sample: 50µg, TMAH: 1µL (25wt% methanol solution), FID Courtesy from H.htani and S.Tsuge of Nagoya University : Aromatic Polyester, Composition Analysis, Reactive Pyrolysis, TMAH Application : General Polymer Analysis : Registered trademark of
103 Double-Shot Pyrolyzer Technical Note (PYA2-005E) Analysis of Polybutylene Terephthalate (PBT) by Reactive Pyrolysis When analyzing condensation polymers such as polybutylene terephthalate (PBT) by Py-GC technique, reactive pyrolysis in the presence of tetramethyl ammonium hydroxide (TMAH) gives constituent monomer of methyl ester. Fig. 1 shows a pyrogram obtained by flash pyrolysis of PBT, and Fig 2 shows a pyrogram obtained by reactive pyrolysis in the presence of TMAH. Flash pyrolysis technique gave products arising from decomposition and decarboxylation of ester group, but no monomer. n the other hand, reactive pyrolysis gave PBT constituent monomer of dimethyl derivatives of terephthalic acid and mono and dimethyl derivatives of 1,4-butanediol ,3-Butadiene Butenyl benzoate Dibutenyl terephthalate H C 2C=HCH 2CH 2C 2C 2CH 2CH 2CH=CH 2 Pyrolysis temp. 500 C Benzoic acid C 2H C 2CH 2CH 2CH=CH 2 Butenyl terephthalate H 2C=HCH 2CH 2C 2C C 2H Fig. 1 Pyrogram btained by Flash Pyrolysis of PBT Butyleneglycolmonomethyl ether H 3 C H 1,4-Dimethoxybutane H 3 C CH 3 Dimethyl terephthalate H C C 3 2 C 2 CH 3 Reactive pyrolysis temp. 400 C Sample size: 0.1mg Reagent: 2µL of 25% methanl solution of TMAH THF Fig. 2 Pyrogram btained by Reactive Pyrolysis of PBT Analytical conditions: carrier gas: He, Injection port pressure: 103kPa, Split ratio: 1/60, Separation column: Ultra ALLY + -5 (5% diphenyldimethylpolysiloxane) Length: 30m, Id: 0.25mm, Film thickness: 0.25µm, GC oven temp: 38ºC~300ºC (20ºC /min), GC injection port tem: 320ºC Material excerpted from 5. A few recent applications of Py-GC, Kiura, Wakabayashi (Mitsubishi Rayon), 2nd Pyrolysis Gas Chromatography Seminar (hosted by Frontier Lab Ltd.) Keyword: Polybutylene terephthalate, PBT, Reactive Pyrolysis, Tetramethyl ammonium hydroxide, TMAH Applications: General Polymer Analysis : Registered trademark of
 Analysis of Polyethylene Terephthalate (PET) by Reactive Pyrolysis When analyzing condensation polymers such as polyethylene terephthalate (PET) by Py-GC technique, reactive pyrolysis in")
104 Double-Shot Pyrolyzer Technical Note (No. PYA2-006E) Analysis of Polyethylene Terephthalate (PET) by Reactive Pyrolysis When analyzing condensation polymers such as polyethylene terephthalate (PET) by Py-GC technique, reactive pyrolysis in the presence of tetramethyl ammonium hydroxide (TMAH) gives constituent monomer of methyl ester. Fig. 1 shows a pyrogram obtained by flash pyrolysis of PET, and Fig 2 shows a pyrogram obtained by reactive pyrolysis in the presence of TMAH. Flash pyrolysis technique gave products arising from decomposition of ester group, but no monomer. n the other hand, reactive pyrolysis gave PET constituent monomer of dimethyl ester of terephthalic acid, and mono and dimethyl esters of ethylene glycol. Pyrolysis temp: 500 C Vinyl benzoate CCHCH 2 Benzoic acid Divinyl terephthalate CH H 2 CHCC CCHCH 2 Monovinyl terephthalate HC CCHCH 2 Benzene Fig. 1 Pyrogram btained by Flash Pyrolysis of PET Pyrolysis temp: 400 C Reagent: 2µL of 25% methanl solution of TMAH Dimethyl terephthalate H 3 CC CCH 3 Dimethyl ethylene glycol Monomethyl ethylene glycol Analytical conditions: carrier gas: He, Injection port pressure: 103kPa, Split ratio: 1/60, Separation column: Ultra ALLY + -5 (5% diphenyldimethylpolysiloxane) Length: 30m, Id: 0.25mm, Film thickness: 0.25µm, GC oven temp: 38ºC~300ºC (20ºC /min), GC injection port tem: 320ºC Material excerpted from 5. A few recent applications of Py-GC, Kiura, Wakabayashi (Mitsubishi Rayon), 2nd Pyrolysis Gas Chromatography Seminar (hosted by Frontier Lab Ltd.) Keyword: Reactive Pyrolysis, Polyethylene Terephthalate, PET, TMAH Applications: General Polymer Analysis Fig. 2 Pyrogram btained by Reactive Pyrolysis of PET : Registered trademark of
105 Double-Shot Pyrolyzer Technical Note (PYA2-007E) Analysis of Polypyromellitimide (PI) by Reactive Pyrolysis When analyzing condensation polymers such as polypyromellitimide (PI) by Py-GC technique, reactive pyrolysis in the presence of tetramethyl ammonium hydroxide (TMAH) gives constituent monomer of methyl ester. Fig. 1 shows a pyrogram obtained by flash pyrolysis of PI, and Fig 2 shows a pyrogram obtained by reactive pyrolysis in the presence of TMAH. Flash pyrolysis technique gave aromatic products arising from fission of the mail chain and hydrogen abstraction such as phenols, amines, nitrile, and imides. n the other hand, reactive pyrolysis at 400 C gave constituent monomer of PI that is methyl derivative of oxydianiline as shown in the pyrogram (Fig. 2). Pyrolysis temp: 600 C C C N H H H 2 N C C HN H H 2 N H 2 N N C C SCAN Fig. 1 Pyrogram btained by Flash Pyrolysis of Polypyromellitimide Pyrolysis temp: 400 C ( 試料量 : 約 0.1mg, 反応試薬 :TMAH25% メタノール溶液 2µL) H 3 C H 3 C N N CH 3 CH 3 Fig. 2 Pyrogram btained by Reactive Pyrolysis of Polypyromellitimide Keyword: Polypyromellitimide, PI, Monomer, Reactive Pyrolysis, Tetramethyl Ammonium Hydroxide, TMAH Applications : General Polymer Analysis SCAN Analytical conditions: Carrier gas: He, Injection port pressure: 103kPa, Split ratio: 1/60, Separation column: Ultra ALLY + -5 (5% diphenyldimethylpolysiloxane) Length: 30m, Id: 0.25mm, Film thickness: 0.25µm, GC oven temp: 40ºC~300ºC (20ºC /min), GC injection port tem: 320ºC Material excerpted from Analysis of Polymeric Materials by Pyrolysis GC/MS, Sato (Toray Research Center), 2nd Pyrolysis Gas Chromatography Seminar (hosted by Frontier Lab Ltd.) : Registered trademark of
106 Double-Shot Pyrolyzer Technical Note (PYA2-008E) Characterization of Natural Resin Shellac by Reactive Py-GC in the Presence of rganic Alkali [Background] Shellac is a thermosetting resin of animal origin found in south-east Asia and is used in a wide variety of applications such as adhesives, sealants, insulating materials, coatings, etc. It features thermoplasticity, oil resistibility, cohesiveness, insulating ability, and nonpoisonous property. The chemical composition varies depending on growing areas, species of insects, environmental conditions, etc. Various analytical techniques have been used to analyze shellac resins, however all with difficulties. The reactive Py-GC in the presence of tetramethylammonium hydroxide (TMAH) was applied to the compositional analysis of shellac without any tedious pretreatments of the samples. [Experimental] Eight shellac samples from India and Thailand were used. All the shellac samples were cryomilled into a fine powder (<60 mesh) prior to Py-GC analysis. About 90µg of shellac sample and 2µL of TMAH solution were introduced into the pyrolyzer. Pyrolysis was done at relatively low temperature of 400 C. [Results]. Figure 1 shows typical pyrograms of Indian shellac at 400 C with and without addition of TMAH. In Figure 1a, only weak and broad peaks of terpenic acids and wax components were observed, while in Fig 1b, a series of sharp peaks due to the methyl derivatives of shellac constituents were observed with better resolution and higher sensitivity. With these results shown, this technique was found to provide simple and quick compositional analysis of shellac. Methyl derivatives of aleuritic acid Reagent related peak tri- (a) Methyl derivatives of fatty acids Permethyl and partly methylated derivatives of terpenic acids per- Methyl derivatives of wax components di-(h 2 ) (b) Trimethylated jalaric acids Permethyl derivatives of terpenic acids Retention time (min) Figure 1. Typical pyrograms of Indian Shellac generated at 400 C, (a) in the absence of TMAH and (b) in the presence of TMAH aqueous solution *Contents excerpted from L. Wang, Y. Ishida, H. htani, S. Tsuge, Anal. Chem. 1999, 71, Keyword : Shellac, Reactive Pyrolysis, Py-GC, TMAH Applications : General polymer analysis Related technical notes : : Registered trademark of
107 Double-Shot Pyrolyzer Technical Note (PYA2-009E) Compositional analysis of polyunsaturated fatty acid oil by one-step thermally assisted hydrolysis / methylation in the presence of trimethylsulfonium hydroxide (TMSH) [Background] Thermally assisted hydrolysis and methylation (THM) in the presence of an organic alkali such as tetramethylammonium hydroxide (TMAH) has been a powerful method in the determination of chemical compositions of polymers and ester compounds including lipids. However, it has been pointed out that strong alkalinity of TMAH caused the isomerization and/or degradation of polyunsaturated fatty acid (PUFA) components during the THM reaction. Here, one-step THM-GC in the presence of TMSH for the determination of fatty acid components especially PUFA in lipid samples is described. [Experimental] Triarachidonin, soybean oil, and sardine oil were used as supplied. Solutions of various concentrations of TMSH and tetramethylammonium hydroxide (TMAH) were prepared. A Py-GC equipped with a capillary column and with FID and MS as detector was used. The pyrolysis was done at 350 C, at which fatty acid methyl esters were obtained at highest yields. [Results]. Figure 1 shows the typical chromatograms of the soybean oil sample obtained by one-step THM-GC in the presence of (a) TMSH and (b) TMAH, respectively. As anticipated, many additional isomer peaks of C18:2 and C18:3 derivatives resulted from the thermal isomerization in the presence of TMAH are observed, while these are hardly seen in the case of (b) TMSH. Table 1 summarizes the chemical compositions of fatty acid components in the soybean oil obtained both by the one-step THM-GC in the presence of TMSH and TMAH together with those by the offline transmethylation along with the recovery data of components. The fatty acid compositions obtained using 0.2M of TMSH were in fairly good agreement with those obtained by the offline GC method showing fairly high and constant recoveries about 80% for every fatty acid component. When sardine oil was used as sample, the fatty acid composition obtained by THM-GC were in a good agreement with those by offline GC method with a good reproducibility. Table 1. Chemical composition and recovery of fatty acid components in soybean oil obtained by one-step TM-GC Fatty acid :1 18:2 18:3 Isomers of Total Compositions (mol%) 18:2&18:3 ffline method* nd 100 ne step THM-GC THSH TMAH 0.2M 13.4(74.6) 3.7(76.5) 22.8(81.5) 54.8(80.6) 5.4(75.5) nd M 13.4(18.2) 3.6(17.3) 22.1(21.0) 55.2(19.2) 5.7(18.2) nd M 13.2(43.6) 3.7(42.2) 22.4(51.5) 48.2(37.7) 5.1(36.5) M 13.3(83.5) 3.9(82.5) 23.2(99.6) 22.5(40.5) 1.1(22.1) Figure 1. Chromatogram of soybean oil obtained by onestep THM-GC at 350 C (a) in the presence of 0.15M of TMAH (b) in the presence of 0.2M TMSH. Peaks of fatty acid methyl esters: 1, C16:0; 2, C18:0; 3, C18:1; 4, C18:2; 5, C18:3 Keyword : Thermally assisted hydrolysis and methylation, Trimethylsulfonium hydroxide, Fatty acid oil, Pyrolysis Applications : Lipid analysis Related technical notes : *ffline transmethylation by TMSH followed by GC measurement Data in parenthesis: recovery obtained from the observed molar peak intensity normalized by sample weight. *Contents excerpted from Y. Ishida, S. Wakamatsu, H. Yokoi, H. htani, S. Tsuge, J. Anal. Appl. Pyrolysis, 49 (1999) : Registered trademark of
108 Double-Shot Pyrolyzer Technical Note (PYA2-010E) Effect of Coexisting Inorganic Impurities on Reactive Py-GC in the Presence of rganic Alkali [Background] The reactive Py-GC technique in the presence of an organic alkali, such as tetramethylammonium hydroxide [TMAH, (CH 3 ) 4 NH] has been successfully applied to precise compositional analysis of intractable condensation polymers. However, it has been suspected that the presence of inorganic salt impurities might hinder the quantitative reaction between the condensation polymer sample and organic alkali. In this report, the effect of KH as a possible coexisting impurity on the reactive pyrolysis was described for the sake of the improvement of reproducibility and quantitativeness of the technique. [Experimental] An aromatic polyester sample, prepared with p-hydroxybenzoic acid (PHB), terephthalic acid (TA) and 4,4'-biphenol (BP) (PHB:TA:BP = 2:1:1), was used. About 100 µg of the cryo-milled polyester sample was subjected to reactive Py-GC at 400 C in the presence of 25% TMAH aqueous solution, or the TMAH solution containing KH (10 wt%). Figure 1. Typical pyrograms of aromatic polyester sample obtained at 400 C, (a) in the presence of 25% TMAH aqueous solution and (b) TMAH-KH (10 wt%) aqueous solution. Keyword : Aromatic polyester, Reactive Pyrolysis, Py-GC, TMAH, Inorganic alkali, impurities Applications : Condensation polymer analysis Related technical notes : [Results] Figure 1(a) and (b) show typical pyrograms of the polyester sample obtained in the presence of pure TMAH and TMAH-KH solution in water, respectively. In this figure, the peak intensity of DMB remained almost unchanged with or without addition of KH while those of MMB and DMT nearly disappeared from the pyrogram measured in the presence of KH. This result suggests that the presence of K + ions significantly hinder the quantitative methylation of the carboxyl sites contained in the polyester sample presumably due to the formation of their corresponding potassium salts. Therefore, contamination by the inorganic salt impurities should be avoided when polyester samples are to be subjected to quantitative Py-GC analysis in the presence of TMAH. *Contents excerpted from Y. Ishida, H. htani, S. Tsuge, J. Anal. Appl. Pyrolysis 1995, 33, 167. : Registered trademark of
109 Double-Shot Pyrolyzer Technical Note (PYA2-011E) Precise Compositional Analysis of Industrially-Used Natural Wax by Reactive Py-GC in the Presence of TMAH [Background] Reactive Py-GC in the presence of an organic alkali, such as tetramethylammonium hydroxide (TMAH), has been utilized as a practical method for characterization not only of intractable condensation polymers but also of complex natural organic materials. By using this technique, precise compositional analysis of various natural organic materials can be often carried out without doing any cumbersome sample pretreatments. As an example, the reactive Py-GC technique applied to compositional analysis of an industrially-utilized natural wax is presented in this note. [Experimental] A crude carnauba wax sample collected from the leaves of Cerifera palm tree in Brazil was used. About 30 µg of the cryo-milled wax sample was subjected to reactive Py-GC at 500ºC in the presence of 4 µl of 25wt% TMAH methanol solution. The column temperature was initially set at 50ºC, secondly heated to 200ºC at a rate of 10 ºC/min, then to 250ºC at a rate of 5 ºC/min, and finally to 300ºC at a rate of 10 ºC/ min. [Results] Figure 1 shows a typical pyrogram obtained from the carnauba wax sample at 500ºC in the presence of TMAH. This pyrogram showed a series of peaks assigned mainly to the methyl derivatives of straight-chain fatty acids (C 16 -C 32 ), ω-hydroxy fatty acids (C 16 -C 30 ), alcohols (C 22 -C 34 ), and α, ω-diols (C 22 -C 32 ), which were derived from the constituents of the wax sample through the reactive pyrolysis. Then the chemical composition of these components was successfully determined from their peak intensities observed on the pyrogram, corrected using the concept of the effective carbon number (ECN), with less than 2% of the relative standard deviation (n = 3). 16:0 32:0 fatty acid (FA) methyl esters H16-H30 methoxy FA methyl esters A22-A34 alcohol methyl ethers D22-D32 diol dimethyl ethers Figure 1. Typical pyrogram of carnauba wax sample obtained in the presence of TMAH at 500ºC. Pyrolysis temp. : 500ºC, GC oven temp. : 50ºC-(10 ºC/min)-200ºC-(5 ºC/min)-250ºC-(10 ºC/min)-300ºC Separation column : Ultra ALLY + -1 (100%dimethylpolysiloxane), Length 30mm, 0.25mm i.d., Film thickness 0.25µm Carrier gas flow : 50 ml/min, Column flow : 1.0 ml/min *Contents excerpted from L. Wang, S. Ando, Y. Ishida, H. htani, S. Tsuge, T. Nakayama, J. Anal. Appl. Pyrolysis 2001, 58-59, Keyword : Natural wax, Reactive Py-GC, TMAH, Compositional analysis, Effective carbon number Applications : Analysis of natural organic materials Related technical notes : PYA2-012E (min) : Registered trademark of
110 Double-Shot Pyrolyzer Technical Note (PYA2-012E) Discriminative Analysis of Natural Waxes by Reactive Py-GC followed by Multivariate Analysis Method [Background] Reactive Py-GC in the presence of an organic alkali, including tetramethylammonium hydroxide (TMAH), has been used as a rapid and highly sensitive technique for analyzing chemical composition of condensation polymers and natural organic materials. Moreover, detailed discriminative analysis among these polymers or organic materials can be often achieved by applying multivariate analysis methods, such as principal component analysis (PCA) and cluster analysis, to their chemical composition data obtained by reactive Py-GC. As an example of such a case, this note describes discriminative analysis among industriallyutilized waxes collected from the leaves at two different growing stages. [Experimental] Two series of crude carnauba wax samples collected from the leaves of Cerifera palm tree in Brazil at two different growing stages were used. Series Y consisted of three waxes collected from younger, unopened heart leaves of the tree while series consisted of three waxes from older, fully expanded leaves. About 30 µg of the cryo-milled wax sample was subjected to reactive Py-GC at 500ºC in the presence of 4 µl of 25wt% TMAH methanol solution. The resulting data from the observed pyrograms were processed using the principal component analysis (PCA) software, Ein Sight (InfoMetrix). [Results] n the pyrogram of each wax sample obtainedbyreactivepy-gcusingtmah,aseries of the methyl derivatives of acid and alcohol constituents of carnauba wax were clearly observed as well-resolved peaks. Based on the peak intensities, chemical compositions of the wax samples were precisely determined. Furthermore, PCA was applied to the data set of chemical composition (the major 33 components) for the six carnauba wax samples in order to visualize the difference among these waxes collected from different growth stages of leaves. Figure 1 shows the relationship between the 1st and 2nd principal component scores for the wax samples. As shown here, the two dimensional plot for these carnauba waxes clearly indicated the distinction between the two different groups reflecting their growth stages of the leaves from which waxes had been collected. Figure 1. Discriminative analysis among carnauba wax samples collected from leaves at different growth stage. *Contents excerpted from L. Wang, S. Ando, Y. Ishida, H. htani, S. Tsuge, T. Nakayama, J. Anal. Appl. Pyrolysis 2001, 58-59, Keyword : Natural wax, Reactive Py-GC, TMAH, Principal component analysis, Discriminative analysis Applications : Analysis of natural organic materials Related technical notes : PYA2-011E : Registered trademark of
111 Double-Shot Pyrolyzer Technical Note (PYA2-013E) Analysis of Sequence Distribution of Polyacetal Copolymers by Reactive Py-GC in the Presence of Cobalt Sulfate [Background] Reactive Py-GC in the presence of a solid acid catalyst, such as cobalt sulfate (CoS 4 ), has been successfully used to characterization polymers having ether-bonds, such as polyacetal (PA) and cellulose. Specifically, it has been reported that the pyrolysis of polyacetal copolymers in the presence of cobalt sulfate leads to the preferential formation of various cyclic ethers containing the comonomer units. The comonomer reflects the sequence distribution in the original polymer chains. This note describes the analysis of the chemical composition and sequence distribution of polyacetal copolymers by means of reactive Py-GC in the presence of cobalt sulfate. [Experimental] A series of PA samples, comprised of oxymethylene [ (-CH 2 -) (F) ] units as a main component and small amounts (1-9 mol%) of ethylene oxide [ (-CH 2 CH 2 -) (E) ] units, are examined. Mixtures of the PA samples (200 mg) and CoS 4 7H 2 (10 mg) were cryo-milled into a fine powder using a freezer mill at liquid nitrogen temperature. Approximately 100 µg of the milled sample is subjected to reactive Py-GC at 400ºC. (a) (b) Formaldehyde (F) Retention time (min) Figure 1. Pyrograms of copolyacetal sample obtained at 400ºC: (a) without addition cobalt sulfate ; (b) in the presence of 5 wt% cobalt sulfate. *Contents excerpted from Y. Ishida, H. htani, K. Abe, S. Tsuge, K. Yamamoto, K. Katoh, Macromolecules 1995, 28, Keyword : Polyacetal, Reactive Py-GC, Solid acid catalyst, Cobalt sulfate, Analysis of sequence distribution Applications : Polyether analysis Related technical notes : PYA2-003 [Results] Figure 1 shows a typical pyrogram obtained from the pyrolysis of a PA sample, containing ca. 9 mol% of E units, at 400ºC. The top pyrogram (a) was obtained without cobalt sulfate present and the bottom pyrogram (b) was obtained in the presence of 5 wt % of cobalt sulfate. Pyrogram (a), contains a large formaldehyde peak. However, it was almost impossible to obtain additional information on the sequence distribution of the polymer sample from this pyrogram because the characteristic peaks reflecting E sequences are too weak. n the other hand, the second pyrogram (b) obtained in the presence of cobalt sulfate exhibits cyclic ethers comprised of E and F units, which reflect the chemical structures in the original polymer chain. Based on the peak intensities of these cyclic ethers, the distributions of E units as well as the E contents of the copolymer samples can be determined accurately and precisely. Pyrolysis temp. : 400ºC, GC oven temp. : 50ºC- (5 ºC/min)-300ºC, Carrier gas flow : 50 ml/min Separation column : Poly(methylphenylsiloxane), Length 50mm, 0.25mm i.d., Film thickness 0.25µm, Column flow : 1.0 ml/min : Registered trademark of
112 Double-Shot Pyrolyzer Technical Note Unequivocal Identification of Pyrolysis Products by Retention Index Data (PYA2-014E) [Background] The concept of Kovat s retention index (RI), is used widely in the field of gas chromatography. The indices assist in: (1) the unequivocal identification of unknowns and 2) the prediction of retention times for pyrolysis products. This note presents the unambiguous identification of a characteristic product, related to the xanthone structure, one of the abnormal structures in thermally-treated polycarbonate (PC) samples. This compound is commonly founded in pyrograms obtained by reactive Py-GC in the presence of tetramethylammonium hydroxide (TMAH). [Experimental] An commercial PC sample was thermally treated to cause abnormal structures in the presence of atmospheric oxygen at 400ºC for 1 hr using an electric furnace. The thermally-treated PC sample was ground into fine powder using a freezer mill. Approximately 100 µg of the sample was subjected to reactive Py- GC at 400ºC in the presence of 2 µl of 25% TMAH methanol solution. The RI data for the main pyrolysis products were determined by comparing the retention data for n-alkanes obtained using the same separation column. The alkanes were formed during the pyrolysis (at 600ºC) of polyethylene. Retention index H 3C C CH 3 C CH 3 xanthone monomer (reference) H 3C a C 1 CH 2 CH 3 CH 3 2 C CH 3 H 3C C CH 3 C CH 2 b 3 4 CH 3 H 3C C CH 3 H 3C C CH MW Figure 1. Relationship between molecular weight and retention index for pyrolysis products observed on pyrogram of thermally-treated PC sample. 5 CH 3 C CH 3 CH 3 CH 3 A 7 6 H 3C C CH 3 CH 3 CH 3 CH 3 CH 2 CH 2 H 3C C CH 3 CH 3 CH 3 H 3C C CH 3 CH 3 C CH 3 CH 2 H 3C C CH 3 CH 3 CH 3 CH 3 H 3 C C CH 3 CH 3 CH 3 [Results] The pyrogram of the PC sample, exhibited the characteristic product (peak A), presumed to be derived from the xanthone structure. In addition to peak A, the degradation products from the main chain (b), end groups (a) and other types of abnormal structures (peaks 1-7) are observed. Figure 1 shows the relationship between molecular weight and RI for the main degradation products (a, b and peaks 1-7; solid circle) and peak A (open circle) along with the reference data obtained for the xanthone monomer (open square). The solid line was obtained by the method of least squares applied to peaks a, b and 1 7. Although the data for the products designated by solid circles show an almost linear relationship, the data for peak A deviated to some extent at higher RIs. Furthermore, the line connecting the plots of the xanthone monomer and peak A almost pass through the origin of the coordinate axes. These results strongly suggest that these two products contain the xanthone structure but belong to a different class of homologue. *Contents excerpted from K. ba, H. htani, S. Tsuge, Polymer Degradation Stab. 2001, 74, Keyword : Retention index, Identification, Reactive Py-GC, TMAH, Polycarbonate, Xanthone structure Applications : Condensed polymer analysis, General GC analysis Related technical notes : : Registered trademark of
113 Double-Shot Pyrolyzer Technical Note (PYA2-015E) Determination of Average Molecular Weight of Polycarbonate by Reactive Py-GC in the Presence of rganic Alkali [Background] Analytical pyrolysis techniques such as Py-GC and reactive Py-GC have been extensively used to characterize the end groups of various synthetic polymers. The average molecular weights (MW) of various polymers can often be precisely determined using quantitative information of the end group concentrations. This note describes the estimation of the average MW of an commercially available polycarbonate (PC) by means of reactive Py-GC in the presence of tetramethylammonium hydroxide (TMAH). [Experimental] A polycarbonate (PC) sample synthesized using the solvent method (SM) was used. About 50 µg of a freezer-milled PC sample was subjected to reactive Py-GC at 400ºC in the presence of 1 µl of 25wt% TMAH methanol solution. [Results] Figure 1 shows a typical pyrogram of the PC sample obtained at 400ºC in the presence of TMAH. In this pyrogram, p-tert-butylanisole (peak A) and the dimethylether of bisphenol-a (peak B), derived from the end groups and the main chain of the PC sample, respectively, are clearly observed. Because both terminals in the SM-PC molecules are completely end-capped with p-tert-butylphenoxy groups, the average molecular weight of the sample (M n ) can be estimated from the two peak intensities: A B (1) (2) A B where DP is the degree of polymerization, I A and I B are the intensities of peaks A and B, respectively, and the divisors 10.2 and 15.4 are empiricallydetermined effective carbon numbers (ECN) of the respective compounds for a flame ionization detector. The values of 254 and 326 in equation 2 are the MWs of the monomer unit and the two end groups, respectively. Keyword : Polycarbonate, Reactive Py-GC, TMAH, End group, Number average molecular weight Applications : Condensed polymer analysis Related technical notes : ECN = 10.2 Retention time (min) ECN = 15.4 Figure 1. Pyrograms of PC sample obtained at 400ºC in the presence of TMAH. Pyrolysis temp. : 400ºC, GC oven temp. : 50ºC- (4 ºC/min)-300ºC Separation column : Poly(dimethylsiloxane), Length 25mm, 0.25mm i.d., Film thickness 0.25µm Carrier gas flow : 50 ml/min, Column flow : 1.3 ml/min, Detector: FID *Contents excerpted from Y. Ito, H. gasawara, Y. Ishida, H. htani, S. Tsuge, Polymer J., 1996, 28, : Registered trademark of
114 Double-Shot Pyrolyzer Technical Note (PYA2-016E) Characterization of the Network Structures in UV-Cured Acrylic Ester Resin by Reactive Py-GC [Background] Py-GC is a powerful tool for the characterization of network structures in intractable polymeric materials. Py-GC, in the presence of an organic alkali such as tetramethylammonium hydroxide (TMAH), can be used to analyze the structures of insoluble cross-linking polymers containing polar components. This note describes the characterization of the network structures in an UV-cured acrylic ester resin, prepared from prepolymer compounds containing ester linkages. : H 3 C CH 2 CH 2 CH 3 n MA 4-mer methoxy derivative of photoinitiator MA 3-mer methoxy derivative of photoinitiator fragment MA 2-mer n = 4 Various minor peaks characteristic of crosslinked network struct Various minor peaks characteristic of crosslinked network struct ures Figure 1. Typical pyrogram of UV-cured resin prepared from polyethyleneglycol diacrylate and morpholino-type photo-initiator. Pyrolysis temp. : 400ºC, GC oven temp. : 35ºC (6 min)-(5 ºC/min)-340ºC Separation column : Poly(5% diphenyl)dimethylsiloxane Length 30 m, 0.25 mm i.d., Film thickness 0.25 µm Carrier gas flow : 50 ml/min, Column flow : 1.0 ml/min, Detector: FID Scheme 1. Formation pathway of typical products of the UV-cured resin after reactive pyrolysis Keyword : UV-cured resin, Network structures, Chain length distribution of network junctions, Reactive Py-GC Applications : Analysis of cross-linking polymers Related technical notes : n = 5 n = 6 n = 7 n = 8 n = 9 n = 10 Intact photoinitiator MA 5-mer MA 6-mer n = 11 n = Time (min) n = 13 MA oligomers [Experimental] A UV-cured resin prepared from polyethylene-glycol diacrylate and morpholino-type photoinitiator (IRGACURE 907) is subjected to Py-GC. First the resin is ground into a fine powder using a freezer mill. About 100 µg of the powder is subjected to reactive Py-GC at 400ºC in the presence of 4 µl of 25% TMAH methanol solution. [Results] Fig. 1 shows a typical pyrogram of the UV-cured resin. In this pyrogram, minor but distinct peaks of various methyl acrylate (MA) oligomers directly reflecting the cross-linked structures are observed along with a series of methoxy derivatives of ethyleneglycol oligomers. The derivatives originate from the main chain after chemolysis at the acrylate linkages (Scheme 1). The relative peak intensities of the various MA units enable the analyst to determine the chain length distribution of the network junctions contained in the UVcured resin. *Contents excerpted from H. Matsubara, A. Yoshida, Y. Kondo, S. Tsuge, H. htani, Macromolecules 2003, 36, : Registered trademark of
115 Double-Shot Pyrolyzer Technical Note (PYA2-017E) Direct Determination of a Polymeric Hindered Amine Light Stabilizer in Polypropylene by Reactive Thermal Desorption-GC [Background] Thermal desorption (TD)-GC has been successfully applied to direct analyses of various additives occluded in polymeric materials. Recently, a new TD-GC technique assisted by on-line chemical reaction, reactive thermal desorption (RTD)-GC, was reported to be a highly sensitive method to analyze polymeric additives including ester bondings, and/or free carboxylic and hydroxyl groups in their molecular structures. This note describes the direct determination of small amounts of polymeric hindered amine light stabilizers (HALSs) added to polypropylene (PP) by means of RTD-GC in the presence of tetramethylammonium hydroxide (TMAH). [Experimental] Adekastab LA-68LD [MW 1900] was used as a polymeric HALS sample. PP composites containing the polymeric HALS along with antioxidants, Irganox 1010 and Irgafos 168, were prepared by blending PP with the additives by a kneader at ºC in 5 min. About 30 µg of the cryo-milled PP composite sample was subjected to RTD-GC at 300ºC in the presence of 2 µl of 25wt% TMAH methanol solution. The column temperature was set at 50ºC, and heated to 300ºC at a rate of 5 ºC / min. [Results] Figure 1 shows a typical chromatogram of the PP composite sample containing 10,000 ppm of HALS obtained by RTD-GC in the presence of TMAH at 300 ºC. In this chromatogram, characteristic products reflecting the piperidine (peaks 3 and 4) and spiro moieties (peaks 5 and 6) in the original HALS molecules, formed through the partial methylation of the associated hydroxyl groups, were clearly observed without interference from the pyrolyzates of the PP backbones. Based on the intensities of peak 3-6, the direct determination of small amount of the polymeric HALS components, added to PP at concentration between 1,000 and 50,000 ppm, was carried out with a satisfactory relative standard deviation of ca. 5%. 3 Adekastab LA-68LD i, j k Peaks derived from Irgafos 168 Peaks derived from Irganox 1010 Figure 1. Typical chromatogram of PP composite sample obtained by RTD-GC at 300ºC. Desorption temp. : 300ºC, GC oven temp. : 50ºC-(5 ºC/min)-300ºC Separation column : HP Ultra1 (100%dimethylpolysiloxane), Length 25 m, 0.2 mm i.d., Film thickness 0.33 µm Carrier gas flow : 50 ml/min, Column flow : 1.0 ml/min *Contents excerpted from K. Kimura, T. Yoshioka, Y. Taguchi, Y. Ishida, H. htani, S. Tsuge, Analyst 2000, 125, Keyword : Polymeric hindered amine light stabilizer, Polypropylene, Reactive thermal desorption-gc, TMAH Applications : Additive analysis Related technical notes : : Registered trademark of
116 Double-Shot Pyrolyzer Technical Note (PYA2-018E) Highly Sensitive Determination of Lipids in Zooplankton by Reactive Py-GC in the presence of Trimethylsulfonium Hydroxide [Background] Reactive Py-GC in the presence of an organic alkali has been successfully applied to direct analysis of lipids in various biological samples. Furthermore, the use of a sulfonium salt, trimethylsulfonium hydroxide (TMSH), as an alkali reagent enabled to detect thermally-labile polyunsaturated fatty acid (PUFA) components without causing their undesirable isomerization and/or degradation. This note presents the highly sensitive determination of lipids including the PUFA residues in an individual zooplankton sample at levels of a few tenths of µg. [Experimental] Daphnia galeata individuals cultured under the standard conditions in the laboratory were used as plankton samples. Dry weights of these individuals ranged from 10 to 60 µg. As derivatizing reagents, a methanol solution of TMSH (0.25 M) and a methanol solution of tetramethylammonium hydroxide (TMAH) (3.8 M) were used. Each dried zooplankton sample was subjected to reactive Py-GC at 400ºC in the presence of 2 µl of the organic alkali solution. [Results] Figure 1 shows typical pyrograms of two D. galeata individuals, weighing about 60 µg each, obtained by reactive Py-GC in the presence of (a) TMAH and (b) TMSH at 400 ºC, respectively. n both of the pyrograms, methyl esters of saturated and unsaturated C14-18 fatty acids (peaks 1 10) were commonly observed. Here it should be noted that the peaks of EPA (peak 11) and DHA (peak 12) containing 5 and 6 double bonds, respectively, were clearly observed on the pyrogram (b) obtained with TMSH, while they were virtually missing in the pyrogram (a) using TMAH due to their thermal isomerization Peak 11: eicosapentaenoic acid (EPA; C20:5) and/or degradation. This Peak 12: docosahexaenoic acid (DHA; C22:6) result demonstrates that THM- GC in the presence of TMSH allowed the highly sensitive detection of a series of fatty acid residues including PUFAs even with 5 or 6 double bonds. The peak intensities of the fatty acid components Figure 1. Chromatogram of zooplankton samples obtained by reactive observed using TMSH, permit Py-GC at 400ºC in the presence of (a) TMAH and (b) TMSH. the rapid determination of the Pyrolysis temp. : 400ºC, GC oven temp. : 50ºC-(5 ºC/min)-240ºC lipid contents and fatty Separation column : Ultra ALLY-CW [poly(ethylene glycol)] Length 30 m, acid compositions in plankton 0.25 mm i.d., Film thickness 0.25 µm samples. Carrier gas flow : 50 ml/min, Column flow : 1.0 ml/min *Contents excerpted from. Nakanishi, S. Hirao, Y. Ishida, H. htani, S. Tsuge, J. Urabe, T. Sekino, M. Nakanishi, T. Kimoto, J. Anal. Appl. Pyrolysis 2003, 68-69, Keyword : Lipid, Polyunsaturated fatty acid, Zooplankton, Reactive Py-GC, Sulfonium salt, TMSH Applications : Lipid analysis, Analysis of natural organic compounds Related technical notes : : Registered trademark of
117 Double-Shot Pyrolyzer Technical Note (PYA2-019E) Determination of the Cross-linking Agent in Cross-linked Polycarbonate by Reactive Pyrolysis GC/MS [Background] Increasing the melt viscosity of polymeric materials is often required in order to improve their molding properties, or to increase the molecular weight of recycled polymic materials. For example, the melt viscosity of polycarbonate (PC) can be fine-tuned by introducing small amount of cross-linking agent into the polymer backbone chain of PC using 1,1,1-tris(parahydroxyphenyl)ethane (THPE) as a cross-linking agent. The concentration of the cross-linking agent incorporated into the PC will greatly influence the polymer s properties; therefore, it is important to determine the concentration of THPE incorporated into the PC. The conventional method requires cumbersome pre-treatments such as hydrolysis followed by solvent extractions, which are time consuming and adversely affect data quality. This technical note describes the development of a simple, rapid and quantitative method for the determination of THPE in PC. The method is based on reactive pyrolysis utilizing tetramethyl ammonium hydroxide (TMAH) as the derivatizing agent. [Experimental] A Frontier double-shot pyrolyzer (Model 2020iD) was directly interfaced to the split/splitless injection port of a GC-FID. PC material that had been cross-linked with THPE was dissolved in dichloromethane (20 mg/ml). Five µl of the solution (equivalent to 100µg of PC) was placed in a deactivated sample cup. The solvent was evaporated, and 10µL of a 25% methanol solution of TMAH was added to the cup. Reactive pyrolysis was performed using a furnace temperature of 400ºC. [Results] Figure 1 shows that two reaction products are expected from the reactive pyrolysis of cross-linked PC in the presence of TMAH. The pyrogram is shown in Figure 2. As expected, a dimethyl derivative of bisphenol A (Me-BisA) originating from the major component of cross-linked PC and a trimethyl derivative of THPE (Me-THPE) originating from the cross-linking reagent are observed. The amount of cross-linking agent can be determined using the peak areas. The amount of THPE in the cross-linked PC was found to be ca. 0.4 wt%. The reproducibility of this method (RSD of 1.2 % (n=5)) is much better than that obtained using conventional methodology. Cross-linked PC CH 3 C CH 3 C TMAH derivatives Me-Bis A CH 3 C C CH 3 C CH 3 C CH 3 Me-THPE H 3 C CH 3 C 400ºC TMAH CH3 CH 3 H 3 C CH 3 CH 3 (Derivatives of PC end group) x 100 CH 3 Me-Bis A H 3 C C CH 3 CH 3 Me-THPE min Fig. 1 Expected products from reactive pyrolysis of cross-linked PC Fig. 2 Pyrogram obtained by reactive pyrolysis of cross-linked PC Detector: FID, Separation column: Ultra ALLY + -5 (5% diphenyldimethyl polysiloxane), (length 30 m, id 0.25 mm, film thickness 0.25 µm), Reactive pyrolysis temp.: 400ºC, GC oven temp.: ºC(5ºC/min), GC injection port temp.: 300ºC, Carrier gas: He, Split ratio: 1/200, Flow rate: 1.0 ml / min *Contents excerpted from a presentation by K. dagiri et al., 12th Polymer Analysis & Characterization Japan 2007 IV-15 Keywords : Reactive pyrolysis, Polycarbonate, PC, TMAH, THPE, Cross-linking reagent Applications : General polymer analysis : Registered trademark of
118 Double-Shot Pyrolyzer Technical Note (PYA2-020E) Determination of Residual Bisphenol A in Polycarbonate by Thermal Desorption (TD)-GC/MS with TMS-Derivatization [Background] A trace amount of unreacted bisphenol A (Bis A), the starting material for polycarbonate (PC), is known to remain in the PC matrix as a residue despite efforts to remove it in the manufacturing process. Bis A is an alleged endocrine disruptor, therefore, the determination of residual Bis A in PC is extremely important. When thermal desorption (TD)-GC/MS is used as an analytical tool, a small amount of Bis A is also generated as a decomposition product of PC making the determination of residual Bis A originally present difficult. This report describes a new method for the determination of residual Bis A in PC. Residual Bis A is converted to a thermally stable trimethylsilyl derivative, prior to TD-GC/MS analysis. The method is simple and provides an accurate measurement of residual Bis A. [Experimental] About 10 mg of the PC sample is placed in a vial along with 700 µl of dichloromethane. 300 µl of N,-bis(trimethylsilyl)acetamide (TMS-BA) is then added to the vial. The vial is heated at 70ºC for 1 hour. A small amount of n-c 19 H 40 is added in order to monitor the system performance. 10 µl of the reaction mixture (equivalent to ca. 0.1 mg of PC) was placed in a sample cup, the solvent was allowed to evaporate prior to TD- GC/MS analysis. [Results] Scheme 1 shows the reaction products from the TMS-derivatization of Bis A. Fig. 1 shows the chromatogram obtained by TD-GC/MS of the reaction products. As shown in Scheme 1, hydroxyl groups at both ends of Bis A were TMS-derivatized to give 2,2-bis(4 -trimethylsiloxyphenyl)propane (TMS-Bis A). Because TMS-Bis A is less polar than Bis A, there is less degradation due to active sites in the injection port and separation column. This improves the over all peak shape and enhances reproducibility see Fig. 1. Using an absolute calibration curve obtained using standard Bis A reagent, the concentration of Bis A in PC was found to be 1,170 ppm, with very good reproducibility (RSD=4.7%, n=5). When the thermal desorption temperature is less than 300ºC, the base polymer of PC remains in the sample cup unchanged; thus, the analytical system is not contaminated by the thermal decomposition products of PC. H CH3 C CH3 CH3 Si CH3 CH3 CH3 CH3 TMS-BA H H3C Si C 70ºC, 1hr CH3 CH3 TMS-Bis A Scheme 1 TMS-derivatization of Bisphenol A H 3 C CH 3 Si CH 3 H 3 C CH 3 CH 3 n-c 19 H 40 (Reference) TMS-Bis A Keywords : Polycarbonate, Bisphenol A, Trimethylsilanation (TMS), Trimethylsilyl derivatization, Thermal desorption-gc/ms Applications : General polymer analysis Related technical notes : min Fig. 1 Chromatogram of TMS-derivatized PC sample obtained by TD-GC/MS Pyrolyzer furnace temp.: ºC (100ºC/min), GC oven temp.: ºC (20ºC/min, 5 min hold) Separation column: Ultra ALLY-5 (5% diphenyl 95% dimethylpolysiloxane, L=30 m, id.=0.25 mm, df=0.25 µm) Carrier gas flow rate: 1.0 ml/min, split ratio: 1/50 Ref.: S. Takeda, et al., 12th Polymer Analysis & Characterization Japan 2007 III-15 : Registered trademark of
119 Double-Shot Pyrolyzer Technical Note Characterization of the fatty acid profile in algae using reactive pyrolysis ( PYA2-022E ) [Background] Beginning in the 1970s the use of algae for the production of energy has been of great interest. Studies show that algae can produce up to 60% of their biomass in the form of oil. Profiling the lipids in algae using conventional methodologies is cumbersome, expensive and often yields data of low quality. Algae can be directly analyzed using thermally assisted hydrolysis and methylation (TMA), i.e., Reactive Pyrolysis (RxPy) GC/MS. [Experimental] 0.2 mg of dried algae was placed in a sample cup, 10 µl of trimethylsulfonium hydroxide (TMSH) in methanol (0.2M) was added and the cup was dropped into the pyrolyzer s furnace (350ºC) in an He atmosphere. The gasphase reactions occurred instantaneously. The methylated acids were separated and analyzed using GC/MS. [Results] The individual fatty acids can easily be identified and quantitated using extracted ion chromatograms. The separation and identification of the isomers is a function of the column s stationary phase, the phase ratio and the GC oven's temperature profile. The distribution of the fatty acids is one of the primary means used to differentiate algae strains. 2e+07 Palmitic acid-me (C16:0) leic acid-me Linoleic acid-me sample weight 0.2mg (dry) 1e+07 Phytol? Stearic acid-me (C18:0) C20: min (C14:0) Ion 242 Ion 270 (C16:0) Ion 298 Ion 326 (C18:0) (C20:0) min <Reactive pyrolysis conditions> Pyrolyzer: 350ºC, separation column: UA-5 (MS/HT) 30m, 0.25mm id., DF=0.25µm, oven temperature: 100~320ºC at 10ºC/min (10 min hold), He: 1.0 ml/min, split ratio: 1/40, sample weight: ca. 0.2mg (dry), 0.2M TMSH in methanol: 10 µl Keyword : Reactive pyrolysis Applications : Algae, Biomass, Reactive pyrolysis Related technical notes : Please forward your inquiries via our web page or send us a fax message. R&D and manufactured Saikon, Koriyama by : Frontier Fukushima-ken Laboratories Ltd. JAPAN, Fukushima JAPAN Phone: : Registered (81) trademark Fax: of (81) Double-Shot Pyrolyzer is a registered trademark of Your dealer:
120 Double-Shot Pyrolyzer Technical Note Notes on Reactive Pyrolysis of Fatty acids using Trimethylsulfonium hydroxide ( PYA2-023E ) [Background] The official method for the analysis of fatty acids in fats and oils instructs analysts to use boron trifluoride (BF 3 ); however, because it is a cumbersome procedure and the high toxicity of BF 3, simpler and safer analytical procedures are of interest. Reactive pyrolysis using a Py-GC/MS system is one possibility to consider. ften, tetramethyl-ammonium hydroxide (TMAH) is used as the organic alkali; however, TMAH is known to cause isomerization of the polyunsaturated fatty acids. Recently, Ishida et al. have reported that trimethylsulfonium hydroxide (TMSH) will reduce the degree of isomerization during the hydrolysis and methylation of the fatty acids 1) Isomerization is known to be directly related to the amount of TMSH used. This report illustrates how the level of isomerization is influenced by the amount of TMSH added to the sample. [Experimental] Soybean oil (10 µg) was placed in a sample cup (Eco-cup L), 2~4 µl of a methanolic solution of TMSH (0.01~0.2 M) was added to the cup. The reaction temperature was 350ºC. 80% recovery was typically achieved. [Results] The major constituent in oils (fats) such as soybean oil are triglycerides. As shown in Scheme 1, reactive pyrolysis using TMSH, results in the formation, via an ester-exchange reaction, of methyl derivatives of fatty acids (FAMEs). Pyrograms of soybean oil obtained using varied amounts of TMSH are shown in Fig. 1. Methyl esters of fatty acids are observed. The peak area ratio of C18:2 : C18:3 is larger in pyrogram A. Isomers presumably formed though isomerization of C18:2 are observed in pyrogram B.These results show that increasing the amount of TMSH increases the isomerization of the polyunsaturated fatty acids. To determine the optimal amount of TMSH to use, the dependence of the FAME peak areas on the amount of TMSH was determined Fig. 2. The peak area of C16:0 is independent of the TMSH concentration. This is attributed to the fact that the reaction efficiency for C16:0 is high. n the other hand, the isomerization of C18:2 and C18:3 depends on the conditions. A TMSH amount of 0.2 x 10⁻⁶ mol, which is 10 times the chemical equivalent of the sample, results in the maximum area counts. Increasing the amount of TMSH beyond 10 times reduces the peak area counts, This indicates that larger amounts of isomerized products have formed. Based on these results, the optimal amount of TMSH is 10 times the chemical equivalents of the fatty acids in the sample. Compositional analysis of the FAMEs in soybean oil using reactive pyrolysis Py- GC/MS are comparable to those obtained using BF 3 derivatization. A. TMSH (0.2 x 10⁻⁶ mol) B. TMSH (1.0 x 10⁻⁶ mol) Methyl palmitate (16:0) Methyl stearate (18:0) Methyl oleate (18:1) Methyl linoleate Methyl linolenate (18:3) 18:2 Isomers Peak area ( x 10 4 ) C--C-R 1 I C--C-R 2 I C--C-R S(CH 3 ) 3 H in CH 3 H R 1~3 -CCH 3 Scheme 1. Hydrolysis and Methylation of fats and oils using TMSH 16:0 18:2 + 18:3(x10) Isomerized 18:2 C--CH 3 I C--CH 3 I C--CH min Fig. 1: Pyrograms of soybean oil with varied amounts of TMSH Py temp.: 350ºC, ven temp.: ºC(20ºC/min), Column: UA-CW (polyethylene glycol) (L=30 M, i.d.=0.25 mm, df=0.25 µm), Carrier gas He: 1 ml/min, split ratio: 1/ Amount of TMSH added ( x 10-6 mol) Fig. 2: Amount of TMSH vs. peak areas of fatty acids 1) Y. Ishida et al. J. Anal. Appl. Pyrolysis 49 (1999) Keyword : Fats and ils, Fatty acids, Reactive Pyrolysis, TMSH, BF 3 Applications : Foods and related industries Related technical notes : PYA2-022E, PYA2-018E Please forward your inquiries via our web page or send us a fax message. R&D and manufactured Saikon, Koriyama by : Frontier Fukushima-ken Laboratories Ltd. JAPAN Saikon, Koriyama, Fukushima JAPAN Phone: : Registered (81) trademark Fax: (81) of Double-Shot Pyrolyzer is a registered trademark of
121 Double-Shot Pyrolyzer Technical Note ( PYA2-024E ) Effect of elapsed time after the addition of tetramethylammonium hydroxide in reactive pyrolysis [Background] Reactive Py-GC, which is performed in the presence of a strong alkali such as tetramethyl ammonium hydroxide [TMAH, (CH3)4NH], is widely used for the precise characterization of condensation polymers and fatty acids.(1) The results obtained when using this analytical method are affected by factors such as the hydrolysis (i.e. furnace) temperature, the reagent used, the sample form, impurities, etc. This note reports the effect that the time interval between adding the reagent and the actual hydrolysis and methylation has on the analytical results. [Experimental] Nine micrograms of polycarbonate (PC) was placed in a sample cup, followed by the addition of 3 µl of a methanolic solution of TMAH (25wt%). Reactive Py-GC/Ms was performed (at 400ºC) at different intervals (3 minutes to 5 hours). [Results] Fig. 1 shows pyrograms obtained at elapsed times ranging from 3 minutes to 5 hours after the addition of TMAH. Pyrogram A with an elapsed time of 3 min, has a peak for the dimethyl ester of bisphenol A and the methyl ester of 4-tbutylphenol, which originates from the from the terminal group. Methanol and trimethylamine from the TMAH are also observed. As the time interval increases, the peak intensities and their ratio for the two peaks originating from PC remained unchanged; however, peaks for amines and methyl esters not observed in pyrogram A and not derived from PC were observed, and these peaks became larger as the sample sets after the addition of TAMAH. These results show that when using TMAH, the elapsed time between the addition of the reagent and the thermal hydrolysis does not have much affect much on the analytical result; however, as a general rule, it is best if the hydrolysis occurs as soon as possible once the reagent is added. Polycarbonate Elapsed time A. 3 min methanol + trimethylamine C C C C C 4-t-butylphenyl methyl ether C C C CH 3 C C C C n dimethyl ester of bisphenol A C H 3 C C CH 3 C B. 20 min methyl carbonate methyl (dimethylamino) acetate Interfering peaks derived from TMAH C. 1 hr D. 5 hr min Fig. 1 Pyrograms of polycarbonate after addition of reagent, arranged in chronological order 1) Y. Ito, et al.,polym. J.,28(1996),1090 Pyrolysis temp.: 400ºC, GC oven temp.: ºC (20ºC/min), separation column: Ultra ALLY + -1 (dimethylpolysiloxane) L=30 m, i.d.=0.25 mm, df=0.25 µm, Column flow rate: 1 ml/min He, split ratio: 1/50, sample: 9 µg (solvent casting) Keyword : Reactive pyrolysis, TMAH, Polycarbonate Applications : General polymer analysis Related technical notes : PYA2-001, PYA2-015, PYA2-019 Please forward your inquiries via our web page or send us a fax message. R&D and manufactured Saikon, Koriyama by : Frontier Fukushima-ken Laboratories Ltd. JAPAN, Fukushima JAPAN Phone: : Registered (81) trademark Fax: of (81) Double-Shot Pyrolyzer is a registered trademark of
122 Multi-functional Pyrolyzer Technical Note Keyword : Quartz filter paper, Reactive pyrolysis, TMAH, Sample preparation, Carbon-coated filter paper, sandwich method, Auto-shot sampler Applications : Sample preparation, Polymer analysis, Reactive pyrolysis Related technical notes : PYA2-026E ( PYA2-025E ) Sample preparation with TMAH using Eco-cup (Sandwich method) in reactive pyrolysis [Background] Sample preparation techniques used when preforming reactive pyrolysis GC have been reported by tani et al. 1) Researchers have reported that when more than a few µl of a methanolic solution of TMAH reagent is added to a sample cup (Eco-cup), some of the sample and reagent wicks up and out of the cup. This not only has an adverse effect on the analytical accuracy but it also leaves a sticky film on the outer surface of the cup. A sticky cup does not free fall properly nor does it eject smoothly when an Auto-Shot Sampler is being used. The wicking can be eliminated by adsorbing the TMAH on a piece of glass fiber filter 2). The so-called sandwich method uses disc-shaped quartz filters coated with carbon powder (average particle diameter 15 µm) and a TMAH solution mixed with carbon power as shown in Figure 1. This report demonstrates that the sandwich technique is suitable for use when doing reactive pyrolysis. Sticking problems encountered with the Auto shot sampler are eliminated and data quality is, in no way, compromised. [Experimental] The carbon-coated filter paper was made by dipping disc-shaped quartz filters (diameter 4 mm, thickness 0.1 mm) into methanol containing 5 wt% carbon powder. The filters are then dried. The TMAH/carbon mixture in methanol was prepared by adding 30 wt% of carbon powder to 25 wt% TMAH. The sample (Fig. 2) was 50 µg (60 mesh powder) of the three-dimensional copolymer liquid crystal polyester (LCP) prepared from p-hydroxy benzoic acid (PHB), terephthalic acid (TA), and biphenol (BP) in a 2/1/1 ratio. Fig. 1 shows that the one sample was prepared by sandwiching the LCP sample between two carbon-coated filter papers. 4 µl of TMAH solution was added to the sample and to the upper filter paper. For comparison, a second sample was prepared by adding 1 µl of the TMAH reagent to an Eco-cup containing 50 µg of the LCP sample. Both samples were analyzed using reactive pyrolysis GC at 400ºC. All analysis were done using the Auto-Shot Sampler. [Results] Fig. 3 shows that methyl p-methoxybenzoate (MMB), dimethyl phthalate, and 4,4-dimethoxybiphenyl (DMB) are present when the sample is prepared using either the sandwich or conventional method. The composition ratios, recovery and relative standard deviation (RSD) are summarized in Table 1. The composition ratio (2/0.99/0.93) was close to the original ratio and the recovery was almost the same as that obtained using the conventional method. The %RSD in both sets of data was less than 4% in most cases, the sandwich data is more precise than the data obtained using the conventional methodology. The sandwich method not only provides high quality data but also appears to be more practical. Up to 5 µl of TMHA reagent can be used without the reagent wicking up and out of the sample cup.; common problem when using the with Auto-Shot Sampler. 1) H. htani et al., J. High. Res. Chromatogr., 14,388(1991) 2) Honda et al., Polymer Anal. Char, 14, Nov Carbon-coated filter paper Diameter: 4 mm Thickness: 0.1 mm Sandwich method TMAH/carbon mixture (4 µl ea.) TMAH soln. (1µL) Sample Eco-cup Table 1. Results by sandwich and conventional methods (starting LCP ratio=2/1/1) Sandwich method Conventional method Fig. 1. Sample preparation methods Conventional (TMAH 1 µl) Pyrolysis temp.: 400 ºC, GC oven: ºC ( 20 ºC/min ), separation column: Ultra ALLY + -5 ( 5 % diphenyl 95 % dimethylpolysiloxane, L = 30 m, i.d. = 0.25 mm, df = 0.25 µm ), column flow rate: 1 ml/min, He, split ratio: 1/50, sample: 50 µg Composition ratio MMB DMT DMB C C C 1.0 PHB H 3 C CCH 3 (x10 6 ) 2.0 MMB H 3 CC Recovery(%) (this method = 100) RSD(%) MMB DMT DMB MMB DMT DMB TA Fig. 2. Structure of LCP DMT H 3 CC CCH 3 Fig. 3. Pyrogram DMB min BP CCH 3 n Please forward your inquiries via our web page or send us a fax message. R&D and manufactured Saikon, Koriyama by : Frontier Fukushima-ken Laboratories Ltd. JAPAN Saikon, Koriyama, Fukushima JAPAN Phone: : Registered (81) trademark Fax: of (81) : A registered trademark of
123 Multi-functional Pyrolyzer Technical Note ( PYA2-026E ) Quantitative reactive pyrolysis of liquid crystal polyesters using the sandwich prep method [Background] Technical note PYA2-025E describes the use of carbon-powder-coated filter papers and carbon-powdercontaining TMAH reagent when doing reactive pyrolysis. This technical note describes the reactive pyrolysis of a threedimensional copolymer liquid crystal polyester (LCP, Fig. 1) prepared from p-hydroxy benzoic acid (PHB), terephthalic acid (TA), and biphenol (BP). The composition ratios are reported. [Experimental] Six different LCP samples (60 mesh powder) were analyzed (Table 1) using the so-called sandwich method. About 50 µg of each LCP sample was placed between two carbon-coated filters (diameter 4 mm, thickness 0.1 mm) in a sample cup (Eco-cup). 4 µl of the TMAH/carbon mixture were added directly to the LCP sample and to the top filter (8 µl total). The sample was analyzed using reactive pyrolysis GC at 400ºC. The Auto-shot sampler was used throughout the study. [Results] The calibration curves for the three LCP constituents are shown in Fig. 2; the composition ratios are normalized using PHB. The molar composition ratios experimentally obtained (Table 2) are in a good agreement of those of the starting molar ratios (Table 1). The relative standard deviation (RSD, n=5) is less than 5%. This example demonstrates that reactive pyrolysis using the sandwich method to prepare the sample for reactive pyrolysis provides quantitative results with high precision. The method is compatible with the use of an auto-sampler which greatly increases laboratory productivity. C C C bserved molar composition ratio (%) PHB BP TA TA Fig. 1. Chemical structure of LCP PHB 0 PHB TA, BP I II III IV V VI Starting molar composition ratio (%) BP Fig. 2. Calibration curves for the six different LCP samples n Table 1. Molar composition ratios of the LCP samples Sample PHB TA BP No. I II III IV V VI Table 2. Molar composition ratios actually obtained Sample PHB TA BP No. I II III IV V VI RSD * (n= 5) PHB: 1.1%, TA: 4.7%, BP: 2.6% * Average results of 6 samples Keyword : Quartz filter paper, Reactive pyrolysis, TMAH, Sample preparation, LCP, Quantification, Sandwich method, Auto-Shot Sampler Applications : Sample preparation, Polymer analysis, Reactive pyrolysis Related technical notes : PYA2-025E Please forward your inquiries via our web page or send us a fax message. R&D Frontier and manufactured Laboratories by : Ltd., Fukushima JAPAN Phone: (81) Fax: (81) : Registered trademark of : A registered trademark of
124 Multi-functional Pyrolyzer Technical Note ( ) PYA2-027E Determination of trace organophosphonate surfactant in aqueous media using Reactive Pyrolysis-GC/MS [Background] The determination of organophosphonates, which are used as surfactants and as scale inhibitors, usually involves ion chromatography, capillary electrophoresis, and ICP. However, when analyzing atrace amount, cumbersome pretreatments such as extraction and concentration are required. Therefore, the development of simple and sensitive analytical methodology is of interest. Reactive pyrolysis-gc/ms using tetramethyl ammonium hydroxide (TMAH) is a simple method for characterising polymers with ester groups and polar functionalities. This note shows the determination of 1-hydroxyethylidene-1,1-diphosphonic acid (HEDP, Fig. 1) in an aqueous media using reactive pyrolysis (RxPy) -GC/MS. [Experimental] A Multi-Shot pyrolyzer (EGA/PY-3030D), which was directly interfaced to the split/splitless injector of a GC/MS system, was used. 10 µl of a 10 ppm aqueous solution of HEDP was placed in a sample cup (id=4 mm, height=8 mm), then an excess of TMAH (1 µl of 25 wt% methanol solution) was added. It was then subjected to RxPy-GC/MS analysis at 350ºC. [Results] The reactive pyrolysis of HEDP forms trimethylphosphate (TMP) as the main component (Fig.2); a small amount of dimethylphosphonate (DMP, Fig.3) is observed. The precision of the m/z 110 extracted ion chromatogram was 7.4%RSD (n=3), which is good and suggests that HEDP can be determined using the TMP peak. Also the detection limit was estimated to be 0.3 ppm (S/N=3), which is sensitive enough for the practical analysis of organophosphonates in aqueous media using RxPY-GC/MS. H H C H 3 P H P H H 5x10 5 (A) TIC Fig.1 1-Hydroxyethylidene-1,1- diphosphonic acid (HEDP) 3x10 4 (B) SIM at m/z 110 TMP H 3 C P CH 3 CH 3 Fig.2 Trimethyl phosphate (TMP) DMP Mass spectrum of TMP min Time / min Fig.3 Chromatogram of aqueous solution of HEDP (10 ppm) obtained by reactive pyrolysis-gc/ms Pyrolyzer furnace temp.: 350ºC, GC oven temp.: ºC (20ºC/min, 3 min hold) Separation column: Ultra ALLY + - 5, (5% phenyl 95% dimethylpolysiloxane, L=30 m, id=0.25 mm, df=1 µm) Ref: T. Yuzawa, et al., J. Chromatogr. A, 1216 (2009) Keyword : rganophosphonate, scale inhibitor, reactive pyrolysis, GC/MS, TMAH Applications : Scale inhibitor, Pulp and paper industry Related technical notes : : Registered trademark of 3400 East Third Avenue
125 Double-Shot Pyrolyzer Application Note Analysis of Corrosive Gases Produced During Polyimide Curing Process (PYA3-002E) Polyimides are widely used dielectric materials in the semiconductor industry. Gases evolved during the curing reaction, however, are corrosive to electronic circuits, causing reliability problems. This gas release can be studied using EGA-MS using the Double-Shot Pyrolyzer (Technical Note No. PYA3-001) as well as with TGA. Fig. 1 shows the curing reactions of polyimide films. First, BPDA and 3,3 -DDS are heated at a lower temperature to produce polyamic acids. Next, the material is further heated at a higher temperature to give cured polyimde. The TGA curve (Fig. 2) shows the weight losses in the curing process. The two distinct stages of reaction are clearly evident at 100~350ºC, and at 350~450ºC. Fig. 3 shows the results of an EGA-MS study of this process. The first stage TGA weight loss in Fig. 2 matches the evolved material in Fig. 3 s region A and the second stage weight loss matches the EGA-MS data of region B. The compounds produced by EGA were separated and determined by GC. With MS, selected ion monitoring was used to show the profile of some of the compounds of interest in Fig. 3. These results indicate that DMAc, C2 and H2 are produced in the first stage of the curing process, and C2, S2 and aniline are produced in the second stage. As this example shows, EGA is an extremely useful tool for solving problems in polymer materials. + H2N S2 NH2 First stage heating 150ºC (30min) Polyamic acids Second stage heating 120 το 450ºC (3ºC/min) Polyimide Bisphenyl tetracarboxylic acid di-anhydride (BPDA) Sulfolnyl bisbenzamine (3,3-DDS) Fig. 1 Curing Process of Polyimide Gases 100 Region A. Weight loss in first stage Region B. Weight loss in second stage Weight (%) ºC First stage 11% 350ºC Second stage 16% Ion current intensity m/z=18 ( H2 ) m/z=44 ( DMAc, C2 ) m/z=87 ( DMAc ) H3C H3C N C DMAc m/z=64 ( S2 ) CH3 m/z=93 ( Aniline ) Temperature (ºC) Fig. 2 TGA Curve for Polyimide Curing Process Temperature (ºC) Fig. 3 EGA Curves of Polyimide Curing Process by Selected Ion Monitoring Keyword : Polyimide, Curing Process, Semiconductor industry, TG, EGA Application : General Polymer Analysis, Electronics, Microelectronics Industry : Registered trademark of
126 Double-Shot Pyrolyzer Application Note (PYA3-003E) Analysis of Flame Retardant Polymers Part 1 : Analysis of Evolved Gases using Atomic Emission Detector (AED) Because plastics used in enclosures of home appliances and office equipment require flame retardant properties, a variety of flame retardants have been studied. An example described here is elucidation of flame retardant mechanism of brominated polycarbonate (15%) and antimonious oxide (5%) (see Fig. 1) added, as flame retardants, to polybutylene terephthalate (PBT) using Double-Shot Pyrolyzer. Fig. 2 shows evolved gas curves of Sb, Br, and C contained in the flame retardant PBT. By the catalytic action of Sb 2 3, brominated compounds are eluted at lower temperatures than flammable gases such as butadiene and butylene terephthalate produced during the thermal decomposition of PBT, thus it is considered that the flame retardants inhibits the ignition of PBT at the early stage of decomposition. As shown here, observing the elution of targeted elements in the evolved gases by AED provides an insight into the effect of flame retardants. Base polymer : Polybutylene terephthalate (PBT), 80wt% C CCH2CH2CH2CH2 n Flame retardants : 1) Brominated polycarbonate, 15wt% 2) Antimonious oxide (Sb 2 3 ), 5wt% Br Br Br Br Br C C C Br Br Br Br x y Br Copolymer of tetra-bromo-bis-phenol A and bis-phenol A (2/1) Average degree of polymerization = 3 Fig. 1 Base Polymer and Structure of Flame Retardant Flammable components (Butadiene, butylene terephthalate, etc.) C (496nm) Br (476nm) Sb (218nm) ºC Fig. 2 Thermal Decomposition of Flame Retardant PBT bserved Using EGA (Detector : AED(Atomic Emission Detector), Atmosphere gas : He) Excerpt from Sato, H., Kondo, K., Tsuge, S., htani, H. & Sato, N., Polymer Degradation and Stability, 1998, 62, Keyword : Evolved Gas Analysis, Atomic Emission Detector, Flame Retardant, PBT, Brominated PC, Antimonious xide Applications : General Polymer Analysis : Registered trademark of
127 Double-Shot Pyrolyzer Application Note (PYA3-004E) Analysis of Flame Retardant Polymers Part 2 : Analysis of Evolved Gases (EGA) using Mass Spectrometer (MS) Fig. 1 shows chromatograms of evolved gases from flame retardant polybutylene terephthalate (PBT, see Double-Shot Pyrolyzer Technical Note, PYA3-003E). The chromatograms were obtained by programmed heating from 60 to 700ºC, followed by GC analysis of resultant evolved gases that were trapped at the head of GC column. In addition to decomposed products from PBT, brominated phenols, thermal decomposition products of brominated PC, and SbBr 3, produced from brominated PC and antimonious oxide, were also detected. Fig. 2 shows evolved gas curves obtained using MS as a detector (TIC) and mass chromatograms of characteristic ions of species A~E (shown in Fig 1). Dibromo phenol was detected at 350ºC; while flammable gases, hydrogen bromide, and antimony bromide, were detected at 380ºC. Thus, in evolved gas analysis using MS, obtaining characteristic ions of target species provides an insight into thermal properties of polymeric materials. A. CH 2CHCHCH 2 C. HBr TIC H Br H D. Br Br H Br CH Br H Br Br Br H B. HC CCH 2CH 2CHCH 2 CH 2CHCH 2CH 2C CH 2CHCH 2CH 2C CCH 2CH 2CHCH 2 CCH 2CH 2CHCH 3 Br MC m/z=362 E. SbBr 3 SbBr SbBr SbBr m/z min Fig. 1 Chromatograms of Thermal Decomposition Products of Flame Retardant PBT Components evolved in 60~700ºC range in He were trapped in Liq. N 2, then analyzed by GC/MS riginated from PBT A. CH2CHCHCH2 : m/z 54 B. HC CCH2CH2CHCH : 2m/z : 203 riginated from brominated PC Brominated PC + Sb 2 3 C. HBr : m/z 82 Br D. H : m/z 252 Br E. SbBr3 : m/z 362 TIC ºC Fig. 2 EGA Curves of Flame Retardant PBT by EGA/MS Excerpt from Sato, H., Kondo, K., Tsuge, S., htani, H. & Sato, N., Polymer Degradation and Stability, 1998, 62, Keyword : Evolved Gas Analysis, Flame Retardant, PBT, Brominated PC, Antimonious xide Applications : General Polymer Analysis, Effectiveness of Additives : Registered trademark of
128 Double-Shot Pyrolyzer Application Note (PYA3-006E) Analysis of Rubber components with EAG and EGA Polymer MS Library (EGA-MS LIB) The EGA-MS technique is a combination of Evolved Gas Analyzer coupled with mass spectrometer using Double-Shot Pyrolyzer; and is very useful as a primary searching technique for unknown polymer samples. An example shown below is the analysis of a rubber of unknown composition. Shown in Fig. 1 are the EGA curve of the rubber and mass spectra of peaks A and B observed. Peak A is considered to arise from a variety of additives due to low elution temperatures. To obtain further information, components in peak A need to be trapped at the GC column head, followed by GC/MS analysis (see Double-Shot Pyrolyzer Technical Notes, PYA1-004E, and PYA1-005E). Peak B is considered to be originated from thermal decomposition of the polymer backbone due to high elution temperatures. Table 1 shows the result of EGA-MS LIB search performed on the average spectrum of peak B. Polynorbornene and Acrylonitrile-butadiene rubber were found as plausible polymers. Library search employing EGA and EGA-MS LIB provides a plenty of information on the amount and desorption temperatures of additives contained in a sample, and is very useful for analysis of unknown materials as a primary search technique. 171 Table 1 Result of Library Search on Peak B Name Qual 1. Polynorbornene : Polynorbornene : Acrylonitrile-butadiene rubber : m/z m/z Peak B Peak A ºC Fig. 1 Evolved Gas Curve of a Rubber and Averaged Mass Spectra Pyrolysis temp.:50~600ºc (10ºC/min), Carrier gas : He 50kPa, 60ml/min, Split ratio :ca.1/50 EGA tube : id 0.15mm, Length 2.5m (UADTM-2.5N), GC oven temp. : 300ºC Injection temp.: 320ºC, Sample :ca. 0.5mg, Detector : MS, Scan range : m/z=29-400, Scan speed: 0.1 scans/sec PY-GC interface temp.: 320ºC (AUT mode) Keyword : Additives, Rubber, Evolved Gas Analysis, Library Search Applications : General Polymer Analysis, Rubber Related Industries : Registered trademark of
129 Frontier-Lab Technical Note (PYA3-007E) Thermal Degradation Studies of Flame-Retarded PBT by Temperature Programmed Py-GC/MS [Background] Studies of the degradation of flame retarded polymeric materials with use of conventional thermal analytical techniques such as thermogravimetry and differential thermal analysis have been reported. Here, temperature-programmed pyrolysis technique with MS as a detector was used to investigate the degradation. [Experimental] Flame-retarded polybutyleneterephthalate (PBT) consisted of PBT/brominated polycarbonate/ Sb 2 3 (80/15/5wt%). All the polymer samples were cryo-milled into a fine powder at liquid N 2 temperature prior to measurements.frontier Lab s PY-2010D pyrolyzer was connected to a quadrupole MS via Frontier Lab s Ultra ALLY-1 capillary separation column. During programmed heating of the furnace (60~700 C at 10 C/min), thermal degradation products were trapped at the head of the separation column which was coiled and immersed in N 2. Upon removing N 2, the oven temperature was then programmed (35~300 C at10 C/min). [Results] The figure below shows the TIC chromatograms of the cold trapped products from (a) PBT, (b) Br-PC, (c) FR-PBT, and (d) mass chromatogram for m/z362 (parent ion of SbBr 3 ). The chromatogram for FR-PBT in Fig. 3(c) has components observed for both PBT and Br-PC together with additional peaks (14 and 18) due to Br- PBT derivatives. From these results, it was demonstrated that the technique should be useful to obtain detailed information on the synergistic flame-retardancy of halogenated organic compounds/sb 2 3 system min Figure. 1 Typical gas chromatograms of the degradation products from (a) PBT, (b) Br-PC, (c) FR-PBT, and (d) mass chromatogram for m/z362 (parent ion of SbBr 3 ). *Contents excerpted from H. Sato, K. Kondo, S. Tsuge, H. htani, N. Sato, Polym. Degrad. Stab., 1998, 62, Keyword : Pyrolysis-GC-MS, Synergistic flame retardant system, FR-PBT, Thermal degradation Applications : Quality assurance, General polymer analysis Related technical notes : : Registered trademark of
130 Double-Shot Pyrolyzer Technical Note ( PYA3-012E ) Forensic Discrimination of Fibers by Evolved Gas Analysis and Library Search by F-Search [Background] In the area of forensic chemistry, the identification of an unknown fiber needs to be done quickly and accurately; the analytical method needs to be as simple as possible. Evolved gas analysis (EGA)-MS is a simple thermal analysis method that provides information about the gases evolving from a sample as it is heated. This method provides information such as the elution temperature of the volatiles and the pyrolysis temperature of the unknown polymeric fraction of the sample. The thermal distribution of the evolved gases along with the mass spectra data, enables the analyst to quickly identify an unknown fiber. This technical notes describes how EGA-MS can be used to compare different types of fibers. [Experimental] The 21 fiber samples used in this study are shown in Fig. 1. Thermograms of these fibers were obtained by EGA. Then a library containing the average mass spectra of the main peaks in each thermogram was created using F- Search. The 21 fibers were differentiated based up on the thermal distribution of the evolved gases (i.e. the peak shape of the thermograms) and the F-Search library search results. [Results] ne of the 21 fibers was randomly selected to serve as the unknown sample. The unknown samples was then searched using the newly created library. In Fig. 2, the three candidates with highest match qualities are shown. Candidates 1 and 2 have match qualities greater than 80, but their mass spectra are too similar to differentiate them. However, candidate 2 has two main peaks in its thermogram and is much different than the thermogram of the unknown. Candidate 1, polyester, had a mass spectrum and thermogram quite similar to that of the unknown sample. When there is more than one candidate with similar thermogram profiles and average mass spectra, they can most likely be differentiated using Py- GC/MS (see PYA3-013). Natural fibers Animal fibers Wool, silk Plant fibers Cotton, hemp Synthetic fibers Regenerated fibers Cupra, rayon, polynosic Semi-synthetic fibers Acetate, diacetate, vinylon, promix Synthetic fibers Nylon 6, polyester (PET), polyester (blended), polypropyrene, polyethylene, acrylic, polyvinyl chloride, polyvinylidene chloride, polychlal Fig. 1 Fiber samples used in this study Range averaged Unknown sample Candidate Polyester (PET) 122 Match quality 99% 149 Candidate 2 Polyester (blended) Match quality 84% Candidate Vinylon Match quality 16% ºC m/z Fig. 2 Comparing the EGA thermogram and average mass spectrum of the unknown fiber with the three search candidates with the highest match quality Pyrolyzer furnace temp.: ºC (20ºC/min), GC oven temp.: 300ºC, EGA tube: deactivated metal tube L=2.5 m, i.d.=0.15 mm Column flow rate: 1 ml/min; He, split ratio: 1/50, sample: ca. 300 µg Keyword : Fiber identification, Evolved gas analysis, EGA-MS, F-Search Applications : Forensic investigation Related technical notes : PYA1-016E, PYA3-006E, PYA3-013E Please forward your inquiries via our web page or send us a fax message. R&D and manufactured Saikon, Koriyama by : Frontier Fukushima-ken Laboratories Ltd. JAPAN Saikon, Koriyama, Fukushima JAPAN Phone: : Registered (81) trademark Fax: of (81) Double-Shot Pyrolyzer is a registered trademark of
131 Double-Shot Pyrolyzer Technical Note ( PYA3-013E ) Differentiating plant fibers using Py-GC/MS [Background] Forensic investigations often must be done quickly and accurately. The analytical method needs to be simple. Evolved gas analysis (EGA)-MS is a simple technique that enables the analyst to differentiate various polymers based on differences in the EGA thermogram and or the average mass spectrum of the major peak in the thermogram - see PYA3-12E. However, fibers having the same or very similar structures are difficult to differentiate using just the EGA results. Py- GC/MS provides information about the sample that can be used to differentiate between fibers with similar chemistries. This technical note describes how Py-GC/MS can be used to differentiate cotton and hemp. Cellulose is the major component of both plant fibers and dominates both EGA thermograms. [Experimental] Flash pyrolysis (600ºC) of cotton and hemp were obtained using the conditions listed below. [Results] Fig. 1 compares of the results obtained by EGA-MS for cotton and hemp. Both the thermograms and the averaged mass spectra of the main peaks ( ºC) for cotton and hemp are very similar, making it difficult to unequivocally identify the fiber. Pyrograms obtained by Py-GC/MS are shown in Fig. 2. Both pyrograms are similar; levo-glucosan is the main peak; however, peaks marked by an are different. Also, there are a series of peaks derived from wax are evident only on the hemp. As shown here, samples with the same major component can be differentiated by using Py-GC/MS and focusing on the small differences in the pyrograms. Thermograms Cotton Averaged range Cotton Levo-glucosan Hemp ºC x 5 Average mass spectra Cotton Hemp m/z m/z Fig. 1 Comparison of the thermograms and averaged mass spectra Pyrolysis temp.: ºC (20ºC/min), GC oven temp.: 300ºC EGA tube: deactivated metal tube, L=2.5 m, i.d.=0.15 mm Column flow rate: 1 ml/min; He, split ratio: 1/50, sample: ca.300 µg min Hemp min Wax Fig. 2 Comparison of the pyrograms Pyrolysis temp.: 600ºC, GC oven temp.: ºC (20ºC/min, 6 min) Separation column: Ultra ALLY + -5 (5% diphenyl 95%dimethylpolysiloxane) (L=30 m, i.d.=0.25 mm, df=0.25 µm) Carrier gas flow rate: 1 ml/min: He, split ratio: 1/50, sample: ca.100 µg x 5 Keyword : fiber identification, evolved gas analysis, Py-GC/MS Applications : Forensic investigation Related technical notes : PYA3-012E Please forward your inquiries via our web page or send us a fax message. R&D Frontier and manufactured Laboratories by : Ltd., Fukushima JAPAN Phone: (81) Fax: (81) : Registered trademark of Double-Shot Pyrolyzer is a registered trademark of
132 Multi-functional Pyrolyzer Technical Note ( PYA3-014E ) Viability of Evolved Gas Analysis with F-Search and an MS Library for Qualitative Analysis of Rubber Products [Background] In the area of forensic investigation and the food analysis, minute amounts of unknown samples often need to be differentiated in ashort period of time; therefore, a simple qualitative analysis technique is of interest. Evolved gas analysis with amass spectrometer (EGA-MS *1 ) using the multi-shot pyrolyzer allows simple thermal analysis of polymers in which evolved gases eluted from a heated sample are monitored. The major component of an unknown polymer can often be identified from the mass spectra in the EGA library. In this technical note, three common rubber types are analyzed by EGA-MS and the viability of the technique is demonstrated. [Experimental] Three commonly used rubber products were analyzed. For the qualitative analysis, F-Search along with the EGA-MS library *2) were used, and the match quality of mass spectra and EGA thermogram profiles were compared. [Results] The results obtained by EGA-MS of rubber samples and the search results using F-Search are shown in Fig. 1. There are apparent differences among the three EGA thermograms with major peaks arising from the decomposition of the polymer backbone. When the EGA averaged mass spectra were searched using F-Search and the EGA library, each rubber sample was unambiguously identified as the first candidate. Also, the EGA thermogram profiles agreed well with the library search results. (Note: The EGA-MS library contains both averaged mass spectra and EGA thermograms of standard rubber material and other polymers) EGA thermogram Averaged mass spectra Search results Butadiene m/z Polymer Match qual. 1. High cis-butadiene rubber Poly(1,2-butadiene) Polynorbornene 52 Natural rubber m/z 1. Natural rubber High cis-butadiene rubber Poly(1,2-butadiene) 10 Styrene-butadiene rubber (SBR) m/z 1. Styrene-butadiene rubber High cis-butadiene rubber Diallyl phthalate resin 25 Fig. 1 Results of EGA-MS analysis of rubber samples and search results using F-Search Pyrolyzer furnace temp.: ºC (20ºC/min), GC oven temp.: 300ºC, EGA tube: UADTM-2.5N (L=2.5 m, i.d.=0.15 mm), Column flow rate: 1 ml/min He, split ratio: 1/50, sample: ca. 100 µg Keyword : Rubber, Differentiation, Discrimination, Evolved gas analysis, EGA, F-Search Applications : Forensic discrimination, Food industry, Rubber industry Related technical notes : *1) PYT-004E, *2) PYA3-006E, PYA1-067E, PYA3-012E, PYA3-013E : Registered trademark of 3400 East Third Avenue
133 Double-Shot Pyrolyzer Application Note (PYA4-001E) Applications Using Carrier Gas Selector Part 1 : Pyrolysis of Polystyrene (PS) in Air Pyrolysis gas chromatography, PY-GC, is usually performed in an inert carrier gas such as helium. But there are some methods, such as combustion studies or investigations of toxic gas evolution which require an air atmosphere. These methods require careful modifications to the instrumentation. Fig. 1 shows the Carrier Gas Selector, CGS-1050E, which is a pyrolyzer accessory for convenient switching of the gas used during pyrolysis. Fig. 2 shows the advantages of this accessory. Fig. 2A is a chromatogram of pyrolyzates generated in an air atmosphere, and Fig. 2B shows a pyrogram run in helium. Pyrogram A has oxygen-containing compounds and aromatics (shown in red) that are not seen in pyrogram B. The Carrier Gas Selector also makes possible pyrolysis studies in other atmospheres, producing unique information not obtainable in conventional pyrolysis in helium. AIR PY He GC Fig. 1 Carrier Gas Selector (CGS-1050E) A. In Air * acetaldehyde * acetone benzene toluene styrene * benzaldehyde * acetophenone * 2-phenylpropanal * dodecanal naphthalene * 3-phenylpropanal styrene dimer styrene trimer B. In He min Fig. 2 Comparison of Pyrograms of PS btained in Helium and in Air Pyrolysis temp. : 550ºC, Carrier gas flow rate : 60ml/min, Column head pressure : 140kPa Separation column : 5% diphenyldimethylpolysiloxane, Length 30mm 0.25mm id., Film thickness 0.25µm, (UA5-30M-0.25F, Frontier Lab) GC oven temp. : 40ºC (1min) 20ºC/min 320ºC, Injection port temp. : 320ºC, Sample : 30µg, Detector : FID Keyword : Polystyrene, Carrier Gas Selector, Pyrolysis in Air Applications : General Polymer Chemistry, Environmental Assessment, Work Environment Analysis : Registered trademark of

134 Double-Shot Pyrolyzer Application Note (PYA4-002E) Applications Using Carrier Gas Selector Part 2 : Evolved Gas Analysis (EGA) of Polystyrene in Air In pyrolysis gas chromatography (PY-GC) and EGA, inert gases such as He is generally used as an atmosphere gas. However, air must be used as the atmosphere gas in the analysis of hazardous gases released in work environment or in combustion of polymers. Conventionally, this has required careful modifications of the equipment with professional knowledge. We have therefore developed a carrier gas selector (CGS-1050E, Fig. 1) which allows facile switching of atmosphere gases. Fig. 2A and Fig. 2B show evolved gas curves of PS obtained both in He and air atmospheres, respectively, as applications using this device. In Fig. 2A, peak at 420ºC arising from thermal decomposition of PS is observed in 360 ~ 480ºC rage, while in Fig. 2B, peak at 304ºC derived from oxidation of PS is observed in 270~380ºC range. See Double-Shot Pyrolyzer Tech Note PYA4-001E for applications of PY-GC. AIR PY He GC Fig. 1 Carrier Gas Selector (CGS-1050E) 420ºC A. In He 360ºC 480ºC 304ºC B. In Air 270ºC 380ºC ºC Fig. 2 Comparison of EGA Curves of PS under He and Air Atmospheres Pyrolysis temp.: 200~500ºC (20ºC/min), Carrier gas : He or Air 50kPa, Split ratio : ca.1/50 EGA capillary tube : 0.15mm id, 2.5m (UADTM-2.5N), GC oven temp.: 300ºC Injection port temp.: 320ºC, Amt. of sample : 60µg, Detector : FID Keyword : Polystyrene, Air Atmosphere, Evolved Gas Analysis, Carrier Gas Selector Applications : General Polymer Analysis, Environmental Analysis, Work Environment Analysis : Registered trademark of
135 Double-Shot Pyrolyzer Technical Note (PYA4-003E) Analaysis Examples Using Carrier Gas Switcher Part 3: Pyrolysis of Polycarbonate (PC) in Air Using Carrier Gas Switcher (CGS-1050E), Selective Sampler (SS-1010E), and MicroJet Cryo Trap (MJT-1030E), flash pyrolysis of polycarbonate (PC) was performed at 550 C both in air and He atmosphere. Pyrolyzates were analyzed by GC/MS. Fig. 1 compares pyrograms obtained both in air and He atmosphere. In the pyrogram obtained in He atmosphere, a large amount of bis-phenol A, monomer of PC, was found, in addition to phenols such as phenol and p-cresol. n the other hand, in the pyrogram obtained in air, a large amount of carbon dioxide was observed with a trace amount of phenols. The results demonstrates that when PC was pyrolyzed, a major portion of it was decomposed and oxidized in air at high temperature. Bisphenol A Atmosphere phenol p-cresol p-isopropenylphenol He Air C 2 p-benzoquinone min Fig. 1 Comparison of Pyrograms of PC btained in Air and He Atmosphere Pyrolysis temp: 550 C, Carrier gas; Helium, Column flow rate: 1ml/min, Carrier gas total flow rate: 60ml/min Separation column: Ultra ALLY-5 (5% diphenyldimethylpolysiloxane), Length: 30m, Id: 0.25mm, Film thickness: 0.25µm GC oven temperature: 40 C (1min hold) ~ 320 C (20 C/min), Injection port temp: 320 C, Sample size: 30µg Keyword: Polycarbonate, Carrier Gas Switcher, Pyrolysis in air Applications: General Polymer Analysis, Environmental analysis Reference: Hosaka et al. 5th Polymer Analysis Symposium, II-4, p43-44 (2000) : Registered trademark of
136 Double-Shot Pyrolyzer Technical Note (PYA4-004E) Analysis Examples Using Carrier Gas Switcher Part 4: Pyrolysis of Polyethylene (PE) in Air Using Carrier Gas Switcher (CGS-1050E), Selective Sampler (SS-1010E), and MicroJet Cryo Trap (MJT-1030E), flash pyrolysis of polyethylene (PE) was performed at 550 C both in air and He atmosphere. Pyrolyzates were analyzed by GC/MS. Fig. 1 compares pyrograms obtained both in air and He atmosphere (partly enlarged). In the pyrogram obtained in He atmosphere, diolefins, olefins, and n-paraffin arising from random fission or disproportionation of the PE main chain were found. n the other hand, in the pyrogram obtained in air, carbon dioxide and aldehydes with successive number of carbons were observed, apparently generated from thermal decomposition and oxidation in air at high temperature. C 14 C 15 C 12 C 13 C 16 C 17 Atmosphere n-c 12 n-c 12 n-c 12 He C 10 aldehyde C 11 aldehyde C 12 aldehyde C 13 aldehyde C 14 aldehyde C 15 aldehyde C 10 aldehyde C 11 aldehyde C 12 aldehyde C 13 aldehyde C 14 aldehyde C 15 aldehyde Air min n-c 6 n-c 10 n-c 20 n-c 30 He n-c 40 C 2 Air min Fig. 1 Comparison of Pyrograms of Polyethylene btained in Air and in Helium Atmosphere Pyrolysis temp: 550 C, Carrier gas; Helium, Column flow rate: 1ml/min, Carrier gas total flow rate: 60ml/min Separation column: Ultra ALLY-5 (5% diphenyldimethylpolysiloxane), Length: 30m, Id: 0.25mm, Film thickness: 0.25µm GC oven temperature: 40 C (1min hold) ~ 320 C (20 C/min), Injection port temp: 320 C, Sample size: 30µg Keyword: Polyethylene, Pyrolysis in He and in Air, Carrier Gas Switcher Applications: General Polymer Analysis, Environmental Analysis Reference: Hosaka, et al., 5th Polymer Analysis Symposium, II-4, p43-44 (2000) : Registered trademark of
137 Double-Shot Pyrolyzer Technical Note (PYA5-001E) Analysis of volatiles released from a UV curable resin using UV/Py-GC/MS technique [Background] UV curable resins are used in a wide spectrum of applications including microelectronics packaging, adhesives in electronics and optical parts, etc. The curing reaction generates volatile compounds from the resin, which corrode metal surfaces and deteriorate product quality; therefore, there is a need for qualitative and quantitative analysis of such volatiles. Here, a dry film was analyzed by ultraviolet light (UV) irradiation/pyrolysis-gc/ms technique. The dry film used was an acrylic UV curable resin and is used as a mask material for etching process in the electronics packaging. [Experimental] A small disc-shaped sample (3 mm in diameter, 350 µg) was cut out from a dry film sheet and was used for this experiment. The UV irradiation was conducted in He atmosphere at 60 ºC for 10 minutes using a micro UV irradiator (UV- 1047Xe) which uses a Xe lamp as a light source. During UV irradiation, volatiles evolved from the sample was cryo-trapped at the head of a separation column that was immersed in liquid nitrogen. When the UV irradiation was finished, the column was removed from the liquid nitrogen then the GC/MS analysis was initiated. For comparison, analysis of volatiles evolved from the resin under an identical condition but without UV irradiation was performed. [Results] Chromatograms of volatile components released from the resin with and without UV irradiation and their magnified view are shown in Fig. 1. Without UV irradiation, decomposed polymerization initiator was only observed, on the other hand, upon UV irradiation various organic compounds including 300 ppm of methyl methacrylate (MMA) against the original sample weight were observed. As shown here, the UV/Py-GC/MS technique allows you to analyze volatiles released from a UV curable resin during its curing process without complicated treatments. Without UV irrad. With UV irrad. C 2 2-Butanone MMA Tetramethylbutanedinitrile (riginated from initiator) x 1 x 1 Magnified Without UV irrad. Acetaldehyde Isobutene Methyl isobutanoate iso-butyric acid Methacrylic acid Methylstyrene x 10 With UV irrad. x min Fig. Analysis of volatiles released from UV curable acrylic dry film Micro UV irradiator: UV-1047Xe, separation column: Ultra ALLY + -1 (dimetylpolysiloxane, length 30 m, id 0.25 mm, film 0.5 µm), atmosphere gas: He Column flow rate: 1 ml/min, split ratio: 1/10, sample size: 350 µg (3 mm diameter disc), GC oven temp: 40 ~ 300 ºC (20 ºC/min) Keyword : Micro UV irradiator, UV curable resins, dry film Applications : Semiconductor packaging, Precision instrument Related technical notes : : Registered trademark of 363 Vintage Park Drive
138 Double-Shot Pyrolyzer Technical Note ( PYA5-002E ) Study of Photo/Thermal/xidative degradation of Polycarbonate Using UV/Py-GC/MS [Background] Although Polycarbonate (PC) is known to degrade when exposed to UV radiation, the degradation mechanism has not been unequivocally elucidated. The photo/thermal/oxidative degradation of PC was examined using a new analytical technique (Ultraviolet irradiation/pyrolysis (UV/Py)-GC/MS 1) ). [Experimental] A UV irradiator, UV-1045E, with a deuterium lamp was used. The sample temperature during UV irradiation was 100ºC and the UV irradiation of the sample was performed, in air, for 1 hour. The sample temperature was chosen in order to minimize the thermal degradation of the PC. Thus, changes in the PC can be attributed solely to photo degradation. When the irradiation was finished, the air in the system was purged using helium (He). The volatiles formed during irradiation were then analyzed (Fig 2). The irradiated PC was then analyzed using reactive pyrolysis. Tetramethyl ammonium hydroxide (TMAH) served as the reagent. [Results] Fig. 1 shows illustrates the expected degradation reactions of PC. It has been reported that scission of the PC polymer main chain at the carbonate bond and the formation of a branched structure through rearrangement are the major degradation pathways 2). Therefore, the monomer, bisphenol A (bisa), should be the primary volatile degradation product and the degraded polymer should have branched structures. Fig. 2, shows that the intensity of BisA peak increases by a factor of 10 when PC is irradiated. This indicates that the scission of carbonate bonds in the polymer chain occurred repeatedly. Fig. 3 shows the Rx/PY results on the degraded polymer. Without UV irradiation, peak A 1), known to be a branched structure, was barely visible, on the other hand after UV irradiation, peak A is easily observed. This simple experiment shows the value of UV/Py-GC. The identification of the PC degradation products and the analysis of the irradiated PC support degradation studies published by others. C(CH 3 ) 2 C Scission of polymer main chain In air atmosphere Photo/thermal energy Formation of branched structure through rearrangement reaction H C(CH 3 ) 2 H C(CH 3 ) 2 C C(CH 3 ) 2 Bisphenol A Branched structure C C(CH 3 ) 2 Fig. 1 Expected photo/thermal/oxidative degradation reactions of PC Bis-A Bisphenol A dimethyl ester CH 3 C(CH 3 ) 2 Peak A CH 3 CCH 3 UV irrad. FF UV irrad. N 5 10 min Fig. 2 Chromatograms of volatiles released from PC Column: UA + -1(L 30 m, id mm, df 0.25 µm), Flow rate: 1 ml/min, Split ratio: 1/10, Sample: ca.15 µg (thin film), GC temp.: ºC (20ºC/min), Thermal desorption (TD) temp.: ºC (20ºC/min) UV irrad. FF UV irrad. N min Fig. 3 Pyrograms obtained by reactive pyrolysis of the degraded PC Py furnace temp.: 400ºC, Reagent: TMAH (25 wt.% in methanol, 3 µl) Split ratio: 1/50, other conditions identical to those in Fig. 2. References: 1) C.Watanabe et al., Polymer Degradation and Stability, 94, ,2009 (2) K. ba et al., Macromolecules, 33, , 2000 Keyword : Polycarbonate, Photo/thermal/oxidative degradation, Bisphenol A, Weatherability test Applications : Photo/thermal/oxidative degradation tests Related technical notes : PYA2-001E, PYA5-001E Please forward your inquiries via our web page or send us a fax R message. & D and manufactured by: R&D and manufactured Saikon, Koriyama by : Frontier Fukushima-ken Laboratories Ltd. JAPAN Saikon, Koriyama, Fukushima JAPAN Phone: : Registered (81) trademark Fax: of (81) Double-Shot Pyrolyzer is a registered trademark of 363 Vintage Park Drive
139 Double-Shot Pyrolyzer Technical Note ( PYA5-003E ) Analysis of the photo/thermal/oxidative degradation products formed when high impact polystyrene (HIPS) is UV irradiated [Background] High impact polystyrene (HIPS) is a polystyrene (PS) / rubber copolymer. Because of its enhanced impact strength, it is extensively used in TV, printer cabinets, etc. utdoor exposure tests and weather meter tests are used to evaluate the polymer s stability; however, these techniques preclude the analysis of volatiles released during the degradation. This note reports the analysis of the volatiles emanating from HIPS when it is exposed to UV radiation using the Frontier UV irradiator. The micro UV irradiator was used with a xenon (Xe) lamp. [Experimental] 10 µl of a dichloromethane solution (2 mg/ml) of HIPS was placed in a sample cup. The sample was irradiated using the micro UV irradiator for 1 hr at 60ºC in air. Volatile degradation products were cryo-trapped by immersing the head of the separation column in liquid nitrogen. Upon the completion of UV irradiation, the air was purged from the system using helium and the irradiated sample was thermally desorbed (60 250ºC). The column was then removed from the liquid nitrogen and GC/MS analysis of the trapped vapors was conducted. [Results] Fig. 1 shows the chromatograms of the volatile degradation products from HIPS with and without UV irradiation. Benzaldehyde, acetophenone, and benzoic acid are the PS degradation products formed during the irradiation. 2-propenal is also observed. All identifications are based upon mass spectral data CH 2 Cl 2 UV irrad.: FF (1 hr), 60ºC, in air Thermal desorption: ºC (40ºC/min, 5 min) PS origin X System peak C min Acetaldehyde Formic acid 2.4 Acetic acid 2-Propenal Benzene Styrene Benzaldehyde Acetophenone Benzoic acid UV irrad.:n (1 hr), 60ºC, in air Thermal desorption: ºC (40ºC/min, 5 min) min Fig 1. Chromatograms of the volatile degradation products formed when HIPS is irradiated and not irradiated. <UV irradiation> Micro UV irradiator : UV-1047Xe, irradiation: 1 hr, furnace temp.: 60ºC, atmosphere gas: 10 ml/min Air, split ratio: 1/10 <GC/MS> Separation column: Ultra ALLY + -1 (polydimethylsiloxane, L=30 m, i.d.=0.25 mm, df=0.5 µm), GC oven temp.: 40ºC(5 min)-240ºc(20ºc/min), GC injection temp.: 250ºC, carrier gas: 50 ml/min He, split ratio: 1/50 Keyword : HIPS, Micro UV irradiator, Weather meter, Photo/thermal/oxidative-degradation, Volatile degradation product, Thermal desorption Applications : Weathering test Related technical notes : PYA5-004E Please forward your inquiries via our web page or send us a fax R message. & D and manufactured by: R&D and manufactured Saikon, Koriyama by : Frontier Fukushima-ken Laboratories Ltd. JAPAN, Fukushima JAPAN Phone: : Registered (81) trademark Fax: of (81) Double-Shot Pyrolyzer is a registered trademark of 363 Vintage Park Drive
140 Double-Shot Pyrolyzer Technical Note ( PYA5-004E ) EGA thermogram of degraded high impact polystyrene <Correlation with Xe weather meter test> [Background] UV-degraded high impact polystyrene (HIPS), reported in PYA5-003E, was analyzed using evolved gas analysis (EGA)-MS. The correlation between the results obtained with the micro UV irradiator and those obtained with a conventional Xe weather meter was investigated. [Experimental] 10 µl of a dichloromethane solution of HIPS (2 mg/ml) was placed in a sample cup (two side openings) and irradiated for 30 min, 1 hour, and 12 hours using the micro UV irradiator at a furnace temperature of 60ºC in air. EGA was performed. In the Xe weather meter experiments, the HIPS plate was irradiated for 100 and 300 hours. At 100 and 300 hours the portion of the surface was scraped off and 20 µg was used for the EGA. [Results] When a HIPS sample is irradiated for 1 hour using the micro UV irradiator, the peak apex decreases 10ºC, and the onset of pyrolysis decreases from 360 to 300ºC. Furthermore, the peak becomes broader. Also, size-exclusion chromatography reveals that the average molecular weight decreases from 285,000 to 240,000, indicating that the polymer s main chain is degraded. A second HIPS sample was irradiated for 300 hours using a Xe-weather meter. The peak apex decreases by 14ºC and the onset of pyrolysis decreases from 360 to 280ºC. The HIPS thermograms obtained after irradiation using the micro UV irradiator and the weather meter are almost identical. The micro UV irradiator provides comparable data to that obtained using a weather meter in much less time. More polymer formulations can be quickly evaluated which not only reduces the cost/sample but encourages polymer formulators to evaluate a larger number of polymer possibilities, perhaps leading to the discovery of a polymer with novel characteristics. Pyrolyzer/black panel temp.: ca. 60ºC [Micro UV irradiator] Atmosphere gas: Air Wavelength: 280~450 nm Radiation output: 700 mw/cm 2 10ºC Before UV irradiation (control) 30 min irradiation 300ºC 360ºC 1 hour irradiation 12 hour irradiation [Weather meter] Wavelength: 320~700 nm Radiation output: 34 mw/cm 2 14ºC Before UV irradiation (control) 100 hour irradiation 300 hour irradiation 280ºC 360ºC ºC Fig. 1 Thermograms obtained before and after irradiation by UV/Py-GC/MS (top) and Xe weather meter (bottom). Pyrolyzer temp.: ºC (20ºC/min), GC oven temp.: 300ºC, UADTM-2.5N (L=2.5 m i.d.=0.15 mm) Carrier gas flow rate: 1 ml/min; He, split ratio: 1/50, sample:20µg Keyword : HIPS, micro UV irradiator, weather meter, EGA, thermogram, photo/thermal/oxidative degradation Applications : Weathering tests Related technical notes : PYA5-003E Please forward your inquiries via our web page or send us a fax R message. & D and manufactured by: R&D and manufactured Saikon, Koriyama by : Frontier Fukushima-ken Laboratories Ltd. JAPAN Saikon, Koriyama, Fukushima JAPAN Phone: : Registered (81) trademark Fax: of (81) Double-Shot Pyrolyzer is a registered trademark of 363 Vintage Park Drive
141 Double-Shot Pyrolyzer Technical Note (PYT-001E) Features of Double-Shot Pyrolyzer PY-2020D & id Part 1 : Two Guaranteed Performance Specs High Performance and High Reliability of Pyrograms A newly developed pyrolysis furnace and controller by Frontier Laboratories make it possible to guarantee the reproducibility of pyrograms. Frontier guarantees that in styrene pyrolysis at 550ºC, the response ratio of styrene trimer to monomer is 14 % +/- 1.5%, and the relative standard deviation (RSD) is less than 3% using Flame Ionization Detector. Another guarantee Frontier offers is an evidence for complete deactivation of the flow path from the sampler to the detector, and minimum dead volume in the sample s flow path (see Technical Note PYT-002E) Polystyrene Response Ratio Precision and Reproducibility Among 100 Different Pyrolyzers Precision of Trimer/Monomer peak area ratios R.S.D. Reproducibility for SSS/S% (%) Pyrogram of polystyrene at 550 o C Ultra ALLY-5, 30m, 0.25mm id, 0.25um at o C, 20 o C/min, Monomer S (%) 15 Relative SSS yield against S Dimer Trimer SSS SS units Pyrolyzer production No min Keyword : Basic Performance, Reproducibility Among Pyrolyzers, Polystyrene Application : Polymer Chemistry, Forensic Science, Environmental Science : Registered trademark of 363 Vintage Park Drive
142 Double-Shot Pyrolyzer Technical Note (PYT-002E) Features of Double-Shot Pyrolyzer PY-2020D & id Part 2: High Performance and High Reliability of Pyrograms Inertness of the Sample Path and Minimal Dead Volume In Pyrolysis, it is crucially important that the entire sample path be inert with minimal dead volume. This applies to the pyrolyzer, its interface, and the GC column, all the way to the detector. Before the column, the sample path is contained within a quartz pyrolysis tube which extends from the furnace through the interface (ITF), a low-volume metal needle into the GC injection port, and a fused silica liner. All metal parts exposed to the sample are deactivated by Frontier s proprietary technology used in manufacturing Ultra ALLY metal capillary columns. (Note 1) Before each instrument is shipped, performance is confirmed with a test sample (Test Mix-1). It is injected into the Pyrolysis furnace, and the chromatogram is compared with an injection directly into the GC injection port (without the Pyrolyzer). Since peaks 1 through 9 in the chromatogram are substantially the same, it demonstrates that there are no abnormalities, minimal dead volume and no active sites. Even the polar compounds 2, 3, 5, and 8 are not affected by the pyrolyzer. As this performance has never been achieved by conventional pyrolyzers before, Frontier add the passing with this test to the specifications of PY-2020D/iD. Note 1: Because the pyrolyzates contain a large amount of high boiling components such as tars, the GC column needs to be more resistant to contamination. The Ultra ALLY metal capillary column, which is standard in the Double-Shot Pyrolyzer, has four times greater resistance against contamination. Injected into GC Injection Port Injected into Pyrolysis Furnace Sample: Test mix-1 1. undecane 2. 4-chlorophenol 3. 1-decylamine 4. tridecane 5. methylcaprate 6. tetradecane 7. acenaphthylene 8. 1-dodecanol 9. pentadecane min min Fig.1 Demonstration of the PY-2020D s Inertness and minimal Dead Volume Separation column : 5% diphenyldimethylpolysiloxane, 30m, 0.25mm id, Film thickness: 0.25µm (UA5-30M F, Frontier Laboratories) GC oven temp : 70ºC 10ºC/min 200ºC, injection port temp : 320ºC, Detector : FID 350ºC, Pyrolysis furnace temp : 400ºC, PY-GC ITF temp : 320ºC, Carrier gas : He 140kPa, Split ratio : 1/60, Sample : Test Mix-1, 1µL, 500ppm (hexane solution) Keyword : Basic Performance, Py/GC system, Inertness, Text Mix-1 Application : Polymer Chemistry, Environmental Science, Quality Assurance : Registered trademark of 363 Vintage Park Drive
143 Double-Shot Pyrolyzer Technical Note (PYT-003E) Features of Double-Shot Pyrolyzer PY-2020D & id Part 3: Elution of High Boiling Components and its Importance High Performance and High Reliability References: Part 1: Excellent Reproducibility of Pyrograms (Technical Note No.PYT-001E) Part 2: Inertness and Small Dead Space from Sampler to Detector (Technical Note No.PYT-002E) Part 3 System structure with minimized cold spots from sampler to detector In analysis of high boiling components generated from pyrolysis of a polymer, it is extremely important that there should be no cold spots in the flow path from the pyrolyzer to the column inlet. ur Double-Shot Pyrolyzer has a dedicated heater to heat the interface (ITF) located between the pyrolyzer and the GC inlet, allowing the flow path with minimal cold spots. Therefore, as shown in Fig. 1 high boiling components such as C 40 are eluted off in 87% yield of the theoretical value. This demonstrates that our Pyrolyzer offers far better elution performance compared to conventional pyrolyzers. C16 C18 C22 C24 C28 P S C32 C34 C16~C44 : Paraffins P : Methyl palmitate S : Methyl stearate C36 C40 peak area C18 peak area X 100 = 87% C38 C40 C min Fig. 1 Elution Performance of High Boiling Components (by thermal desorption) Column: 5% diphenyl dimethyl polysiloxane, 30m, 0.25mm id, film thickness 0.25µm (UA5-30M-0.25F, from Frontier Labs) Thermal desorption temp.: 50~350ºC(3min) at 30ºC/min, PY-GC ITF Temp.: 320ºC, GC oven temp.: 70ºC~340ºC at 20ºC/min, Inlet temp.: 320ºC Detector: FID 350ºC, Carrier gas: He 140kPa, Split ratio: 1/60, Sample: Test Mix-2, 5µL, 500ppm each (hexane solution) Keyword : Basic Performance, Py-GC System, Elution of High Boiling Components Applications : Polymer Chemistry, Environmental Science, Quality Assurance : Registered trademark of 363 Vintage Park Drive
144 Double-Shot Pyrolyzer Technical Note (PYT-004E) Three Analytical Techniques of Double-Shot Pyrolyzer PY-2020D & id Part 1: Evolved Gas Analysis This is a simple thermal analysis method in which a sample temperature is continuously raised and resulting evolved gases are directly measured by a detector. The data obtained provides a lot of information 1),2) including thermal desorption parameters for volatile components and start/end temperatures for pyrolysis of a polymer. Fig. 1 shows the configuration of the instrument. Double-Shot Pyrolyzer is connected to a detector via an EGA tube (a deactivated metal capillary tube designed for evolved gas analysis, 0.15mm id, 2.5m in length), and the GC oven temperature is held constant at 300ºC. This setup allows evolved gases from a heated sample inside the pyrolyzer to be directly measured by a detector. Note that the transfer line, an EGA tube, is placed inside the GC oven to afford a system with no cold-spot in the flow path up to the detector. Fig. 2 shows an EGA curve of acrylonitrile butadiene rubber (NBR). A broad peak arising from volatile components such as additives is observed in the 120ºC to 300ºC region. Another peak observed in the 320ºC to 500ºC region is due to main components from thermally decomposed NBR. These results indicate that volatile components from the sample should be analyzed by thermal desorption from 100ºC to 300ºC, while instant pyrolysis of the polymer should be performed in the 550ºC region, +50 to 100ºC above the peak end temperature. Reference: 1) PYA3-001E (Correlation of Thermal Gravimetric Analysis and Evolved Gas Analysis using Double-Shot Pyrolyzer) 2) PYA1-004E (Analysis of Antioxidants in Acrylonitrile Butadiene Rubber) Double-Shot Pyrolyzer {40~800ºC (1~100ºC/min)} A detector such as MS Pyrolysis furnace temp.: 50~600ºC at 20ºC/min Interface temp.: 320ºC Injection port temp.: 320ºC Column oven temp.: 300ºC Detector : FID Polymer components Temp.Cont. EGA tube Volatile components GC oven (300ºC constant) Fig. 1 Configuration of Evolved Gas Analysis Keyword : Basic Performance, Py-GC System, Evolved Gas Analysis Application : General Polymer Analysis ºC Fig. 2 Evolved Gas Curve of NBR : Registered trademark of 363 Vintage Park Drive
145 Double-Shot Pyrolyzer Technical Note (PYT-005E) Three Analytical Techniques of Double-Shot Pyrolyzer PY-2020D & id Part 2 : Instant Pyrolysis (Single-Shot Technique) In the instant pyrolysis technique, a polymer material is heated to 400~600ºC in an extremely short period of time, less than 20 msec, and resulting fragments generated is analyzed by gas chromatography to give a pyrogram. The pyrogram provides an insight into the chemical structure of the polymer. Fig. 1 shows the structure of the Pyrolyzer (Frontier Lab Ltd.). The operation is briefly described. A sample cup loaded with a sample is held at the bottom of the single shot sampler, and it is set so that the sample cup is positioned at (A) in Fig. 1, where the temperature is near ambient temperature. Pressing the sample drop button drops the sample cup to the position (B), the center of heating furnace whose temperature has been set previously. Components produced travel through the interface heater (300ºC) and deactivated interface and are introduced to the GC injection port. The advantages of this system, which uses gravity to drop the sample to the pyrolysis furnace, include rapid pyrolysis and excellent reproducibility of pyrograms with minimal personal differences. 1,2) Also by minimizing cold spots between the furnace and the GC injection port, high boiling components (e.g. C 40 ) and polar components can be introduced to the separation column without absorption in the flow path. 3) When the analysis is completed, the sample cup can be easily retrieved using a tool, Eco Pickup, by inserting it into the quartz pyrolysis tube. 1) C. Watanabe, Bunseki, 1996, 9, 747 2) Double-Shot Pyrolyzer Tech Note, PYT-001E 3) Double-Shot Pyrolyzer Tech Note, PYT-002E, PYT-003E Single-shot sampler Chuck Sample cup initial position (A) Sample cup end position (B) Quartz pyrolysis tube Interface heater Interface needle Injection port insert GC injection port Sample drop button Sample cup Pyrolysis furnace (50~800ºC) GC oven Separation column Fig. 1 Structure of a micro furnace Pyrolyzer Keyword : Basic Performance, Flash Pyrolysis, Single-Shot Technique, Structure Applications : General Polymer Analysis : Registered trademark of 363 Vintage Park Drive
146 Double-Shot Pyrolyzer Technical Note (PYT-006E) Three Analytical Techniques of Double-Shot Pyrolyzer PY-2020D & id Part 3 : Multi-Step Pyrolysis (Double-Shot Technique) In the double-shot technique, selective thermal desorption of volatile components by programmed heating of a polymer sample is performed, followed by pyrolysis of the sample with the single-shot technique, thus providing a deferent set of information from a single polymer sample. Fig. 1 shows the sequence of operation in double-shot technique. (1) a sample cup is mounted on a double-shot sampler, which can move up and down, (2) the double-shot sampler is brought down into the heating furnace to perform thermal desorption under the temperature condition determined from the evolved gas curve 1). (3) the sampler is then pulled up to the stand-by position at which temperature is room temperature. (4) volatile components produced from the thermal desorption is analyzed by GC. During this period, the furnace is heated to a higher temperature for instant pyrolysis. Upon the completion of the thermal desorption and GC issues READY signal, the sample is dropped to the pyrolysis furnace by pressing the sample drop button to perform instant pyrolysis. 1) Double-Shot Pyrolyzer Technical Note, PYT-004E (1) Loading sample (2) Lowering sample cup to furnace Sample drop button for thermal desorption Double-Shot sampler (3) Retrieving sample cup (4) Dropping sample to furnace for pyrolysis PUSH Sample cup He Heating furnace (Thermal desorption / Pyrolysis) Interface heating furnace GC injection port Interface needle T 3 :600 T 2 :250 Auto cooling Pyrolyzer furnace temp. : Sample temp. : T 1 :40 Thermal desorption Flash pyrolysis (<20 msec) GC analysis Thermal Desorption Chromatogram Pyrogram Fig. 1 perations in Double-Shot Technique and Temperature / Chromatogram relationship Keyword : Basic Performance, Double-Shot Technique, peration Application : General Polymer Analysis : Registered trademark of 363 Vintage Park Drive
147 Double-Shot Pyrolyzer Technical Note (PYT-007E) Correlation Between Evolved Gas Analysis and Thermal Gravimetric Analysis with the Double-Shot Pyrolyzer Evolved Gas Analysis, EGA, coupled with a Double-Shot pyrolyzer is a simple thermal analytical technique in which the polymer temperature is continuously increased, and the gases produced are detected and analyzed in real time. This produces information about volatile components in the sample, and start and end temperatures of thermal decomposition. Fig. 1 shows the EGA setup. The GC injection port and detector are connected with a deactivated metal capillary tube, 2.5m long and 0.15mm id, which is held isothermally at 300ºC in the GC oven. In Fig. 2, an EGA curve for polyvinyl acetate, PVAc, correlates well with the TGA data. The EGA apparatus based on a pyrolyzer and GC/MS has some other advantages. The mass spectrometer permits identification of evolved materials, and selected ion monitoring can give the evolved profile of single compounds. The GC oven makes it easy to clean out high-boiling material after analysis. Conventional TGA apparatus does not have these advantages. Double-Shot Pyrolyzer [40~800ºC (1~100ºC/min)] (a) TGA 100% 345ºC 452ºC 50 Detector (MS, etc.) 0 Temp.Controller EGA tube Poly(vinyl acetate) : PVAc [ CH 2 CH(CCH 3 ) ] n GC oven (300ºC isothermal) (b) EGA Fig. 1 Setup of Evolved Gas Analysis ºC Fig. 2 Analysis of PVAc With EGA and TGA Keyword : EGA, TGA, Correlation, Thermal Analysis Application : General Polymer Materials : Registered trademark of 363 Vintage Park Drive
148 Double-Shot Pyrolyzer Technical Note (PYT-008E) Temperature Stability and Cooling Performance of Double-Shot Pyrolyzer (PY-2020D) In analysis with pyrolysis gas chromatography (Py-GC), because the pyrolysis temperature of a sample greatly influences the pyrogram obtained, the temperature control of the pyrolysis furnace is one of the most important performances. Fig. 1 shows a temperature profile of pyrolysis furnace of Double-Shot Pyrolyzer. When the set temperature of pyrolysis furnace was 600ºC, the temperature fluctuation was 600+/-0.5ºC, while the set temperature was 40ºC, it was 40+/-1ºC. Also, in Evolved Gas Analysis in which heating and cooling are repeated, the cooling rate of the pyrolysis furnace greatly influences the efficiency in continuous analysis. Double- Shot Pyrolyzer employs a forced cooling of the pyrolysis furnace with cooling gas (nitrogen or air), and can achieve a rapid cooling from 600ºC down to 40ºC within 20 min. 1) Double-Shot Pyrolyzer Technical Note, PYT-004 Sample cup Pyrolysis furnace Interface heating furnace GC injection port Cooling gas In Exit Fig. 1. Structure of Double-Shot Pyrolyzer Pyrolysis furnace temp. ºC Cooling starts 600+/-0.5ºC 40+/-1ºC 100 ~20min 0 0 Fig. 2 Temperature Profile of Pyrolysis Furnace 50 min Keyword : Heating Furnace, Cooling Rate, Temperature Control Application : General Polymer Analysis : Registered trademark of 363 Vintage Park Drive
149 Double-Shot Pyrolyzer Technical Note (PYT-009E) Temperature Profiles and Pyrolyzer Heating Systems Heating system of pyrolyzer is categorized into pulse system (filament and curie point types, etc.) and continuous heating system (heating furnace type). Fig. 1 shows temperature profiles of pyrolyzers with two different heating systems. In pulse system the sample is heated and is held at 200~300ºC for a few minutes prior to pyrolysis; therefore, the sample exposes to high temperatures before pyrolysis. Fig. 2 shows a pyrogram obtained at 600ºC for three kinds of epoxy resins having experienced different thermal histories. Because epoxy resins are thermoset resins, cross-linkage occurs as they are heated. This is shown in pyrograms b and c. The amount of components having epoxy structure is found to be reduced compared to that of unheated sample (pyrogram a). Therefore, in pyrolyzers with pulse heating system, pyrograms are likely to give dissimilar patterns depending on how long the sample is held at the temperature prior to pyrolysis. n the other hand, in pyrolyzers with continuous heating system, the sample held at room temperature is dropped instantly, by free-fall, to the pyrolysis furnace. This type of pyrolyzers give pyrograms with good reproducibility in pyrolysis of epoxy resins, known to be greatly influenced by its thermal history. ºC ~ 0 Set sample Pulse System (Curie point and Filament) Evaporation Denaturation Cross linking Degradation min Pyrolysis ºC Continuous Heating System (Vertical furnace) Room temp min Set sample Pyrolysis Fig. 1 Temperature Profiles of Pulse and Continuous Heating Pyrolyzer ~ ~ a. unheated Prepolymer 100 parts Curing agent 80 parts (Acid anhydride) C C C C C C C C C C C H C C C H C C H C C C C C C C C C C C C C b. Held at 250ºC for 5 min c. Held at 100ºC for 3 hr min Fig. 2 Effects of Thermal History of Epoxy Resins in Program Pyrolysis temp.: 600ºC, Sample : 0.15mg Excerpt from State of the Art in Pyrolysis GC (S. Tsuge, H. tani), Pyrolysis Gas Chromatography Seminar (Yokogawa Analytical Systems, Frontier Lab Ltd.) Keyword : Thermal History, Filament, Curie Point, Heating Furnace, Epoxy Applications : General Polymer Analysis, Electric and Electronics Industry : Registered trademark of 363 Vintage Park Drive
150 Double-Shot Pyrolyzer Technical Note (PYT-010E) Comparison of Free-Fall Sample Introduction versus Sliding Sample Introduction In pyrolyzers with a heating furnace, pyrogram patterns are greatly influenced by the rate of sample introduction into the heating furnace. In order to attain a good reproducibility, the sample introduction into the furnace must be done in a shortest period of time at a constant rate in each run. The sample introduction by the action of gravitational free-fall system developed by S. Tsuge (see Fig. 1A) 1) allows rapid sample introductions at constant rate. Table 1 compares the reproducibility of polystyrene pyrograms (see Fig. 2) obtained by a sliding system (manually sliding sample into furnace, see Fig. 1B) and by a free-fall system. When the sample was manually inserted into the furnace in about 1 sec and 2 sec, the reproducibilities of formation of styrene monomer and styrene trimer were 2.43% and 6.12%, respectively. n the other hand, the free-fall system was found to give an excellent reproducibility of 0.63%. 1) S.Tsuge, & T.Takeuchi, Analytical Chem., 1977, 49, Table 1 Comparison of Reproducibility of PS Pyrograms btained by Sliding and Free-fall Systems Sample Introduction Sliding system (1sec) Sliding system (2sec) Free-fall system SSS/S (%) RSD (%) Chuck Sample cup Free-fall Sliding sampler Manual sliding Styrene monomer (S) dimer (SS) trimer (SSS) Heater GC Inj. port Column A. Free-Fall System B. Sliding System Fig. 1 Free-fall and Sliding Systems Keyword : Free-Fall System, Pyrolysis Speed, Reproducibility, Polystyrene Applications : General Polymer Analysis min Fig. 2 Pyrogram of PS btained by Free-fall System Sample : 30µg, Pyrolysis temp.: 550ºC, He pressure : 140kPa, Split ratio : 1/50, Column : 5% diphenyl polysiloxan, 30m, 0.25mm id, Film thickness : 0.25µm (Ultra ALLY + -5, Frontier Lab Ltd.) GC oven temp.: 70~320ºC (20ºC/min) : Registered trademark of 363 Vintage Park Drive
151 Double-Shot Pyrolyzer Technical Note (PYT-012E) Effects of Pyrolysis Temperature to Pyrograms In pyrolysis gas chromatography (Py-GC), the pyrolysis temperature of a sample is one of the most important factors influencing analytical results. Generally, as the pyrolysis temperature becomes higher, higher percentages of low molecular weight compounds of pyrolyzates are obtained. An effect of pyrolysis temperature to a pyrogram of polystyrene (PS) is described as an example. The pyrogram of PS (Table 1) contained styrene monomer (S), styrene dimer (SS) and styrene trimer (SSS). Higher pyrolysis temperature gave a lower percentage of SSS against S, and the ratio of SSS/S decreased almost linearly. A. Pyrolysis temp.: 450ºC B. Pyrolysis temp.: 550ºC S C. Pyrolysis temp.: 650ºC S S SS SSS SS SSS SS SSS 0 10min 0 10min 0 10min SSS/S peak area ratio (%) Pyrolysis Temperature (ºC) Fig. 1. Pyrolysis Temperature vs. SSS/S Ratio in Pyrogram of PS Sample: 30µg, Injection port pressure : 140kPa, Split ratio : 1/50, GC oven temperature : 70ºC~320ºC (20ºC/min) FID Column :5% diphenylpolysiloxane, Length 30m, Id 0.25mm, Film thickness 0.25µm (Ultra ALLY + -5, Frontier Labs) Sample cup SS (P/N : PY1-F003, for single-shot (5 L) platinum) Keyword : Pyrolysis Temperature, Polystyrene Applications : General Polymer Analysis : Registered trademark of 363 Vintage Park Drive
152 Double-Shot Pyrolyzer Technical Note Edited ct_2004 (PYT-013E) Empirical Determination of Proper Pyrolysis Temperature In pyrolysis gas chromatography (Py-GC), the pyrolysis temperature of a given sample among one of the most important factors influencing analytical results. In order to obtain a good reproducibility, finding a proper pyrolysis temperature is important. Using polystyrene (PS) as a sample, effects of pyrolysis temperature to the reproducibility of their pyrograms is described. The pyrogram of PS (Fig.1) comprises styrene monomer (S), styrene dimer (SS) and styrene trimer (SSS). Fig. 2 shows a plot of the observed relative standard deviation, RSD (%) for the formation ratio (SSS/S) against pyrolysis temperature. RSD curve shows the minimal at 550ºC, and rises as the pyrolysis temperature above 550ºC. Pyrolysis temperature giving an excellent reproducibility can be empirically determined to be about 50ºC above the finishing temperature of the EGA curve obtained by the evolved gas analysis technique 1 (EGA) ). The optimum pyrolysis temperature for a given polymer sample changes depending on its thermal characteristics such as thermal stability, depolymerizability and etc. depending on compounds to be analyzed 2). 1) Double-Shot Pyrolyzer Technical Note, PYT-004 2) Basic Pyrolysis Gas Chromatography of Polymers and Database, P9, S.Tsuge and H. htani Reproducibility of SSS/ ratio (RSD(%), n=5) Pyrolysis Temperature (ºC) Fig. 2. Plot of Reproducibility of SSS/S (%) vs. Pyrolysis Temperature Sample cup SS (P/N : PY1-F003, Single-Shot (5µL), platinum) S min Fig. 1. Pyrogram of PS Sample : 30µg, Pyrolysis temp.: 550ºC, Split ratio : 1/50 Column : 5% diphenylpolysiloxane, Length 30m, Id 0.25mm Film thickness 0.25µm, (Ultra ALLY + -5, Frontier Labs) GC oven temp.: 70ºC~320ºC (20ºC/min), Detector : FID Proper pyrolysis temperature (550ºC) Finishing temp ºC Fig. 3. EGA Curve of PS Pyrolysis temp.: 100ºC~6000ºC (20ºC/min), Carrier gas : He 50kPa, Split ratio : ca. 1/50 EGA capillary tube : Id 0.15mm, Length 2.5m (UADTM-2.5N) GC oven temp.: 300ºC, Injection. port temp.: 320ºC, Sample : 30µg, Detector : FID SS SSS Keyword : Proper Pyrolysis Temperature, Polystyrene, Reproducibility, Evolved Gas Analysis Applications : General Polymer Analysis : Registered trademark of 363 Vintage Park Drive
153 Double-Shot Pyrolyzer Technical Note (PYT-014E) Reproducibility of EGA Curves In Evolved Gas Analysis (EGA) EGA is a thermal analysis technique in which a sample is continuously heated and gases evolved are not separated but directly detected. Data obtained by this technique provides useful information such as thermal desorption conditions of volatile components released from sample and start/end temperatures of pyrolysis 1). The reproducibility of EGA curves utilizing Double-Shot Pyrolyzer is described here. Fig. 1. shows EGA curves of polystyrene (PS) obtained by heating a sample from 100ºC to 600ºC at 20ºC/min. The process was repeated 5 times. A peak arising from thermal decomposition of PS is observed at 340ºC~470ºC in each run. The average temperature of 5 peaks was 441.6ºC+/-1ºC (top of peak). This clearly shows that excellent reproducibility has been obtained. 1) Double-Shot Pyrolyzer Technical Note, PYT ºC n= ºC n= ºC n= ºC n= ºC n= ºC Fig. 1 EGA Curves of PS Keyword : Evolved Gas Analysis, Reproducibility Application: General Polymer Analysis Pyrolysis temp.: 100~600ºC (20ºC/min), Carrier gas : He 50kPa, Split ratio: ca. 1/50 EGA capillary tube : Id 0.15mm, Length 2.5m (UADTM-2.5N) GC oven temp.: 300ºC, Injection temp.:320ºc, Sample : 30µg, Detector : FID : Registered trademark of 363 Vintage Park Drive
154 Double-Shot Pyrolyzer Technical Note (PYT-015E) perational Principle of Auto Shot Sampler (AS-1020E) Auto Shot Sampler is an automated sampling system for continuous analysis operation controlled by a PC, in which sample cups are introduced into the pyrolysis furnace by free fall action and are then retrieval by pressurized carrier gas upon analysis is complete. Fig. 1 illustrates step-by-step operations. Sample Cup Introduction: ne of the sample cups loaded in carousel moves to position A (1 in Fig. 1). Then both V2 and V1 open to allow the sample cup to drop to position B for stand by (2 in Fig.1). V2 and V1 then close and the path is purged with carrier gas for 30sec. This is followed by opening of V3 to allow the sample cup to free fall into the pyrolyzer furnace to initiate pyrolysis and analysis (3 in Fig. 1). Sample Cup Retrieval: nce analysis is over and GC oven temperature is cooled down to the initial temperature, V1, V2, and V3 open. Then V4 opens to allow pressurized carrier gas to be introduced between the furnace and GC injection port. This will blow the sample cup up into the recovery tray (4 in Fig. 1). Carousel (48 cups max) A V1 V2 Purge V3 B Sample cup recovery container He Example: 100ml/min Pyrolyzer furnace (PY) V4 GC INJ 1. Sample cup moves onto V1. 2. Sample cup in stand by position (V1, V2, V3, and V4 closed) with dead space purged Pressurized carrier gas for sample cup retrieval GC INJ GC INJ GC INJ V1: Sample cup introduction shutter, V2: Ball valve, V3: Sample cup drop control pin, V4: EM valve for pressurized carrier gas A: Sample cup drop position, B: Sample cup stand by position Fig. perational Sequence of Auto Shot Sampler 3. Sample cup drops into 4. Sample cup retrieval PY (V3 opens to start flash (V1, V2, V3, and V4 open) pyrolysis) Reference: Sato, et al., 5th Polymer Analysis Symposium, III-2, p71-72 (2000) Keyword : Auto Shot Sampler, perational Principle Applications : General Polymer Analysis : Registered trademark of 363 Vintage Park Drive
155 Double-Shot Pyrolyzer Technical Note Reproducibility of Pyrograms btained with Auto Shot Sampler (AS-1020E) and Double-Shot Pyrolyzer (PYT-016E) Reproducibility of pyrograms obtained by Auto Shot Sampler coupled with Double-Shot Pyrolyzer is described here. Double-Shot Pyrolyzer with vertical furnace system employs free-fall introduction of sample cups into the furnace. In order to examine the reproducibility of pyrograms obtained through the combination of Auto Shot Sampler and Double-Shot Pyrolyzer, 48 specimens of 30µg each of polystyrene were placed in sample cups and continuous analysis was performed. Fig. 1 shows an example of pyrogram obtained. It was found that average peak area ratio of styrene monomer against styrene trimer was 14.29%, and that its reproducibility (relative standard deviation) was 1.60%. This result demonstrated that using Auto Shot Sampler variations of results between analysts could remain minimal. Also, automated repetitive analysis eliminates sample and unexpected data variations, leading to improved reliability of analytical results obtained. SSS/S=14.52% SSS/S=14.30% SSS/S=14.24% SSS/S=14.52% Run 1 Run 2 Run 3 Run 4 - Run 48 Styrene monomer (S) Trimer ( SSS) Run # SSS/S(%) ~ ~ Ave % RSD 1.60% Fig. 1 Reproducibility of Pyrograms of Polystyrene Pyrolysis furnace temp: 530 C, Sample size: 30µg, Carrier gas: He 140kPa, Total flow rate: 80mL/min, Split mode, Separation column: Frontier Lab Ltd. UA F (5% diphenyldimethylpolysiloxane) Length 30m, Id 0.25mm, Film thickness 0.25µm, Injection port temp: 320 C, GC oven temp: 70 C~320 C (20 C/min), Detector: FID Keyword : Auto Shot Sampler, Polystyrene Pyrogram, Reproducibility Applications : General Polymer Analysis Reference: Sato, et al., 5th Polymer Analysis Symposium, III-2, p71-72 (2000) : Registered trademark of 363 Vintage Park Drive


156 Double-Shot Pyrolyzer Technical Note (PYT-017E) Polymer Prepper, A Simple Polymer Pulverizing Tool for Py-GC Part 1: Surface Form and Contamination Removal Because polymeric materials are generally non-thermal conductors, pulverizing polymeric samples into a uniform fine powder or preparing a thin film is important in order to obtain high reproducibility of pyrograms. It is very difficult or impossible for conventional cutting method using a cutter knife to pulverize samples into a uniform powder. Also freeze pulverization in which sample is ground with metal mass in liquid N 2 requires a long time to cool down and then to warm up to the room temperature. The use of liquid N 2 and high cost of the equipment make it unattractive in routine work. We have, therefore, developed Polymer Prepper (P/N:PY1-7510), a low cost simple tool to address these issues. 1) Both sides of Polymer Prepper are made of nickel thin film and provide two different coarseness made by electric casting. SEM images of the file surface are shown below. Unlike normal sandpapers or metal files, the top of the raised surface is shaped flat and its edge is sharp at right angle. The lower bottom surface is also flat to prevent the surface from contamination with powder residues. This structure makes it easy to remove the power residues to clean the file surface by pressing adhesive tape (butyl rubber based cleaning tape: thickness 0.7mm, width 10mm). With Polymer Prepper, fine powder of 0.1mm in diameter can be quickly prepared effortlessly at low cost. Flat bottom surface Sharp cutting edge X10 1mm SEM Image of Cutting Surface of Polymer Prepper (medium) 1) Watanabe, et al., 4th Polymer Analysis Symposium, IV-13, p (1999) Keyword : Polymer Prepper, Freeze Pulverization, Pretreatment Applications : General Polymer Analysis : Registered trademark of 363 Vintage Park Drive

157 Double-Shot Pyrolyzer Technical Note (PYT-018E) Polymer Prepper, A Simple Polymer Pulverizing Tool for Py-GC Part 2: Comparison with ther Pretreatment Methods In pyrolysis gas chromatography, the size and shape of sample have been known to significantly affect the reproducibility of pyrograms. The particle shapes and reproducibility of polystyrene pyrograms are compared using powder made by Polymer Prepper (P/N: PY1-7510) and that made by conventional freeze pulverization. 1) Fig. 1 shows SEM images of particle shapes of powders prepared by Polymer Prepper and freeze pulverization. It was found that Polymer Prepper gave particle size of 100~300µm, significantly improved uniformity compared with conventional method. In Table 1, the reproducibilities of pyrograms of polystyrene are compared. Peak areas of styrene monomer and trimer observed in the pyrograms of polystyrene were examined. The results showed that polystyrene thin film prepared by stripping of solvent gave the best result, followed by fine powder made by Polymer Prepper, and then by freeze pulverization. Particles made by a cutter ended up with poor results. These results show that the reproducibility with Polymer Prepper is comparable to that with freeze pulverization, and that it is a low cost, quick and simple method for pretreatment. Polymer Prepper (medium) Freeze pulverization (5min) 1mm Fig. 1 Particle Shapes of Polystyrene Powdered by Polymer Prepper and Freeze Pulverization Table 1 Sample Forms and Reproducibility of Pyrograms (polystyrene) Pyrolysis temp: 550 C Sample size: ca. 0.5mg Sample form Thin film Polymer Prepper (medium) Fine powder Freeze pulverization Small particles (cutting method) 4 pieces (0.4mm square) 1piece (1mm square) R.S.D.(%) of SSS/S SSS: Styrene trimer S: Styrene monomer 1) Watanabe, et al., 4th Polymer Analysis Symposium, IV-13, p (1999) Keyword : Polymer Prepper, Polystyrene, Freeze Pulverization, Pretreatment Applications : General Polymer Analysis : Registered trademark of 363 Vintage Park Drive
158 Double-Shot Pyrolyzer Technical Note (PYT-019E) perational Principle of MicroJet Cryo Trap (MJT-1030E) US Patent:US 6,190,613 B1 Analysis of dilute components in gases or volatile components desorbing from heated sample in a wide band range requires trapping of these components at the head of column by cooling, followed by rapid thermal desorption. We have developed MicroJet Cryo Trap (MJT-1030E) which consists of a mechanism to liquify N 2 gas and micro jet tube for cooling and thermal desorption at the head of column. 1) The flow scheme of MJT-1030E is shown in Fig. 1 and the operation of micro jet tube in cooling and thermal desorption modes is shown in Fig. 2. N 2 gas from N 2 cylinder is liquified through thermal exchange coil immersed in liquid N 2 and is fed to micro jet tube located in the GC oven via N 2 transfer tube. Inside the micro jet tube are a temperature sensor and column holder (metal tube), and the separation column runs through the column holder and is secured. Liquid N 2 jet is blown against the column in the column holder, and the portion of the column is cooled down to -180 C or below. Liquid N 2 goes out from the both ends of the micro jet tube and is rapidly evaporated, preventing moisture to get into the micro jet tube to become frozen. nce the liquid N 2 micro jet is turned off, heated air in the GC oven will rapidly heat the cooled portion of the column at 800 C/min, causing the trapped components to be thermally desorbed. Cooling Micro Jet flow Liq. N 2 transfer tube Moisture in air Temperature sensor MicroJet tube Flow controller Pyrolyzer Liquid N 2 N 2 N 2 Desorption column Coumn holder Moisture in air N 2 cylinder 熱交換コイル X Stop Separation column Heated air Liquid N 2 container (2L) Liquid N 2 Micro Jet tube Fig. 1 Flow Scheme of MJT-1030E Fig. 2 How MicroJet Cryo Trap Works in Cooling and Desorption modes 1) Hosaka, et al., 3rd Polymer Analysis Symposium, I-6, p15-16 (1998) Keyword : MicroJet Cryo Trap, perational Principle Applications : General Polymer Analysis : Registered trademark of 363 Vintage Park Drive
159 Double-Shot Pyrolyzer Technical Note (PYT-022E) perational Principle of Selective Sampler (SS-1010E) Selective Sampler (SS-1010E) we have developed allows any temperature zone of EGA profile obtained in Evolved Gas Analysis (EGA) with Double-Shot Pyrolyzer to be introduced into GC. The operational principle of Selective Sampler is shown in Fig. 1. The selective sample introduction adaptor (SS adaptor) installed at the bottom of the GC injection port is connected to Gas flow controller with a built-in EM valve. If sample gas containing targeted components is to be introduced into the GC column, the EM valve is closed so that the system operates as a normal GC (see left figure of Fig. 1). When sample gas is not to be introduced into the column, the EM valve is opened to drive pressurized carrier gas into the GC injection port (right figure of Fig. 1) Thus, the gas pressure difference between the atmosphere gas from the pyrolyzer and He gas from the gas flow controller will drive the sample gas out through the split vent. This Flow Switching system is simple in structure with least dead space. Also, because there is no rotational valve with exposed metal surface in the flow pass of sample gas, adsorption of sample components can be held minimal. A) Sample introduction B) Sample purging Atmosphere gas (He/Air) Pyrolyzer GC injection port Split vent SS Adaptor Gas flow controller He EM valve (closed) He EM valve (open) GC oven Separation column Fig. 1 perational Principle of Selective Sampler Keyword : Selective Sampler, Evolved Gas Analysis Applications : General Polymer Analysis 1) Hosaka, et al., 1st Polymer Analysis Symposium, I I-14, p (1996) : Registered trademark of 363 Vintage Park Drive
160 Double-Shot Pyrolyzer Technical Note (PYT-023E) Points to Consider in btaining Pyrograms by Py-GC/MS in Air Circumstance [About Separation Column and Air Purge Time in MS] [Background] When obtaining a pyrogram by Py-GC/MS in air, after the pyrolysis of samples the separation column and the MS must be purged with He before GC/MS analysis is started. The time which takes for purging varies on the type of GC/MS used, the kind of separation columns, and carrier gas settings. Here, the time which takes for purging the system with settings commonly used in Py-GC/MS analyses was studied. [Experimental] A Double-Shot Pyrolyzer directly coupled with the split/splitless injection port of a GC was connected to a MS (HP5791, vacuum pump capacity 60L/sec) via a capillary separation column (30m, id 0.25mm). Air was used for the atmosphere gas during pyrolysis. A Selective Sampler was attached underneath the injection port, so that the gas flowing into the separation column was able to be switched from air to He any time. The injection port pressure was set to 100kPa. [Results] After air was run through the separation column for a minute, the gas flow was switched by using the selective sampler, and He gas was allowed to flow into the separation column and then into the MS ion source. Fig. 1 shows a TIC plot against the time for purging. Initially air existed in the system, therefore a elevated baseline was observed. As the air purging progressed, the baseline is gradually lowered and in about 3 min it was leveled off. This result showed GC/MS analysis must be started after 3 min of purging or more, if air is allowed to flow into the system for 1 min. In a similar manner, the relation between the air flow time and required purging time was examined and the result obtained is shown in Fig. 2. Up until 20 min of air flow time, the air flow time and purging time were in monotonously increasing relationship, however, beyond 20 min, it was found that the required purging time stayed constant at 20 min. Flow switching by Selective Sampler Baseline leveling off Time required for air purging (min) TIC min Fig. 1 Baseline shift after air was run through the column Column inlet pressure: 100kPa, Split ratio: ca. 1/50, Separation column: Ultra ALLY (30m, id 0.25m), GC oven temp: 40ºC, MS scan range: (m/z), scan rate: 2 scans/sec Time air flown into the system (min) Fig. 2 Relationship between air flow time and time required for system purging Keyword : Pyrolysis in air, Carrier gas selector, Selective sampler Applications : General polymer analysis, Environmental analysis, Work environmental analysis Related technical notes : PYA4-001E, PYT-022E, PYT-024E : Registered trademark of 363 Vintage Park Drive
161 Double-Shot Pyrolyzer Technical Note (PYT-024E) Procedures for Acquiring Pyrograms in Air and Its Automation [Background] To analyze the processes of thermal oxidation/degradation of polymers, air needs to be used as the atmosphere gas in analyses using a Py-GC/MS system. In this case, when the pyrolysis or thermal desorption in air is completed, the column and MS vacuum system are purged with helium gas before the GC/MS analysis is started in order to prevent oxidative degradation of separation column and mal-functioning of MS. This, however, involves complicated procedures. Here, general procedures for obtaining pyrograms in air atmosphere and an advanced automated Py-GC/MS system are briefly described. [Experimental] Fig. 1 shows the construction of a Py-GC/MS system used. A Double-Shot Pyrolyzer directly coupled with a split/splitless injection port was further connected to an MS through a separation column. A carrier gas fed to the pyrolyzer was provided through a carrier gas selector, permitting air or helium to be selected. Underneath the injection port, a selective sampler was installed, allowing the sample gases from the injection port to flow into the separation column or to be exhausted. Also, at the front of the separation column, a MicroJet Cryo-Trap was installed in order to chill the portion of the column down to near -196ºC so as to coldtrap volatile organics formed. [Results] Table 1 summarizes operational sequences of devices required when obtaining pyrograms in air in manual operation and in an automated system. In manual operations, a series of complicated operations A~C are required for an operator to perform. n the other hand, in the automated system, all the operations beyond A-2 are performed automatically. This simplifies whole operations and eliminates oxidative degradation of the separation column due to miss-operations, inadequate analysis due to incomplete trapping, or contaminations and deteriorations of the system. Carrier Gas Selector (CGS-1050E) He Air Selective Sampler (SS-1050E) MicroJet Cryo-Trap (MJT-1030E) Autoshot Sampler (AS-1020E) MS Pyrolyzer (PY-2020iD) Scavenger gas (He) Separation column GC oven Valve Liq. Nitrogen Valve Figure 1. Automated oxidative pyrolysis and pyrogram acquisition system A. Prep. for sample introduction B. Heating sample C. GC/MS analysis Required sequence of operations Table 1. Required operations for Py-GC/MS analysis in air A-1. Introduce air into pyrolysis furnace A-2. Cool separation column to cold trap B-1. Heat sample in air (thermal desorption, pyrolysis) B-2. Cold trap organics formed C-1. Switch gases fed to separation column (Air He) C-2. Purge air from the system (several minutes to half hour) C-3. Finish cold trapping C-4. Start temp. programmed GC/MS analysis Manual operations Switch carrier gas lines Immerse head of column into liq. N 2 Introduce sample into furnace Automated operations Switch gases fed to Py (CGS-1050E) Switch gases fed to column (He Air, SS-1010E) Start chilling column head by MJT-1030E Drop sample into furnace Wait until heating time is over Hold until operation is complete Switch back carrier gas lines Switch gases fed to colum (Air He, SS-1010E) Wait until required time is reached Maintain state until operation is complete Remove separation column from liq. N 2 Stop chilling (MJT-1030E) Start GC/MS Issue start signal to GC from Py temp. controller Keyword : Air atmosphere, Automation Applications : General polymer analysis, Environmental analysis Related technical notes : PYA4-001E, PYA4-002E, PYA4-003E, PYA4-004E, PYT-019E, PYT-023E Automatically repeatable : Registered trademark of 363 Vintage Park Drive
162 Double-Shot Pyrolyzer Technical Note (PYT-025E) Improvement of Temperature Profile at Py-GC Interface by Heat Sink Adaptor and Reduction of Memory Effect for Low and Reactive Volatile Components [Background] The split/splitless injection port of the today s GCs is designed to keep the vicinity of the septum at relatively lower temperatures so that gas bleedings from the septum is minimized. A Py-GC system consisting of such a GC and a pyrolyzer has a temperature trough at the interface between the GC and pyrolyzer, resulting in trapping of higher boiling pyrolyzates. This phenomenon gives rise to reduced reproducibility and memory effects in repeated runs, impairing the basic performance of the Py-GC system. Therefore when building a Py-GC system, this point needs to be taken into account and appropriate measures be implemented. In a Double-Shot Pyrolyzer system having this implemented, a heat sink adaptor is placed at the Py/GC interface to reduce the temperature trough. The effectiveness of the improved design is described here. [Experimental] A thermocouple (outer diameter 1mm) was inserted either from the top of the pyrolyzer or from the bottom of the GC injection port to determine the temperature profile inside the system with and without a heat sink adaptor. Also, in both cases, pyrograms of polyurethane were obtained and the memory effects were compared. Upon pyrolysis, polyurethanes give diphenylmethane diisocyanate (MDI), a very reactive and high boiling species. [Results] As seen by the temperature profile inside the system shown in Fig. 1, the temperature profile of the pyrolyzer section was not influenced by the heat sink adaptor, but at the interface a significant difference was observed. The temperature of the septum rubber at the GC injection port was 170 ºC, a large temperature trough, in the system without a heat sink adaptor. n the other hand, in the system with a heat sink adaptor it was 210ºC, or 40ºC higher, because the septum rubber is heated by the Py/GC interface block through the heat sink adaptor, resulting in a smaller temperature trough. Fig. 2 shows how the heat sink adaptor reduces the memory effect in a pyrolysis of polyurethane giving MDI. It was clearly shown that by inserting the heat sink adaptor, the ghost peak intensity of MDI was able to be reduced to 0.8% from 4.3% in blank runs. ITF union Heat sink adaptor He Pyrolysis furnace (450ºC) ºC Septum cap Py/GC interface block Septum rubber Without heat sink adaptor With heat sink adaptor Interface needle Injection port Separation column Furnace temp.: 450ºC Py/GC interface block, GC injection port temp.: 320ºC Fig. 1 Py-GC system with heat sink adaptor, improving temperature profile (A) Pyrogram of polyurethane MDI Blank runs (B) Without heat sink adaptor MDI 4.3% x10 (C) With heat sink adaptor 0.8% x min min Fig. 2 Pyrogram of polyurethane and memory effects after blank runs Pyrolysis furnace temp. : 550ºC, Flow rate : 1ml/min, Split ratio : ca.1/50, Separation column : Ultra ALLY5+ (5% diphenyl 95% dimethylpolysiloxane, length 15m, id 0.25mm, film thickness 0.25µm) GC oven temp.: ºC (30ºC/min), Injection port temp.:320ºc, Sample size : ca 300µg Keyword : heat sink adaptor, memory effect, polyurethane, MDI Applications : General polymer analysis Related technical notes : PYT-026E : Registered trademark of 363 Vintage Park Drive
163 Double-Shot Pyrolyzer Technical Note (PYT-026E) Improvement of Temperature Profile at Py-GC Interface and Yield Enhancement of High Boiling Components by Heat Sink Adaptor Background] The temperature trough at the Py-GC interface gives rise to a reduced reproducibility of pyrograms and memory effects in repeated runs. The Double-Shot Pyrolyzer is designed to reduce the temperature trough through inserting a heat sink adaptor(pyt-025e). Here, the effect on the yield of high boiling components of pyrolysates is described. [Experimental] A thermocouple was inserted either from the top of the pyrolyzer or from the bottom of the GC injection port to determine the temperature profile inside the system with and without a heat sink adaptor. In both cases, pyrograms were obtained by vaporizing polywax 655, which consists of linear hydrocarbons of C 20 ~C 90, and the yields of high boiling components were compared. [Results] As seen by the temperature profile inside the system shown in Fig. 1, the temperature profile at the center of the pyrolyzer was not influenced at all by the heat sink adaptor, but a significant difference was observed at the interface. The temperature of the septum at the GC injection port was 170ºC, creating a large temperature trough, in the system without a heat sink adaptor. n the other hand, in the system with a heat sink adaptor it was 210ºC, or 40ºC higher, because the septum rubber is heated by the Py/GC interface block through the heat sink adaptor, resulting in a smaller temperature trough. Fig. 2 shows the effect of the heat sink adaptor on the yield of high boiling components. In the n-c 20 ~C 30 region, the peak intensities were almost the same for both cases, while in the n-c 30 ~C 80 region,theyieldwasmuchimprovedwiththeintroductionofthe heat sink adaptor. The yield of n-c 40 component was greatly improved to near 100% from 25%. ITF union Heat sink adaptor He Pyrolysis furnace (450ºC) ºC Septum cap Septum Py/GC interface block Without adaptor With adaptor Interface needle Injection port Separation column Pyrolysis furnace temp. : 450ºC Py/GC interface block, GC injection port temp. :320ºC Figure 1. Py-GC system with a heat sink adaptor install and improvement of temperature profile a) Without heat sink adaptor b) With heat sink adaptor n-c 20 H 42 n-c 30 H 62 n-c 40 H 82 n-c 50 H 102 n-c 60 H 122 n-c 20 H 42 n-c 30 H 62 n-c 40 H 82 n-c 50 H 102 n-c 60 H min min Figure 2. Chromatograms of mixture of hydrocarbons (n-c 20 ~n-c 90 ) Pyrolysis furnace temp.: 450ºC, carrier gas flow rate : 1ml/min, split ratio : 1/50 Separation column : Ultra ALLY-5(MS/HT) (5%-diphenyl-95%-dimethylpolysiloxane, length 15m, id 0.25mm, film thickness : 0.1µm) GC oven temp.: 100~ 420ºC (40ºC/min), Injection port temp.: 320ºC, Py-GC interface temp.: 320ºC, Sample size : ca.10µg Keyword : heat sink adaptor, memory effect, high boiling components, hydrocarbons Applications : General polymer analysis, Polywax 655 Related technical notes : PYT-025E : Registered trademark of 363 Vintage Park Drive
164 Double-Shot Pyrolyzer Technical Note (PYT-027E) Effects of Temperature on the pyrolysis of polystyrene (PS) in air [Background] Pyrolysis in an air atmosphere is a useful technique for investigating the thermal oxidation and/or deterioration processes of polymeric materials. In the case of polystyrene, the polymer pyrolysis and oxidative decomposition occurs simultaneously. The degree that each degradation pathway occurs is a function of the pyrolysis temperature. Furthermore, the reproducibility of the oxidative decomposition is expected to differ from that obtained when pyrolysis is done in a helium atmosphere. In this report, the pyrolysis of polystyrene (PS) in air is used to demonstrate the effects of temperature on the degradation process. [Experimental] A double-shot pyrolyzer directly interfaced to a split/splitless injection port of a GC. An FID detector was used for this study. The carrier gas selector (CGS-1050E) accessory was used to control the flow of air during the oxidative pyrolysis. Immediately upon completion of the pyrolysis, the carrier gas was switched from air to He using the selective sampler (SS-1010E) accessory. After the residual air in the system was fully purged, the GC analysis was initiated. The pyrogram contained styrene monomer [S], the largest peak present in the pyrogram and benzaldehyde [BA], the principle oxidative decomposition product. The [BA] / [S] ratio was used to evaluate the degree of oxidative pyrolysis occurring as well as the reproducibility of the process. [Results] A typical pyrogram for PS pyrolyzed in air is shown in Fig. 1. As expected, styrene monomer, dimer, and trimer are observed. Benzaldehyde and other oxidative products are also present. Fig. 2 shows the average [BA] / [S] ratio and the reproducibility data, RSD(%) for five replicate analysis, plotted against the pyrolysis temperature. The [BA] / [S] ratio decreases as the pyrolysis temperature increases from 400 to 500ºC and then decreases very slowly at temperatures above 550ºC. The reproducibility is the highest (RSD = 4%) when the pyrolysis temperature is 550ºC. styrene monomer [S] benzaldehyde [BA] 2-phenylpropenal acetophenone styrene dimer styrene trimer min Fig. 1 Pyrogram of PS pyrolyzed in an air atmosphere Pyroysis temp.: 550ºC, separation column: Ultra ALLY-5 (5% diphenyl 95% dimethyl polysiloxane, length 30 m, id 0.25 mm, film thickness 0.25 µm), GC oven temp.: ºC (20ºC/min), sample size: 10 µg, sample cup: eco cup L, flow rate: 1 ml/min, split ratio: 1/50 Average [BA] / [S] Average [BA] / [S] ºC Pyrolysis temperature Fig 2. Plot of the average [BA] / [S] ratio and the reproducibility (%RSD) as a function of pyrolysis temperature Keywords : Air atmosphere, xidation, Polyethylene, Pyrogram, Benzaldehyde Applications : General polymer analysis, Environmental analysis Related Technical Notes : PYA4-001E, PYT-013E, PYT-014E, PYT-023E, PYT-024E RSD % for [BA] / [S] RSD% for [BA] / [S] : Registered trademark of 363 Vintage Park Drive
165 Double-Shot Pyrolyzer Technical Note (PYT-028E) Splitless-mode sample introduction in Py-GC system [Background] Splitless injection is widely used when target compounds are present at concentrations below 1ppm. When using splitless injection, the entire sample is first volatilized and then transferred directly onto the separation column. There is often a need for trace level analysis when working with pyrolysis gas chromatography (Py-GC) and thus there exists a demand for using Py-GC in the splitless mode. However, due to the differences in the carrier gas flow paths (syringe splitless v. pyrolyzer splitless), the entire injected sample cannot be transferred to the separation column. The reason is illustrated in this report. [Experimental] Py-GC analysis is based upon a double-shot pyrolyzer interfaced directly to a GC equipped with a split/splitless injection port. The carrier gas flow is controlled by the electronic pneumatics control (EPC) system. [Results] The flow paths of the carrier gas and sample vapors when the splitless mode is used for a GC (syringe injection) and a Py-GC system are shown in Fig. 1a and Fig 1b, respectively. When making a splitless injection, 2 ml/min of the total carrier gas exits via the septum purge. The remaining 1mL/min is mixed with sample vapors and is transferred to the separation column. n the other hand, in Py-GC system (Fig. 1b) 3mL/min of carrier gas is mixed with the sample vapors emanating in the quartz tube ( );from here, the mixture is transported to the GC injection port, where 2mL/min is vented through the septum purge and the remaining 1mL/min is introduced into the separation column. This clearly shows that 2/3 of the sample components are vented and only only 1/3 is introduced into the separation column for analysis. Double-shot pyrolyzer Pure carrier gas Gas mixture of carrier gas and sample gas components Septum Carrier gas (3mL/min) Sample Carrier gas (3mL/min) Septum purge (2mL/min) Septum purge (2mL/min) -ring Syringe needle Insert Split vent (Closed) Py needle Separation column (0.25mm id) Column flow rate (1mL/min) Column flow rate (1mL/min) a. GC injection system using micro-syringe b. Py-GC injection system Fig. 1 Flow paths of carrier gas and sample gas components during splitless injection in GC and Py-GC Keywords : Splitless mode Applications : General polymer analysis : Registered trademark of 363 Vintage Park Drive
166 Ultra ALLY Column Application Note (UAA-001E) Analysis of Free Alkylphenols and Phthalate Esters Using Ultra ALLY -5(P) Column Ultra ALLY -5(P) column has been developed in order to analyze environmental hazards (alkylphenols, such as bisphenol A and nonylphenols, and phthalate esters) as free forms at ppb levels without complicated pretreatments. The column is featured by excellent contamination resistance as found in all of the Ultra ALLY columns, as well as low bleeding and long life (see Ultra ALLY Tech Note No.UAI-002E) Specifications : 30m (0.25mmi.d.) 0.25µm, Max temp. Iso.360ºC / Prog.380ºC Analysis data of alkylphenols included (shown below) I.S. (n-c 15 ) Nonylphenol Pentachlorophenol DBP Bisphenol A DNP min Fig.1. Analysis of Environmental hazards Column : Ultra ALLY -5(P), 30m (0.25mmi.d.), 0.25µm ven temp. : 50(1min) ~ 20ºC/min ~ 280ºC, Injector : Splitless at 250ºC Detector: FID at 350ºC, Carrier gas: He, 20psi Sample size: 1ng/µl, 1.0µl (solvent n-c 7 ) Keyword : Environmental hazards, Bisphenol A, Alkylphenols, Phthalate Esters, Ultra ALLY-5(P) Application : Environment Assessment, Food Additives, Paper Industry, Polymers : Registered trademark of 363 Vintage Park Drive
167 Ultra ALLY Column Application Note (UAA-002E) Analysis of Butter Using Ultra ALLY -TRG, A Column Designed for Triglycerides Analysis Ultra ALLY -TRG has been designed to separate and analyze triglyceride of butter, safflower oil, soybean oil, etc. This column uses highly polar 65% diphenylpolysiloxane as liquid phase for the stationary phase, which is chemically bonded to form a stable polymer; therefore achieving a low bleeding at high temperatures. In the chromatogram shown below, in addition to the carbon number assignments (eg. T 54 ), peaks for triglyceride components, consisting of stearic acid (S), oleic acid (), and palmitic acid (P), are shown to be well resolved, providing a good insight into the property of butter. Currently the column is used in the component analysis of a variety of fats and oils, such as soybean oil. Because the resolution of peaks degrades as the amount of sample injected increases, we recommend that the smallest possible amount of sample be used for analysis. Also we recommend that the insert at the injection port be deactivated, since the sample is susceptible to thermal decomposition, if the insert is not deactivated. (Deactivated quartz inserts available.) Specifications : Ultra ALLY -TRG(65%diphenylpolysiloxane), 30m (0.25mmi.d.) 0.1µm, Max.Temp. Iso.360ºC / Prog.370ºC T 36 T 34 T 38 P : Palmitic acid glyceryl ester : leic acid glyceryl ester S : Stearic acid glyceryl ester T 50 T 40 T 42 T 44 T 46 T 48 PP T 52 Cholesterol T 32 PSS PS P T 54 SSS SS S Fig. 1 Analysis of Butter Column: Ultra ALLY -TRG (65% diphenylpolysiloxane), 30m (0.25mm i.d.) 0.1µm ven temp.: 260 ~ 5ºC/min ~ 360ºC(15min), Injector: Split 1/50 at 300ºC Detector: FID at 350ºC, Carrier gas: He, 20psi, Sample size: 1.0%,1.0µl (solvent n-c 6 ) min Keyword Applications : Triglycerides, Butter, Ultra ALLY -TRG : Fats and ils, Food Analysis : Registered trademark of 363 Vintage Park Drive
168 Ultra ALLY Column Application Note (UAA-003E) Analysis of Polywax 655 Using Ultra ALLY -SIM Column for Simulated Distillation Ultra ALLY -SIM (stationary phase : Dimethylpolysiloxane) column has been designed for simulated distillation analysis. This is a low bleeding nonpolar column, especially useful for simulated distillation analysis, in which the high thermal stability of the Ultra ALLY columns (see Ultra ALLY Column Tech Note UAI-003E) is best utilized. Fused silica capillary columns are always vulnerable to column breakage at high temperatures due to thermal degradation of polyimide outer wall coating in the air; however, Ultra ALLY -SIM metal column is free from such problems. Specifications: Ultra ALLY -SIM (Dimethylpolysiloxane), 5m (0.53mmi.d.) 0.1µm, Temp.range: - 60 ~430ºC C 50 C 40 C60 C 70 C 20 C 30 C min Fig.1 Analysis of Polywax 655 Column: Ultra ALLY -SIM (Dimethylpolysiloxane), 5m (0.5mmi.d.), 0.1µm ven temp.: 40 ~ 20ºC/min ~ 430ºC(1min), Injector: Split 1/20 at 360ºC Detector: FID at 430ºC, Carrier gas: He, 0.5psi Sample size: 1.0%,1.0µl (solvent : cyclohexane ) Keyword Applications : Polywax 655, High Temperature Analysis, Ultra ALLY -SIM : Analysis of High Boiling Components, Crude oil / Lubricant Analysis : Registered trademark of 363 Vintage Park Drive
169 Ultra ALLY Column Application Note (UAA-004E) Analysis of Agricultural Chemicals (Shimazine & Thiobencarb) Using Ultra ALLY-1(S) Column for Trace Amount Analysis Ultra ALLY-1(S) column (solid phase: dimethylpolysiloxane) has been specifically designed for analysis of trace amount of chemicals. During the manufacturing process, extremely high degree of deactivation treatments has been done on the inner surface of the column prior to deposition of the solid phase. Before we ship these columns, several nanograms of polar test samples such as amines and phenols are injected into each column, and all the peak shapes are checked to see if they meet the specifications. Because these polar species tend to undergo decomposition and adsorption at active spots, when injected, a highly deactivated insert should be used. We have highly deactivated quartz inserts available (Part No. GC1-2215, for Agilent GCs), made by our proprietary deactivation technology developed for Ultra ALLY columns (see: Ultra ALLY Column Application Note No. UAA-005E). Use of these column and insert makes possible the analysis of ultra trace amount of residual agricultural chemicals or pharmaceutics. Simazine 10 pg Cl N N NHC 2 H 5 N NHC 2 H 5 m/z : (min) Thiobencarb 10 pg m/z : 100 (C2H5) 2 NCSCH 2 Cl (min) Fig.1 Analysis of Agricultural Chemicals (Shimazine & Thiobencarb) Using Ultra ALLY-1(S) Column for Trace Amount Analysis Column : Ultra ALLY -1(S) (dimethylpolysiloxane) Length :15m, Id 0.25mm, Film thickness: 0.25µm ven temp. : 60~300ºC at 15ºC/min Injector : Splitless, Detector : MS, SIM Mode, Carrier gas: He, 30cm/s Sample size : 10ppb, 1.0µL Keyword : Ultra Trace Polar Chemical Analysis, Deactivated Quartz Insert, Ultra ALLY -1 (S) Application : Analysis of Agricultural Chemicals, Analysis of Pharmaceutics, Ultra Trace Analysis : Registered trademark of 363 Vintage Park Drive
170 Ultra ALLY Column Application Note (UAA-005E) Effectiveness of Deactivated Quartz Insert in Trace Analysis Analysis of Strong Bases (nicotine, cotinine) Using Ultra ALLY-CW(KH) As the mount of highly polar compounds to be analyzed becomes less and less, they tend to be influenced by the inertness of the insert, along with the column inertness and liquid phase characteristics. In an example here, Nicotine and cotinine were analyzed using Ultra ALLY-CW (KH) column, a column designed for analysis of basic compounds (Fig.1), and the difference in inertness of the insert was compared by looking at the cotinine peak. When deactivated quartz insert was used, with 0.1ng of the sample injected, there was a linear relationship between the amount injected and the peak area. n the other hand, when untreated quartz insert was used, absorption began to be observed at several nanograms of injection. In analysis of highly polar species, it is therefore vitally important to use a highly deactivated quartz insert, because of their tendency to easily undergo decomposition and absorption at active spots inside the injection port (Fig.2). Frontier Laboratories offers highly deactivated quartz inserts available (P/N: GC for HP GCs, P/N: PYS1441 for Shimazu GC-14, P/N: PYS1741 for GC-17). These inserts are made by our proprietary technology developed for Ultra ALLY columns to further enhance durability and inertness, in addition to conventional treatments with silanes such as HMDS. Cotinine Unknown Nicotine Peak area Deactivated quartz insert Cotinine Cotinine (min) Untreated quartz insert Fig. 1 Chromatogram of Nicotine and Cotinine (5ng) Col.: Ultra ALLY -CW (KH) (Polyethyleneglycol) Length :30m, Id 0.25mm, Film thickness: 0.25µm ven temp. : 50~220ºC at 20ºC/min, Injector: Splitless at 250ºC Detector : FID at 270ºC, Carrier gas: He, 30cm/s 0 0.1ng 1ng 2ng Absolute amount injected into column Fig. 2 Insert Activity Dependent Chromatogram and Calibration Curve When 1ng of Cotinine is Injected Keyword : Analysis of Basic Compounds, Deactivated Quartz Insert, Ultra ALLY -CW(KH) Application : Analysis Agricultural Chemicals, Analysis of Pharmaceutics, Analysis of Strong Bases : Registered trademark of 363 Vintage Park Drive
171 Ultra ALLY Column Technical Note (UAT-001E) Comparing Ultra ALLY Metal Capillary Column with Fused Silica Capillary Column Inertness Maximum Temperature (Dimethylpolysiloxane) Contamination Resistance Mechanical Strength Price Ultra ALLY Excellent 420ºC (450ºC for Dexsil300GC) 4 times higher than FS (Difference in inner surface area) High (metal) Almost the same as FS Less than FS Fused Silica Excellent (absorption of amines in trace region) 320ºC (Susceptible to breakage above this) FS:1 Susceptible to outer wall breakage Ultra ALLY -1 Fused Silica Sample (1ng each) 1: n-c 11 2: 4-Chlorophenol 3: 1-Decylamine 4: n-c 13 5: Methyl caprate 6: n-c 14 7: Acenaphthylene 8: 1-Dodecanol 9: n-c 15 1-Decylamine Keyword : Ultra ALLY, Fused Silica, Comparison of Inertness and Prices Application : General Analysis Fig.1. Inertness of Ultra ALLY and Fused Silica Capillary Columns Dimethylpolysiloxane, 15m (0.25mm i.d.) 0.1µm, 60 ~ 5ºC/min ~ 160ºC Split injection (1/80), Amount of sample injected = 1 ng each : Registered trademark of 363 Vintage Park Drive

 2) The top layer is ultra pure Si 2.")
172 Ultra ALLY Column Technical Note (UAT-002E) Inner Surface Structure of Ultra ALLY Metal Capillary Columns (Contamination durability) The inner surface of Ultra ALLY metal capillary columns has been modified with our proprietary surface technology. Its surface structure is depicted below. (See Technical Note UAT-003E~005E for features of this treatments.) 1) The column inner surface is a chemically bonded graduated multi layer structure. (Fig. 1 shows a cross sectional view of the column s inner surface. This surface structure provides high flexural and impact strength, and also has a resistance against sharp changes in temperature.) 2) The top layer is ultra pure Si 2. (Refer to the element composition determined by Auger analysis shown in Fig.2) 3) Rough column surface has surface area tens of times larger than FS. (See rough surface structure shown in Fig. 3. This is reason of the high durability of contaminants. See UAT-005E) (%) 100 Stationary phase 50 Ni Chemically modified layer Si Ultra purity Si 2 layer Ultra purity Si layer Proprietary deactivated graduated layer Etching Time (min) Fig.2. Auger Analysis of Graduated Multi Layer Surface (Element composition of top surface is Si 2, and inner layers contain silicon.) Bulk of stainless steel tube 5~7 layer graduated multi layers (Adjacent layers are chemically bonded and the interface between layers has graduated concentrations of both layers.) Fig.1 Cross Sectional view of Ultra ALLY Metal Capillary Column s Inner Surface Model Before treatment After treatment Fig.3 SEM Image of Inner Surface (Note rough surface even after treatments) Keyword : Inner Surface Structure, Elemental Analysis, SEM Image, Contamination durability Application : General Analysis : Registered trademark of 363 Vintage Park Drive
A fast, easy and green thermal desorption-gc/ms method for the analysis of phthalate esters in PVC
 A fast, easy and green thermal desorption-gc/ms method for the analysis of phthalate esters in PVC A discussion of the central factors that influence data quality when using ASTM D7823 (1) for the determination
Technical Report Abstract: Keywords: RoHS, phthalate esters, Py-GC/MS, Py-Screener 1. Introduction
 C146-E303 Technical Report Comparison of Screening Method (Py-GC/MS) and Quantitative Method (Solvent Extraction GC/MS) for Phthalate Esters Analysis Jae Woo Kim 1, Hye Mi Moon 1, Fumitaka Maruyama 2,
Qualitative Profiling of Co-polymer Polyethylene Terephthalate through Multifunctional Pyrolyzer-GC/MS by various Thermal Treatment Techniques
 PO-CON1730E Qualitative Profiling of Co-polymer Polyethylene Terephthalate through Multifunctional Pyrolyzer-GC/MS by various Thermal Treatment Techniques ASMS 2017 TP-279 Guo Wei Elgin Ting 1, Hui Xian
Method of determination of phtalates in spirituous beverages by gaschromatography/mass
 OIV-MA-BS-33 Method of determination of phtalates in spirituous beverages by gas-chromatography/mass Type IV method 1. SCOPE OF APPLICATION This method applies to the detection and assay of some phthalates
AN INTEGRATED SYSTEM USING TEMPERATURE BASED SAMPLING FOR POLYMER CHARACTERIZATION
 AN INTEGRATED SYSTEM USING TEMPERATURE BASED SAMPLING FOR POLYMER CHARACTERIZATION Paper # 164-8P Pittsburgh Conference 24 T. Wampler, C. Zawodny, L. Mancini CDS Analytical, Inc 465 Limestone Road, Oxford,
Rapid Catalyst Screening Reactors
 Rapid Catalyst Screening Reactors Rapid screening of catalysts Analysis of a variety of sample types Multi-modes of operation Rx-3050TR Single µ-reactor Rx-3050SR Overview Two types of rapid catalyst screening
STANDARD OPERATING PROCEDURES SOP: 1828 PAGE: 1 of 14 REV: 0.0 DATE: 05/12/95 ANALYSIS OF METHYL PARATHION IN CARPET SAMPLES BY GC/MS
 PAGE: 1 of 14 1.0 SCOPE AND APPLICATION 2.0 METHOD SUMMARY CONTENTS 3.0 SAMPLE PRESERVATION, CONTAINERS, HANDLING AND STORAGE 4.0 INTERFERENCES AND POTENTIAL PROBLEMS 5.0 EQUIPMENT/APPARATUS 6.0 REAGENTS
Application Note. Abstract. Introduction. Experimental-Instrument Conditions. By: Anne Jurek
 Automated Handling Techniques for the Analysis of Elevated Volatile Organic Compound (VOC) Concentrations in Soils Utilizing the Atomx Concentrator/Multimatrix Autosampler. Application Note By: Anne Jurek
Application Note # Performance of Method 8270 Using Hydrogen Carrier Gas on SCION Bruker SCION GC-MS
 Application Note #1820230 Performance of Method 8270 Using Hydrogen Carrier Gas on SCION Bruker SCION GC-MS GC-MS Introduction USEPA Method 8270 [1] for semivolatiles is is used by by laboratories to measure
Analysis of Pressure Sensitive Adhesives by GC/MS and GC/AED with Temperature Programmable Pyrolyzer
 2000 The Japan Society for Analytical Chemistry 627 Analysis of Pressure Sensitive Adhesives by GC/MS and GC/AED with Temperature Programmable Pyrolyzer Sadao NAKAMURA,* Masahiko TAKINO,* and Shigeki DAISHIMA**
Headspace Technology for GC and GC/MS: Features, benefits & applications
 Headspace Technology for GC and GC/MS: Features, benefits & applications Karima Baudin Oct 2015 Why use Headspace? Very Simple no to minimum sample prep Robust enhance uptime Non-detectable carry-over
Application Note. Abstract. Introduction. Experimental-Instrument Conditions. By: Anne Jurek
 Requirements of an Automated Sample Delivery System in Today s Realm of Ever Increasing Sensitivity Demands Utilizing the Atomx Concentrator/Multimatrix Autosampler. Application Note By: Anne Jurek Abstract
Application Note. Authors. Abstract. Xin Sun Shandong Agriculture University, Taian, , China
 Determination of 19 Phthalic Acid Esters (PAEs) in Vegetables Using Modified QuEChERS and Gas Chromatography-Triple Quadrupole Mass Spectrometry (GC/MS/MS) Application Note Authors Xin Sun Shandong Agriculture
Application Note. Gas Chromatography/Mass Spectrometry/Food Safety. Abstract. Authors
 Trace-Level Analysis of Melamine in Milk Products on Agilent 789A/5975C GC/MSD Using a ew Agilent J&W DB-5ms Ultra Inert Column and SampliQ SCX Cartridges Application ote Gas Chromatography/Mass Spectrometry/Food
Understanding Gas Chromatography
 Understanding Gas Chromatography What is Really Going on Inside the Box? Simon Jones GC Applications Engineer Page 1 Group/Presentation Title Month ##, 200X ?? K? Page 2 Typical GC System Gas supply Injector
Analysis of Trace (mg/kg) Thiophene in Benzene Using Two-Dimensional Gas Chromatography and Flame Ionization Detection Application
 Thiophene in Benzene Using Two-Dimensional Gas Chromatography and Flame Ionization Detection Application") Analysis of Trace (mg/kg) Thiophene in Using Two-Dimensional Gas Chromatography and Flame Ionization Detection Application Petrochemical Authors James D. McCurry and Bruce D. Quimby Agilent Technologies
Analysis of Trace (mg/kg) Thiophene in Using Two-Dimensional Gas Chromatography and Flame Ionization Detection Application Petrochemical Authors James D. McCurry and Bruce D. Quimby Agilent Technologies
STANDARD OPERATING PROCEDURES SOP: 1826 PAGE: 1 of 18 REV: 0.0 DATE: 03/30/95 ANALYSIS OF METHYL PARATHION IN WIPE SAMPLES BY GC/MS
 PAGE: 1 of 18 CONTENTS 1.0 SCOPE AND APPLICATION 2.0 METHOD SUMMARY 3.0 SAMPLE PRESERVATION, CONTAINERS, HANDLING AND STORAGE 4.0 INTERFERENCES AND POTENTIAL PROBLEMS 5.0 EQUIPMENT/APPARATUS 6.0 REAGENTS
VALIDATION OF A UPLC METHOD FOR A BENZOCAINE, BUTAMBEN, AND TETRACAINE HYDROCHLORIDE TOPICAL SOLUTION
 VALIDATION OF A UPLC METHOD FOR A BENZOCAINE, BUTAMBEN, AND TETRACAINE HYDROCHLORIDE TOPICAL SOLUTION Andrew J. Aubin and Tanya L. Jenkins Waters Corporation, Milford, MA, USA INTRODUCTION Benzocaine (4-Aminobenzoic
VOC Analysis of Water-Based Coatings by Headspace-Gas Chromatography
 VOC Analysis of Water-Based Coatings by Headspace-Gas Chromatography Introduction ASTM International publishes a number of different methods for the determination of volatile compounds in water-based coatings.
Determination of 15 phthalate esters by ultra performance convergence chromatography
 5th International Conference on Advanced Materials and Computer Science (ICAMCS 2016) Determination of 15 phthalate esters by ultra performance convergence chromatography Wulin Lia, Genrong Li b, Xiao
U.S. EPA Method 8270 for multicomponent analyte determination
 ENVIRONMENTAL application note U.S. EPA Method 8270 for multicomponent analyte determination Elaine A. LeMoine and Herman Hoberecht Introduction Multicomponent analytes are compounds that yield several
GC-CI-MS analysis of TMS derivatives
 GC-CI-MS analysis of TMS derivatives This method describes analysis of TMS derivatives with methane chemical ionisation (CI) rather than the more normal electron impact (EI) ionisation. Methane CI is a
GUIDELINES FOR THE DESIGN OF CHROMATOGRAPHIC ANALYTICAL METHODS INTENDED FOR CIPAC COLLABORATIVE STUDY
 Page 1 of 13 CIPAC/4105/R GUIDELINES FOR THE DESIGN OF CHROMATOGRAPHIC ANALYTICAL METHODS INTENDED FOR CIPAC COLLABORATIVE STUDY Prepared for CIPAC by Dr M J Tandy*, P M Clarke and B White (UK) The rapid
ANNE JUREK. Abstract: soils and are found. in can also with GC/MS. poster. in series. option for. There are problems. analytes. in methanol.
 Determination of Volatile Petroleum Hydrocarbons ANNE JUREK Abstract: Due to current events, the importance of determining volatile petroleum hydrocarbons in both soils and waters has become an issue.
NCFS Sample Preparation and Instrumental Parameters
 NCFS Sample Preparation and Instrumental Parameters April 1, 2010 Prepared by Dana-Marie Dennis and Jessica Frisch Addenda by Dana-Marie Dennis and Quashanna Price 1. MICROMETRY A stage micrometer is used
Mass Spectral Studies of Polypropylene Chromatographic Well Plates
 Mass Spectral Studies of Polypropylene Chromatographic Well Plates Brian King, Thermo Fisher Scientific, Runcorn, Cheshire, UK Detlev Lennartz, Thermo Fisher Scientific, Langerwehe, Germany White Paper
Increasing Selectivity and Confidence in Detection when Analyzing Phthalates by LC-MS/MS
 Increasing Selectivity and Confidence in Detection when Analyzing Phthalates by LC-MS/MS André Schreiber 1, Fanny Fu 2, livia Yang 2, Eric Wan 3, Long Gu 4, and Yves LeBlanc 1 1 SCIEX, Concord, ntario
High-Resolution Accurate-Mass (HRAM) Phthalate Screening using Direct Analysis in Real Time (DART) Ambient Ionization
 Phthalate Screening using Direct Analysis in Real Time (DART) Ambient Ionization") igh-resolution Accurate-Mass (RAM) Phthalate Screening using Direct Analysis in Real Time (DART) Ambient Ionization Catharina Crone, 1 Markus Kellmann, 1 Yue Xuan, 1 Elizabeth Crawford 2 1 Thermo Fisher
igh-resolution Accurate-Mass (RAM) Phthalate Screening using Direct Analysis in Real Time (DART) Ambient Ionization Catharina Crone, 1 Markus Kellmann, 1 Yue Xuan, 1 Elizabeth Crawford 2 1 Thermo Fisher
Evaluation of a New Analytical Trap for Gasoline Range Organics Analysis
 Abstract Purge and Trap (P&T) is a concentration technique used for the analysis of Volatile Organic Compounds (VOCs). The major component of any P&T system is the analytical trap. This trap is responsible
STANDARD OPERATING PROCEDURES
 PAGE: 1 of 12 CONTENTS 1.0 SCOPE AND APPLICATION 2.0 METHOD SUMMARY 3.0 SAMPLE PRESERVATION, CONTAINERS, HANDLING, AND STORAGE 4.0 INTERFERENCES AND POTENTIAL PROBLEMS 5.0 EQUIPMENT/APPARATUS 6.0 REAGENTS
1,2-Dibromoethane (EDB) and 1,2-dibromo-3-chloropropane (DBCP), gas chromatography, microextraction
 and 1,2-dibromo-3-chloropropane (DBCP), gas chromatography, microextraction") 1. Application 1,2-Dibromoethane (EDB) and 1,2-dibromo-3-chloropropane (DBCP), gas chromatography, microextraction Parameters and Codes: EDB and DBCP, whole water recoverable, O-3120-90 Parameter (µg/l)
1. Application 1,2-Dibromoethane (EDB) and 1,2-dibromo-3-chloropropane (DBCP), gas chromatography, microextraction Parameters and Codes: EDB and DBCP, whole water recoverable, O-3120-90 Parameter (µg/l)
Chemistry Gas Chromatography: Separation of Volatile Organics
 Chemistry 3200 Gas chromatography (GC) is an instrumental method for separating volatile compounds in a mixture. A small sample of the mixture is injected onto one end of a column housed in an oven. The
Determination of VOC in Artificial Runway by Multiple Headspace Extraction-GC/MS. Gas Chromatography/ Mass Spectrometry APPLICATION.
 APPLICATION NOTE Gas Chromatography/ Mass Spectrometry Author: Kira. Yang PerkinElmer, Inc. Shanghai, China Determination of VOC in Artificial Runway by Multiple Headspace Extraction-GC/MS Introduction
Gas Chromatography (GC)
") Gas Chromatography (GC) Ahmad Aqel Ifseisi Assistant Professor of Analytical Chemistry College of Science, Department of Chemistry King Saud University P.O. Box 2455 Riyadh 11541 Saudi Arabia Office: AA53
Gas Chromatography (GC) Ahmad Aqel Ifseisi Assistant Professor of Analytical Chemistry College of Science, Department of Chemistry King Saud University P.O. Box 2455 Riyadh 11541 Saudi Arabia Office: AA53
An Advanced Base Deactivated Capillary Column for analysis of Volatile amines Ammonia and Alcohols.
 An Advanced Base Deactivated Capillary Column for analysis of Volatile amines Ammonia and Alcohols. Jaap de Zeeuw, Ron Stricek and Gary Stidsen Restek Corp Bellefonte, USA To analyze basic compounds at
Rapid Screening and Confirmation of Melamine Residues in Milk and Its Products by Liquid Chromatography Tandem Mass Spectrometry
 Rapid Screening and Confirmation of Melamine Residues in Milk and Its Products by Liquid Chromatography Tandem Mass Spectrometry Application Note Food Authors Jianqiu Mi, Zhengxiang Zhang, Zhixu Zhang,
Sensitive Detection of 2-MIB and Geosmin in Drinking Water
 Sensitive Detection of -MIB and Geosmin in Drinking Water Application Note Environmental Author Yean-Woong You Agilent Technologies, Inc. Seoul, Korea Abstract An automated SPME extraction method for easy
Analysis of Illegal Dyes in Food Matrices using Automated Online Sample Preparation with LC/MS
 Application Note: 56 Analysis of Illegal Dyes in Food Matrices using Automated Online Sample Preparation with LC/MS Yang Shi, Catherine Lafontaine, Matthew Berube, John Fink, François Espourteille Thermo
Determination of Volatile Substances Proof of Food Adulteration
 ANALYSIS OF FOOD AND NATURAL PRODUCTS LABORATORY EXERCISE Determination of Volatile Substances Proof of Food Adulteration (method: gas chromatography with mass spectrometric detection) Exercise guarantor:
DETERMINATION OF PHTHALATES FROM BOTTLED WATER BY GC-MS
 DETERMINATION OF PHTHALATES FROM BOTTLED WATER BY GC-MS IRINA DUMITRAȘCU 1,2 ABSTRACT- Determination of phthalates from bottled by GC-MS. Phthalates are ubiquitous pollutants in the environment, due to
Material Characterization in the Automotive Industry Using Multi-Mode Pyrolysis GC/MS:
 Material Characterization in the Automotive Industry Using Multi-Mode Pyrolysis GC/MS: A COMPREHENSIVE GUIDE FOR PYROLYSIS GCMS TECHNIQUE AND ITS USE IN THE AUTOMOTIVE INDUSTRY Table of Contents Why Pyrolysis
Solid Phase Micro Extraction of Flavor Compounds in Beer
 Solid Phase Micro Extraction of Flavor s in Beer ANNE JUREK USEPA 524.2 Method Validation Using the Evolution Purge and Trap Concentrator and the Centurion WS Autosampler Application Note Environmental
Chapter content. Reference
 Chapter 7 HPLC Instrumental Analysis Rezaul Karim Environmental Science and Technology Jessore University of Science and Technology Chapter content Liquid Chromatography (LC); Scope; Principles Instrumentation;
Validation of New VPH GC/MS Method using Multi-Matrix Purge and Trap Sample Prep System
 Validation of New VPH GC/MS Method using Multi-Matrix Purge and Trap Sample Prep System Application Note Abstract The Massachusetts Department of Environmental Protection (MassDEP) developed the Method
2,5-DIMETHOXY-4-IODOPHENETHYLAMINE Latest Revision: August 22, 2005
 2,5-DIMETHOXY-4-IODOPHENETHYLAMINE Latest Revision: August 22, 2005 1. SYNONYMS CFR: CAS #: Other Names: Not Available Base: Not Available Hydrochloride: 69587-11-7 4-Iodo-2,5-dimethoxyphenethylamine 4-Iodo-2,5-dimethoxybenzeneethanamine
Gas Chromatography. Introduction
 Gas Chromatography Introduction 1.) Gas Chromatography Mobile phase (carrier gas) is a gas - Usually N 2, He, Ar and maybe H 2 - Mobile phase in liquid chromatography is a liquid Requires analyte to be
Analyzing Residual Solvents in Pharmaceutical Products Using GC Headspace with Valve-and-Loop Sampling
 Analyzing Residual Solvents in Pharmaceutical Products Using GC Headspace with Valve-and-Loop Sampling Andrea Caruso and Massimo Santoro, Thermo Fisher Scientific, Milan, Italy Application Note 1316 Key
Analytical Trap Comparison for USEPA Method 8260C
 Analytical Trap Comparison for USEPA Method 8260C Application Note Abstract Purge and trap concentration is a technique that is used for the analysis of Volatile Organic Compounds (VOCs). The major component
Optimization of 1,4-Dioxane and Ethanol Detection Using USEPA Method 8260 Application Note
 Solid Phase Micro Extraction of Flavor Compounds in Beer ANNE JUREK Optimization of 1,4-Dioxane and Ethanol Detection Using USEPA Method 8260 Application Note Environmental Author Anne Jurek Applications
Pittcon P
 PO-CON1701E 76% Increase in Throughput for Determination of Semi-Volatiles Using Narrow-Bore GC Columns and Rapid Data Acquisition with a Highly Sensitive Quadrupole GCMS System Pittcon 2017 1440-14P Brahm
Analysis of BTEX in Natural Water with SPME
 Analysis of BTEX in Natural Water with SPME Application Note Environmental Author Giordano Vassalli Sezione Protezione Aria Introduction Benzene, toluene, ethylbenzene and xylene (BTEX) isomers are monocyclic
METHOD 8030A ACROLEIN AND ACRYLONITRILE BY GAS CHROMATOGRAPHY
 METHOD 8030A ACROLEIN AND ACRYLONITRILE BY GAS CHROMATOGRAPHY 1.0 SCOPE AND APPLICATION 1.1 Method 8030 is used to determine the concentration of the following volatile organic compounds: Compound Name
GAS CHROMATOGRAPHY MASS SPECTROMETRY. Pre-Lab Questions
 GAS CHROMATOGRAPHY MASS SPECTROMETRY Pre-Lab Questions Questions to be answered before doing the experiment. The answers are due at the beginning of each experiment without exception (the questions are
THE NEW QUANTITATIVE ANALYTICAL METHOD FOR ULTRATRACE SULFUR COMPOUNDS IN NATURAL GAS
 International Gas Union Research Conference 14 THE NEW QUANTITATIVE ANALYTICAL METHOD FOR ULTRATRACE SULFUR COMPOUNDS IN NATURAL GAS Main author Hironori IMANISHI Tokyo Gas Co., Ltd. JAPAN himanishi@tokyo-.co.jp
System and JUREK ANNE. Introduction: in an in purge and. trap sampling. Discussion: As part of. consistent and reliable data. (MoRT) to.
 to.") ANNE JUREK Optimal Conditions for USEPA Method 8260B Analysis Using the EST Analyticall Sampling System and the Shimadzu GCMS-QP2010s Introduction: The USEPA developedd Method 8260B for the determination
ANNE JUREK Optimal Conditions for USEPA Method 8260B Analysis Using the EST Analyticall Sampling System and the Shimadzu GCMS-QP2010s Introduction: The USEPA developedd Method 8260B for the determination
Methanol Extraction of high level soil samples by USEPA Method 8260C
 Methanol Extraction of high level soil samples by USEPA Method 8260C Abstract In order to determine the concentration of Volatile Organic Compounds (VOCs) in soil and waste samples the USEPA developed
METHOD 3600B CLEANUP
 METHOD 3600B CLEANUP 1.0 SCOPE AND APPLICATION 1.1 Method 3600 provides general guidance on selection of cleanup methods that are appropriate for the target analytes of interest. Cleanup methods are applied
EPA Method 535: Detection of Degradates of Chloroacetanilides and other Acetamide Herbicides in Water by LC/MS/MS
 EPA Method 535: Detection of Degradates of Chloroacetanilides and other Acetamide Herbicides in Water by LC/MS/MS Christopher Borton AB SCIEX Golden, Colorado verview Described here is the analysis of
Spring 2010 updated March 24 Determination of Aromatics in Gasoline by Gas Chromatography- Mass Spectrometry: Comparison of Grades and Brands
 Chem F413W Spring 2010 updated March 24 Determination of Aromatics in Gasoline by Gas Chromatography- Mass Spectrometry: Comparison of Grades and Brands Introduction Gasoline is a complex mixture of volatile
Highly Sensitive and Rugged GC/MS/MS Tool
 Highly Sensitive and Rugged GC/MS/MS Tool For Pesticide Multiresidue Analysis in Food Samples Agilent 7 Series Triple Quadrupole GC/MS. The world s first MS/MS designed specifically for GC Analysis Introduction
GAS CHROMATOGRAPHY (GC)
") GAS CHROMATOGRAPHY (GC) Pre-Lab Questions Questions are to be answered before the beginning of the laboratory. The answers are due at the beginning of each experiment (the questions are for credit and
GAS CHROMATOGRAPHY (GC) Pre-Lab Questions Questions are to be answered before the beginning of the laboratory. The answers are due at the beginning of each experiment (the questions are for credit and
Improved Volatiles Analysis Using Static Headspace, the Agilent 5977B GC/MSD, and a High-efficiency Source
 Improved Volatiles Analysis Using Static Headspace, the Agilent 5977B GC/MSD, and a High-efficiency Source Application Note Environmental Authors Peter Gautschi and Harry Prest Senior Application Scientist
A Comparative Analysis of Fuel Oxygenates in Soil by Dynamic and Static Headspace Utilizing the HT3 TM Automatic Headspace Analyzer
 A Comparative Analysis of Fuel Oxygenates in Soil by Dynamic and Static Headspace Utilizing the HT3 TM Automatic Headspace Analyzer Application Note By: Anne Jurek Abstract This application note presents
Determination of Polymer Modifier in Asphalt
 Standard Method of Test for Determination of Polymer Modifier in Asphalt AASHTO Designation: T xxx-xx (2005) 1. SCOPE 1.1. This method of test is used to determine the polymer content of an asphalt sample.
Validation of USEPA Method Using a Stratum PTC and the New AQUATek 100 Autosampler
 Validation of USEPA Method 524.2 Using a Stratum PTC and the New AQUATek 100 Autosampler Application Note Abstract Automation is the key to increasing laboratory productivity and minimizing costs. It is
Selection of a Capillary
 Selection of a Capillary GC Column - Series 3 Mark Sinnott Application Engineer March 19, 2009 Page 1 Typical Gas Chromatographic System Mol-Sieve Traps Fixed Restrictors Regulators Injection Port Detector
Application. Gas Chromatography March 1998
 Micro Liquid-Liquid Extraction with the Agilent 7683 Automatic Liquid Sampler Application Gas Chromatography March 1998 Authors Matthew S. Klee Agilent Technologies, Inc. 285 Centerville Road Wilmington,
Quantification of Pesticides in Food without Calibration using GC/FID with the Polyarc Reactor
 Quantification of Pesticides in Food without Calibration using GC/FID with the Polyarc Reactor Application Note Pesticides Authors Charlie Spanjers and Paul Dauenhauer University of Minnesota, Twin Cities
H 3 CO H 3 CO S CH 3
 FENITROTHION 35 H 3 CO P H 3 CO S O CH 3 NO 2 ISO common name Chemical name Fenitrothion O,O-Dimethyl O-4-nitro-m-tolyl phosphorothioate (IUPAC) O,O-Dimethyl O-(3-methyl-4-nitrophenyl)- phosphorothioate
Test Method: CPSC-CH-E
 UNITED STATES CONSUMER PRODUCT SAFETY COMMISSION DIRECTORATE FOR LABORATORY SCIENCES DIVISION OF CHEMISTRY 10901 DARNESTOWN RD GAITHERSBURG, MD 20878 Test Method: CPSC-CH-E1001-08 Standard Operating Procedure
Analysis of Plasticizer Contaminants in Beverages and Milk using an Automated System Based on Turbulent-flow Chromatography Coupled to LC-MS/MS
 Method: 52251 Analysis of Plasticizer Contaminants in Beverages and Milk using an Automated System Based on Turbulent-flow Chromatography Coupled to LC-MS/MS Ebru Ates, Klaus Mittendorf, Thermo Fisher
METHOD 8033 ACETONITRILE BY GAS CHROMATOGRAPHY WITH NITROGEN-PHOSPHORUS DETECTION
 METHOD 80 ACETONITRILE BY GAS CHROMATOGRAPHY WITH NITROGEN-PHOSPHORUS DETECTION 1.0 SCOPE AND APPLICATION 1.1 Method 80 may be used to determine the concentration of acetonitrile (CAS No. 75-05-8) in aqueous
GC-MS Screen for the Presence of Melamine, Ammeline, Ammelide and Cyanuric Acid
 GC-MS Screen for the Presence of Melamine, Ammeline, Ammelide and Cyanuric Acid (Version 2.1) This method for Melamine, Ammeline, Ammelide and Cyanuric Acid should be regarded as interim. Because of the
Volatile Organic Compounds in Every Day Food
 Volatile Organic Compounds in Every Day Food Application Note Abstract Volatile Organic Compounds (VOCs) have been analyzed in drinking water and pharmaceuticals extensively in recent years. Now, VOCs
Expectations for GC-MS Lab
 Expectations for GC-MS Lab Since this is the first year for GC-MS to be used in Dr. Lamp s CHEM 322, the lab experiment is somewhat unstructured. As you move through the experiment, I expect that you will
Analysis. Introduction: necessary. presented. Discussion: As part of be carried. consistent and reliable data. (MoRT) to.
 to.") Optimal Conditions for USEPA Method 8260 Analysis Anne Jurek Introduction: Over the past decade, the need for environmental laboratoriess using purge and trap systems to report at or below the Method Detection
Optimal Conditions for USEPA Method 8260 Analysis Anne Jurek Introduction: Over the past decade, the need for environmental laboratoriess using purge and trap systems to report at or below the Method Detection
Analysis of Geosmin and 2-Methylisoborneol Utilizing the Stratum PTC and Aquatek 70
 Analysis of Geosmin and 2-Methylisoborneol Utilizing the Stratum PTC and Aquatek 70 Application Note Abstract Geosmin and 2-Methylisoborneol are organic compounds that have a distinct scent. These compounds
Screening for Water Pollutants With the Agilent SureTarget GC/MSD Water Pollutants Screener, SureTarget Workflow, and Customized Reporting
 Screening for Water Pollutants With the Agilent SureTarget GC/MSD Water Pollutants Screener, SureTarget Workflow, and Customized Reporting Application Note Authors Angela Smith Henry and Bruce Quimby Agilent
Application Note. Author. Abstract. Introduction. Hydrocarbon Processing
 Automated Preparation of Simulated Distillation Standards and Samples for ASTM Methods D2887, D7213, D7398 and D6352 using the 7693A System with Easy SamplePrep Software Author Roger L. Firor Agilent Technologies,
Introduction to Capillary GC. Page 1. Agilent Restricted February 2, 2011
 ?? Kβ? Page 1 Typical GC System Gas supply Injector Detector Data handling GAS Column Oven Page 2 CARRIER GAS Carries the solutes down the column Selection and velocity influences efficiency and retention
Technical Procedure for Concentration Determination of Methamphetamine in Liquids via HPLC
 Technical Procedure for Concentration Determination of 1.0 Purpose This procedure specifies the required elements for the preparation and use of the Agilent 1100/1200 series High Performance Liquid Chromatograph
Analysis of Biomarkers in Crude Oil Using the Agilent 7200 GC/Q-TOF
 Analysis of Biomarkers in Crude Oil Using the Agilent 7 GC/Q-TOF Application Note Petrochemical and Environmental Authors Frank David Research Institute for Chromatography, Kennedypark 6, B-85 Kortrijk,
METHOD 3600C CLEANUP
 METHOD 3600C CLEANUP 1.0 SCOPE AND APPLICATION 1.1 Method 3600 provides general guidance on selection of cleanup methods that are appropriate for the target analytes of interest. Cleanup methods are applied
Maximizing Sample Throughput In Purge And Trap Analysis
 Maximizing Sample Throughput In Purge And Trap Analysis LINDSEY PYRON ANNE JUREK INTRODUCTION There are several demands and requirements imposed on chemists performing volatile organic analysis (VOC) in
Determination of Volatile Aromatic Compounds in Soil by Manual SPME and Agilent 5975T LTM GC/MSD
 Determination of Volatile Aromatic Compounds in Soil by Manual SPME and Agilent 5975T LTM GC/MSD Application Note Environmental Author Suli Zhao, Andy Zhai Agilent Technologies Co., Ltd. 412 Yinglun Road
Selection of a Capillary GC Column
 Selection of a Capillary GC Column Mark Sinnott Application Engineer March 13, 2008 Page 1 Typical Gas Chromatographic System Mol-Sieve Traps Fixed Restrictors Regulators Injection Port Detector Electrometer
Chromatography. Gas Chromatography
 Chromatography Chromatography is essentially the separation of a mixture into its component parts for qualitative and quantitative analysis. The basis of separation is the partitioning of the analyte mixture
CHEM Experiment Five Gas Chromatographic Analysis Of A Phenolic Extract. Objectives:
 CHEM 3281 Experiment Five Gas Chromatographic Analysis Of A Phenolic Extract Objectives: The objectives of this experiment are: 1. to evaluate the fundamental parameters of gas chromatography; 2. to identify
Validation of Volatile Organic Compound by USEPA. Method 8260C. Application Note. Abstract. Introduction. Experimental-Instrument Conditions
 Validation of Volatile Organic Compound by USEPA Method 8260C Application Note Abstract In order to determine the concentration of volatile organic compounds (VOCs) in water and soil matrices the USEPA
METHOD: 1403, Issue 3 EVALUATION: FULL Issue 1: 15 August 1990 Issue 3: 15 March 2003
 ALCOHOLS IV 1403 (1) HOCH 2 CH 2 OCH 3 MW: (1) 76.09 CAS: (1) 109-86-4 RTECS: (1) KL5775000 (2) HOCH 2 CH 2 OCH 2 CH 3 (2) 90.12 (2) 110-80-5 (2) KK8050000 (3) HOCH 2 CH 2 O(CH 2 ) 3 CH 3 (3) 118.17 (3)
Chapter 27: Gas Chromatography
 Chapter 27: Gas Chromatography Gas Chromatography Mobile phase (carrier gas): gas (He, N 2, H 2 ) - do not interact with analytes - only transport the analyte through the column Analyte: volatile liquid
AppNote 6/2004. Thermal Desorption GC Analysis of High Boiling, High Molecular Weight Hydrocarbons SUMMARY
 AppNote 6/2004 Thermal Desorption GC Analysis of High Boiling, High Molecular Weight Hydrocarbons Edward A. Pfannkoch, Jacqueline A. Whitecavage, and Jeffrey Christenson Gerstel, Inc., 701 Digital Drive,
Detection of Volatile Organic Compounds in polluted air by an Agilent mini Thermal Desorber and an Agilent 5975T LTM GC/MS
 Detection of Volatile Organic Compounds in polluted air by an Agilent mini Thermal Desorber and an Agilent 5975T LTM GC/MS Application Note Environmental Author Xiaohua Li Agilent Technologies (Shanghai)
Technical know-how in thermal analysis measurement
 Technical articles Technical know-how in thermal analysis measurement Evolved gas analysis by thermogravimetry-differential thermal analysis-mass spectrometry (TG-DTA-MS) technique Kazuko Motomura* and
The Analysis of Residual Solvents in Pharmaceutical Products Using GC-VUV and Static Headspace
 The Analysis of Residual Solvents in Pharmaceutical Products Using GC-VUV and Static Headspace The Analysis of Residual Solvents in Pharmaceutical Products Using GC-VUV and Static Headspace_Rev3 Introducing
Application. Gas Chromatography February Introduction
 Ambient Headspace Analysis with the Agilent 7683 Automatic Liquid Sampler Application Gas Chromatography February 1998 Authors Matthew S. Klee and Chin Kai Meng Agilent Technologies, Inc. 2850 Centerville
Method for Characterization of Gum Rosin by Capillary Gas Chromatography
 PCA TEST METHOD PCTM 27 Published 1/1 2004 1. Scope Method for Characterization of Gum Rosin by Capillary Gas Chromatography 1.1 These test methods cover the determination of the amounts of certain rosin
Roger Bardsley, Applications Chemist; Teledyne Tekmar Page 1
 Application Note Meeting the Korean Method ES 04602.1b for Vinyl Chloride, Acrylonitrile, and Bromoform ( 염화비닐, 아크릴로니트릴, 브로모포름 ) with Static and Dynamic Headspace GC/MS Roger Bardsley, Applications Chemist;
METHOD 8111 HALOETHERS BY GAS CHROMATOGRAPHY
 1.0 SCOPE AND APPLICATION METHOD 8111 HALOETHERS BY GAS CHROMATOGRAPHY 1.1 Method 8111 is a gas chromatographic (GC) method used to determine the concentration of haloethers. It describes wide-bore open-tubular,
METHOD 8032A ACRYLAMIDE BY GAS CHROMATOGRAPHY
 METHOD 8032A ACRYLAMIDE BY GAS CHROMATOGRAPHY 1.0 SCOPE AND APPLICATION 1.1 Method 8032 is used to determine trace amounts of acrylamide monomer (CAS No. 79-06-1) in aqueous matrices. This method may be