T H E U N I V E R S I T Y O F T U L S A THE GRADUATE SCHOOL INTERFACIAL PHENOMENA IN OIL-WATER DISPERSIONS. by Carlos Avila
|
|
|
- Horatio Miles
- 6 years ago
- Views:
Transcription
1 T H E U N I V E R S I T Y O F T U L S A THE GRADUATE SCHOOL INTERFACIAL PHENOMENA IN OIL-WATER DISPERSIONS by Carlos Avila A dissertation submitted in partial fulfillment of the requirements for the degree of Doctor of Philosophy in the Discipline of Petroleum Engineering The Graduate School The University of Tulsa 006

2
3 ABSTRACT Avila, Carlos (Doctor of Philosophy in Petroleum Engineering) Interfacial Phenomena in Oil-Water Dispersions Directed by Professor Ovadia Shoham and Professor Ram S. Mohan (145 pp., Chapter 5) (31 words) The interfacial phenomena of oil-water dispersions have been studied in different polydispersed systems resulting in an improved understanding of the physical phenomena occurring in such systems. Models for different liquid-liquid systems have been developed and/or modified, as follows: A phase inversion prediction model, based on an interfacial energy balance, for turbulent dispersions is proposed, which combines population balance approach and break-up and coalescence models available from the literature. The proposed model has been validated against experimental data and provides a tool to predict dispersed flow boundary transitions for different applications including pipe flow and static mixers. A model is proposed which combines the thermodynamic aspects of droplet deformation with a population balance approach, for the analysis of droplets interaction in dispersions. This model allows investigation of the effects of surfactants, electrostatic interactions and other interaction forces in different dispersed systems. The study developed by Zhang et al. (1995) for electrostatic coalescence has been modified to iii
4 include the effect of laminar shear collisions, utilizing the population balance approach. Comparisons against experimental data from the literature show good agreement. A batch separation model is proposed which applies a population balance approach to characterize the separation profiles that occur during batch separation and to predict the initial droplet size distribution and its temporal evolution. The model considers the effect of interfacial coalescence for a distribution of droplets and the effect of electrolytes. Comparison against experimental data from Gomez-Markovich (006) shows very good agreement. iv
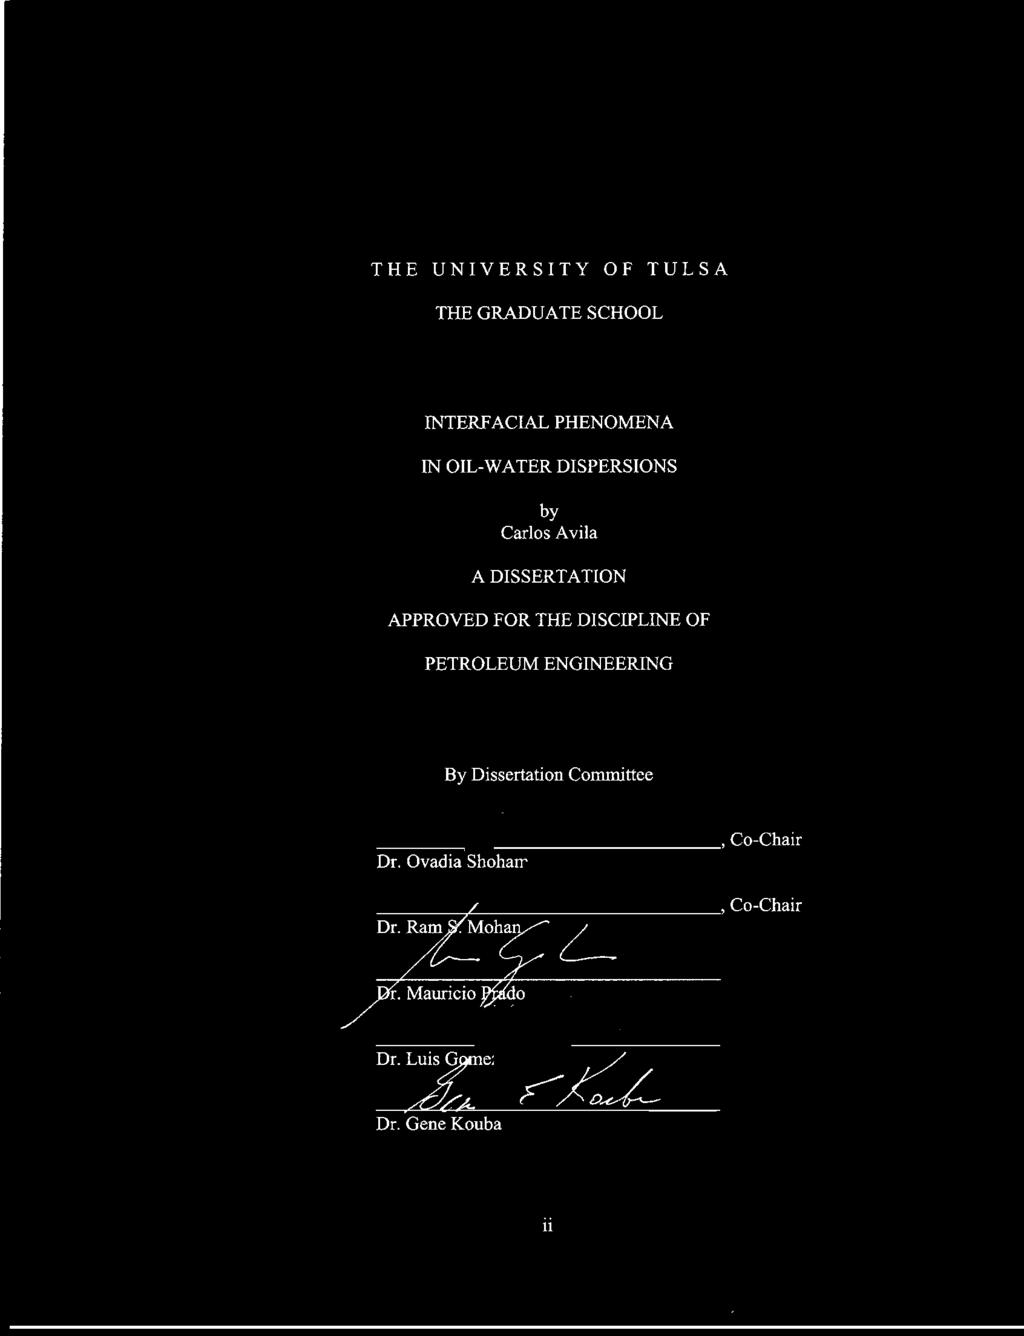
5 ACKNOWLEDGEMENTS I am grateful to my advisors Dr. Ovadia Shoham and Dr. Ram S. Mohan for their continuous personal support and advice in the development of this study. Gratitude is due also to Dr. Luis Gomez, Dr. Mauricio Prado and Dr. Gene Kouba for serving on my dissertation committee and for their valuable suggestions along the development of this project. I wish to thank the Tulsa University Separation Technology Projects (TUSTP), and the U.S. Department of Energy (DOE), for providing financial support for conducting this research (DOE award number DE-FC6-03NT15416). Also, I would like to thank the Chevron Tulsa University Center of Research Excellence (TU-CoRE) for supporting the Dispersion Characterization Rig (DCR) and associated projects. To Mrs. Judy Teal and all the TUSTP students, thank you very much for your friendship, help and support. Especially, I would like to acknowledge Dr. Carlos Torres-Monzon for his valuable collaboration. I would like to extend my gratitude to the Gomez family, to Luis and Yesenia who have become my family in Tulsa. This work could not have been done without the help of the most important persons in my life. They are my parents Manuel and Carmen and my sister Ana. Also, I want to extend my gratitude to my beloved wife Oris for her help and support throughout the years. Finally, to my real-friends, who are always in my thoughts wherever they are. v
6 TABLE OF CONTENTS Page ABSTRACT... iii ACKNOWLEDGEMENTS... TABLE OF CONTENTS... LIST OF TABLES... LIST OF FIGURES... v vi ix x CHAPTER 1: INTRODUCTION... 1 CHAPTER : PHASE INVERSION IN TURBULENT OIL-WATER DISPERSIONS Literature Review Oil-Water Flow Patterns Flow Pattern Experimental Studies: Effects of Inlet Design and Wetting Properties: Effects of Oil and Water Superficial Velocities: Transition to Dispersed Flow Modeling: Coalescence and Break-up Models Coalescence Frequency Models: Break-up Frequency Models: Daughter Particle Size Distribution Droplet Number Population Balance Phase Inversion Modeling Phase Inversion in Turbulent Oil-Water Dispersions based on Coalescence and Break-up Processes Coalescence and Break-up Frequency Models Coalescence Frequency Model: Break-up Frequency Model: Daughter Particle Size Distribution Droplet Number Population Balance Phase Inversion Energy Dissipation in Static Mixers: Comparison Between Model Predictions and Experimental Data Phase Inversion in Pipe Flow Phase Inversion in Static Mixers vi
7 CHAPTER 3: DROPLET-DROPLET INTERACTION Literature Review Thermodynamic Aspects of Droplet Deformation Energy of Interaction between Two Deformable Droplets: Contribution of Interfacial Deformation: Contribution of Surface Forces: Electrostatic Coalescence Modeling of Droplet-Droplet Interaction and Coalescence Coalescence Based on Droplet Deformation Energy of Interaction between Two Deformable Droplets: Contribution of Interfacial Deformation: Contribution of Surface Forces: Coalescence Dynamics of Deformable Droplets: Electrostatic Coalescence Relative Motion of Two Conducting Droplets: Trajectory Analysis for Collision of Two Droplets: Comparison Between Model Predictions and Experimental Data Coalescence Based on Droplet Deformation Electrostatic Coalescer CHAPTER 4: OIL-WATER BATCH SEPARATION Batch Separation Physical Phenomena Emulsion Stability Batch Liquid-Liquid Dispersions Separation Process Literature Review Modeling Separation of Batch Liquid-Liquid Dispersions Constant Droplet Size Models: Transient Droplet Size Models: Experimental Investigations Batch Separator Experimental Investigations: Emulsion Studies in High Pressure / High Temperature Rigs: Modeling of Separation of Batch Liquid-Liquid Dispersions Jeelani and Hartland (1998) Model Coalescence Profile: Sedimentation Profile: Determination of Intermediate Parameters: Batch Separator Model for Polydispersed Systems Initial Droplet Size Distribution: Interfacial Coalescence Rate: Temporal Evolution of Droplets: Additional Modifications: Solution Procedure: Comparison Between Model Predictions and Experimental Data CFD Simulations for Monodispersed Systems vii
8 4.4. Batch Separator Model for Polydispersed Systems Temporal Evolution of Droplets: Effect of Electrolytes Concentration: Effect of Initial Dispersion Volume: Effect of Initial Dispersion Watercut: Effect of Mixer Valve Pressure: CHAPTER 5: CONCLUSIONS AND RECOMMENDATIONS Phase Inversion in Turbulent Oil-Water Dispersions Droplet-Droplet Interaction Oil-Water Batch Separation Recommendations NOMENCLATURE REFERENCES viii
9 LIST OF TABLES Page.1. Fluid Properties and Geometry for Experimental Data from Trallero (1995) Fluid Properties and Geometry for Experimental Data from Tidhar et al. (1986) Input Data for Droplet Deformation Coalescence Model Geometry for Experimental Data from Urdahl et al. (1998) Geometry for Pipe Batch Separator used by Barboza (00) Properties of Water Phase (Barboza, 00) Properties of Oil Phase (Barboza, 00) Parameters for CFD Model Fluid Properties of Oil Phases (Gomez-Markovich, 006) ix
10 LIST OF FIGURES Page.1. Oil-Water Flow Patterns Experimental Oil-Water Flow Pattern Map (Trallero, 1995) Coalescence and Break-Up Probabilities vs. Droplet Size Predicted by Prince and Blanch (1990) Model Daughter Particle Size Probability Distribution Prediction by Luo and Svendsen (1996) Model Steady-State Population Balance Solution for Particle Size Distribution as a Function of Turbulent Dissipation Energy Transient Population Balance Solution for Particle Size Distribution as a Function of Time Transient Population Balance Solution for Particle Size Distribution as a Function of Time (Cumulative Distribution) Comparison between Phase Inversion Model Predictions for Pipe Flow and Trallero s (1995) Experimental Data Comparison between Phase Inversion Model Predictions for a Static Mixer and Tidhar et al. (1986) Experimental Data Sketch of Two Emulsion Droplets of Radius a Separated at a Surface-to-Surface Distance h Interaction Energy W/kT for Different Film Thickness and Film Radius x
11 3.3. Coordinate System for Relative Motion of Two Droplets Typical Relative Trajectories of Two Droplets Average Droplet Size (d 50 ) vs. Residence Time for Different Micelles Volume Fractions (φ mic ) Transient Population Balance Solution for Droplet Size Distribution as a Function of Time in the Course of an Electrostatic Coalescer Transient Population Balance Solution for Droplet Size Distribution as a Function of Time (Cumulative Distribution) in the Course of an Electrostatic Coalescer Comparison between Electrostatic Coalescer Model Predictions and Urdahl et al. (1998) Experimental Data Schematic of Emulsion Breakdown and Separation Processes Sedimentation and Coalescence Profiles in a Batch Separator (Oil in Water Dispersion) Schematic of Dispersion Characterization Rig of The University of Tulsa (Gomez- Markovich, 006) Sedimentation and Coalescence Profiles in a Batch Separator and Main Parameters for Jeelani and Hartland (1998) Model (Oil in Water Dispersion Case) Droplets Arrangement at Coalescing Interface Comparison between Experimental Data (Oolman and Blanch, 1986) and Correlation for Coalescence Frequency vs. NaCl Concentration Algorithm for Solution of Model for Polydispersed Systems Algorithm for Determination of Intermediate Parameters and Separation Profiles Batch Separator CFD Simulations Results for Oil Volume Fraction Evolution xi
12 4.10. Sedimenting and Coalescing Profiles for each Time Frame Comparison of Batch Separator CFD Simulation Results with Experimental Data from Barboza (00) Comparison between Batch Separator Model and Experimental Data of Gomez- Markovich (006). Crystex AF-L Oil and Distilled Water. WC=50%, T=100ºF, P mix =50psia, P ch =50psia, P cell =40psia, V cell =150cc Transient Population Balance Solution for Droplet Size Distribution as a Function of Time in the Batch Separator. Crystex AF-L Oil and Distilled Water. WC=50%, T=100ºF, P mix =50psia, P ch =50psia, P cell =40psia, V cell =150cc Transient Population Balance Solution for Droplet Size Distribution as a Function of Time (Cumulative Distribution) in the Batch Separator. Crystex AF-L Oil and Distilled Water. WC=50%, T=100ºF, P mix =50psia, P ch =50psia, P cell =40psia, V cell =150cc Sauter Mean Diameter (d 3 ) vs. Time for Transient Population Balance Solution. Crystex AF-L Oil and Distilled Water. WC=50%, T=100ºF, P mix =50psia, P ch =50psia, P cell =40psia, V cell =150cc Comparison between Batch Separator Model and Experimental Data of Gomez- Markovich (006). Crystex AF-L Oil and Tap Water. WC=50%, T=100ºF, P mix =50psia, P ch =50psia, P cell =40psia, V cell =150cc Transient Population Balance Solution for Droplet Size Distribution as a Function of Time in the Batch Separator. Crystex AF-L Oil and Tap Water. WC=50%, T=100ºF, P mix =50psia, P ch =50psia, P cell =40psia, V cell =150cc xii
13 4.18. Transient Population Balance Solution for Droplet Size Distribution as a Function of Time (Cumulative Distribution) in the Batch Separator. Crystex AF-L Oil and Tap Water. WC=50%, T=100ºF, P mix =50psia, P ch =50psia, P cell =40psia, V cell =150cc Sauter Mean Diameter (d3) vs. Time for Transient Population Balance Solution. Crystex AF-L Oil and Tap Water. WC=50%, T=100ºF, P mix =50psia, P ch =50psia, P cell =40psia, V cell =150cc Comparison between Batch Separator Model and Experimental Data of Gomez- Markovich (006) for Crystex AF-L Oil with Distilled Water and Tap Water. WC=50%, T=100ºF, P mix =50psia, P ch =50psia, P cell =40psia, V cell =150cc Initial Droplet Size Distribution in the Batch Separator for Crystex AF-L Oil with Distilled Water and Tap Water. WC=50%, T=100ºF, P mix =50psia, P ch =50psia, P cell =40psia, V cell =150cc Comparison between Batch Separator Model and Experimental Data of Gomez- Markovich (006) for Different Initial Dispersion Volume. Crystex AF-L Oil and Tap Water. WC=50%, T=100ºF, P mix =50psia, P ch =50psia, P cell =40psia, V cell =100, 150, 00cc Initial Droplet Size Distribution in the Batch Separator for Different Initial Dispersion Volume. Crystex AF-L Oil and Tap Water. WC=50%, T=100ºF, P mix =50psia, P ch =50psia, P cell =40psia, V cell =100, 150, 00cc Comparison between Batch Separator Model and Experimental Data of Gomez- Markovich (006) for Different Initial Dispersion Watercuts. Tulco 80 Oil and xiii
14 Tap Water. WC=5, 50, 75%, T=70ºF, P mix =50psia, P ch =50psia, P cell =40psia, V cell =00cc Initial Droplet Size Distribution in the Batch Separator for Different Initial Dispersion Watercuts. Tulco 80 Oil and Tap Water. WC=5, 50, 75%, T=70ºF, P mix =50psia, P ch =50psia, P cell =40psia, V cell =00cc Comparison between Batch Separator Model and Experimental Data of Gomez- Markovich (006) for Different Mixer Valve Pressures. Crystex AF-L and Distilled Water. WC=50%, T=100ºF, P mix =0, 40 and 60 psia, P ch =50psia, P cell =40psia, V cell =150cc Initial Droplet Size Distribution in the Batch Separator for Different Mixer Valve Pressures. Crystex AF-L and Distilled Water. WC=50%, T=100ºF, P mix =0, 40 and 60 psia, P ch =50psia, P cell =40psia, V cell =150cc xiv
15 CHAPTER 1 INTRODUCTION Early multiphase flow research conducted for the petroleum industry and other industries had been focused on gas-liquid flows rather than liquid-liquid flows. This trend has changed in the last twenty years, when various investigators presented studies on liquid-liquid systems, including flow patterns, pressure gradients and velocity distributions (Arirachakaran et al., 1989, Trallero, 1995 and Torres, 006). However, these studies have been conducted assuming model fluids, where the effects of surface active agents or surfactants, as well as salts, were neglected. Additionally, most of the studies on multiphase flow have been developed under the assumption of fully-developed flow. On the other hand, for many years, various investigators have studied the effects of surfactants and other additives on non-flowing liquid-liquid systems (Ivanov et al., 1999 and Salager, 001). Published studies for liquid-liquid dispersed systems are based on the assumption of monodispersed systems. A few authors have developed models for the transition for dispersed flow in liquid-liquid dispersions based on this assumption. Others have also used this assumption to develop a model for the separation profiles for a liquid-liquid batch separator (Jeelani and Hartland, 1998). The monodispersed assumption has allowed simplifying the modeling process, whereby the results obtained under certain conditions have been successful. However, there are some cases where the nature of polydispersed 1
16 liquid-liquid systems cannot be neglected. Several studies utilized the population balance approach in order to consider polydispersed systems under break-up and coalescence. Others have used the population balance to analyze electrostatic coalescence. This approach has been successful for modeling polydispersed systems under transient conditions (Tsouris and Tavlarides, 1994 and Zhang et al., 1995) The history of the flow affects the flow characteristics of liquid-liquid dispersions. This history is determined by every possible restriction, expansion or shearing device through which the dispersion has to flow. Characteristics of the dispersion, including the droplet size distribution and the minimum and maximum droplet sizes, as well as the fluid properties, dictate the performance of downstream equipment such as separators. The performance dependence on the history of the flow is such that changes in the characteristics of a liquid-liquid dispersion may place an operating device out of its design condition. Analysis of the characteristics of dispersion in a batch separator can provide the characteristics of a liquid-liquid dispersion, and, thus, provides its flow history. In order to characterize liquid-liquid systems and test them under different operating conditions, various investigators have utilized small-scale high pressure (HP) / high temperature (HT) rigs as well as other devices. These rigs allow studying liquid-liquid systems through the use of a batch separator cell. The analysis of the separation profiles in the test cell allows characterization of the initial dispersion under different operational conditions including pressure, temperature, additives and shear. The purpose of these experiments is to provide qualitative results for screening studies although extrapolation of the results obtained in laboratory scale facility to industrial applications is desirable.
17 The objective of this investigation is to study fundamental oil-water interfacial phenomena (small-scale). Based on fundamental phenomena, models are developed capable of predicting oil-water dispersion flow behavior (large-scale). Also, studies on coalescence, break-up and segregation of polydispersed systems are included. Finally, validation of the developed models against current applications and data collected from literature is carried out. The dissertation is structured as follows: Chapter 1: Introduction. Pertinent literature will be reviewed in the following chapters for each specific topic; Chapter : Phase Inversion in Turbulent Oil-Water Dispersions; Chapter 3: Droplet-Droplet Interaction; Chapter 4: Oil-Water Batch Separation; and to end with, Chapter 5: Conclusions and Recommendations. 3
18 CHAPTER PHASE INVERSION IN TURBULENT OIL-WATER DISPERSIONS Oil-water two-phase flow occurs commonly in many applications including the oil industry. The flow of two immiscible liquids in a pipe produces different flow configurations called flow patterns. The term flow pattern refers to the geometrical distribution of the phases, which depends on the operational conditions, fluid properties and mixing conditions. In particular, when the oil-water flow is under turbulent conditions, the common resulting flow pattern is dispersed flow, where one phase is dispersed into the other due to the effects of turbulence. Under these conditions it is important to understand the physical phenomena associated with the dispersed droplets in the continuous phase, and determine which of the two phases is stable to become the continuous phase. There are many processes in nature and technology in which the time scale for droplet break-up and coalescence processes are comparable with the time scale of the macroscopic system investigated. Similar time scales imply that studying and modeling of micro scale coalescence and break-up dynamics is of major importance to predict their influence on macro scale behavior of the system. The effect of turbulence on liquid-liquid dispersions has been studied by many authors, such as Coulaloglou and Tavlarides (1977). Different studies have been conducted to determine the effect of the properties of the fluids, different quantities of turbulence applied to the dispersion and other variables, 4
19 which produce changes in the distribution of droplets. The flow of an oil-water dispersion produces relative motion among the droplets resulting in numerous collisions and hence numerous coalescence and break-up events. One of the most relevant references with respect to oil-water flow patterns in horizontal pipes is the work presented by Trallero (1995). Trallero classified the different flow patterns experimentally, and developed a model to predict the transition boundaries between the flow patterns. Among those flow patterns observed was dispersed flow. Additionally, as important as it is to determine the flow pattern under certain operational conditions, it is also important to know which phase is the continuous phase. Oil-water phase inversion is defined as the transition where an oil-water dispersion interchanges its dispersed and continuous phases, adapting a new morphology. Depending on which is the continuous phase, the hydrodynamics of the oil-water flow changes. Among the most important effects is the change in the dispersion pressure gradient, as reported by several authors (Trallero, 1995, Soleimani, 1999 and Lovick, 004)..1 Literature Review Extensive literature reviews on oil-water flow in pipes can be found in Trallero (1995), Angeli (1996), Lovick (004) and Torres (006). Following is a brief summary of studies on pertinent topics. 5
20 .1.1 Oil-Water Flow Patterns The interest of studying different flow patterns in liquid-liquid systems stems from the fact that each flow pattern has unique hydrodynamic flow characteristics. Due to the large amount of different test fluids used in experimental liquid-liquid studies in the past, it is difficult to generalize flow pattern definitions and their transition boundaries, as well as mixture properties. Trallero (1995) attempted to standardize oil-water flow patterns classification, inspired by previous works. He also developed a mechanistic model for the prediction of the transition boundaries among the different flow patterns for horizontal flows. The classification proposed includes the following flow patterns (see Figure.1): Stratified flow (ST). In this flow pattern the two liquid phases flow as layers with the heavier, usually water, at the bottom and the lighter (usually oil) at the top. Some waviness can be observed at the interface. Stratified flow with mixing at the interface (ST & MI). For this case the system tends to be stratified, but interface instability generates a mixing zone. The mixing zone at the interface can be significant, but still pure fluids exist at the top and the bottom of the pipe. Dispersion of oil in water with a water layer (D O/W & W). The water is distributed across the entire cross-sectional area of the pipe. A layer of clean water flows at the bottom and dispersed droplets of oil in water flow at the top. Dispersion of oil in water (D O/W). For this flow pattern, the entire pipe crosssectional area is occupied by water containing dispersed oil droplets. 6
21 Dispersion of water in oil (D W/O). The oil is the continuous-phase and the water is present as droplets across the entire pipe cross-sectional area. Dual dispersion (D O/W & W/O). Two different layers occur in this flow pattern. Both phases are present across the entire cross-sectional area of the pipe, but at the top the continuous-phase is oil, containing droplets of water. In the lower region of the pipe, the continuous phase is water and the oil exists as dispersed droplets. The experimental oil-water flow pattern map for horizontal pipes presented by Trallero (1995) is given in Figure.. Stratified flow (ST) Dispersion of oil in water (D O/W) Stratified flow with mixing at the interface (ST & MI) Dual dispersion (D O/W & W/O) Dispersion of oil in water and water (D O/W & W) Dispersion of water in oil (D W/O) Figure.1. Oil-Water Flow Patterns 7
22 10.00 ST ST & MI U SW (m/s) 1.00 D O/W & W D O/W 0.10 D O/W & W/O D W/O U SO (m/s) Figure.. Experimental Oil-Water Flow Pattern Map (Trallero, 1995) Flow Pattern Experimental Studies: A summary of pertinent published data for horizontal oil-water flow was presented by Torres (006). Trallero (1995) and Valle (000) presented a comprehensive overview of previously published data sets, as well. Most of the early research on flow patterns for liquid-liquid systems was done via visual observation. Some studies have used inlet devices such as cones or special Y to promote stratification of the flow and avoid mixing of the phases. On the other hand, other studies have promoted mixing at the inlet utilizing static mixers. The inlet device and entrance length are critical parameters assuring fully developed flow conditions, which are necessary requirements for such studies. 8
23 Identification of the different flow patterns for oil-water flow can be done in several ways. Most of the research conducted in the 1950s and 1960s identified the flow patterns visually and/or according to variations in pressure drop measurements. More recent studies during the 1990s have used additional tools, such as conductivity probes or sampling tubes. The studies carried out during the last six years have combined the previous techniques with gamma densitometer devices for the detection of flow patterns Effects of Inlet Design and Wetting Properties: The geometry and shape of the inlet of the test section can have a significant effect on the flow pattern. Authors such as Angeli (1996) and Soleimani (1999) investigated the effect of inlet design on the occurring flow patterns of two immiscible liquids in a horizontal pipe. They reported that different inlet devices, such as static mixers or nozzle configurations can influence the pattern and pressure gradient. This phenomenon can be related to different droplet size distributions generated in the oil-water dispersion flow. The droplet size distribution for liquid-liquid systems is a function of the fluid properties, pipe configuration and pipe length (flow history), as discussed by various researchers (Hinze, 1955; Kubie and Gardner, 1977; Angeli and Hewitt, 000a; and Torres, 006). The effect of the wetting properties of the pipe can be important if the density difference between the two liquids is relatively low. The degree of wetting of the wall surface depends on the wall material, and the history and dynamics of the liquid motion close to the pipe surface. This can have a significant effect on the flow pattern, as the liquid with higher wetting properties can spread around the surface of the pipe (Angeli, 1996; and Angeli and Hewitt, 000b). 9
24 Effects of Oil and Water Superficial Velocities: Trallero (1995) described the oil-water flow patterns formation mechanisms in horizontal pipelines as follows (refer to Figure.). For low superficial oil and water velocities the flow is gravity dominated and the phases are segregated (stratified flow). An increase in the flow rates causes the appearance of interfacial waves that initially are long, as compared to the pipe diameter. The reported wave lengths for these conditions are roughly twice the pipe diameter. Along the wavy interface there exist water droplets in the oil layer and oil droplets in the water layer. Both kinds of droplets remain close to the interface due to the settling tendency of the counteracting gravity force. The dynamic and turbulent dispersion forces acting simultaneously on the droplets tend to disperse the droplets throughout the pipe cross-sectional area, but the forces are not large enough to overcome the settling tendency. Outside the stratified region, the flow patterns are combination of different types of dispersions. Dispersions will always form when the motions of two immiscible liquids are sufficiently intense. For that, sufficiently high velocities at least in one of the phases are required. Usually the continuous phase is the one required to achieve high velocities to maintain the other phase dispersed. There are conditions under which an oil continuous dispersion will change to a water continuous dispersion or vice versa; this phenomenon is called phase inversion. Dispersions can be considered as a homogeneous mixture only at sufficiently high mixture velocities, where the droplets are fully dispersed. Thus, the oil and water continuous dispersions may have a vertical concentration gradient for the case of horizontal flow. 10
25 For high water volume fractions (larger water superficial velocity relative to oil velocity) the flow is generally water continuous. Water vortices appearing at the interface enter the oil layer and tend to disperse it. The presence of the water layer induces an early transition to turbulent flow in the oil layer, as observed by Russell et al. (1959) and Guzhov et al. (1973). The oil layer loses its continuity and moves as discrete particles separated by the water continuous phase. Charles et al. (1961) and Guzhov et al. (1973) observed that the forward edge of the oil bodies is bent downward, probably by the action of the clockwise eddies. In the water region, the turbulent energy due to the high water superficial velocity has a tendency to distribute larger oil droplets along the crosssectional area of the pipe. However, the upward buoyancy prevails and a dispersion of oil in water over water layer is developed. With further increase of the water superficial velocity, the frequency and intensity of water vortices increase, and more and smaller oil droplets are formed. Under these conditions, the dispersed oil in water flow pattern is formed. On the other hand, oil is the continuous phase for small water volume fractions (high oil superficial velocity relative to water velocity). The interfacial mixing region increases with an increase in velocity and two dispersions may coexist, namely, dispersion of oil in water and dispersion of water in oil. The dual dispersion occupies most of the pipe cross-sectional area, though for the lowest superficial velocities in this region, a thin water layer is developed at the bottom. The oil-phase is almost completely populated by the water droplets. The water droplets are larger than the oil droplets. The turbulent fluctuations that cause droplet breakage are smaller in the oil continuous zone, and the oil droplets are bigger as compared to water continuous flow (Hinze, 1955). 11
26 Transition to Dispersed Flow Modeling: Only few published studies deal with the modeling of oil-water flow pattern transitions. In these studies, the two main techniques applied for the prediction of oil-water flow pattern transitions are: 1) linear stability analysis for the stratified non-stratified transition, and, ) turbulent dispersion mechanism for the transition to dispersed flow. In the present study only the transition to dispersed flow is considered, and details for the other transitions can be found in Torres (006). Predictions of the transition boundaries to dispersed flow in gas-liquid and liquidliquid systems have been carried out in most of the published studies based on the modeling of the turbulent dispersion forces balanced against the surface tension and buoyancy forces. For horizontal and slightly inclined gas-liquid pipe flow, Taitel and Dukler (1976) modeled the dispersed-bubble transition boundary by equating the turbulent breakage forces with the buoyant forces tending to keep the gas at the top of the pipe. For vertical and off-vertical inclined gas-liquid systems, Taitel et al. (1980) and Barnea et al. (198a, 198b) suggested that the transition mechanism to dispersed-bubble flow occurs when the turbulence intensity in the liquid-phase is sufficiently high: 1) to overcome the surface tension forces, which resist deformation and breakup of droplets (Hinze, 1955); and, ) to disperse the gas-phase as small and stable spherical bubbles (Brodkey, 1969). Barnea (1987) included the effect of buoyant forces in horizontal and shallow inclinations in the analysis and presented a unified transition boundary including both the surface tension and buoyant forces vs. turbulence forces. Recently, Chen et al. (1997) proposed a 1
27 model which considers the balance between the liquid turbulent kinetic energy and surface energy of the bubbles as a criterion for transition to dispersed-bubble flow. Trallero (1995) presented preliminary models for the prediction of the transition boundary to dispersed flow in liquid-liquid systems. Recently, Brauner (001) developed a general approach for the prediction of dispersed flow boundaries in gas-liquid and liquid-liquid flows. Torres (006) applied the Hinze (1955) model for both dilute and dense dispersed flow for the prediction of the transition to dispersed flow in liquid-liquid pipe flow..1. Coalescence and Break-up Models The flow of an oil-water mixture under turbulent conditions produces fluctuations, which make the dispersed phase (droplets) move with different trajectories and velocities with respect to each other. This relative motion of the droplets may result in collisions. Depending on the conditions for which a collision occurs, different outcomes may take place. A collision of one droplet against another may result in breakup of one of the droplets into two or more droplets called daughter droplets. If the collision is not strong enough, it may result either in rebound or in coalescence. In order for a pair of droplets to coalesce and form one bigger droplet, the contact time between the two droplets during the collision must be large enough to overcome the coalescence time characteristic for that particular pair of droplets Coalescence Frequency Models: Coalescence is one of the processes that controls particle size. Modeling of particle agglomerations incorporates both the collision 13
28 and coalescence mechanisms. Collisions are caused by the existence of spatial velocity differences among the particles. A collision does not necessary lead to coalescence. Different mathematical and empirical models are available in the literature to quantify this phenomenon, as presented next. Prince and Blanch (1990) proposed a model for bubble coalescence considering collisions due to turbulence, buoyancy and laminar shear. They also presented an analysis of collisions coalescence efficiency. Kolev (1993) considered turbulence induced coagulation by means of oscillatory coalescence, spectral coalescence and non-oscillatory coalescence. Lee et al. (1987) proposed a model for predicting binary coalescence frequency as a function of continuous phase viscosity, interfacial tension, particle diameter and turbulent energy dissipation rate. Gomez (001) modified the model proposed by Prince and Blanch (1990) by using a different coalescence time approach, adding also the effect of the film rupturing process, as proposed by Ruckenstein and Jain (1974)..1.. Break-up Frequency Models: There are different processes leading to disintegration of a continuum and the formation of dispersed particles, and processes leading to the disintegration of unstable droplets and the formation of finer particles. Some models for break-up rate are given below. Prince and Blanch (1990) analyzed particle interactions with turbulent eddies. Luo and Svendsen (1996) developed a model based on theories of isotropic turbulence and probability. 14
29 Lee et al. (1987) proposed a model based on probabilistic theory predicting breakage frequency as a function of the continuous phase density, interfacial tension, particle diameter and turbulent energy dissipation rate. Gomez (001) applied the model proposed by Luo and Svendsen (1996) for a fixed breakage volume fraction and calculated the particle size for which the coalescence and break-up frequencies reach equilibrium. The coalescence and break-up frequency models have in common many strengths and weaknesses. They both allow the study of droplets coalescing and breaking-up considering the nature of the collisions of droplets with each other and their interaction with turbulent eddies. However, these models were developed assuming the particles behavior is such as in dilute flow. Additionally only binary coalescence and break-up is considered limiting their use for particular applications where this assumption may fail. Although the overall performance of these models shows their ability to capture the nature of turbulent dispersions, discretion is recommended while using their results..1.3 Daughter Particle Size Distribution Various models for breakage rate require a predefined daughter particle size distribution. Some authors have compared different daughter particle size distributions including equal volume breakage, random breakage and others (Hesketh et al., 1991). Experimental observations have shown that equal-sized breakage has the lowest breakage probability, while the probability increases when the daughter particle sizes difference increases. Following are two of the most relevant references. 15
30 Luo and Svendsen (1996) developed a model based on theories of isotropic turbulence and probability. Lasheras et al. (00) considered surface energy models based on eddy collisions and surface energy models to analyze stress balances, including the one developed by Martinez-Bazan et al. (1999)..1.4 Droplet Number Population Balance The term population balance refers to a droplet size accounting procedure that conserves the total mass of all droplets, as the size and number of droplets change through coalescence and break-up. In order to study a population of droplets using a population balance approach, models for coalescence and break-up probabilities and a daughter particle size distribution model must be defined. Several authors, including Coulaloglou and Tavlarides (1977), Tsouris and Tavlarides (1994) and Lasheras et al. (00), have used the droplet population balance concept in order to describe dispersions. The homogeneous models assume the dispersion properties to be uniform throughout the volume of the system. These models adequately describe the dispersion when the coalescence frequency of the dispersed phase is very low relative to the circulation frequency of the dispersion in the system. It should be pointed out that statistically homogeneity of a volume does not necessarily mean that the turbulence and energy dissipation are distributed homogeneously. The breakage and coalescence frequencies determine the state of the particle size distribution. These frequencies are assumed to be independent of the droplet age. Let A ( v t) dv, represent the number fraction of droplets of volume v to v+dv at time t, and 16
31 N(t) the total number of droplets in the system at time t. Then, the following droplet population balance must be satisfied: t [ N() t A( v, t) ] = B ( v, t) D ( v t) i e,.. (.1) where B i (v,t) is the birth rate, D e (v,t) is the death rate, v is the droplet volume, v is the volume of a second droplet and operates as an integration variable, t is time and Bi + D ( v, t) = β ( v', v) ν ( v' ) g( v' ) N( t) A( v', t) v e 0 + N λ vmax v dv' ( v v', v) ω( v v', v' ) N( t) A( v v', t) N() t A( v', t) dv' + n () t A ( v, t) ( v, t) g( v) N( t) A( v, t) + N( t) A( v, t) λ( v, v' ) ω( v, v' ) N( t) A( v', t) () t A( v, t) f ( v) vmax v = dv'.. (.)... (.3) Both the birth rate and the death rate are dependant on contributions owing to coalescence and break-up effects and are functions of their respective frequencies, droplet size distribution, turbulent energy dissipation rate and fluid properties of the phases. Eq.. accounts for the birth of droplets due to coalescence and break-up. The first term includes the effects of break-up, the second term includes the birth due to coalescence and the last term includes additional droplets that could be introduced into the control volume. Eq..3 accounts for those droplets destroyed by break-up (first term), those combined during coalescence (second term), and those that could escape the control volume (included in the last term). 17
32 .1.5 Phase Inversion Phase inversion is the phenomenon where the phases of a liquid-liquid dispersion interchange such that the dispersed phase inverts spontaneously to become the continuous phase and vice versa. Phase inversion is determined by the fluid properties, phase volume ratio and energy input. By definition, the phase inversion point is the holdup of the dispersed phase at which the inversion occurs. Once the inversion point conditions are reached, any infinitesimal change in fluid properties, phase volume ratio or energy input results in phase inversion. Different authors have studied phase inversion in liquid-liquid dispersions. Among them, Yeo et al. (00a) who compared the results of a model based on the approach given by Tidhar et al. (1986) against experimental data from other authors. Yeo et al. (00b) studied phase inversion under the influence of the Marangoni effect. Ioannou et al. (004) conducted experiments to study dispersed flow of two immiscible liquids and compared the results with the predictions of a model based on a population balance. Many of the models developed for dispersed flow transitions mentioned previously, such as Brauner (001) and Brauner and Ullmann (00), are based on the assumption that the surface energy of the dispersed phase is proportional to the turbulent energy supply provided by the continuous phase. As mentioned by Yeo et al. (00a), several studies have suggested that minimization of the total system energy content occurs at the inversion point. Based on the study by Yeo et al. (00a), the minimization of the total system energy is due mainly to the minimization of the interfacial energy which directly related to the droplet size distribution of the dispersion before inversion. 18
33 The interfacial energy balance can be written following Tidhar et al. (1986) and Yeo et al. (00a) as E w/ o + Eo / s = Eo / w + Ew/ s.... (.4) The water in oil interfacial energy (E w/o ) and the oil in water interfacial energy (E o/w ) have been characterized by various authors in terms of the average droplet diameter or Sauter mean diameter (d 3 ). Expressing Eq..4 in terms of interfacial surface energy per unit volume results in Eq..5, where the contribution to the interfacial energy due to the contact between the oil phase and a solid surface (E o/s ) and the interfacial energy due to the contact between the water phase and a solid surface (E w/s ) have been expressed in terms of the ratio of surface area (S) to volume (V). 6 σ o / w (1 φo ) S σ o / s 6 σ o / w φo S σ w/ s + = + d3 V d3 V w / o o / w... (.5). Modeling Phase Inversion in Turbulent Oil-Water Dispersions based on Coalescence and Break-up Processes In this section, the models used, the procedure followed and the proposed approach to predict phase inversion in turbulent oil-water dispersions are presented...1 Coalescence and Break-up Frequency Models The coalescence and break-up frequency models presented in the literature review have consistent trends with respect to droplet size, energy dissipation and fluid properties. However, they differ in the actual values of these frequencies, due to different assumptions and different approaches used to model each phenomenon. In some 19
34 publications (Lasheras et al., 00) the results of these models are presented and compared using a dimensionless frequency. This is owing to expressing the coalescence and break-up frequencies divided by their respective maximum values. The following results are based on the Prince and Blanch (1990) model. Although the other models produced similar results, the Prince and Blanch (1990) model presented an advantage in computational time, as compared to the other models, making it a better choice, given the number of calculations required while using population balance and interfacial energy balance Coalescence Frequency Model: The coalescence model presented by Prince and Blanch (1990) is based on bubble and droplet collisions due to the fluctuating turbulent velocity of the continuous phase. A general expression for the coalescence rate of two droplets is given by: F C ( d1, d ) = ω( d1, d ) λ( d1, d ) = ω ( d1, d ) exp( tc / τ ) (.6) where ω(d 1, d ) is the total collision frequency resulting from turbulent motion and buoyant collision rate, λ(d 1, d ) is the coalescence efficiency, t C is the time required for coalescence of droplets of diameter d 1 and d, while τ is the contact time for the two droplets. As discussed by Lee et al. (1987) and Prince and Blanch (1990), for coalescence of two droplets to occur in a turbulent field, the droplets must first collide, trapping small amount of liquid between them, and then remain in contact for sufficient time in order for coalescence to occur through the process of film drainage, reaching a critical film rupture thickness. However, turbulent velocity fluctuations may meanwhile deliver sufficient energy to separate the two droplets before coalescence may occur. Collisions occur due to 0
35 variety of mechanisms. The two mechanisms considered in this study are collisions due to turbulence, ω t (d 1, d ) and due to buoyancy, ω b (d 1, d ), namely, ω d, d ) = ω t ( d, d ) + ω ( d, ) (.7) ( 1 1 b 1 d The primary cause of droplet collision is the fluctuating turbulent velocity of the continuous-phase. The coalescence frequency depends upon the turbulent fluctuations. Thus, collision takes place by a mechanism analogous to particle collisions in an ideal gas. The equation given below (Prince and Blanch, 1990) is used to simulate the turbulent collisions: 1/ 3 / 3 / 3 1/ t ( d1, d ) = 0.089π n1 n ( d1 + d ) ε ( d1 + d ) ω.. (.8) where n N() t A( v, t)v = is the droplet concentration per unit volume for a droplet of () t v A( v, t) volume v and diameter d and the condition N = φ V must be satisfied. Droplet collisions may also occur from each droplet rise velocity, and is given by the expression based on droplet rise velocity, as follows: ω d, d ) = n n S ( u u ) (.9) b ( rise,1 rise, where the bubble rise velocity is i i i d.14σ urise, i = g di ρc di (.10) and S 1 π d = 4 1 d (.11) 1
36 In the present study Eq..10, originally developed for gas-liquid flow, is used as an approximation for liquid-liquid flow. Further studies are needed to confirm the validity of this assumption for this model. In order to determine whether a given collision will result in coalescence, it is necessary to compute the collision efficiency. Coalescence of two droplets may occur if they remain in contact for a sufficient period of time for the liquid film to thin and reach the critical thickness necessary for rupture. This process can be modified if the contact time is artificially increased by adding surfactant to the dispersion. Prince and Blanch (1990) obtained the following expression for calculating the coalescence time: t C 3 r ρ = c 16σ 1/ h ln h 0 f.... (.1) where h 0 and h f are the initial and final film thickness, respectively. Experimental investigations suggest values of 5 h = 1 m and 0 10 h f = m. The equivalent radius, r, is defined by 1 r 1 = + d1 d.... (.13) The mean contact time of two droplets depends on the droplet size and the turbulent intensity. High levels of turbulence increase the probability that an eddy will separate the droplets, reducing the contact time, while large contact area will increase the contact time. The expression for droplet contact time in turbulent flow used by Prince and Blanch (1990) is given by: / 3 r 1/3 τ =.. (.14) ε
37 Substituting Eqs..7 through.13 into Eq..6, one can obtain the final coalescence rate or coalescence frequency equation for a single pair of droplets, namely, F t = ( + ) C d1, d ) ωt ( d1, d ) ωb ( d1, d ) exp... (.15) τ C (..1. Break-up Frequency Model: The break-up model presented by Prince and Blanch (1990) considers the interaction of droplets with the turbulent eddies. A general expression for the break-up rate for a single droplet with diameter d i is given by g ( di ) = θ ie F( u).... (.16) e The break-up frequency is defined as the summation of the interactions between the turbulent eddies and the droplets. The break-up frequency considers the collision rate θ ie and the break-up efficiency F(u), as shown in Eq..16. Both terms are defined below. ti 1/ θ = n n S ( u + ute ) (.17) ie i e ie which is equivalent to Eq..8 replacing one of the droplets by an eddie. The turbulent velocity u t in the inertial subrange of isotropic turbulence is defined as follows: u t = 1.4 ε d.... (.18) The break-up efficiency is given by ucr, i F ( u) = exp (.19) ut, e where u cr is the critical velocity for break-up. Using the correction given by Lasheras et al. (00) this velocity is defined as: ucr σ = (.0) ρc d 3
38 Figure.3 demonstrates the prediction of the models proposed by Prince and Blanch (1990) for coalescence and break-up dimensionless frequencies. These models are a function not only of the droplet size but also of the fluid properties and turbulent dissipation energy. 1.0 Frequency / unit volum Frequency / unit ( ) volume ( ) Coalescence Break-up Particle size (microns) Figure.3. Coalescence and Break-Up Probabilities vs. Droplet Size Predicted by Prince and Blanch (1990) Model.. Daughter Particle Size Distribution An expression for the breakup rate is developed based on the theories of isotropic turbulence and probability by Luo and Svendsen (1996), which is given below d g( v : v f BV, λ ) = PB ( v : vf BV, λ) & ωb, λ ( v) dλ (.1) λ min In Eq..1, f BV is the breakage volume fraction or fraction of the original droplet volume given to one of the daughter particles; P ( v :, λ) is the probability for a B vf BV particle of size v to break into two particles, one with size (volume) v f BV and other 4
39 with size v ( ) 1, when the particle is hit by an arriving eddy of size λ; and ω& ( ) f BV B, λ v is the arrival (bombarding) frequency of eddies of size (length scale) between λ and λ + dλ. In a turbulent field, the fluctuation of the relative velocity on the surface of a droplet is caused by the arrival of similar eddies, λ, of a spectrum of length scales. The inertial sub-range of the isotropic turbulent energy spectrum, E(π/λ) α ε /3 (π/λ) -5/3, is used to define the mean turbulent velocity or collision frequency of eddies of size λ (eddies in this region have no intrinsic velocity or length scale). For a particular eddy hitting a droplet, the probability for droplet breakage depends not only on the energy contained in the arriving eddy, but also on the minimum energy required by the surface area increase due to particle fragmentation. The breakup frequency function of particles of size v or d into particles of sizes v and v 1 f ) is given below (Luo and Svendsen, 1996): f BV ( BV g( v : v f BV ) = (1 φ ) n 0.93 d ε d 1/ 3 1 ξ min (1 + ξ ) ξ 11/ 3 1 c f σ exp / 3 5 /.0 ρ ε d c 3 ξ 11/ 3.. (.) dξ where λ ξ =, d λ = min μc 3 ρc ε 1/ 4 3 = BV BV 3 and c f + (1 f ) (.3) f The total breakage rate of particles of size v or d is expressed as 1 1 g ( v) = g( v : vf ) 0 BV df BV (.4) 5
40 For a continuous daughter particle size distribution, β ( v : v ) dv 1 1 represents the fraction of particles of size v that break into particles of size between v 1 and v 1 + dv 1. The model presented by Luo and Svendsen (1996) predicts for a continuous breakage volume fraction f BV, the rate g v : v f ) at which particles of size v or d break into particles of ( BV size between v 1 and v 1 + dv 1 (v 1= v f BV ). According to the definition, the daughter particle size distribution is given by where 1 (1 + ξ ) exp( χ ) 11/ 3 c dξ ξ min ξ β ( v : vfbv ) =.. (.5) 1 1 (1 + ξ ) v exp( χ ) 0 11/ 3 c dξ df ξ BV min ξ χ c 1 c f σ =.. (.6) / 3 5 / 3 11/ 3.0 ρc ε d ξ Figure.4 shows the probability of breakage, based on the model proposed by Luo and Svendsen (1996), as a function of the volume fraction of the daughter droplets formed. This figure shows one of the most important assumptions of this model, which is the prediction of equal breakage as the least probable break-up form. Breaking a droplet into equal size daughter droplets would require the highest amount of energy since it would require creating more surface area per unit volume. 6
41 Daughter particle size distribution ( ) Breakage volume fraction f BV Figure.4. Daughter Particle Size Probability Distribution Prediction by Luo and Svendsen (1996) Model..3 Droplet Number Population Balance Once the coalescence and break-up probabilities and the daughter particle size models are selected, these can be used together into the population balance to study the resulting droplet size distributions. The population balance allows the study of the interaction between all selected droplet sizes and the effect of the coalescence and breakup models. In this case, the initial droplet size distribution is affected not only by the fluid properties but also by the turbulent dissipation energy as shown in Figure.5. This figure presents the results of solving the population balance under steady-state condition. As can be seen, increasing the turbulent dissipation energy value reduces the fraction of larger droplets and increases the fraction of smaller ones. 7
42 A (number fraction) A0 ( ) 4 m/s3 3 m/s3 m/s3 1 m/s Particle size (microns) Figure.5. Steady-State Population Balance Solution for Particle Size Distribution as a Function of Turbulent Dissipation Energy In many applications steady-state conditions can not be obtained. For these cases a transient solution for the population balance must be applied. Figure.6 and Figure.7 show the solution of the population balance for a constant dissipation energy value ε = 1.5 m /s 3 during 600 seconds for a given initial droplet size distribution. 8
43 A (number (number fraction) s 0 s Particle size (microns) time (s) Figure.6. Transient Population Balance Solution for Particle Size Distribution as a Function of Time AC AC (cumulative number fraction) s 0 s Particle size (microns) time (s) Figure.7. Transient Population Balance Solution for Particle Size Distribution as a Function of Time (Cumulative Distribution) 9
44 ..4 Phase Inversion Based on the same principles presented by Tidhar et al. (1986) and Yeo et al. (00a), the criterion used in this study is to predict phase inversion based on minimizing the system interfacial energy. Many authors have used predictions for a maximum or average droplet size based on the theory developed by Hinze (1955). Instead, it is proposed to use the contribution of each fraction of the resulting droplet size distribution generated by the population balance to the system interfacial energy. By doing this, the prediction of phase inversion is linked to the coalescence and break-up phenomena and how these are affected by turbulence. Additionally, if effects such as the presence of surfactants are properly addressed in the coalescence and break-up models, this approach has the capability to be used to analyze phase inversion under such circumstances. Utilization of a population balance and the models for droplet coalescence and break-up allows the study of droplet size distributions. Thus, it is proposed to use all the information obtained from the population balance solution by taking into account the contributions to the system interfacial energy of each one of the different droplet sizes that belongs to the distribution. This approach, summarized in Eqs..7 and.8, is a modification of the interfacial energy balance used by Tidhar et al. (1986). It includes the relative contribution of each droplet given its size and fraction of the total amount of droplets in the distribution. In this study it is assumed i = j for Eq..8. E w/ o Eo / s = Eo / w + Ew/ s (.7) i 6 σ o / w(1 φo ) S σ S A() o / s 6 σ o / w φo σ v A() w / s + = v +... (.8) di V d j V w / o j o / w 30
45 In this study, the cases analyzed using the population balance and interfacial energy balance to predict phase inversion are pipe flow and static mixers. In order to be able to use the coalescence and break-up models in the population balance, it is required to convert the operational conditions of each application in terms of turbulent dissipation energy. For both cases the approach utilized by Brauner (001) to obtain turbulent dissipation energy is used, namely, ρm Uc ε = fc ρ (1 φ ) D c d (.9) Another important aspect to be defined before solving the population balance is the droplet size range where the distribution discretization is performed. Following a similar approach used by Tsouris and Tavlarides (1994) and Brauner (001), the range is defined between the Kolmogorov microscale and maximum droplet size based on the criterion developed by Hinze (1955). Eqs..30 and.31 show the smallest length scale and maximum droplet size, respectively μ l = c K (.30) 3 ρc ε ρ c d max = ( ε )... (.31) σ..4.1 Energy Dissipation in Static Mixers: Various authors predicted the turbulent dissipation energy in a similar way to the frictional pressure drop expression used in pipe flow. This was carried out by applying the hydraulic diameter concept and 31
46 considering the mixing elements geometry, as presented by Brauner and Ullmann (00), namely, ρm U ε = fc ρ (1 φ ) D c d 3 c h (.3) Some investigators have tried to extend the assumptions used for single-phase turbulent flow, in order to obtain the turbulent dissipation energy for dense flow. Farrar and Brunn (1996) and Wang et al. (1990), among others, tried to obtain the turbulent energy spectrum under different two-phase pipe flow conditions from experimental data. Their main conclusion is that the energy spectrums of single-phase and two-phase flow are different, introducing an additional uncertainty in the prediction of the turbulent dissipation energy for the latter case. As a first attempt, a very simple semi-empirical approach is used to solve this problem. An additional correction factor is introduced to the turbulent dissipation energy, function of the mean droplet size diameter, as given in Eq..33. In this equation, the constant C is an adjustable empirical parameter, which for the experimental data analyzed corresponded to a value close to % of the static mixer hydraulic diameter. However, since it is required to know the turbulent dissipation energy in order to use the coalescence and break-up models and then obtain the resulting distribution, an iterative calculation procedure is required to obtain both solutions for the droplet size distribution and the turbulent energy dissipation. ε corr = ε C d (.33) 3
47 .3 Comparison Between Model Predictions and Experimental Data This section presents comparisons between the predictions of the model described in the previous section and experimental data available in the literature for phase inversion of oil-water dispersions for pipe flow and static mixers..3.1 Phase Inversion in Pipe Flow One of the most referred experimental data for oil-water flow patterns available in the literature is Trallero (1995). Table.1 summarizes the main aspects of these experimental data, such as fluid properties and pipe geometry. Figure.8 presents the results of the phase inversion model using the predictions from the steady-state population balance and the interfacial energy balance for the pipe flow case. In this figure the results of the model are compared to those obtained by Torres (006) flow pattern prediction model and the experimental data acquired by Trallero (1995). Only the portion of the data relevant to the transition to dispersed flow of oil in water and to water in oil dispersion is shown in order to simplify the figure. As can be seen, a good agreement exists between the proposed model and the experimental data. Table.1. Fluid Properties and Geometry for Experimental Data from Trallero (1995) Oil Density g/cm 3 Oil Viscosity 8.8 c.p. Water Density g/cm 3 Water Viscosity 0.97 c.p. Surface Tension 36 dyn/cm Pipe Diameter 5.01 cm 33
48 D O/W D O/W & W Trallero (1995) D O/W Trallero (1995) D O/W & W/O Trallero (1995) U SW (m/s) 0.10 DW/O D W/O Trallero (1995) Transition to D O/W Torres (006) Transition to D W/O Torres (006) Transition to D O/W This Study U SO (m/s) Transition to D W/O This Study Figure.8. Comparison between Phase Inversion Model Predictions for Pipe Flow and Trallero s (1995) Experimental Data The use of a population balance and the interfacial energy balance proves that it is possible to utilize the small-scale phenomena occurring while the droplet coalescence and break-up processes interact with the turbulent field, for the analysis of liquid-liquid dispersion phenomena that can be measured in large scale (dispersed flow pattern transition in pipe flow). Nevertheless, the suggested procedure is more complex than other models available for the prediction of the dispersed flow transition in liquid-liquid systems. However, the previous models are not capable to predict how this transition is modified when the flow is in the developing region (fully developed conditions not ensured). Additionally, the proposed model allows the analysis of the effect of the inlet 34
49 design and how the two liquids are mixed in different facilities (initial droplet size distribution). The results shown with this model are the solution of the steady-state population balance. However, if the population balance is solved in its transient form, it is easy to obtain results for different locations along the developing region..3. Phase Inversion in Static Mixers The results of the proposed phase inversion model in static mixers are shown in Figure.9. The model is compared against experimental data from Tidhar et al. (1986) who tested two different kinds of mixers (SS-316 and Teflon surfaces) with different liquid-liquid systems. Table. summarizes the main aspects of the experimental data for the kerosene-water system, including fluid properties and mixers geometry. Very good agreement is observed between the experimental results and model predictions, especially while using Eq..33 to correct the energy dissipation. The model captures the boundaries that separate the water in oil dispersion (D W/O) and oil in water dispersion (D O/W) zones from the ambivalent zone, in which hysteresis between D O/W and D W/O occurs. 35
50 Table.. Fluid Properties and Geometry for Experimental Data from Tidhar et al. (1986) Kerosene Density 0.77 g/cm 3 Kerosene Viscosity c.p. Water Density 1.0 g/cm 3 Water Viscosity 1.0 c.p. Surface Tension 9 dyn/cm Static Mixers Hydraulic Diameter 0.5 cm Static mixers void fraction 0.87 Mixer Tube Diameter.3 cm Contact angle (SS316) 56 deg Contact angle (Teflon) 157 deg ( ) Organic phase volume fraction ( D W/O or D O/W D W/O D O/W Mixture velocity (m/s) D W/O SS-316 Tidhar et al. (1986) D O/W SS-316 Tidhar et al. (1986) D W/O Teflon Tidhar et al. (1986) D O/W Teflon Tidhar et al. (1986) Transition to D W/O This Study (Eq..33) Transition to D O/W This Study (Eq..33) Transition to D W/O This Study (Eq..3) Transition to D O/W This Study (Eq..3) Figure.9. Comparison between Phase Inversion Model Predictions for a Static Mixer and Tidhar et al. (1986) Experimental Data After introducing a simple correlation in order to include the effect of the droplet size distribution on the turbulent dissipation energy in static mixers (Eq..33), it is clear 36
51 that the results obtained for the static mixer show the importance of conducting further studies on the prediction of turbulent dissipation energy, especially for dense flow systems. The proposed model can help to extrapolate results obtained in a laboratory under particular mixing conditions to applications in the field where the mixing and operational conditions can vary. 37
52 CHAPTER 3 DROPLET-DROPLET INTERACTION Many applications in the oil industry require a detailed study of the small-scale phenomena in order to be able to understand the large-scale behavior. The applications where small-scale analysis is required include liquid-liquid dispersions and emulsions systems. Also, applications such as electrostatic coalescers, gravity separators and batch separators, where either the droplets are charged or the presence of surfactants and other additives modify the system behavior, require interfacial phenomena analysis for a proper design. A literature review reveals that different authors have covered different factors and various approaches necessary for the understanding of the interfacial phenomena. Some authors have studied the thin liquid film occurring between droplets. Among them are Ivanov et al. (1970) and Radoev et al. (1983) who studied the critical thickness of a thin liquid film through the concept of spontaneous growth of the surface fluctuational waves at the critical state. Hofman and Stein (1991) studied the destabilization of emulsions through deformation of the droplets. A more sophisticated study of droplet deformation and the interaction energy between droplets was presented by Ivanov et al. (1999). In this study the interaction energy between droplets is analyzed through the thermodynamic aspects of droplet deformation. Using this approach, effects such as 38
53 interfacial deformation and surface forces can be studied separately in order to obtain the total interaction energy of a system under particular conditions. The electrostatic coalescer is a good example of one of the applications where droplet-droplet interaction modeling is required in order to predict coalescing performance. This device modifies the droplet size distribution of a water in oil dispersion by inducing coalescence events through an external electrical field, accelerating the regular coalescence rate obtained with only the gravitational field. 3.1 Literature Review Thermodynamic Aspects of Droplet Deformation Coalescence and flocculation in emulsions and dispersions have been studied utilizing different droplet scales. Large droplets studies consider the hydrodynamics of the film formed between the two colliding droplets but neglect the effect of the spherical parts of the droplets. Ivanov et al. (1999) found that for smaller droplets (micron-size droplets) the effect of the spherical part can be as important as the flat area between them. The study of the hydrodynamic aspects of large droplets can be found in many references in the literature, including Chesters (1991). However, most droplet hydrodynamic studies neglect the thermodynamic aspects of droplet deformation for micron-size droplets as given below. Among the mechanisms identified involving droplet-droplet interaction, thin liquid film is one of the most important. Ivanov et al. (1999) analyzed the relative importance of droplet deformation, surfactant transfer and interfacial rheology for the stability of emulsions and their properties. The appearance of deformation (flattening or 39
54 film) in the zone of contact of two interacting droplets results in the following consequences: It enhances the surface forces of intermolecular origin and gives rise to contributions from the interfacial dilatation and the bending energy (energy required to modify the droplet curvature). The flattening increases the viscous dissipation in the gap between two colliding droplets and, thus, prolongs the lifetime of the doublet of two such droplets. The critical thickness of the gap also depends on whether the droplets are deformed or non-deformed. The factors which facilitate the flattening in the zone of contact between two emulsion droplets are the increase in droplet size, the decrease in interfacial tension, the bending energy for water-in-oil emulsions, the increase in droplet droplet attraction and the suppression of droplet droplet repulsion. The presence of surfactant strongly affects the interfacial tension, the bending moment, and influences different Derjaguin-Landau- Verwey-Overbeek (DLVO) and non-dlvo surface forces, operating in the gap between two droplets. The DLVO theory (named after those who proposed it) was developed based on the study of the competing electrical repulsive forces and Van der Waals attractive forces. Other surface forces discovered later are called non-dlvo surface forces Energy of Interaction between Two Deformable Droplets: As described by Ivanov et al. (1999), deformation of a droplet at a fixed volume leads to an expansion of the droplet area. Also, the flattening of the droplets surfaces in the zone of their contact (see Figure 3.1) is complemented with a reduction of the interfacial bending energy of the droplets while increasing the flat film radius formed in between. Additionally, the 40
55 formation of a thin liquid film between the two droplets enhances the role of the surface forces, such as the van-der-waals attraction, electrostatic repulsion, hydration, ionic correlation, protrusion and oscillatory structural forces, as well as steric interactions, among others. h h a a r (a) (b) Figure 3.1. Sketch of Two Emulsion Droplets of Radius a Separated at a Surface-to- Surface Distance h Contribution of Interfacial Deformation: a) Effect of Interfacial Dilatation (W dil ): Quoting Ivanov et al. (1999): It is assumed that before the collision, the two droplets are spheres of radius a (Figure 3.1a). When the distance between the droplets is small enough, a flattening could appear in the zone of their contact (Figure 3.1b). This deviation from the spherical shape causes a dilatation of the droplet surface, whereby the respective increase of the surface energy of the two droplets follows from simple geometrical considerations (Denkov et al., 1991 and Danov et al., 1993b). b) Effect of Interfacial Bending (W ben ): Quoting Ivanov et al. (1999): The flattening of the droplet surfaces in the zone of contact (Figure 3.1b) is affected by the 41
56 interfacial bending moment. Hence, work of interfacial flexural deformation must be performed to achieve deformation (Petsev et al., 1995) Contribution of Surface Forces: a) Van-der-Waals Interaction (W vw ): Quoting Ivanov et al. (1999): Based on the assumption for pair-wise additivity of the van-der-waals interaction energy with respect to couples of molecules (Ivanov et al., 1999), an exact expression for the energy, W vw, for the van-der-waals interactions between two deformed droplets of equal size (Figure 3.1b) can be derived. In most cases, an approximate expression (for moderate deformations and separations) can provide a very good precision (Danov et al., 1993b and Petsev et al., 1995). b) Electrostatic Interaction (W el ): Quoting Ivanov et al. (1999): The rigorous theory of the electrostatic (double layer) interaction yields rather complicated expressions for the respective interaction energy, even in the simpler case of a plane-parallel liquid film. Fortunately, some useful approximate expressions have been derived by authors such as Verwey and Overbeek (1948) and Petsev et al. (1995). c) Ionic Correlation Surface Force (W cor ): Quoting Ivanov et al. (1999): As shown by Debye and Hückel (193), the energy of formation of the counterion atmospheres of the ions in a solution gives rise to a contribution to the free energy of the solution, called correlation energy. This correlation energy provides a contribution to the osmotic pressure of an electrolyte solution. Since the electrostatic disjoining pressure (or the electrostatic component of the work done 4
57 by the surface forces) is actually an excess osmotic pressure in the thin liquid film, it must also include a contribution from the correlation energy, which is not taken into account in the conventional DLVO theory. See Verwey and Overbeek (1948) and Israelachvili (1991). d) Hydration Repulsion (W hydr ): Quoting Ivanov et al. (1999): The hydration repulsion is a short-range monotonic repulsive force, which appears as a deviation from the DLVO theory for short distances between two molecularly smooth electrically charged surfaces. Such a force may appear in foam or emulsion films stabilized by ionic surfactants. The physical importance of the hydration force is that it stabilizes thin films (and thereby emulsions), thus, preventing coagulation in the primary minimum of the DLVO disjoining pressure isotherm (Verwey and Overbeek, 1948 and Israelachvili, 1991). e) Protrusion and Steric Interaction (W protr ): Quoting Ivanov et al. (1999): Due to its thermal motion, an amphiphilic molecule in an adsorption monolayer (or micelle) may fluctuate around its equilibrium position, i.e., protrude. The configurational confinement of the protruding molecules within the narrow space between two approaching interfaces gives rise to a short-range repulsive surface force, called the protrusion force, as presented by Israelachvili and Wennerström (199). f) Oscillatory Structural Force (W osc ): Quoting Ivanov et al. (1999): Very often, emulsions contain small colloidal particles (such as surfactant micelles) in the continuous phase. The presence of these small particles causes an oscillatory structural force, which affects the stability of foam and emulsion films, as well as 43
58 the flocculation processes in various colloids. At higher particle concentrations (volume fractions above 15%), the structural forces stabilize the liquid films and emulsions. At lower particle concentrations the structural forces degenerate into the so-called depletion attraction, which is found to destabilize dispersions (Kralchevsky and Denkov, 1995 and Marinova et al., 1998). The contribution due to different effects to the total energy of interaction between two deformable emulsion droplets is given by, W = W dil + W ben + W vw + W el + W cor + W hydr + W protr + W osc..... (3.1) For each specified system, an estimate may reveal which of the terms in Eq. (3.1) are predominant, and which can be neglected. The analysis shows that the same approach can be applied to describe the multidroplet interactions in flocs, because in most cases the interaction energy is pair-wise additive (Ivanov et al., 1999). The minimum of the potential surface corresponds to an equilibrium doublet of droplets. Hence, if this minimum exists, the equilibrium doublet should be rather stable. The coalescence rate can be related to the total interaction energy as mentioned by Danov et al. (1993a). Also, droplet thermodynamics studies combined with hydrodynamic interactions are essential to obtain the critical parameters for coalescence and break-up models, such as coalescence time and critical film thickness Electrostatic Coalescence Several techniques are available in the petroleum industry to separate water in oil dispersions (emulsions). Techniques, such as gravity separators based on the effect of body forces, heat treatment, which is based on reducing viscosity to improve mobility 44
59 and film drainage and addition of demulsifiers, taking advantage of modifying the surface tension to change droplet stability are among the commonly used methods to enhance separation. However, electrocoalescence, which is a method based on the effect of body forces on droplets, seems to be the most efficient in terms of coalescence enhancement results and energy efficiency (Eow et al., 001). Electrostatic coalescence is a process where a dispersion of water in oil (usually called emulsion due to the stability of small droplets) is exposed to an external electrical field. The effect of this electrical field is polarization of the droplets producing an attraction among them. Due to the polarization of the droplets, the droplets are attracted to each other and collide, producing several coalescence events. The final result is a dispersion with a larger average droplet size diameter, which will be separated faster in a separator. This technique is applied when the residence time required to obtain gravity separation of the dispersion is several times larger than the residence time of the separator. By using the electrostatic coalescer and modifying the droplet size distribution, the residence time in a gravity separator is reduced significantly. A good review of the current state of the art of electrical demulsification can be found in Eow et al. (001). 3. Modeling of Droplet-Droplet Interaction and Coalescence In this section, the models used, the procedure followed and the proposed approach to predict coalescence of deformable droplets including surface forces and coalescence with an external electrical field, are presented. 45
60 3..1 Coalescence Based on Droplet Deformation As mentioned earlier, the coalescence rate can be related to the total interaction energy following the approach presented by Danov et al. (1993a) and Ivanov et al. (1999). The studies required to describe the forces and their effects, which are considered in the proposed model for coalescence due to droplet deformation interaction energy, are presented below Energy of Interaction between Two Deformable Droplets: The approach adopted in the present study is the one proposed by Ivanov et al. (1999) who assumed that the interaction energy between droplets can be calculated based on truncated spheres. The truncated spheres assumption (see Figure 3.1b) neglects the effect of the change in the curvature between the flat zone and the spherical part of the droplet, which is expanded due to the creation of the flat film. Denkov et al. (1995) compared the results of modeling interaction energies following a rigorous approach for the droplet shape, and the results obtained with the truncated spheres approach. A very good agreement was obtained between the prediction of the detailed model (real shape) and the simplified model (truncated spheres). Hence, the models in this study for different effects with respect to droplet deformation and for the interaction energy, utilize the truncated spheres approximation as a valid simplification Contribution of Interfacial Deformation: a) Effect of Interfacial Dilatation: The model used for this effect is the one described by Danov et al. (1993b). The equation shown below is obtained for identical 46
61 droplets. However, the case for different droplets sizes can be easily extended by evaluating Eq. 3. for two different sizes and taking an average. In Eq. 3., E G is the effective Gibbs elasticity, a is the droplet radius, r is the radius of the flat disc formed between the droplets and σ is the surface tension. The contribution to the interaction energy between two droplets due to interfacial dilatation (W dil ) is given by: Wdil 4 8 σ r EG r = π a +... (3.) 4 8 a 64 a b) Effect of Interfacial Bending: This contribution is calculated using the model presented by Petsev et al. (1995) and Ivanov et al. (1999), as given in Eq This expression is derived for the case of equal size droplets. In order to extend this expression for two droplets of different sizes, a definition for an equivalent droplet size based on two droplet radii a 1 and a as presented by Danov et al. (1993b), is utilized, namely, a a1 a e a1 + a =.... (3.3) Wben B0 r ae = π..... (3.4) where B0 = 4 kc H (3.5) H 0 = 1 a e (3.6) Eq. 3.5 enables the calculation of the interfacial bending moment B 0. The interfacial curvature elastic modulus, k c, has been found to be of the order of k T 47
62 48 (thermal energy) for emulsion interfaces, as mentioned by Petsev et al. (1995). The parameter k is defined as the Boltzmann constant, T is the temperature and H 0 is the spontaneous curvature (defined in Eq. 3.6) Contribution of Surface Forces: a) Van-der-Waals Interaction: Danov et al. (1993b) showed a complete derivation for the calculation of van-der-waals energy of interaction for the general case with two droplets of different sizes, and also for particular cases such as equal droplet sizes. Since an expression for the case of droplets of different sizes (a 1 and a ) is available, this expression given in Eq. 3.7 is used to consider all the probable collision sizes, as )) - ( ) ( - ) - ( ) (( ) - ( ) ( ) ( 4 - )) - ( ) ( - ) - ( ) (( ) - ( + ) - ( ) ( ) - ( ) ( - ) ( ) ( ) - ( + ) ( ) - ( ) ( ) - ) ( ( - ) ( ) - ( )) ( - ( - ) ( ) ( - + )) ( ( )) ( ( ln + ) ( ) ( + ) ( ) ( 1-3 = h - a l h - l a h + l h + l a + l l +l l h - l a h - a l h - l a h +l h+l h - a l dw a a +l l +l l h - a l h + r l a + h l + l l l h h l l a h h - a l h dw - h a - l l h h - a l r a - l a - l l h l r h - l h r h +l l +l l h +l l h h - l a + h l l h - l a A W H vw. (3.7) where A H is the Hamaker constant and h is the film thickness and 4 r h dw + =..... (3.8) r a a h l + + = (3.9)
63 l a + a r = (3.10) b) Electrostatic Interaction: Petsev et al. (1995) presented an expression for high surface potentials that is useful for the case of two droplets with different sizes, namely, Wel 64 e Ψs1 e Ψs κ h a = + 1 a C tanh el k T tanh e r κ 4 k T 4 k T κ ( a + ) 1 a.. (3.11) where Ψ s1 and Ψ s are the surface potential of the particles and C el is the electrolyte concentration. The term κ 1 is the Debye screening length as defined below. 8 π e z κ = C el (3.1) ε k T where e is the elementary charge and ε is the dielectric permittivity of the medium. z denotes the valency of the ions. c) Oscillatory Structural Force: As shown by Danov et al. (1993b), one can obtain an expression for the energy of interaction of two droplets, W, and the interaction energy per unit area, f(h), based on the Derjaguin approximation as follows: W osc = π r f osc h ( h) + π a f ( H ) osc dh (3.13) Based on the work from Kralchevsky et al. (1995) and Marinova et al. (1998) semiempirical and analytical expressions are utilized in order to obtain f osc, as given by ( h) ( d ) ( d h) F for h d f osc = F P0 for 0 h d (3.14) 49
64 where F ( h) = P 0 d p exp 4 π 3 ( d ( d d ) h d ) + p l l d p π h ( ) π h cos π sin d d dl d p d p p l... (3.15) and d p d = Δφmic Δφmic..... (3.16) 3 dl d = (3.17) Δφmic Δφ π = 3 mic φ mic (3.18) In Eqs through 3.18 d denotes the diameter of the small particles (micelles), d p and d l are the period and the decay length of the oscillations, respectively, P 0 is the particle osmotic pressure and φ mic is the micellar volume fraction, as given by P 0 mic ( 1 φ ) 3 3 mic 6 φmic 1+ φmic + φ φ = k T (3.19) 3 ( π d ) mic 1 d = + κ (3.0) d h The hydrodynamic diameter of the micelles d h, can be measured by light scattering, as reported by Marinova et al. (1998), where d h = 6 nm. The Debye screening length is calculated including a modification presented by Petsev et al. (1995) where the critical micellar concentration (CMC), the micellar volume fraction ( φ mic ), the surfactant aggregation number (v a ) and the degree of dissociation of the micelle surface (α) influence its behavior, as given below. 8π e z 3α v = C + CMC + a φ κ mic el k T (3.1) ε π d 50
 Typical results of the model for total interaction energy are shown in Figure 3.. This figure is a contour plot of the total interaction energy for different droplet configurations.")

65 The effects considered in the present study are shown next as part of the total interaction energy: W = W dil + W ben + W vw + W el + W osc (3.) Typical results of the model for total interaction energy are shown in Figure 3.. This figure is a contour plot of the total interaction energy for different droplet configurations. The y-axis of this figure is the dimensionless film thickness h/a, and the x-axis is the dimensionless film radius, r/a. For the sake of simplicity the case shown in this figure is the equal droplet size interaction case. In this figure three zones of minimum energy can be observed, which correspond to the three possible cases when surfactants are present in the system. The three possible cases are for two, one and zero micellar layers in the film between the droplets h/a r/a Figure 3.. Interaction Energy W/kT for Different Film Thickness and Film Radius 51
66 Coalescence Dynamics of Deformable Droplets: The purpose of analyzing the interaction energy due to interfacial deformation and surface forces is to obtain the coalescence rate of a given couple of droplets affected by all the variables considered in the model. Following the approach given by Danov et al. (1993a), an expression for the coalescence efficiency, λ ij, can be obtained assuming that the mutual diffusion coefficient, D(z), depends on the hydrodynamic resistance to the mutual droplet motion, γ(z). where ( z) ( z) 1 1 W dz ij 1 = exp (3.3) λ 4π z D k T 0 kt γ ( z ) =.. (3.4) D( z) 4 3π μ a r r γ ( r, h) = c + + s (3.5) h a h a h The value of s is between 1 (for tangentially immobile surfaces) and (for pure liquids or when the surfactant is soluble only in the dispersed phase). This constant accounts for the surfactant diffusivity in the dispersed phase and/or continuous phase, and also for the droplet surface properties. An approximation for calculating the coalescence efficiency presented by Danov et al. (001) is shown in Eq This approximation allows a shorter computation time. Given the complexity of the models for each of the interaction energies and the fact that the main goal is to obtain the coalescence efficiency for a distribution of droplets, the 5
67 expression given below is the best choice for this study. In this expression the subscript m denotes the value corresponding to the maximum of W. 1 λ ij 8π k T = '' W m 1 ( z ) 4π z D( z ) m 1 m ( z ) W exp k T m.... (3.6) Another important parameter for the model is the determination of the critical film thickness, h cr, at which the thin liquid film ruptures. For this study the expression developed by Radoev et al. (1983) was found to be useful, as given by: ( kt σ ) A r h = H cr..... (3.7) 16 σ Eq. 3.7 arises from the concept of spontaneous growth of surface fluctuational waves at the critical state. Radoev et al. (1983) based their analysis on the application of the Brownian motion theory and the local concavities on the surface of a nonequilibrium film created by this form of motion. Additionally, expressions for the geometry of a pair of droplets during deformation are required in order to obtain the values of the total distance between the centers of mass of two droplets, z, given the film thickness, h, film radius, r, and droplet size. Such expressions can be found in Denkov et al. (1991). A population balance is used in the present model in order to study a droplet size distribution and its interactions. Only the coalescence part of the population balance is used. For this part, it is necessary to know not only the coalescence efficiency for every pair of colliding droplets but also the collision rate. Depending on the application to be studied, different models for the collision rate can be used. The collision rate model chosen for this study is based on the model 53
68 presented by Zhang and Davis (1991), which characterizes the rate of gravity-induced collisions. The collision rate, ω ij, is based on the concentration and size of the droplets (as in other models) but the main characteristic parameter is the relative velocity between the droplets, ( 0) V i, j. The relative velocity between droplets is obtained using the Hadamard-Rybczynski formula (Hadamard, 1911 and Rybczynski, 1911). The utilization of this model is limited to dilute dispersions and pertinent modifications should be made for other applications. 4 d d i j ( 0) ω ij = π ni n j + Vi, j..... (3.8) V where (0) ij = ( ˆ μ + 1) ρ ρ ( d ) ( 1 dˆ ) d 3 c ( 3 ˆ μ + ) μc d ˆ = d j di and ˆ μ = μ d μ c i g.... (3.9) Once, the collision rate and the coalescence efficiency are obtained, they can be combined to obtain the coalescence rate of a pair of droplets, as follows: FC, ij = ωij λij.. (3.30) 3.. Electrostatic Coalescence A particular case of droplet-droplet interactions is the one occurring in electrostatic coalescers. These devices take advantage of the electric-field-induced attractions between two spherical conducting droplets. The model presented in this section is based on the work from Zhang and Davis (1991) who studied the effect of hydrodynamic interactions on droplet collision and coalescence, and the work from 54
69 Zhang et al. (1995) who studied droplet collision and coalescence induced by the combined effects of gravitational and electrostatic forces. The equations presented next are the components required to use in the population balance approach (Eqs..1 to.3) for its transient form. The population balance is used in its transient form since electrostatic coalescers, as in many other applications, are devices where steady state conditions may never be reached. The transient form of the population balance is better used to size an electrostatic coalescer. The approach of the model is to first analyze the collision rate given by the motion of the droplets due to gravity, and then to correct this rate due to the presence of an external electrical field by means of the coalescence efficiency. Following the approach used by Zhang et al. (1995), the collision rate, ω ij, is calculated based on the relative velocity of the droplets ( U and (0) i ( 0) U j ), which corresponds to the value ( V 0) i (, j (Hadamard, 1911 and Rybczynski, 1911) given by Eq ) obtained with the Hadamard-Rybczynski approach ω ij d d i j (0) (0) di = π ni n j Ui U j = ni n j + π d j + ( 0) Vi, j... (3.31) Additional effects can be considered for the collision rate, such as the collisions due to laminar shear. The model widely adopted for this situation is the one given by Friedlander (000) where du c dy is the average shear rate. 3 ω lam 4 d d i j du c ij = ni n j + 3 dy. (3.3) 55
70 3...1 Relative Motion of Two Conducting Droplets: The relative velocity of two interacting droplets is related to the external driving forces, which balance the hydrodynamic resistance on each droplet. Figure 3.3 shows the coordinate system used to describe the relative motion of two droplets, as proposed by Zhang et al. (1995). a i U i θ ψ E 0 g R a j U j Figure 3.3. Coordinate System for Relative Motion of Two Droplets Zhang et al. (1995) presented an expression to obtain the relative velocity of two droplets, V r ij, as a linear function of the external forces (Eq. 3.33), based on the analysis of Batchelor (198). e r r and e r θ represent the unit vectors in the radial and tangential directions. r (0) Vij = Vij (0) Dij kt r r ( L cosθ e + M sinθ e ) (0) r r D θ r ij r ( G F E, ij er H F eθ ) G F er E, ij r θ kt vw, ij.... (3.33) 56
71 The term D (0) i,j is the relative mobility of two widely spaced droplets due to an equal and opposite force (electric-field-induced force and van-der-waals attraction). D k T ( ˆ μ + 1) (1 + dˆ) = d π μ i c (3 ˆ μ + ) ( 0) i, j... (3.34) dˆ The variable F vw,i,j represents the van-der-waals force and is commonly expressed as the gradient of its potential, Φ vw,ij, as given, respectively, by and F vw, ij Φ vw, ij Φ vw, ij =... (3.35) = A H 6 ( s where s R ( + ) centers. 8 dˆ 4) (1 + dˆ) + ln s + s 8 dˆ (1 + dˆ) 4 (1 dˆ) ( s 4) (1 + dˆ) (1 + dˆ) 4 (1 dˆ)... (3.36) = a i a j and R is the dimensional distance between the two droplet The terms r F E, ij and θ F E, ij are the two components of the electric-field-induced forces, along and normal to the line-of-centers of the droplets, namely, r ij ( F cos ψ + ψ ) F E, = 4 π ε a j E0 1 F sin.. (3.37) θ FE, ij = 4 π ε a j E0 F3 sin ψ.. (3.38) where E 0 is the magnitude of the external electric field, ψ is the angle between the electric field and the vector joining the line-of-centers of the two droplets (see Figure 3.3). F 1, F and F 3 are the force coefficients, which are complicated expressions. These coefficients are determined using the solution of Davis (1964). 57
72 58 The relative mobility functions for motion along centers, L and G, and motion normal to the line of centers, M and H, are similar to those developed by Zhang and Davis (1991), as given by = ) ˆ ( ˆ) (1 1) ˆ 1)( ˆ ( ˆ 1 ˆ 4 1 1) ˆ ˆ)( (1 1) ˆ ( ˆ 1 ˆ 3 1 ) ( s O s d d d d s d d d s L μ μ μ μ (3.39) ( ) = ˆ) (1 1) ˆ ( ˆ ˆ 1 3 ˆ) 5 ˆ)( ( 4 1 ˆ) (1 1) ˆ ( ˆ ˆ 1 ˆ 8 1 ˆ) (1 ˆ ˆ 1 ˆ 3 1 ) ( s O s d d d s d d d s d d s G μ μ μ μ μ μ μ.. (3.40) = ) ˆ ( ˆ) (1 1) ˆ 1)( ˆ ( ˆ 1 ˆ 1 1) ˆ ˆ)( (1 1 ˆ ˆ) (1 ˆ 3 1 ) ( s O s d d d d s d d d s M μ μ μ μ (3.41) = ˆ) (1 ˆ) ˆ ( ˆ 1 ˆ 1 ˆ) (1 ˆ ˆ 1 ˆ 3 1 ) ( s O s d d d s d d s H μ μ μ μ (3.4) 3... Trajectory Analysis for Collision of Two Droplets: The last component required to be used in the population balance is the coalescence efficiency. The coalescence efficiency is obtained through a trajectory analysis as described by Zhang and Davis (1991). For that, it is necessary to solve Eq by means of a nondimensional form proposed by Zhang et al. (1995) and integrate it numerically, as given by
73 59 ( ) + + Φ = ψ θ ψ θ ψ ψ θ θ sin ˆ 1 ˆ sin sin ˆ 1 ˆ sin sin cos ˆ 1 ˆ cos 3,, 3, 1, F d d Q H M A a a Q G F d d Q H M F F d d Q G L s d ds ij E H ij j i vw ij ij E ij E (3.43) where 0, ˆ) (1 3 ˆ) (1 ˆ 4 E a d g d d Q i c d ij E + = ε ρ ρ... (3.44) 4, 3 ) ˆ (1 ˆ i H c d ij vw a A g d d Q = ρ ρ π..... (3.45) Estimation of the coalescence efficiency, λ ij, is reduced to the determination of the critical impact displacement, cr y. For any fixed operational conditions (external electrical field strength, residence time and fluid properties) different trajectories can be obtained for different initial conditions. A limiting trajectory, for which any droplet inside this trajectory will collide and any droplet outside this trajectory will separate from the other droplet, is defined as the largest horizontal displacement, cr y. This limiting trajectory can be observed in Figure 3.4. Once cr y, has been determined, the coalescence efficiency can be obtained as shown below. ) ( j i cr ij d d y + = λ... (3.46)
74 9.0 y cr 7.0 s*cos θ droplet trajectory 1 trajectory trajectory 3 trajectory s*sinθ Figure 3.4. Typical Relative Trajectories of Two Droplets 3.3 Comparison Between Model Predictions and Experimental Data This section shows comparisons between the results obtained using the models described in the previous section with experimental data available in the literature for electrostatic coalescers Coalescence Based on Droplet Deformation Based on the sub-models presented previously for interaction energy between deformable droplets and the model for coalescence dynamics, it is possible to incorporate these phenomena into the population balance (Eqs..1 to.3). This allows studying the 60
75 effects of the interaction energy on a distribution of droplets while they interact with each other based on the assumption of binary coalescence. Table 3.1 shows the input data used for the model. A transient population balance was used to study the effect of different micelle volume fractions (surfactants) in the system. Unfortunately, experimental data for the particular conditions for which the model was used are not available. The model requires, as part of the input information, a given initial droplet size distribution and it was tested for different residence time and micelles volume fraction values. Table 3.1. Input Data for Droplet Deformation Coalescence Model Dispersed phase density 0.87 g/cm 3 Dispersed phase viscosity cp Continuous phase density 1.0 g/cm 3 Continuous phase viscosity 1.00 cp Surface tension dyne/cm Droplet surface potential V Surface (Gibbs) elasticity.00e-01 N/m Ions valency 1 Electrolyte concentration 0.1 M CMC 1.00E-03 M Micelle degree of dissociation 5 % Aggregation number 80 M Micelles diameter 4.8 nm Figure 3.5 shows the results of the model for coalescence dynamics of deformable droplets while interacting under different surface forces and interfacial deformation effects. The results are presented in terms of d 50 which is the diameter where 50% of the cumulative distribution is reached. Each d 50 value encapsulates the distribution given by the transient population balance under different conditions. In this figure φ mic = 0 61
76 represents absence of micelles but not absence of surfactants and corresponds to the critical micellar concentration (CMC). d50 (microns) Residence time (s) d50 in φ 0 mic = φ 0.1 mic = φ 0. mic = φ 0.3 mic = Figure 3.5. Average Droplet Size (d 50 ) vs. Residence Time for Different Micelles Volume Fractions (φ mic ) The trends observed in Figure 3.5 are as expected. It can be seen that for higher residence times, the average droplet size increases, as well, as a consequence of a higher number of coalescence events. The most important observation is that the increment in the average droplet size is reduced, while increasing the micelles volume fraction ( φ mic ) for a fixed residence time value. This is in agreement with some experimental observations. Furthermore, when the micelles volume fraction reaches a value of φ mic = 0.3, the behavior of the dispersion is rather similar to the behavior of a stable emulsion. Nevertheless, the results of the model for micelles volume fraction value of φ mic = 0.3 and low residence times do not follow the same trend observed for other micelles volume fraction values tested. Validation of this particular example is strongly recommended 6
77 either through experiments or by means of other models that can predict the same phenomena Electrostatic Coalescer The results of the electrostatic coalescer model based on the approach given by Zhang et al. (1995) and using the population balance (Eqs..1 to.3) are shown next. Urdahl et al. (1998) conducted experiments for electrostatic coalescers in horizontal and vertical configurations. It has been found (Zhang et al., 1995) that the vertical position (flow perpendicular to external electric field) produces better results. Part of the experimental data obtained by Urdahl et al. (1998) for a vertical annular electrostatic coalescer has been used to validate the model predictions. Table 3. summarizes the main aspects of this experimental data for a gas-oil and water system flowing downwards. Table 3.. Geometry for Experimental Data from Urdahl et al. (1998) Electrodes length 1500 mm Flow gap 13 mm Electrode gap 18 mm Watercut 5 % Figure 3.6 and Figure 3.7 show the results of the electrostatic coalescer model for a fixed external electric field strength value. As can be seen, the use of a transient population balance allows studying the evolution of the initial droplet size distribution while the liquid-liquid dispersion is modified inside the electrostatic coalescer. 63
78 A fv (number fraction) time (s) s s Particle Size (microns) Figure 3.6. Transient Population Balance Solution for Droplet Size Distribution as a Function of Time in the Course of an Electrostatic Coalescer AC Fv (cumulative number fraction) s time (s) s Particle Size (microns) Figure 3.7. Transient Population Balance Solution for Droplet Size Distribution as a Function of Time (Cumulative Distribution) in the Course of an Electrostatic Coalescer 64
79 The results of the electrostatic coalescer model are compared against the experimental data from Urdahl et al. (1998) for different flowrates and electric field strength values. The comparison against experimental data is carried out for a vertical annular electrostatic coalescer flowing downwards with a high shear inlet. The results for the droplet size distribution given by the transient population balance are expressed in terms of d 50. As can be seen in Figure 3.8, a reasonably good agreement is observed between the model predictions and the experimental data. d50 (microns) Flowrate (lt/min) Inlet Outlet 0 kv Outlet.5 kv Outlet 5 kv Outlet 7.5 kv Outlet 10 kv Model Inlet Model 0 kv Model.5 kv Model 5 kv Model 7.5 kv Model 10 kv Figure 3.8. Comparison between Electrostatic Coalescer Model Predictions and Urdahl et al. (1998) Experimental Data Considering the uncertainty contained in any experimental study and the assumptions inherent to the model by neglecting other phenomena that may be occurring simultaneously along with the electrocoalescence, the trends obtained with the model and its functionality with the main variables of the process are satisfactory. 65
80 CHAPTER 4 OIL-WATER BATCH SEPARATION Oil-Water separation is one of the most important processes associated with oil production. The most common form of separation is the one driven by gravity. In order to characterize the separation and/or transportation of oil-water systems and properly design separation facilities, many studies have been carried out on oil-water batch separation in the past. In this chapter, an analysis of batch separation is presented including comparison with experimental data. 4.1 Batch Separation Physical Phenomena Emulsion Stability An emulsion (dispersion) is, by definition, a thermodynamically unstable system. This is due to the natural tendency of a liquid-liquid system to separate and reduce its interfacial area and hence its interfacial energy. For an emulsion to separate, droplets must coalesce with each other, or with the continuum that forms gradually. An emulsion can remain unchanged under certain conditions while it can break under others. Emulsion breaking processes can include physical effects such as, artificial gravity, Brownian motion, or stirring. Nevertheless, the most common case is when an emulsion is kept in a container at constant temperature under normal gravity conditions (Salager, 001). 66
81 The emulsion breaking process involves several steps: a) Long-distance advance between droplets or between droplets and a flat interface, b) Inter-droplet film drainage, c) Coalescence. Since the continuous and dispersed phases usually have different densities, there is an Archimedes pull on the dispersed-phase droplets that drives the separation process. Gravity separation can be classified as sedimentation or creaming depending on whether the droplets are falling or rising, respectively. This separation process tends to gather the droplets in a region that becomes a high dispersed-phase volume fraction emulsion, which is sometimes called cream or dense-packed zone. When flocculation occurs, droplets are attracted to each other without reaching either coalescence or partial coalescence, producing larger structures called flocs. These structures behave as an equivalent droplet with a larger diameter than any of its original droplets. If sufficient time is allowed for the process and the conditions are appropriate, the droplets sedimented and those coming from the flocs will coalesce to form a separate continuous phase. These processes are illustrated in Figure 4.1 (Auflem, 00). The mechanism of coalescence occurs in two stages, namely, film drainage and film rupture. Film drainage occurs when there is a flow of fluid and a pressure gradient in the film. Later on, when the interfacial film between the droplets thins below some critical thickness, it ruptures and the capillary pressure difference causes the droplets to rapidly fuse into one droplet. Therefore, the properties of the thin film play a major role in the separation process. Also, if the droplets deform the area of the interface increases, increasing the drainage path in the film, resulting in lower drainage rates. 67
82 Creaming Coalescence Flocculation Sedimentation Figure 4.1. Schematic of Emulsion Breakdown and Separation Processes Several factors may affect emulsion stability. Electrical double layer repulsion or steric stabilization by surfactants may prevent the droplets from coming into contact with each other. Also, surfactants or adsorbed particles can create a mechanically strong, elastic interfacial film that acts as a barrier against aggregation and coalescence. Other factors that promote emulsion stability are low interfacial tension, high viscosity of the continuous phase and relatively small volumes of the dispersed-phase. When the droplets are close, the film between neighboring droplets exhibits a complex drainage process that involves different mechanisms. Some of these mechanisms are explained in Chapter 3. 68
83 4.1. Batch Liquid-Liquid Dispersions Separation Process Due to the difference in densities, the oil and water phases separate, producing time-dependant interfaces, namely, the coalescing and sedimenting interfaces. Thus, the trapped sample is separated, whereby clean oil is formed at the top and clean water at the bottom. In between the clean oil and clean water zones, is the oil and water mixture zone. For oil dispersed in water (O/W), a detailed description of the batch separation process is shown in Figure 4. (from Jeelani and Hartland, 1998). As can be seen, two curves describe the height of the two boundaries of the separated dispersion. Since the height is presented against time, the slope of the lines represents the decay velocity of the two fronts. Figure 4.a illustrates that below the clean oil interface (coalescing interface) is the dense-packed zone, consisting of mainly oil droplets. The droplets move upward and coalesce into the clean oil zone. Region A in Figure 4.b describes the beginning of the process. The dispersion that is just poured into the test cell experiences droplets movement in all directions due to turbulence induced during the flow into the cell. Different mechanisms take place in both the coalescence and sedimentation fronts. Droplets that are close to their respective phase start to coalesce with it. This is a relatively slow process given that the droplets must agglomerate before they can coalesce. Sedimentation Front (B). The sedimentation curve increases with time while its slope decreases slowly with time. The slope of this curve is related to the sedimenting velocity. The maximum possible velocity in this region depends on the droplet size, fluids properties, and the local droplet concentration. A local change in velocity may occur in cases of local binary coalescence, which might take place, depending on the 69
84 droplet concentration in the dispersion. The sedimentation front can be seen sharply in cases where droplets form a narrow size distribution and/or at high droplet concentration. Sedimentation continues until the droplets reach the dense-packed zone. O/W h c h p h s Oil Coalescing interface Dense-packed Zone Sedimentation Zone Sedimenting interface Water Height of coalescing and sedimenting interfaces hc and hs A A B C Dense-packed zone Sedimentation zone t i Maximum slope Height of coalescing interface h c D D Height of sedimenting interface h s Time (a) (b) Figure 4.. Sedimentation and Coalescence Profiles in a Batch Separator (Oil in Water Dispersion) Coalescence Front (C). The rate of droplet coalescence with its own phase may be faster or slower than the droplet-droplet coalescence rate in either the dispersion or the dense-packed zone. While slower (smaller) droplets complete their sedimentation process, a thick layer of relatively large droplets is formed, which is called the dense- 70
85 packed zone in the coalescence zone. Thereafter, the coalescence rate is almost constant, and is affected by the thickness of the dense-packed zone layer, applying pressure on the droplets in front of the coalescing interface. The average droplet size at this point is usually larger than the initial average droplet size due to multibinary coalescence. Final Stage (D). In most cases, either one or both the coalescing and sedimenting fronts exhibit a change in their slope toward the end of the separation process. This is due to the existence of a group of small droplets in the settler. Since these droplets are small, they also move at low velocities. A portion of these droplets might even move in the opposite direction, entrained with the continuous-phase. This process is observed only after the large and moderate size droplets are already coalesced. Naturally, the slope of the front tends to zero as time passes and a small fraction of remaining small droplets coalesce. 4. Literature Review Several authors have studied in details the oil-water batch separation process. Among them, the most relevant publications are those by Jeelani and Hartland (1998) and Jeelani et al. (1999) who investigated the separation of batch liquid-liquid dispersions by means of both experiments and modeling. They studied the development of the interfaces formed during the separation process and characterized the process in terms of the fluid properties and the initial mean droplet size. Other authors, including Wang and Davis (1995 and 1996), have presented a more detailed batch separation analysis, considering modeling of populations of droplets and space and time variations. However, these studies are valid only for dilute dispersions. 71
86 The petroleum industry and various research groups have relied on the batch separation process as a method capable of characterizing oil-water systems under different operational conditions, including high pressure, high temperature, different droplet size distributions and the presence of additives (surfactants, salts and others). Recently, The University of Tulsa has initiated investigations using a Dispersion Characterization Rig (DCR). Gomez-Markovich (006) conducted extensive experimental investigations to study the flow behavior and stability of oil-water dispersions, utilizing this DCR Modeling Separation of Batch Liquid-Liquid Dispersions Constant Droplet Size Models: Through the years many investigators have studied the separation of batch liquid-liquid dispersions. The research conducted has covered experimental studies and formulation of mathematical models to predict the main variables involved in the separation process. Among the many publications available in the literature it is worth mentioning the work from Barnea and Mizrahi (1975), Jeelani and Hartland (1985), Dalingaros et al. (1987) and Hartland and Jeelani (1987). The studies presented by these authors have been important since they provided the first attempts to characterize the batch separation process, and to extrapolate the simple results obtained in laboratory tests to large scale industrial settlers. The goal was the design of continuous flow gravity separators whose behavior can be better understood by studying the fundamental processes of sedimentation and coalescence in batch separators. This is less expensive as compared to the pilot plant experiments normally conducted. Additionally, important parameters, such as the initial dispersion droplet size and fluid 7
87 properties, were included in the initial models aiming at predicting the behavior of the coalescing and sedimenting interfaces during liquid-liquid separation. Nadiv and Semiat (1995) presented a comprehensive work on batch separation. In their study, several parameters were experimentally examined, such as initial dispersion heights, settler diameters, dispersion types, mixing intensity and time, and location of mixing impeller. They also presented a mathematical model for sedimentation, based on the analysis of Aris and Amundson (1973), for batch precipitation of solids. This model includes (in addition to the analysis of the experimental results) the calculation of parametric values of liquid-liquid dispersions, including sedimentation and coalescence velocities. It was shown that, at least for the solvents and the turbine mixer used, the overall separation time is strongly dependent on the initial dispersion height, the diameter of the batch settler, and on the type of dispersion generated. They concluded that parameters, such as mixing intensity and mixing time have less importance and less effect on the process. One of the most significant publications related to batch separation is the Jeelani and Hartland (1998) study. They presented a model capable of predicting the coalescing and sedimenting interfaces formed during the liquid-liquid separation process. For that purpose, the model requires information about the fluid properties, the average initial droplet size diameter and the dispersed phase holdup. The model predictions are supported by experimental data. Experiments were carried out to investigate the effect of dispersed phase holdup and dispersion height on the separation of batch dispersions, in terms of the sedimentation and coalescence profiles. The model was verified using their own acquired data and the data presented by Nadiv and Semiat (1995). 73
88 Jeelani et al. (1999) presented modifications to their 1998 model in order to be able to include the effect of turbulence occurring in the dispersion, prior to entering the batch separator. They included this effect by taking into account two additional parameters, an incubation time and a turbulence decay time, which represent the time required for the dispersion to dissipate the initial turbulence and the time required to begin the separation process, respectively. A modification of Jeelani and Hartland (1998) batch trap separator model was presented by Gomez and Avila (00), enabling the prediction of the separation profiles and obtaining a value for a characteristic droplet size. The main modification was the use of the information at the inflection point (maximum coalescence rate), for determining the average droplet size diameter based on the separation profiles, instead of using the information related to the early stages of the experiment. The modified model was used by Barboza (00), who investigated the behavior of oil-water dispersions in piping components, including chokes, valves and elbow configurations. The model modification was required since in many of the tests conducted, it was difficult to obtain the experimental profiles at the early time of the experiment (Gomez et al., 003) Transient Droplet Size Models: The models of Jeelani and Hartland (1998) and Jeelani et al. (1999) are useful for the characterization of dispersion samples from different processes. However, they are based on a major assumption, namely, that a constant average droplet size monodispersion exists throughout the separation process. Wang and Davis (1995 and 1996) presented more complex models to characterize liquidliquid separation. These models consider the presence of droplets of different sizes by 74
89 using the population balance approach and include the space and time variation of the distribution of droplets and its concentration. Nevertheless, the approach is limited only to dilute dispersions. McGuire et al. (1996) presented a model to predict the growth of an average droplet size as a function of time for systems consisting of diluent droplets in a polymerdiluent matrix phase. This model describes the coalescence of two droplets and the effect of the coalescence event on their surrounding droplets. Each coalescence event enhances further collisions and coalescence of droplets by means of the fluid expelled from the film between them. An investigation of the kinetics of creaming and coalescence for liquid-liquid dispersions was carried out by Jeelani et al. (005a). They proposed the use of a thirdorder polynomial to describe the temporal evolution of the average droplet size during batch separation. This polynomial is adjusted based on boundary conditions, such as initial mean droplet size and final time for separation, among others. The predictions of this model were tested against experimental data, which included dispersions of average droplet size O(10 ) microns and separation times O(10 1 ) minutes. Jeelani et al. (005b) also adopted the use of the same third-order polynomial to predict creaming and aggregation. A comparison between the predictions of the latter model and experimental data that included dispersions of average droplet size O(10 0 ) microns and separation times O(10 ) days was presented. 75
90 4.. Experimental Investigations Batch Separator Experimental Investigations: Most of the modeling publications mentioned in the previous section include also experimental investigations of their own, which are of importance for understanding of the separation process. Based on the original purpose of the batch separator as an instrument capable of characterizing a large scale process, it is worth mentioning the work from Hafskjold et al. (1994) and Hafskjold et al. (1997), who related the information from a batch separator to predict the performance of actual field gravity separators. Experiments have also been conducted by Nadiv and Semiat (1995) and Jeelani and Hartland (1998). These experiments test the batch separation process for dispersions of different holdup, different initial dispersion height and the initial average droplet size, which are fundamental for model validation. Authors, such as Oolman and Blanch (1986) and Tsang et al. (004), conducted experiments to analyze bubble coalescence in stagnant liquids. Common to both publications is the analysis of the effect of electrolyte concentration and the effect of different kind of salts on the coalescence rate. Although the experiments have not been conducted on liquid-liquid batch separation systems, the results are very useful for studying the effect of electrolytes on coalescence in liquid-liquid systems. Barboza (00) investigated the behavior of oil-water dispersions in piping components, including chokes, valves and elbow configurations, by using a batch separator. This kind of experiments proves the versatility of the use of a batch separator to characterize different devices under conditions where droplet size measurements are limited. 76
91 4... Emulsion Studies in High Pressure / High Temperature Rigs: The most relevant published work on high pressure (HP) / high temperature (HT) rigs for studying emulsions are the ones from the Institut Français du Petrole (IFP) in France, and from the Norwegian University of Science and Technology, conducted as part of the FLUCHA program. The work presented by Noik et al. (00) attempted to define a relationship between the type of equipment used and the stability of the emulsion produced, by better understanding the formation of emulsion under different types of flow. Experiments were performed with live crude oil and produced water, and the emulsions were reconstituted both under laboratory scale conditions in a dispersion rig and under field scale conditions performing a test on an offshore platform. The emulsions were produced by a calibrated orifice and their characteristics were analyzed through a flow restriction approach. In Norway, the Fluid Characterization at Elevated Pressures and Temperatures (FLUCHA) program, directed by Dr. Johan Sjöblom since 1999, has carried out investigations on dispersion characterization. In order to study separation of emulsions under realistic conditions, a high-pressure separation rig was constructed at Statoil s R&D Centre (Sjöblom et al., 001 and Auflem, 00). The rig can be used to prepare emulsions and monitor the separation of oil and water, as well as any stable foam formation, in a vertical batch separation cell. 77
92 Figure 4.3. Schematic of Dispersion Characterization Rig of The University of Tulsa (Gomez-Markovich, 006) Gomez-Markovich (006) conducted experiments to investigate the flow behavior and stability of oil-water dispersions. Profiles of the coalescing and sedimenting interfaces were obtained using a Dispersion Characterization Rig (DCR), which is presented schematically in Figure 4.3. In the DCR, streams of two pressurized fluids flow through a choke valve separately. The streams mix in a third choke valve, before entering a vertical batch separator. As the fluid mixture passes through the choke valves it undergoes pressure drop, which provide the shear force necessary to create more interfacial area between the oil and water phases, thereby forming water droplets in the oil-phase (or oil droplets in the water-phase, as the case may be). The effects of the following parameters were studied: properties of oil-phase (light and heavy) and water- 78
93 phase (tap, distilled and brine); temperature; pressures in mixer, choke and cell; watercut; and operation mode. Normalization of experimental profiles were proposed with respect to both height and time. Further details of the experimental procedure followed by Gomez-Markovich and a more detailed review on high pressure (HP) / high temperature (HT) rigs for studying emulsions can be found in Gomez-Markovich (006). 4.3 Modeling of Separation of Batch Liquid-Liquid Dispersions This section presents the models used and the procedure followed for the development of the proposed model for predicting batch liquid-liquid separation Jeelani and Hartland (1998) Model The model developed by Jeelani and Hartland (1998) is the starting point of the proposed batch separation model. As explained before, the Jeelani and Hartland (1998) model predicts the variation with time of the heights of the sedimenting and coalescing interfaces in a batch separator. Figure 4.4 shows schematically the separation process in a system where oil is dispersed in water and the corresponding heights of the sedimenting (h s ) and coalescing (h c ) interfaces. For the case when water is dispersed in oil, the water droplets sediment downward (usually water has a higher density than oil), to form a dense-packed layer at the bottom of the dispersion. Thus, the profiles described in Figure 4.4 are interchanged, replacing the interface at the bottom of the dispersion by the coalescing interface and the interface at the top of the dispersion by the sedimenting interface. The equations presented still 79
94 apply if the heights h c and h s are respectively replaced by H 0 -h c and H 0 -h s, where H 0 represents the total initial height of the dispersion. O/W Initial coalescence time τ o h c h p h s Oil coalescing interface Dense-packed Zone Sedimentation Zone sedimenting interface Water Height of coalescing and sedimenting interfaces hc and hs Initial coalescence rate ψ o Sedimentation zone Sedimenting interface h s0 0 h p Densepacked zone Initial slope v o Initial drop diameter d o Maximum slope ψ i Height of coalescing interface h c Height of sedimenting interface h s t i t f (a) Time, t (b) Figure 4.4. Sedimentation and Coalescence Profiles in a Batch Separator and Main Parameters for Jeelani and Hartland (1998) Model (Oil in Water Dispersion Case) Coalescence Profile: Consider oil in water dispersion of height, H 0, whereby the oil droplets migrate towards the top of the dispersion to form a dense-packed layer of oil droplets with volume fraction, φ p (Figure 4.4a). Interfacial coalescence occurs, so the height of the coalescing interface, h c decreases with time (all heights are measured from the batch separator bottom) disappearing at a time, t f, when a complete 80
95 separation occurs. The height Δh of the dense-packed layer reaches a maximum value Δh i at time, t i at the end of the sedimentation stage, as shown in Figure 4.4. The Jeelani and Hartland (1998) model attempts to predict both the coalescing and sedimenting profiles by using a first-order linear differential equation (Euler s equation), as given by: dhc dt ψ i + Δhi hc ψ i = Δhi hp.... (4.1) where ψ i is the volumetric rate of interfacial coalescence per unit area, and h p is the height of the boundary between the dense-packed zone and the sedimentation zone. Eq. 4.1 is developed under assumptions such as that the interfacial coalescence time of a droplet is inversely proportional to the force acting to drain the droplet-interface film. This force is proportional to the height of the dense-packed zone and assumed to be proportional to the droplet size, which is also assumed to be constant during the separation process and with a unique value (monodispersion of droplets). The volume rate of interfacial coalescence per unit area ψ = dhc dt = φ p d 3τ given by Hartland and Vohra (1978) is the starting point to obtain Eq.4.1, where τ is the interfacial coalescence time. Sedimentation is the main mechanism driving the separation process until reaching the inflection point, after this moment, coalescence becomes the main driving mechanism until reaching complete separation. Before the inflection point, the separation time is proportional to droplet collision, while after the inflection point, the coalescing time is dependent on film drainage during and after the occurrence of the maximum dense-packed zone height. Therefore, Eq. 4.1 must be solved before and after the inflection point t i, as presented next: 81
96 Before the inflection point: According to Kynch (195), the height, h p of the boundary between the sedimentation and dense-packed zones during the sedimentation process (0 < t < t i ) can be assumed to linearly decreasing with time, t, as: hp = H 0 V p t... (4.) where V p is the constant rate of decrease in h p, namely, V p = dhp dt = H 0 hsi ti (4.3) The linear assumption behind Eq, 4. is consistent with the assumption of a monodispersion of droplets. However, when analyzing a distribution of droplets, this assumption may need to be reconsidered. Additionally, Jeelani and Hartland (1999) found that using additional parameters for the prediction of interfacial coalescence time τ, including parameters for the packing in the dense-packed layer and incubation time (the time taken for interfacial coalescence rate to initiate due to turbulence dissipation), leads to a non-linear expression for the height h p. Substituting Eqs. 4. and 4.3 into Eq. 4.1 and integrating Eq. 4.1 with the initial condition h c = H 0 for t = 0 yields the equation of the variation of the height of the coalescing interface, h c, with time at the initial period 0 < t < t i : h c V p Δhi ψ i t = H 0 V p t + 1 exp.... (4.4) ψ i Δhi 8
97 After the inflection point: After initial sedimentation has been completed (t > t i ) h p = h s (see Figure 4.4). A volume balance on the dispersed-phase gives: φ p Δh = φ p ( hc hs ) = hc H 0 (1 φ0 ).... (4.5) where φ p is the volume fraction of the dispersed phase in the dense-packed layer and φ 0 is the initial volume fraction of the dispersed phase. Substituting Eq. 4.5 and h p = h s into Eq. 4.1 and integrating with the boundary condition h c = h ci for t = t i, gives the variation of height of the coalescing interface h c after the inflexion point (t > t i ). h c ψ i ( t ti ) = ( 1 φ + Δ 0 ) H0 φ p hi exp... (4.6) φ p Δhi Sedimentation Profile: As the droplets sediment, the height of the sedimenting interface (i.e., the height of the clear layer of water) at the bottom of the batch separator increases with time. The volume fraction of the dispersion between the sedimenting interface and the bottom of the dispersed-packed layer also increases with time (see Figure 4.4), as presented next: Before the inflection point: The height of the sedimenting interface h s for the period 0 < t < t i is given by: hs t = v0 t ( v0 vi ) (4.7) ti 83
98 Using the dispersed phase volume balance, Eq. 4.5, a relationship can be established between the sedimentation velocity, v i and the maximum interfacial coalescence rate, ψ i. Differentiating Eq. 4.5 and substituting into Eq. 4.7, the sedimenting height before the inflection point is obtained as: h s = v ( 1 φ p ) t 0 t v0 ψ i φ p ti (4.8) After the inflection point: The height of the sedimenting interface h s as function of time is obtained by again using the volume balance presented in Eq. 4.5, in which h c is given by Eq. 4.6, namely, h s ψ i ( t ti ) = ( 1 φ Δ 0 ) H0 (1 φ p ) hi exp.... (4.9) φ p Δhi Determination of Intermediate Parameters: In order to obtain the coalescing and sedimenting profiles, intermediate parameters (V p, Δh i, ψ i, t i, v 0 ) are required for solving the corresponding equations 4.4, 4.6, 4.8, and 4.9. These parameters can be determined from the fundamental parameters, such as initial droplet diameter, d 0 and initial interfacial coalescing time, τ 0, as follows: Initial Sedimentation Velocity: This parameter can be estimated from equations, such as that of Kumar and Hartland (1985). It is applicable from viscous to turbulent flow regimes and is given by: 84
99 3 1 μ c 0.53 ρc Δρ g d0 (1 φ0 ) v = (4.10) 0.53 ρ 0.73 c d0 108 μc ( φ0 ) where Δρ is the density difference between phases. Eq. 4.10, although useful for the analysis of sedimentation velocity as a function of fluid properties and dispersed phase volume fraction, it may require improvements to include the effect of the shape of different distributions of droplets which may have the same average droplet size d 0. Authors such as Panoussopoulos et al. (1999) have reported good agreement between Eq with experimental data using PVC particles. However, they also suggest their results using liquid-liquid systems did not fit so well, probably due to inaccurate experimental results. Initial Interfacial Coalescence Time: The initial interfacial coalescence time τ 0 can be obtained based on the measured value of the interfacial coalescence rate ψ i at the inflection point and the expression derived by and Hartland (1998) ψ i = φ p Δh i 3τ 0, where Δ hi is the height of the dense-packed layer at the inflection point, namely, [ v φ + ψ (1 φ )] H0 φ p (1 φ0 ) 0 p i p ti τ 0 = (4.11) 3ψ (1 φ ) i p Alternatively, the initial interfacial coalescence time τ 0 for a given droplet diameter can be directly calculated from the equation derived by Jeelani and Hartland (1994), given by 4 3π μc r τ 0 = (4.1) 4(1 + m) F h cr 85
100 where F is the force acting on the drainage of the continuous-phase film of radius r and h cr is the critical film thickness at rupture condition. The surface mobility m is the sum of the mobilities due to induced circulation in the adjacent phases and interfacial tension gradient. For immobile surfaces, m = 0. For a droplet of diameter d 0 : F π 3 = d 0 Δρ g (4.13) 6 and the radius of the film r is estimated by (after Derjaguin and Kussakov, 1939): Δρ g r = d (4.14) 1σ where, σ is the interfacial tension. Also, the critical film thickness at rupture condition can be estimated from the equation of Vrij and Overbeek (1968) as: hcr π r A = H (4.15) 6 σ F where A H is the Hamaker constant. Intermediate parameters: The rate of decrease in the height of the boundary between the sedimentation and dense-packed zones can be calculated as: V p = H t i 0 v0 (1 φ p ) ψ i φ p..... (4.16) The height of the dense-packed layer at the inflection point is: Δh i 1 φ0 ) = H (1 φ ) ( 0 0 p v ti ψ i ti... (4.17) (1 φ ) φ p p 86
101 and the interfacial coalescence rate at the inflection point is given by: [ H (1 φ ) v t ] φ p i ψ i = (4.18) (1 φ )(3τ + t ) p 0 i Convergence equation: Since the values of the coalescing profiles before and after t i must be the same, the intermediate parameters must satisfy the following equation: (1 φ0 ) H (1 φ ) p 0 φ p v0 ti (1 φ ) p ψ i t i = H 0 V p t i Cce ψ i t ln(1 ψ V i i p... (4.19) ) where C ce is an adjustable empirical parameter approximate to Batch Separator Model for Polydispersed Systems Based on experimental observations in many applications, the dispersion sample obtained to be characterized with a batch separator is far from being monodispersed. Additionally, while characterizing devices similar to those tested by Barboza (00), binary droplet coalescence has been identified as a relevant phenomenon for liquid-liquid batch separation. Based on the need of studying the influence of different initial droplet size distributions on separation performance and also further studies on temporal evolution of polydispersed liquid-liquid systems, a model is proposed in this study, as presented next. The proposed model describes the separation profiles based on Jeelani and Hartland (1998). However, the interfacial coalescence rate is calculated using an expression that includes the effect of droplets of different sizes. Also, the initial sedimentation velocity is considered to be the result of the combined effect of a 87
102 distribution of droplets. The temporal evolution of the initial droplet size distribution is analyzed using a population balance approach, considering interface coalescence and binary coalescence Initial Droplet Size Distribution: The initial droplet size distribution has been solved by assuming one of the distribution functions available in the literature, such as the upper limit log-normal (ULLN) distribution. After the droplet size distribution function has been selected, an iterative procedure is performed in order to determine the parameters required to find a droplet size distribution with a corresponding Sauter mean diameter (d 3 ), equal to that obtained with the sedimentation velocity. The initial average droplet diameter d 0 is assumed to correspond to the Sauter mean diameter (d 3 ), which is defined as the diameter of a sphere that has the same volume/surface ratio as that of the entire population, that can be calculated as shown in Eq The characteristic average droplet diameter d 0 can be obtained from Eq which requires the fluid properties and v 0 as input data. The initial sedimentation velocity v 0 is obtained from the experimental sedimentation curve, which in the case of oil in water dispersion corresponds to the lower curve (see Figure 4.4). n i= 1 = n i= 1 i A d i 3 i A d d (4.0) i where A i is the droplets number fraction. 88
103 The droplet distribution used is the ULLN distribution. It is given by (after Simmons and Hanratty, 000): f v δ dmax ( d) = exp( δ z )..... (4.1) π d ( d d) max where: a d z = ln..... (4.) dmax d dmax dv50 a = (4.3) dv50 and f v is defined as the volume distribution function, d v50 is the volume median diameter and δ is the deviation about the mean. The relationship between the distribution as a function of the volume and the distribution as a function of the droplets number can be obtained as: Ai 3 di d di = fv, i ( d) ddi (4.4) Based on the equations shown above, the initial droplet size distribution can be solved after the maximum droplet size (d max ) has been determined. The maximum droplet size value depends on the kind of application being characterized (pipe flow, chokes, separators, etc.). The ULLN distribution has been selected given that with only one parameter (the deviation about the mean δ ) it is possible to find different distributions for a fixed droplet size range. Nevertheless, an iterative procedure is required for determining the droplet size distribution with the corresponding Sauter mean diameter (d 3 ), equal to that obtained with the sedimentation velocity d 0. 89
104 4.3.. Interfacial Coalescence Rate: In the Jeelani and Hartland (1998) model the interfacial coalescence rate is calculated based on a constant average droplet size diameter. Additionally, the separation profiles are function of the maximum coalescence rate at the inflection point. An expression for the interfacial coalescence rate is proposed in order to include the effect of the characteristics of a droplet size distribution while the droplets coalesce at the coalescing interface. t ch,1 t ch, t ch, t ch,i Figure 4.5. Droplets Arrangement at Coalescing Interface Figure 4.5 shows the assumed droplets arrangement at the coalescing interface. Eq. 4.5 is based on the assumption that the droplets of each size coalesce independently against the coalescing interface. Droplets coalescing on the side walls are not considered. Then, the interfacial coalescence rate ψ int is the rate at which droplets coalesce on a time basis given by the slowest coalescing droplet, namely tch, i ψ int = (4.5) C A int A v i int i where: 3 μc di t ch, i = (4.6) 4 σ 90
105 The term A int is the interfacial area, C int is an empirical parameter close to 1 and v i is the volume for a droplet d i. This expression (Eq. 4.5) is function of a characteristic time t ch, which is determined by the expression developed by Chesters (1991) for a parallel film model and fully mobile interfaces, assuming viscous dominating systems. However, Eq. 4.5 can be used with other models for the characteristic time t ch, depending on the system under study Temporal Evolution of Droplets: The population balance approach has been selected as the tool capable of describing the temporal evolution of the droplets in the batch separator at the level of detail required to analyze droplet-droplet coalescence and interfacial coalescence. In order to be able to use the population balance (Eqs..1 through.3), expressions equivalents to the ones used in Chapter and 3 for collision frequency and coalescence efficiency are required for the batch separation analysis. This approach allows to analyze the temporal evolution of a distribution of droplets during batch separation differing from previous models developed based on a constant average droplet size during separation. The analysis presented next is based on the study of the droplets in the densepacked zone assuming that the initial droplet size distribution is homogeneously disseminated. Also, the model is based on buoyancy as the main force pressing to drain the continuous phase film, but neglects the dense-packed zone height for the droplet temporal evolution analysis. The droplets contained in the dense-packed zone are already in contact with each other. Thus, the function ω ij rather than being function of a collision frequency is more likely to be a function of the number and sizes of droplets, for which 91
106 each droplet is exposed. In this study the function ω ij is called contact frequency when used to analyze droplets in the dense-packed zone. The expressions developed for ω ij and λ ij for binary coalescence should be used in the two main terms of the population balance, namely, the birth rate and the death rate. However, the expressions developed for ω ij and λ ij for interfacial coalescence should be used only in the death rate component, given that the coalescing interface is a sink for the droplets in the dense-packed zone. These terms are presented next: Contact Frequency ω ij : The term ω ij is assumed to have a similar form as that proposed by Zhang et al. (1995) for gravity collisions of droplets as shown in Eq However, instead of using the term for determining the relative velocity between the droplets, a coalescence rate term is used for binary coalescence or interface coalescence, depending on the case, based on the work of Jeelani et al. (005a). This is presented next: a) for binary coalescence: ω ij d d π i j = n i n j + ψ.... (4.7) d1 d d e d1 + d = (4.8) b) for interfacial coalescence: i ( d ) ψ ω = π n (4.9) i i d e = d (4.30) where: 9
107 ψ = d e φd 3τ (4.31) 3π μ c de h0 + c τ = ln... (4.3) 4F h + c f F π 3 (1 φd ) = d e Δρ g... (4.33) 6 n ( φd ) μc c = 0.6 de (4.34) μd In the equations above, h 0 and h f are the initial and final film thickness, respectively, and their values are assumed as those used by Jeelani et al. (005a). The term n is close to 1 and F is buoyancy force on the droplets. Eqs. 4.3 through 4.34 were developed based on the analysis of the drainage of the continuous phase film thickness for two spherical droplets of different sizes approaching and under the influence of a force F as mentioned by Jeelani et al. (005a). Coalescence Efficiency λ ij : The expression used in the present study is based on the work presented by Chesters (1991). Estimation of the coalescence efficiency λ ij is reduced to the determination of the time for which the droplets have been in contact t, and the use of the corresponding coalescence time given by Eq for the case of binary coalescence or interface coalescence, as τ λij = exp (4.35) t 93
108 Additional Modifications: Some of the experimental results obtained by Gomez-Markovich (006) presented conditions where the experimental sedimentation curve for the initial time is already above zero. This situation is not included in the initial assumption for the Jeelani and Hartland (1998) model, i.e., initial sedimentation height is zero, as can be observed in Figure 4.4. In order to be able to include these cases and improve the prediction of the separation profiles, a small modification of the sedimenting interface equation was done to accomplish this particular initial condition. Thus, Eq. 4.8 is modified as shown below. (1 φ ) p t s = v0 t v0 ψ i φ p ti h + h s0 (4.36) This modification implies additional modifications in some of the equations of the Jeelani and Hartland (1998) model, such as for V p (Eq. 4.16), Δh i (Eq. 4.17) and in the convergence equation (Eq. 4.18). The modified version of these equations is shown next. However, the use of this modification is only valid for small values of the initial sedimenting height h s0. Larger values of h s0 may require more fundamental modifications of the model. Intermediate parameters: The modified rate of decrease in the height of the boundary between the sedimentation and dense-packed zones can be calculated as: V p = H t i 0 v0 (1 φ p ) φ p ψ i h s0... (4.37) ti 94
109 The height of the dense-packed layer at the inflection point is: Δh i = (1 φ0 ) H (1 φ ) p 0 v0 ti ψ i t (1 φ ) φ p i p h s0.. (4.38) Convergence equation: The modified convergence equation can be determined from: (1 φ0 ) H (1 φ ) p 0 φ p v0 ti (1 φ ) p φ p hs0 ψ i t (1 φ ) p i = H 0 V p t i Cce ψ i t ln(1 ψ V i i p.. (4.39) ) Electrolyte Concentration: Another important parameter observed by Gomez-Markovich (006) is the effect of electrolyte concentration on the separation process. In order to take into account the effect of electrolytes on the coalescence time and interfacial coalescence rate, a new correlation is proposed to modify the expressions shown above (Eqs and 4.5). The correlation is based on the experimental results presented by Oolman and Blanch (1986) for NaCl. Although different kind of salts have different influence on the coalescence rate, the trend is similar but at different electrolyte concentrations. Hence, to study the effect of other salts, either similar correlations are required based on experimental data or development of a relationship between the effects of other electrolytes different than NaCl and the correlation obtained. Furthermore, Oolman and Blanch (1986) have also reported that the sharp transition concentration observed in Figure 4.6 for NaCl is very similar to other salt solutions if compared in terms of the total ionic concentration. The phenomena behind the effect of electrolytes on coalescence involves: the dynamics of the surface tension force pulling towards the center of the bubbles and droplets, the 95
110 intermolecular forces in the thin film between droplets resulting in an attracting Hamaker force and the surface tension force acting along the radial dimension of the film which is modified due to the presence of electrolytes. The presence of components such as electrolytes, through their surface activity, induces a surface tension gradient along the film surface, resulting in a force resisting film thinning. It is assumed that the effect of electrolytes on the coalescence rate can be used to obtain the increment in the coalescence time and the delay in the interfacial coalescence rate. Eq shows the correlation obtained where the subscript el is used to denote the value obtained after modifying the original results due to the presence of electrolytes at different concentrations, C el. A comparison between the correlation predictions and the experimental data presented by Oolman and Blanch (1986) for NaCl is shown in Figure 4.6. As can be observed, there is a good agreement between the correlation and the experimental data. This correlation was developed assuming that the coalescence rate is not affected by the presence of electrolytes until reaching a minimum value of 0.17 molar. After this concentration is reached, the correlation can be used to reproduce the effect of NaCl concentration on the coalescence process. τ el τ ψ = = 3.44 ln el + ψ el ( C ) (4.40) 96
111 % Coalescence molar concentration NaCl data Correlation Figure 4.6. Comparison between Experimental Data (Oolman and Blanch, 1986) and Correlation for Coalescence Frequency vs. NaCl Concentration Solution Procedure: The algorithm for the solution of the polydispersed systems model combined with the model by Jeelani and Hartland (1998) to obtain the initial droplet size distribution is presented in Figure 4.7 and the calculation of intermediate parameters algorithm is given in Figure 4.8. The solution showed is based on the equations derived by Jeelani and Hartland (1998) for the separation profiles. However, if the model is to be used with experimental data where the initial sedimenting height differs from zero, the appropriate modified equations should be used, as shown in the previous section (Eqs through 4.39). 97
112 Experimental data (h s, h c ) v 0 exp = dhs dt t= 0 v 0 (Eq. 4.10) = v 0 exp Solve for d 0 (d 3 =d 0 ) with Eq Assume ULLN distribution and guess δ (deviation about the mean) Generate droplet size distribution (Eq. 4.1) Calculate d 3 with Eq. 4.0 Store d 3 and δ values Y Is d 3 calculated (Eq. 4.0) = d 0? (Error 0.01%) Analyze temporal evolution of droplets and calculate ψ int (t) = Eq. 4.5 N Calculate intermediate parameters and separation profiles (Fig. 4.8) Figure 4.7. Algorithm for Solution of Model for Polydispersed Systems 98
113 Guess φ p from φ p = 0.99 to φ 0 Calculate parameters from Eq to 4.18 Calculate t i to satisfy Eq Compare model vs. data Eqs. 4.4, 4.6, 4.8, and ψ int (t) and calculate error Y Is calculated error reduced? N Store error, φ p and t i values Figure 4.8. Algorithm for Determination of Intermediate Parameters and Separation Profiles The initial droplet size distribution and the temporal evolution of this distribution are obtained, as explained in Figure 4.7. The temporal evolution of this distribution is analyzed, as presented previously using a population balance (Eqs..1 through.3) and Eqs. 4.7, 4.9 and The transitory values of the droplet size distribution allow obtaining the instantaneous values of the interfacial coalescence rate ψ int (t) by means of 99
114 Eq The separation profiles are obtained with the equations derived by Jeelani and Hartland (1998) but using the instantaneous values of the interfacial coalescence rate calculated (as explained above) instead of using the value at the inflection point as originally presented. 4.4 Comparison Between Model Predictions and Experimental Data This section presents comparisons between the predictions obtained using the models described in the previous section against experimental data for liquid-liquid batch separation CFD Simulations for Monodispersed Systems Nowadays, one of the most popular techniques used for analyzing multiphase problems is Computational Fluid Dynamics (CFD). This tool is applied to the liquidliquid batch separator in the present study, in order to test alternative solution procedures to those shown above. The results of the CFD simulations are compared against the experimental data obtained by Barboza (00), particularly for a case where a choke performance was analyzed utilizing a in. batch separator. Tables 4.1 through 4.3 present the main parameters for this experimental set, such as geometry and fluid properties. Further details of these experiments can be found in Barboza (00). Table 4.1. Geometry for Pipe Batch Separator used by Barboza (00) Trap height 53.5 cm Trap diameter cm 100
115 Table 4.. Properties of Water Phase (Barboza, 00) Density, ρ 1.0 ± g/cm 3 Viscosity, μ 1.35 ± 0.15 cp Table 4.3. Properties of Oil Phase (Barboza, 00) Typical Properties ASTM Test Method Tufflo 6016 Viscosity, 100ºF ( 00ºF ( 93.3ºC) Viscosity, 100ºF ( 00ºF ( 93.3ºC) Viscosity, cst D ºF (40ºC) D Gravity, ºAPI Specific 60ºF Density, g/cm 3 D 87 D The CFD code selected to analyze this problem is StarCD. In this code, a D model was utilized to reproduce the geometry of the batch separator tested by Barboza (00). Table 4.4 shows the main input parameters for the CFD model created using StarCD. 101


116 Table 4.4. Parameters for CFD Model Geometry D model Mode Transient Multiphase model Eulerian-Multiphase Number of cells 1800 Watercut 75% Initial average droplet size diameter 68 microns The CFD model considers a monodispersion of droplets and any effect due to coalescence is neglected. The results of this model are shown in Figure 4.9, where oil volume fraction profiles in the batch separator can be observed for different periods of time after the initial dispersion begins its separation process. Oil volume fraction: 1 s 5 s 10 s 100 s Figure 4.9. Batch Separator CFD Simulations Results for Oil Volume Fraction Evolution 10
Multiphase Flow and Heat Transfer
 Multiphase Flow and Heat Transfer ME546 -Sudheer Siddapureddy sudheer@iitp.ac.in Two Phase Flow Reference: S. Mostafa Ghiaasiaan, Two-Phase Flow, Boiling and Condensation, Cambridge University Press. http://dx.doi.org/10.1017/cbo9780511619410
MULTIDIMENSIONAL TURBULENCE SPECTRA - STATISTICAL ANALYSIS OF TURBULENT VORTICES
 Ninth International Conference on CFD in the Minerals and Process Industries CSIRO, Melbourne, Australia 10-12 December 2012 MULTIDIMENSIONAL TURBULENCE SPECTRA - STATISTICAL ANALYSIS OF TURBULENT VORTICES
Mechanistic model for four-phase sand/water/oil/gas stratified flow in horizontal pipes
 Computational Methods in Multiphase Flow VIII 335 Mechanistic model for four-phase sand/water/oil/gas stratified flow in horizontal pipes B. Moradi, M. Hossain & G. Oluyemi School of Engineering, Robert
CFD Simulation of Turbulent Flow Structure in Stratified Gas/Liquid Flow and Validation with Experimental Data
 SPE-174964-MS CFD Simulation of Turbulent Flow Structure in Stratified Gas/Liquid Flow and Validation with Experimental Data Ramin Dabirian, Amir Mansouri, Ram Mohan, and Ovadia Shoham, The University
FLOW PATTERN AND PRESSURE DROP IN HORIZONTAL VISCOUS OIL-WATER FLOWS
 HEFAT2014 10 th International Conference on Heat Transfer, Fluid Mechanics and Thermodynamics 14 16 July 2014 Orlando, Florida FLOW PATTERN AND PRESSURE DROP IN HORIZONTAL VISCOUS OIL-WATER FLOWS Castro
Investigation of slug flow characteristics in inclined pipelines
 Computational Methods in Multiphase Flow IV 185 Investigation of slug flow characteristics in inclined pipelines J. N. E. Carneiro & A. O. Nieckele Department of Mechanical Engineering Pontifícia Universidade
Modelling of Break-up and Coalescence in Bubbly Two-Phase Flows
 Modelling of Break-up and Coalescence in Bubbly Two-Phase Flows Simon Lo and Dongsheng Zhang CD-adapco, Trident Park, Didcot OX 7HJ, UK e-mail: simon.lo@uk.cd-adapco.com Abstract Numerical simulations
FLOW ASSURANCE: DROP COALESCENCE IN THE PRESENCE OF SURFACTANTS
 FLOW ASSURANCE: DROP COALESCENCE IN THE PRESENCE OF SURFACTANTS Vishrut Garg and Osman A. Basaran Davidson School of Chemical Engineering Purdue University With special thanks to: Krish Sambath (now at
One-dimensional modelling of mixing, dispersion and segregation of multiphase fluids flowing in pipelines
 One-dimensional modelling of mixing, dispersion and segregation of multiphase fluids flowing in pipelines by Antonino Tomasello A thesis submitted to Imperial College London in fulfilment of the requirements
CFD MODEL FOR DETERMINING LOCAL PHASE FRACTION OIL-WATER DISPERSION IN TURBULENT FLOW
 CFD MODEL FOR DETERMINING LOCAL PHASE FRACTION OIL-WATER DISPERSION IN TURBULENT FLOW Siti Aslina Hussain 1* and Soo Mee Khuan 1 1 Department of Chemical and Environment Engineering, Faculty of Engineering,
Mixing and Evaporation of Liquid Droplets Injected into an Air Stream Flowing at all Speeds
 Mixing and Evaporation of Liquid Droplets Injected into an Air Stream Flowing at all Speeds F. Moukalled* and M. Darwish American University of Beirut Faculty of Engineering & Architecture Mechanical Engineering
Modeling Complex Flows! Direct Numerical Simulations! Computational Fluid Dynamics!
 http://www.nd.edu/~gtryggva/cfd-course/! Modeling Complex Flows! Grétar Tryggvason! Spring 2011! Direct Numerical Simulations! In direct numerical simulations the full unsteady Navier-Stokes equations
A Simplified Mechanistic Model for an Oil/Water Horizontal Pipe Separator
 A Simplified Mechanistic Model for an Oil/Water Horizontal ipe Separator Eduardo ereyra, Ram Mohan, and Ovadia Shoham, University of Tulsa Summary A new methodology for oil/water horizontal pipe separator
Flerfasforskning vid Kemisk reaktionsteknik Chalmers. Bengt Andersson Love Håkansson Ronnie Andersson
 Flerfasforskning vid Kemisk reaktionsteknik Chalmers Bengt Andersson Love Håkansson Ronnie Andersson Mass transfer in turbulent boundary layers y + ()3effTDDDDKy+=+=+ >99% is transported by turbulence
On the Breakup of Fluid Particles in Turbulent Flows
 On the Breakup of Fluid Particles in Turbulent Flows Ronnie Andersson and Bengt Andersson Dept. of Chemical and Biological Engineering, Chalmers University of Technology, SE-41296, Gothenburg, Sweden DOI
Analysis of Frictional Pressure Drop based on Flow Regimes of Oil-water Flow in Pipeline
 Journal of Scientific & Industrial Research Vol. 74, March 2015, pp. 180-184 Analysis of Frictional Pressure Drop based on Flow Regimes of Oil-water Flow in Pipeline K R Naidu 1, T K Mandal 2 and S K Majumder
AGITATION AND AERATION
 AGITATION AND AERATION Although in many aerobic cultures, gas sparging provides the method for both mixing and aeration - it is important that these two aspects of fermenter design be considered separately.
Water Local Volume Fraction on Oil in Water Dispersion
 Journal of Applied Fluid Mechanics, Vol. 1, No. 2, pp. 57-63, 2008. Available online at www.jafmonline.net, ISSN 1735-3645. Water Local Volume Fraction on Oil in Water Dispersion Siti Aslina, Hussain 1,*,
On the breakup of an air bubble injected into a fully developed turbulent flow. Part 1. Breakup frequency
 J. Fluid Mech. (1999), vol. 401, pp. 157 182. Printed in the United Kingdom c 1999 Cambridge University Press 157 On the breakup of an air bubble injected into a fully developed turbulent flow. Part 1.
Module 3: "Thin Film Hydrodynamics" Lecture 12: "" The Lecture Contains: Linear Stability Analysis. Some well known instabilities. Objectives_template
 The Lecture Contains: Linear Stability Analysis Some well known instabilities file:///e /courses/colloid_interface_science/lecture12/12_1.htm[6/16/2012 1:39:16 PM] Linear Stability Analysis This analysis
Euler-Euler Modeling of Mass-Transfer in Bubbly Flows
 Euler-Euler Modeling of Mass-Transfer in Bubbly Flows Roland Rzehak Eckhard Krepper Text optional: Institutsname Prof. Dr. Hans Mustermann www.fzd.de Mitglied der Leibniz-Gemeinschaft Overview Motivation
Contents. I Introduction 1. Preface. xiii
 Contents Preface xiii I Introduction 1 1 Continuous matter 3 1.1 Molecules................................ 4 1.2 The continuum approximation.................... 6 1.3 Newtonian mechanics.........................
Table of Contents. Preface... xiii
 Preface... xiii PART I. ELEMENTS IN FLUID MECHANICS... 1 Chapter 1. Local Equations of Fluid Mechanics... 3 1.1. Forces, stress tensor, and pressure... 4 1.2. Navier Stokes equations in Cartesian coordinates...
Chapter 7. Pickering Stabilisation ABSTRACT
 Chapter 7 Pickering Stabilisation ABSTRACT In this chapter we investigate the interfacial properties of Pickering emulsions. Based upon findings that indicate these emulsions to be thermodynamically stable,
Fluid Flow, Heat Transfer and Boiling in Micro-Channels
 L.P. Yarin A. Mosyak G. Hetsroni Fluid Flow, Heat Transfer and Boiling in Micro-Channels 4Q Springer 1 Introduction 1 1.1 General Overview 1 1.2 Scope and Contents of Part 1 2 1.3 Scope and Contents of
Electrocoalescence a multi-disiplinary arena
 Electrocoalescence a multi-disiplinary arena Electrical Engineering SINTEF Chemistry ELECTRO- COALESCENCE Physics NTNU CNRS Fluid Dynamics 1 Electrocoalescence project Need for smaller working equipment
T H E U N I V E R S I T Y O F T U L S A THE GRADUATE SCHOOL DISPERSED TWO-PHASE SWIRLING FLOW CHARACTERIZATION FOR PREDICTING GAS CARRY-UNDER
 T H E U N I V E R S I T Y O F T U L S A THE GRADUATE SCHOOL DISPERSED TWO-PHASE SWIRLING FLOW CHARACTERIZATION FOR PREDICTING GAS CARRY-UNDER IN GAS-LIQUID CYLINDRICAL CYCLONE COMPACT SEPARATORS by Luis
Experimental Investigation of Three-Phase Low-Liquid-Loading Flow
 Experimental Investigation of Three-Phase Low-Liquid-Loading Flow Hamidreza Karami, Carlos F. Torres, Eduardo Pereyra, and Cem Sarica, University of Tulsa Summary An experimental study is conducted by
(2.1) Is often expressed using a dimensionless drag coefficient:
 Is often expressed using a dimensionless drag coefficient:") 1. Introduction Multiphase materials occur in many fields of natural and engineering science, industry, and daily life. Biological materials such as blood or cell suspensions, pharmaceutical or food products,
1. Introduction Multiphase materials occur in many fields of natural and engineering science, industry, and daily life. Biological materials such as blood or cell suspensions, pharmaceutical or food products,
Conference paper: Analytical Investigation by Using the Two-fluid-model to Study the Interfacial Behavior of Air-water Horizontal Stratified Flow
 Conference paper: Analytical Investigation by Using the Two-fluid-model to Study the Interfacial Behavior of Air-water Horizontal Stratified Flow Authors: Hadiyan Yusuf Kuntoro; Deendarlianto; Indarto
MASS TRANSFER EFFICIENCY IN SX MIXERS
 MASS TRANSFER EFFICIENCY IN SX MIXERS By R. Sheinman, Y. Kootov, L. Braginsy, J. Riordan, M. Vancas Turbulent Technologies Ltd. Israel Tenova Bateman Advanced Technologies Ltd. Israel, Australia ABSTRACT
DEVELOPMENT OF A MULTIPLE VELOCITY MULTIPLE SIZE GROUP MODEL FOR POLY-DISPERSED MULTIPHASE FLOWS
 DEVELOPMENT OF A MULTIPLE VELOCITY MULTIPLE SIZE GROUP MODEL FOR POLY-DISPERSED MULTIPHASE FLOWS Jun-Mei Shi, Phil Zwart 1, Thomas Frank 2, Ulrich Rohde, and Horst-Michael Prasser 1. Introduction Poly-dispersed
EVALUATION OF SLUDGE REMOVAL CAPABILITIES FOR ADMP MIXER IN TANK 18
 WSRC-TR-2003-00166 KEYWORDS: Sludge Suspension Computational Approach Sludge Mixing Jet Flow Model Mixing Pump Model RETENTION - Permanent EVALUATION OF SLUDGE REMOVAL CAPABILITIES FOR ADMP MIXER IN TANK
Principles of Convective Heat Transfer
 Massoud Kaviany Principles of Convective Heat Transfer Second Edition With 378 Figures Springer Contents Series Preface Preface to the Second Edition Preface to the First Edition Acknowledgments vii ix
Geometrical and kinematic properties of interfacial waves in horizontal heavy oil-water stratified flow
 Computational Methods in Multiphase Flow VI 227 Geometrical and kinematic properties of interfacial waves in horizontal heavy oil-water stratified flow M. S. de Castro, C. C. Pereira, J. N. dos Santos
Piping Systems and Flow Analysis (Chapter 3)
") Piping Systems and Flow Analysis (Chapter 3) 2 Learning Outcomes (Chapter 3) Losses in Piping Systems Major losses Minor losses Pipe Networks Pipes in series Pipes in parallel Manifolds and Distribution
Piping Systems and Flow Analysis (Chapter 3) 2 Learning Outcomes (Chapter 3) Losses in Piping Systems Major losses Minor losses Pipe Networks Pipes in series Pipes in parallel Manifolds and Distribution
Capillarity and Wetting Phenomena
 ? Pierre-Gilles de Gennes Frangoise Brochard-Wyart David Quere Capillarity and Wetting Phenomena Drops, Bubbles, Pearls, Waves Translated by Axel Reisinger With 177 Figures Springer Springer New York Berlin
Examination of Existing Correlation for Wave Velocity in Horizontal Annular Flow
 Examination of Existing Correlation for Wave Velocity in Horizontal Annular Flow Andriyanto Setyawan 1, Indarto 2, Deendarlianto 2, Prasetyo 3, Agus Suandi 4 Department of Refrigeration and Air Conditioning
On the breakup of an air bubble injected into a fully developed turbulent flow. Part 2. Size PDF of the resulting daughter bubbles
 J. Fluid Mech. (1999), vol. 41, pp. 183 27. Printed in the United Kingdom c 1999 Cambridge University Press 183 On the breakup of an air bubble injected into a fully developed turbulent flow. Part 2. Size
Modelling of dispersed, multicomponent, multiphase flows in resource industries. Section 3: Examples of analyses conducted for Newtonian fluids
 Modelling of dispersed, multicomponent, multiphase flows in resource industries Section 3: Examples of analyses conducted for Newtonian fluids Globex Julmester 017 Lecture # 04 July 017 Agenda Lecture
Floc Strength Scale-Up: A Practical Approach
 Floc Strength Scale-Up: A Practical Approach Dr Mick Dawson Mr Brian Perkins Process Director mdawson@bhrgroup.co.uk 25 th October 2011 BHR Group 2011 BHR Group is a trading name of VirtualPiE Limited
Considerations on bubble fragmentation models
 J. Fluid Mech. 21), vol. 661, pp. 159 177. c Cambridge University Press 21 doi:1.117/s2211213186 159 Considerations on bubble fragmentation models C. MARTÍNEZ-BAZÁN 1, J. RODRÍGUEZ-RODRÍGUEZ 2, G. B. DEANE
Mechanistic Modeling of Upward Gas-Liquid Flow in Deviated Wells
 Advances in Petroleum Exploration and Development Vol. 9, No., 015, pp. 53-57 DOI:10.3968/6659 ISSN 195-54X [Print] ISSN 195-5438 [Online] www.cscanada.net www.cscanada.org SUN Shihui [a],* ; YAN Tie [a]
Preparation and Characterization of Oil-in-Water and Water-in-Oil Emulsions. Prepared. For
 1 Preparation and Characterization of Oil-in-Water and Water-in-Oil Emulsions Prepared For Dr. Reza Foudazi, Ph.D. Chemical and Materials Engineering New Mexico State University By Muchu Zhou May 10, 2016
Simulation Studies of Phase Inversion in Agitated Vessels Using a Monte Carlo Technique
 Journal of Colloid and Interface Science 48, 443 454 (00) doi:10.1006/jcis.001.8159, available online at http://www.idealibrary.com on Simulation Studies of Phase Inversion in Agitated Vessels Using a
Slurry Pump Mixing Effectiveness in Tank 50H
 WSRC-STI-2008-00151 Si Young Lee and Richard A. Dimenna February 2008 Washington Savannah River Company Savannah River National Laboratory Aiken, SC 29808 Prepared for the U.S. Department of Energy Under
The characterization of uncertainty for steady state multiphase flow models in pipelines
 The characterization of uncertainty for steady state multiphase flow models in pipelines Master Thesis Solid & Fluid Mechanics, Faculty of Mechanical Engineering J. M. Klinkert The characterization of
Fluid Mechanics Introduction
 Fluid Mechanics Introduction Fluid mechanics study the fluid under all conditions of rest and motion. Its approach is analytical, mathematical, and empirical (experimental and observation). Fluid can be
Severe slugging: modeling, simulation and stability criteria
 Severe slugging: modeling, simulation and stability criteria Jorge Luis Baliño jlbalino@usp.br Departamento de Engenharia Mecânica Escola Politécnica Outline Introduction Air-water model Simulation results
Simulations of dispersed multiphase flow at the particle level
 Simulations of dispersed multiphase flow at the particle level Jos Derksen Chemical Engineering Delft University of Technology Netherlands j.j.derksen@tudelft.nl http://homepage.tudelft.nl/s0j2f/ Multiphase
INTERACTION OF AN AIR-BUBBLE DISPERSED PHASE WITH AN INITIALLY ISOTROPIC TURBULENT FLOW FIELD
 3rd Workshop on Transport Phenomena in Two-Phase Flow Nessebar, Bulgaria, 2-7 September 1998, p.p. 133-138 INTERACTION OF AN AIR-BUBBLE DISPERSED PHASE WITH AN INITIALLY ISOTROPIC TURBULENT FLOW FIELD
Measurements of Dispersions (turbulent diffusion) Rates and Breaking up of Oil Droplets in Turbulent Flows
 Rates and Breaking up of Oil Droplets in Turbulent Flows") Measurements of Dispersions (turbulent diffusion) Rates and Breaking up of Oil Droplets in Turbulent Flows Balaji Gopalan PI: Dr Joseph Katz Where do we come in? Turbulent diffusion of slightly buoyant
Measurements of Dispersions (turbulent diffusion) Rates and Breaking up of Oil Droplets in Turbulent Flows Balaji Gopalan PI: Dr Joseph Katz Where do we come in? Turbulent diffusion of slightly buoyant
Investigation of Packing Effect on Mass Transfer Coefficient in a Single Drop Liquid Extraction Column
 Iranian Journal of Chemical Engineering Vol. 7, No. 4 (Autumn), 2010, IAChE Investigation of Packing Effect on Mass Transfer Coefficient Z. Azizi, A. Rahbar, H. Bahmanyar Engineering College, Chemical
Chapter 6 Pneumatic Transport
 Chapter 6 Pneumatic Transport 6.1 Pneumatic Transport Use of a gas to transport a particulate solid through pipeline Powder Rotary valve Blower Three major variables for pneumatic conveying - solid mass
Experimental and Numerical Investigation of Two- Phase Flow through Enlarging Singularity
 Purdue University Purdue e-pubs International Refrigeration and Air Conditioning Conference School of Mechanical Engineering 212 Experimental and Numerical Investigation of Two- Phase Flow through Enlarging
heat transfer process where a liquid undergoes a phase change into a vapor (gas)
") Two-Phase: Overview Two-Phase two-phase heat transfer describes phenomena where a change of phase (liquid/gas) occurs during and/or due to the heat transfer process two-phase heat transfer generally considers
Two-Phase: Overview Two-Phase two-phase heat transfer describes phenomena where a change of phase (liquid/gas) occurs during and/or due to the heat transfer process two-phase heat transfer generally considers
IHTC DRAFT MEASUREMENT OF LIQUID FILM THICKNESS IN MICRO TUBE ANNULAR FLOW
 DRAFT Proceedings of the 14 th International Heat Transfer Conference IHTC14 August 8-13, 2010, Washington D.C., USA IHTC14-23176 MEASUREMENT OF LIQUID FILM THICKNESS IN MICRO TUBE ANNULAR FLOW Hiroshi
meters, we can re-arrange this expression to give
 Turbulence When the Reynolds number becomes sufficiently large, the non-linear term (u ) u in the momentum equation inevitably becomes comparable to other important terms and the flow becomes more complicated.
Fluid Mechanics Prof. T.I. Eldho Department of Civil Engineering Indian Institute of Technology, Bombay. Lecture - 17 Laminar and Turbulent flows
 Fluid Mechanics Prof. T.I. Eldho Department of Civil Engineering Indian Institute of Technology, Bombay Lecture - 17 Laminar and Turbulent flows Welcome back to the video course on fluid mechanics. In
Fluid Structure Interaction Analysis of Two-Phase Flow in an M-shaped Jumper. Star Global Conference University of Houston
 Fluid Structure Interaction Analysis of Two-Phase Flow in an M-shaped Jumper Star Global Conference 2012 University of Houston College of Technology Mechanical Engineering Technology Leonardo Chica January
Solid-Particles Flow Regimes in Air/Water Stratified Flow in a Horizontal Pipeline
 Solid-Particles Flow Regimes in Air/Water Stratified Flow in a Horizontal Pipeline Ramin Dabirian, Ram S. Mohan, and Ovadia Shoham, The University of Tulsa, and Gene Kouba, Chevron (retired) Summary The
AIRLIFT BIOREACTORS. contents
 AIRLIFT BIOREACTORS contents Introduction Fluid Dynamics Mass Transfer Airlift Reactor Selection and Design 1 INTRODUCTION airlift reactor (ALR) covers a wide range of gas liquid or gas liquid solid pneumatic
Explicit algebraic Reynolds stress models for internal flows
 5. Double Circular Arc (DCA) cascade blade flow, problem statement The second test case deals with a DCA compressor cascade, which is considered a severe challenge for the CFD codes, due to the presence
THE UNIVERSITY OF TULSA THE GRADUATE SCHOOL APPLICATION OF COMPUTATIONAL FLUID DYNAMICS (CFD) TO FLOW
 TO FLOW") THE UNIVERSITY OF TULSA THE GRADUATE SCHOOL APPLICATION OF COMPUTATIONAL FLUID DYNAMICS (CFD) TO FLOW SIMULATION AND EROSION PREDICTION IN SINGLE-PHASE AND MULTIPHASE FLOW by Xianghui Chen A dissertation
THE UNIVERSITY OF TULSA THE GRADUATE SCHOOL APPLICATION OF COMPUTATIONAL FLUID DYNAMICS (CFD) TO FLOW SIMULATION AND EROSION PREDICTION IN SINGLE-PHASE AND MULTIPHASE FLOW by Xianghui Chen A dissertation
Contents. Preface XIII. 1 General Introduction 1 References 6
 VII Contents Preface XIII 1 General Introduction 1 References 6 2 Interparticle Interactions and Their Combination 7 2.1 Hard-Sphere Interaction 7 2.2 Soft or Electrostatic Interaction 7 2.3 Steric Interaction
Turbulence - Theory and Modelling GROUP-STUDIES:
 Lund Institute of Technology Department of Energy Sciences Division of Fluid Mechanics Robert Szasz, tel 046-0480 Johan Revstedt, tel 046-43 0 Turbulence - Theory and Modelling GROUP-STUDIES: Turbulence
CHAM Case Study CFD Modelling of Gas Dispersion from a Ruptured Supercritical CO 2 Pipeline
 CHAM Limited Pioneering CFD Software for Education & Industry CHAM Case Study CFD Modelling of Gas Dispersion from a Ruptured Supercritical CO 2 Pipeline 1. INTRODUCTION This demonstration calculation
c 2011 JOSHUA DAVID JOHNSTON ALL RIGHTS RESERVED
 c 211 JOSHUA DAVID JOHNSTON ALL RIGHTS RESERVED ANALYTICALLY AND NUMERICALLY MODELING RESERVOIR-EXTENDED POROUS SLIDER AND JOURNAL BEARINGS INCORPORATING CAVITATION EFFECTS A Dissertation Presented to
FACULTY OF CHEMICAL & ENERGY ENGINEERING FLUID MECHANICS LABORATORY TITLE OF EXPERIMENT: MINOR LOSSES IN PIPE (E4)
") FACULTY OF CHEMICAL & ENERGY ENGINEERING FLUID MECHANICS LABORATORY TITLE OF EXPERIMENT: MINOR LOSSES IN PIPE (E4) 1 1.0 Objectives The objective of this experiment is to calculate loss coefficient (K
FACULTY OF CHEMICAL & ENERGY ENGINEERING FLUID MECHANICS LABORATORY TITLE OF EXPERIMENT: MINOR LOSSES IN PIPE (E4) 1 1.0 Objectives The objective of this experiment is to calculate loss coefficient (K
Chapter 10: Boiling and Condensation 1. Based on lecture by Yoav Peles, Mech. Aero. Nuc. Eng., RPI.
 Chapter 10: Boiling and Condensation 1 1 Based on lecture by Yoav Peles, Mech. Aero. Nuc. Eng., RPI. Objectives When you finish studying this chapter, you should be able to: Differentiate between evaporation
AN014e. Non-standard geomtries for rheological characterization of complex fluids. A. Franck, TA Instruments Germany
 Non-standard geomtries for rheological characterization of complex fluids A. Franck, TA Instruments Germany AN14e Keywords: systemic rheology, rheo-reactor, s, product formulation, s, bitumen, Couette
Breakage of Single Droplets in 2-D Turbulent Flows
 UM - HSMRP Breakage of Single Droplets in 2-D Turbulent Flows Derrick I. Ko* and Richard V. Calabrese University of Maryland College Park, MD 2742-2111 USA DOMINO-HSMRP Project Meetings 24 May 217 Project
A STUDY ON SLUG INDUCED STRESSES USING FILE-BASED COUPLING TECHNIQUE
 A STUDY ON SLUG INDUCED STRESSES USING FILE-BASED COUPLING TECHNIQUE Abdalellah O. Mohmmed, Mohammad S. Nasif and Hussain H. Al-Kayiem Department of Mechanical Engineering, Universiti Teknologi Petronas,
Detailed Outline, M E 320 Fluid Flow, Spring Semester 2015
 Detailed Outline, M E 320 Fluid Flow, Spring Semester 2015 I. Introduction (Chapters 1 and 2) A. What is Fluid Mechanics? 1. What is a fluid? 2. What is mechanics? B. Classification of Fluid Flows 1. Viscous
Stability of stratified two-phase flows in inclined channels
 Stability of stratified two-phase flows in inclined channels I. Barmak a), A. Yu. Gelfgat, A. Ullmann, and N. Brauner School of Mechanical Engineering, Tel Aviv University, Tel Aviv 69978, Israel Linear
Simulation of T-junction using LBM and VOF ENERGY 224 Final Project Yifan Wang,
 Simulation of T-junction using LBM and VOF ENERGY 224 Final Project Yifan Wang, yfwang09@stanford.edu 1. Problem setting In this project, we present a benchmark simulation for segmented flows, which contain
Signature: (Note that unsigned exams will be given a score of zero.)
") Neatly print your name: Signature: (Note that unsigned exams will be given a score of zero.) Circle your lecture section (-1 point if not circled, or circled incorrectly): Prof. Dabiri Prof. Wassgren Prof.
Neatly print your name: Signature: (Note that unsigned exams will be given a score of zero.) Circle your lecture section (-1 point if not circled, or circled incorrectly): Prof. Dabiri Prof. Wassgren Prof.
150A Review Session 2/13/2014 Fluid Statics. Pressure acts in all directions, normal to the surrounding surfaces
 Fluid Statics Pressure acts in all directions, normal to the surrounding surfaces or Whenever a pressure difference is the driving force, use gauge pressure o Bernoulli equation o Momentum balance with
A NEW DISPERSIVE AND DISTRIBUTIVE STATIC MIXER FOR THE COMPOUNDING OF HIGHLY VISCOUS MATERIALS
 A NEW DISPERSIVE AND DISTRIBUTIVE STATIC MIXER FOR THE COMPOUNDING OF HIGHLY VISCOUS MATERIALS Paul Gramann and Bruce Davis, The Madison Group: PPRC. Tim Osswald, University of Wisconsin-Madison Chris
R =! Aco! What is formulation?
 1 / 36! AIChE 1rst International Conference on Upstream Engineering and Flow Assurance Houston April 1-4, 2012 2 / 36! Physico-chemical Formulation! Emulsion Properties vs Formulation! Applications! Jean-Louis
Microfluidics 1 Basics, Laminar flow, shear and flow profiles
 MT-0.6081 Microfluidics and BioMEMS Microfluidics 1 Basics, Laminar flow, shear and flow profiles 11.1.2017 Ville Jokinen Outline of the next 3 weeks: Today: Microfluidics 1: Laminar flow, flow profiles,
Supplementary table I. Table of contact angles of the different solutions on the surfaces used here. Supplementary Notes
 1 Supplementary Figure 1. Sketch of the experimental setup (not to scale) : it consists of a thin mylar sheet (0, 02 4 3cm 3 ) held fixed vertically. The spacing y 0 between the glass plate and the upper
STRATIFIED WATER-OIL-GAS FLOW THROUGH HORIZONTAL PIPES
 TRTIFIED TER-I-G F THRUGH HRIZNT PIPE Prof. Dr. Zeiad. R. swad Dr. ameera M. Hamad-llah M c. Faaiz H. R. lzubaidi Baghdad University Engineering Collage Petroleum Engineering Department BTRCT tratified
Contribution of inter-particle collisions on kinetic energy modification in a turbulent channel flow
 Contribution of inter-particle collisions on kinetic energy modification in a turbulent channel flow Valentina Lavezzo a, Alfredo Soldati a,b a Dipartimento di Energetica e Macchine and b Centro Interdipartimentale
Fig.8-1 Scheme of the fluidization column
 8 Fluidization Lenka Schreiberová, Martin Kohout I Basic relations and definitions Fluidization is a process where the liquid flows in opposite direction the gravitation and creates a suspension together
Convective Mass Transfer
 Convective Mass Transfer Definition of convective mass transfer: The transport of material between a boundary surface and a moving fluid or between two immiscible moving fluids separated by a mobile interface
NUMERICAL SIMULATION OF FLUID FLOW BEHAVIOUR ON SCALE UP OF OSCILLATORY BAFFLED COLUMN
 Journal of Engineering Science and Technology Vol. 7, No. 1 (2012) 119-130 School of Engineering, Taylor s University NUMERICAL SIMULATION OF FLUID FLOW BEHAVIOUR ON SCALE UP OF OSCILLATORY BAFFLED COLUMN
Stability of stratified two-phase flows in horizontal channels
 Stability of stratified two-phase flows in horizontal channels I. Barmak a), A. Gelfgat, H. Vitoshkin, A. Ullmann, and N. Brauner School of Mechanical Engineering, Tel Aviv University, Tel Aviv 69978,
PHYS 432 Physics of Fluids: Instabilities
 PHYS 432 Physics of Fluids: Instabilities 1. Internal gravity waves Background state being perturbed: A stratified fluid in hydrostatic balance. It can be constant density like the ocean or compressible
Contents. Preface XI Symbols and Abbreviations XIII. 1 Introduction 1
 V Contents Preface XI Symbols and Abbreviations XIII 1 Introduction 1 2 Van der Waals Forces 5 2.1 Van der Waals Forces Between Molecules 5 2.1.1 Coulomb Interaction 5 2.1.2 Monopole Dipole Interaction
Modelling multiphase flows in the Chemical and Process Industry
 Modelling multiphase flows in the Chemical and Process Industry Simon Lo 9/11/09 Contents Breakup and coalescence in bubbly flows Particle flows with the Discrete Element Modelling approach Multiphase
ENVR 116 Introduction to Aerosol Science December 17, 2001 FINAL EXAMINATION
 ENVR 116 Introduction to Aerosol Science December 17, 2001 FINAL EXAMINATION Please answer all questions on the attached sheets Answer Question No. 1 and 4 of the remaining 6 questions. No extra credit
Answers to questions in each section should be tied together and handed in separately.
 EGT0 ENGINEERING TRIPOS PART IA Wednesday 4 June 014 9 to 1 Paper 1 MECHANICAL ENGINEERING Answer all questions. The approximate number of marks allocated to each part of a question is indicated in the
ROLE OF THE VERTICAL PRESSURE GRADIENT IN WAVE BOUNDARY LAYERS
 ROLE OF THE VERTICAL PRESSURE GRADIENT IN WAVE BOUNDARY LAYERS Karsten Lindegård Jensen 1, B. Mutlu Sumer 1, Giovanna Vittori 2 and Paolo Blondeaux 2 The pressure field in an oscillatory boundary layer
A Coupled VOF-Eulerian Multiphase CFD Model To Simulate Breaking Wave Impacts On Offshore Structures
 A Coupled VOF-Eulerian Multiphase CFD Model To Simulate Breaking Wave Impacts On Offshore Structures Pietro Danilo Tomaselli Ph.d. student Section for Fluid Mechanics, Coastal and Maritime Engineering
Model Studies on Slag-Metal Entrainment in Gas Stirred Ladles
 Model Studies on Slag-Metal Entrainment in Gas Stirred Ladles Anand Senguttuvan Supervisor Gordon A Irons 1 Approach to Simulate Slag Metal Entrainment using Computational Fluid Dynamics Introduction &
FIV INFLUENCE BEND RADIUS ON MULTIPHASE FLOW INDUCED FORCES ON A BEND STRUCTURE
 Proceedings of the 9th International Symposium on Fluid-Structure Interactions, Flow-Sound Interactions, Flow-Induced Vibration & Noise July 8-11, 2018, Toronto, Ontario, Canada FIV2018-91 INFLUENCE BEND
AER1310: TURBULENCE MODELLING 1. Introduction to Turbulent Flows C. P. T. Groth c Oxford Dictionary: disturbance, commotion, varying irregularly
 1. Introduction to Turbulent Flows Coverage of this section: Definition of Turbulence Features of Turbulent Flows Numerical Modelling Challenges History of Turbulence Modelling 1 1.1 Definition of Turbulence
Turbulence is a ubiquitous phenomenon in environmental fluid mechanics that dramatically affects flow structure and mixing.
 Turbulence is a ubiquitous phenomenon in environmental fluid mechanics that dramatically affects flow structure and mixing. Thus, it is very important to form both a conceptual understanding and a quantitative
Experimental Study on Phase Inversion in Liquid
 Experimental Study on Phase Inversion in Liquid liquid Batch System Abstract In many industrial processes involving liquid-liquid dispersions, the phenomenon of phase inversion will be encountered. The