Sampling Distributions and the Central Limit Theorem. Definition
|
|
|
- Patricia Golden
- 6 years ago
- Views:
Transcription
1 Sampling Distributions and the Central Limit Theorem We have been studying the relationship between the mean of a population and the values of a random variable. Now we will study the relationship between a population mean and the means of samples taken from the population. Definition A sampling distribution is the probability distribution of a sample statistic that is formed when samples of size n are repeatedly taken from a population. If the sample statistic is the sample mean, then the distribution is the sampling distribution of sample means. Every sample statistic has a sampling distribution. Page 26, look at the Venn diagram. the rectangle represents a large population and each circle represents a sample of size n. Because the sample entries can differ, so can the sample means. Properties of Sampling Distributions of Sample Means. The mean of the sample means is equal to the population mean μ 2. The standard deviation of the sample mean is equal to the population standard deviation σ divided by the square root of the sample size n. The standard deviation of the sampling distribution of the sample means is called the standard error of the mean.


2 You write the population values {,,,7} on slips of paper and put them in a box. Then you randomly choose two slips of paper, with replacement. List all possible samples of size n =2 and calculate the mean of each of each. These means form the sampling distributions of the sample means. Find the mean, variance, and standard deviation of the sample means. Compare your results with the mean μ =, variance σ 2 =, and standard deviation σ = of the population. Sample sample mean, x Sample sample mean, x,,..7,,,,7 2 2,,,,7 7, 7, 7, 7, Make a probability distribution of the sample means, draw a histogram of the probabilities. x f probability /6 = /6 = 0.20 /6 = 0.87 /6 = /6 = /6 = 0.20 /6 =
3 Using the properties of sampling distributions of sample means, we get: List all possible samples of size n =, with replacement, from the population {,,}. Calculate the mean of each sample. Find the mean, variance, and standard deviation of the sample means. Compare your results with the mean μ =, variance σ 2 = 8/, and standard deviation σ = 8/.6 of the population. Sample Sample mean, x Sample Sample mean, x,,,,,,,,,,,,,,,,,,,,,,,,,,,,,, ,,,,,,,,,,,,,,,,,,,,,,,, Probability /27=0.070 /27=0. 6/27= /27=0.29 6/27= /27=0. /27=0.070


4
5 THE CENTRAL LIMIT THEOREM. If samples of size n, where n 0, are drawn from any population with a mean μ and a standards deviation σ, then the sampling distribution of the sample means approximates a normal distribution. The greater the sample size, the better the approximation. (See figures for "Any Population Distribution on next page) 2. If the population itself is normally distributed, then the sampling distribution of sample means is normally distributed for any sample size n. (See figures for "Normal Population Distribution" on next page) In either case, the sampling distribution of sample means has a mean equal to the population mean. mean of the sample means The sampling distribution of the sample means has a value equal to /n times the variance of the population and a standard deviation equal to the population standard deviation divided by the square root of n. Standard deviation of the Variance of the sample means sample means Remember that the standard deviation of the sampling distribution of the sample means,, is also called the standard error of the mean.
6 . Any Population Distribution Standard deviation 2. Normal Population Distribution Standard deviatio Mean Distribution of Sample means, n 0 standard deviation of the sample means Mean Distribution of Sample Means (any n) standard deviation of the sample means mean mean 6
7 EXAMPLE: Cell phone bills for residents of a city have a mean of $7 of $9, as shown in the figure. Random samples of 00 cell phone bills are drawn from this population, and the mean of each sample is determined. Find the mean and standard deviation of the sampling distribution of the sample means. Then sketch a graph of the sampling distribution. The mean of the sampling distribution is equal to the population mean. So, The standard deviation of the sample means is equal to the population standard deviation divided by n. So, 7

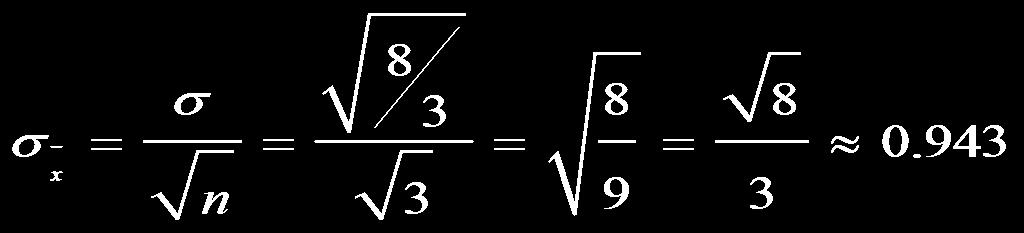
8 Because the sample size is greater than 0, the sampling distribution can be approximated by a normal distribution with a mean of $7 and a standard deviation of $0.90. Assume the training heart rates of all 20 year old athletes are normally distributes, with a mean of beats per minute and a standard deviation of 8 beats per minute. Random samples of size are drawn from the population, and the mean sample is determined. Find the mean and standard deviation of the sampling distribution of the sampling means. Then sketch a graph of the sampling distribution. The sampling mean is and the standard deviation of the sample means is 9. So the graph should look like: 8

9 PROBABILITY AND THE CENTRAL LIMIT THEOREM In section.2, you learned how to find the probability that a random variable x will lie in a given interval of population values. We can find the probability that a sample mean x will lie in a given interval of the x sampling distribution. To transform x to a z score, you can use the formula EXAMPLE P. 266 The figure on P. 266 show the lengths of time people spend driving each day. You randomly select 0 drivers ages to 9. What is the probability that the mean time they spend driving each day is between 2.7 and 2. minutes. Assume σ =.. (a) Since we need to find the probability between 2.7 and 2., we must find both z scores. 9
10 We are trying to find the probability that the drivers are between 2.7 and 2. minutes. This means that of the samples of 0 drivers ages to 9, about 9% will have a drive time that is between 2.7 and 2. minutes. You randomly select 00 drivers ages to 9 from the chart on page 266. What is the probability that the mean time they spend driving each day is between 2.7 and 2. minutes? Use μ = 2 and σ =.. 0

11 The mean room and board expense per year at four year colleges is $926. You randomly select 9 four year colleges. What is the probability that the mean room and board is less than $900? Assume that the room and board expenses are normally distributed with a standard deviation of $00.
12 The average credit card debt carried by undergraduates is normally distributed, with a mean of $7 and a standard deviation of $20. (a) What is the probability that a randomly selected undergraduate, who is a credit card holder, has a credit card balance less than $2700? μ = 7 σ = 20 P(x < 2700) = 0.6 (b) You randomly select 2 undergraduates who are credit card holders. What is the probability that their mean credit card balance is less than $2700. P(x < 2700) = 0.07 There is a % chance that an undergraduate will have a balance less than $2700, but there is only about a 2% chance that a sample of 2 graduates will have a balance less than $2700. Try It Yourself 6 P. 268 P odds 2
The Normal Distribution. Chapter 6
 + The Normal Distribution Chapter 6 + Applications of the Normal Distribution Section 6-2 + The Standard Normal Distribution and Practical Applications! We can convert any variable that in normally distributed
Probability Distribution for a normal random variable x:
 Chapter5 Continuous Random Variables 5.3 The Normal Distribution Probability Distribution for a normal random variable x: 1. It is and about its mean µ. 2. (the that x falls in the interval a < x < b is
Unit 4 Probability. Dr Mahmoud Alhussami
 Unit 4 Probability Dr Mahmoud Alhussami Probability Probability theory developed from the study of games of chance like dice and cards. A process like flipping a coin, rolling a die or drawing a card from
EXAM # 3 PLEASE SHOW ALL WORK!
 Stat 311, Summer 2018 Name EXAM # 3 PLEASE SHOW ALL WORK! Problem Points Grade 1 30 2 20 3 20 4 30 Total 100 1. A socioeconomic study analyzes two discrete random variables in a certain population of households
(a) (i) Use StatCrunch to simulate 1000 random samples of size n = 10 from this population.
 (i) Use StatCrunch to simulate 1000 random samples of size n = 10 from this population.") Chapter 8 Sampling Distribution Ch 8.1 Distribution of Sample Mean Objective A : Shape, Center, and Spread of the Distributions of A1. Sampling Distributions of Mean A1.1 Sampling Distribution of the Sample
Chapter 8 Sampling Distribution Ch 8.1 Distribution of Sample Mean Objective A : Shape, Center, and Spread of the Distributions of A1. Sampling Distributions of Mean A1.1 Sampling Distribution of the Sample
Multiple Choice Circle the letter corresponding to the best answer for each of the problems below (4 pts each)
") Math 221 Hypothetical Exam 1, Wi2008, (Chapter 1-5 in Moore, 4th) April 3, 2063 S. K. Hyde, S. Barton, P. Hurst, K. Yan Name: Show all your work to receive credit. All answers must be justified to get
Math 221 Hypothetical Exam 1, Wi2008, (Chapter 1-5 in Moore, 4th) April 3, 2063 S. K. Hyde, S. Barton, P. Hurst, K. Yan Name: Show all your work to receive credit. All answers must be justified to get
Sampling, Frequency Distributions, and Graphs (12.1)
") 1 Sampling, Frequency Distributions, and Graphs (1.1) Design: Plan how to obtain the data. What are typical Statistical Methods? Collect the data, which is then subjected to statistical analysis, which
1 Sampling, Frequency Distributions, and Graphs (1.1) Design: Plan how to obtain the data. What are typical Statistical Methods? Collect the data, which is then subjected to statistical analysis, which
Phases of the Moon. Phenomenon: The appearance of the moon changes every night. 1. What questions do you have about this phenomenon?
 THE EARTH-SUN-MOON SYSTEM Phases of the Moon OBSERVING PHENOMENA Phenomenon: The appearance of the moon changes every night. 1. What questions do you have about this phenomenon? 2. Sketch a simple model
Lesson 5: Solving Equations
 Up to this point, our study of algebra has involved a deep look at algebraic expressions and operations on those expressions. We ve learned how to characterize, write, and simplify algebraic expressions,
Chapter. Hypothesis Testing with Two Samples. Copyright 2015, 2012, and 2009 Pearson Education, Inc. 1
 Chapter 8 Hypothesis Testing with Two Samples Copyright 2015, 2012, and 2009 Pearson Education, Inc 1 Two Sample Hypothesis Test Compares two parameters from two populations Sampling methods: Independent
Probability and Samples. Sampling. Point Estimates
 Probability and Samples Sampling We want the results from our sample to be true for the population and not just the sample But our sample may or may not be representative of the population Sampling error
Essential Question: How are the mean and the standard deviation determined from a discrete probability distribution?
 Probability and Statistics The Binomial Probability Distribution and Related Topics Chapter 5 Section 1 Introduction to Random Variables and Probability Distributions Essential Question: How are the mean
STATISTICS/MATH /1760 SHANNON MYERS
 STATISTICS/MATH 103 11/1760 SHANNON MYERS π 100 POINTS POSSIBLE π YOUR WORK MUST SUPPORT YOUR ANSWER FOR FULL CREDIT TO BE AWARDED π YOU MAY USE A SCIENTIFIC AND/OR A TI-83/84/85/86 CALCULATOR ONCE YOU
STAT/SOC/CSSS 221 Statistical Concepts and Methods for the Social Sciences. Random Variables
 STAT/SOC/CSSS 221 Statistical Concepts and Methods for the Social Sciences Random Variables Christopher Adolph Department of Political Science and Center for Statistics and the Social Sciences University
The area under a probability density curve between any two values a and b has two interpretations:
 Chapter 7 7.1 The Standard Normal Curve Introduction Probability density curve: The area under a probability density curve between any two values a and b has two interpretations: 1. 2. The region above
Chapter 6 Continuous Probability Distributions
 Continuous Probability Distributions Learning Objectives 1. Understand the difference between how probabilities are computed for discrete and continuous random variables. 2. Know how to compute probability
Lesson 3: Working With Linear Relations Day 3 Unit 1 Linear Relations
 (A) Lesson Context BIG PICTURE of this UNIT: CONTEXT of this LESSON: mastery with algebraic manipulations/calculations involving linear relations proficiency in working with graphic and numeric representations
3.2 Probability Rules
 3.2 Probability Rules The idea of probability rests on the fact that chance behavior is predictable in the long run. In the last section, we used simulation to imitate chance behavior. Do we always need
Point of intersection
 Name: Date: Period: Exploring Systems of Linear Equations, Part 1 Learning Goals Define a system of linear equations and a solution to a system of linear equations. Identify whether a system of linear
Mini-Lesson 5. Section 5.1: Algebraic Equations
 Mini-Lesson 5 Section 5.1: Algebraic Equations DEFINITION: An algebraic equation is a mathematical sentence connecting one expression to another expression with an equal sign (=). Verify that a given value
Section 7.1 Properties of the Normal Distribution
 Section 7.1 Properties of the Normal Distribution In Chapter 6, talked about probability distributions. Coin flip problem: Difference of two spinners: The random variable x can only take on certain discrete
Measures of. U4 C 1.2 Dot plot and Histogram 2 January 15 16, 2015
 U4 C 1. Dot plot and Histogram January 15 16, 015 U 4 : C 1.1 CCSS. 9 1.S ID.1 Dot Plots and Histograms Objective: We will be able to represent data with plots on the real number line, using: Dot Plots
MATH 1150 Chapter 2 Notation and Terminology
 MATH 1150 Chapter 2 Notation and Terminology Categorical Data The following is a dataset for 30 randomly selected adults in the U.S., showing the values of two categorical variables: whether or not the
The Central Limit Theorem
 - The Central Limit Theorem Definition Sampling Distribution of the Mean the probability distribution of sample means, with all samples having the same sample size n. (In general, the sampling distribution
Intermediate Math Circles November 8, 2017 Probability II
 Intersection of Events and Independence Consider two groups of pairs of events Intermediate Math Circles November 8, 017 Probability II Group 1 (Dependent Events) A = {a sales associate has training} B
Variables. Lecture 12 Sections Tue, Feb 3, Hampden-Sydney College. Displaying Distributions - Qualitative.
 Lecture 12 Sections 4.3.1-4.3.2 Hampden-Sydney College Tue, Feb 3, 2008 Outline 1 2 3 4 5 Exercise 4.2, p. 219 Determine whether the following variables are qualitative, quantitative discrete, or quantitative
Abe Mirza Ungrouped Data Statistics
 Abe Mirza Ungrouped Data Statistics Mean Mode Median A B C D E F G 3 33 46 19 33 31 461 39 49 78 156 41 319 78 3 4 64 145 49 31 643 66 76 13 160 56 65 13 58 68 116 119 85 541 16 4 5 84 134 4 44 184 37
Lesson 3-6: Compound Inequalities Name:
 Lesson 3-6: Compound Inequalities Name: W hen people plan a house, they often have many requirements in mind that can be written as inequalities. Such requirements could be the dimensions of rooms or the
Piecewise Functions In the toolkit functions we introduced the absolute value function f( x)
") 8 Chapter 1 Piecewise Functions In the toolkit functions we introduced the absolute value function f( x) x. With a domain of all real numbers and a range of values greater than or equal to 0, the absolute
8 Chapter 1 Piecewise Functions In the toolkit functions we introduced the absolute value function f( x) x. With a domain of all real numbers and a range of values greater than or equal to 0, the absolute
Sample Problems for the Final Exam
 Sample Problems for the Final Exam 1. Hydraulic landing assemblies coming from an aircraft rework facility are each inspected for defects. Historical records indicate that 8% have defects in shafts only,
MULTIPLE CHOICE. Choose the one alternative that best completes the statement or answers the question.
 MGF 1106 Math for Liberal Arts I Summer 2008 - Practice Final Exam Dr. Schnackenberg If you do not agree with the given answers, answer "E" for "None of the above". MULTIPLE CHOICE. Choose the one alternative
Chapter. Numerically Summarizing Data Pearson Prentice Hall. All rights reserved
 Chapter 3 Numerically Summarizing Data Section 3.1 Measures of Central Tendency Objectives 1. Determine the arithmetic mean of a variable from raw data 2. Determine the median of a variable from raw data
Classroom Assessments Based on Standards Integrated College Prep I Unit 3 CP 103A
 Classroom Assessments Based on Standards Integrated College Prep I Unit 3 CP 103A Name: ID Number: Teacher Name: Score: Proficient: yes no How Tall Can He Be? The table below shows the average height in
Advanced/Advanced Subsidiary. You must have: Mathematical Formulae and Statistical Tables (Blue)
") Write your name here Surname Other names Pearson Edexcel International Advanced Level Centre Number Statistics S1 Advanced/Advanced Subsidiary Candidate Number Wednesday 15 June 2016 Morning Time: 1 hour
Write your name here Surname Other names Pearson Edexcel International Advanced Level Centre Number Statistics S1 Advanced/Advanced Subsidiary Candidate Number Wednesday 15 June 2016 Morning Time: 1 hour
PhysicsAndMathsTutor.com. Advanced/Advanced Subsidiary. You must have: Mathematical Formulae and Statistical Tables (Blue)
") Write your name here Surname Other names Pearson Edexcel International Advanced Level Centre Number Statistics S1 Advanced/Advanced Subsidiary Candidate Number Wednesday 15 June 2016 Morning Time: 1 hour
Write your name here Surname Other names Pearson Edexcel International Advanced Level Centre Number Statistics S1 Advanced/Advanced Subsidiary Candidate Number Wednesday 15 June 2016 Morning Time: 1 hour
You must have: Ruler graduated in centimetres and millimetres, protractor, compasses, pen, HB pencil, eraser, calculator. Tracing paper may be used.
 Write your name here Surname Other names Pearson Edexcel International GCSE Centre Number Mathematics B Paper 1R Candidate Number Wednesday 14 May 2014 Morning Time: 1 hour 30 minutes Paper Reference 4MB0/01R
Intro to Probability Day 3 (Compound events & their probabilities)
") Intro to Probability Day 3 (Compound events & their probabilities) Compound Events Let A, and B be two event. Then we can define 3 new events as follows: 1) A or B (also A B ) is the list of all outcomes
Intro to Probability Day 3 (Compound events & their probabilities) Compound Events Let A, and B be two event. Then we can define 3 new events as follows: 1) A or B (also A B ) is the list of all outcomes
# of units, X P(X) Show that the probability distribution for X is legitimate.
 Show that the probability distribution for X is legitimate.") Probability Distributions A. El Dorado Community College considers a student to be full-time if he or she is taking between 12 and 18 units. The number of units X that a randomly selected El Dorado Community
Probability Distributions A. El Dorado Community College considers a student to be full-time if he or she is taking between 12 and 18 units. The number of units X that a randomly selected El Dorado Community
You must have: Ruler graduated in centimetres and millimetres, protractor, pair of compasses, pen, HB pencil, eraser. Tracing paper may be used.
 Write your name here Surname Other names Edexcel GCSE Centre Number Mathematics A Paper 1 (Non-Calculator) Monday 11 June 2012 Afternoon Time: 1 hour 45 minutes Candidate Number Higher Tier Paper Reference
Candidate Name Centre Number Candidate Number MATHEMATICS UNIT 1: NON-CALCULATOR INTERMEDIATE TIER SPECIMEN PAPER SUMMER 2017
 GCSE MATHEMATICS Specimen Assessment Materials 27 Candidate Name Centre Number Candidate Number 0 GCSE MATHEMATICS UNIT 1: NON-CALCULATOR INTERMEDIATE TIER SPECIMEN PAPER SUMMER 2017 1 HOUR 45 MINUTES
(a) Fill in the missing probabilities in the table. (b) Calculate P(F G). (c) Calculate P(E c ). (d) Is this a uniform sample space?
 Fill in the missing probabilities in the table. (b) Calculate P(F G). (c) Calculate P(E c ). (d) Is this a uniform sample space?") Math 166 Exam 1 Review Sections L.1-L.2, 1.1-1.7 Note: This review is more heavily weighted on the new material this week: Sections 1.5-1.7. For more practice problems on previous material, take a look
Math 166 Exam 1 Review Sections L.1-L.2, 1.1-1.7 Note: This review is more heavily weighted on the new material this week: Sections 1.5-1.7. For more practice problems on previous material, take a look
Instructions. Information. Advice
 Instructions Use black ink or ball-point pen. 5C Fill in the boxes at the top of this page with your name, centre number and candidate number. Answer all questions. Answer the questions in the spaces provided
Unit 1: Statistics. Mrs. Valentine Math III
 Unit 1: Statistics Mrs. Valentine Math III 1.1 Analyzing Data Statistics Study, analysis, and interpretation of data Find measure of central tendency Mean average of the data Median Odd # data pts: middle
6 THE NORMAL DISTRIBUTION
 CHAPTER 6 THE NORMAL DISTRIBUTION 341 6 THE NORMAL DISTRIBUTION Figure 6.1 If you ask enough people about their shoe size, you will find that your graphed data is shaped like a bell curve and can be described
The Geometric Distribution
 MATH 382 The Geometric Distribution Dr. Neal, WKU Suppose we have a fixed probability p of having a success on any single attempt, where p > 0. We continue to make independent attempts until we succeed.
Probability and Statistics Chapter 5 Quiz. a. Age - Range Probability
 Probability and Statistics Chapter 5 Quiz Name 1. Is the following list of probabilities a probability distribution? Explain your answer and be very specific. (6 points) a. Age - Range 16-19 20-23 24-27
1/18/2011. Chapter 6: Probability. Introduction to Probability. Probability Definition
 Chapter 6: Probability Introduction to Probability The role of inferential statistics is to use the sample data as the basis for answering questions about the population. To accomplish this goal, inferential
Math 115 Practice for Exam 2
 Math 115 Practice for Exam Generated October 30, 017 Name: SOLUTIONS Instructor: Section Number: 1. This exam has 5 questions. Note that the problems are not of equal difficulty, so you may want to skip
Lesson 19: Understanding Variability When Estimating a Population Proportion
 Lesson 19: Understanding Variability When Estimating a Population Proportion Student Outcomes Students understand the term sampling variability in the context of estimating a population proportion. Students
Elementary Statistics
 Elementary Statistics Q: What is data? Q: What does the data look like? Q: What conclusions can we draw from the data? Q: Where is the middle of the data? Q: Why is the spread of the data important? Q:
79 Wyner Math Academy I Spring 2016
 79 Wyner Math Academy I Spring 2016 CHAPTER NINE: HYPOTHESIS TESTING Review May 11 Test May 17 Research requires an understanding of underlying mathematical distributions as well as of the research methods
PhysicsAndMathsTutor.com. Advanced/Advanced Subsidiary. You must have: Mathematical Formulae and Statistical Tables (Blue)
") Write your name here Surname Other names Pearson Edexcel International Advanced Level Centre Number Statistics S1 Advanced/Advanced Subsidiary Candidate Number Friday 20 January 2017 Afternoon Time: 1
Write your name here Surname Other names Pearson Edexcel International Advanced Level Centre Number Statistics S1 Advanced/Advanced Subsidiary Candidate Number Friday 20 January 2017 Afternoon Time: 1
Statistics 100 Exam 2 March 8, 2017
 STAT 100 EXAM 2 Spring 2017 (This page is worth 1 point. Graded on writing your name and net id clearly and circling section.) PRINT NAME (Last name) (First name) net ID CIRCLE SECTION please! L1 (MWF
Lecture Slides. Elementary Statistics Twelfth Edition. by Mario F. Triola. and the Triola Statistics Series. Section 3.1- #
 Lecture Slides Elementary Statistics Twelfth Edition and the Triola Statistics Series by Mario F. Triola Chapter 3 Statistics for Describing, Exploring, and Comparing Data 3-1 Review and Preview 3-2 Measures
You can call the center of the atom, the nucleus. Most atoms in our environment have a stable nucleus.
 Build an Atom Simulation Part One Learning Objectives: Draw models that show atoms Use information about the number of protons, neutrons, and electrons to Identify an element and its position on the periodic
Unit 22: Sampling Distributions
 Unit 22: Sampling Distributions Summary of Video If we know an entire population, then we can compute population parameters such as the population mean or standard deviation. However, we generally don
Polynomials Video Lecture. Section 4.1
 Polynomials Video Lecture Section 4.1 Course Learning Objectives: 1)Demonstrate an understanding of functional attributes such as domain, range, odd/even, increasing/decreasing, and symmetry. Determine
Topic 5 Part 3 [257 marks]
![Topic 5 Part 3 [257 marks]](/thumbs/89/98286032.jpg "Topic 5 Part 3 [257 marks]") Topic 5 Part 3 [257 marks] Let 0 3 A = ( ) and 2 4 4 0 B = ( ). 5 1 1a. AB. 1b. Given that X 2A = B, find X. The following table shows the probability distribution of a discrete random variable X. 2a.
Topic 5 Part 3 [257 marks] Let 0 3 A = ( ) and 2 4 4 0 B = ( ). 5 1 1a. AB. 1b. Given that X 2A = B, find X. The following table shows the probability distribution of a discrete random variable X. 2a.
Sets and Set notation. Algebra 2 Unit 8 Notes
 Sets and Set notation Section 11-2 Probability Experimental Probability experimental probability of an event: Theoretical Probability number of time the event occurs P(event) = number of trials Sample
STAT 414: Introduction to Probability Theory
 STAT 414: Introduction to Probability Theory Spring 2016; Homework Assignments Latest updated on April 29, 2016 HW1 (Due on Jan. 21) Chapter 1 Problems 1, 8, 9, 10, 11, 18, 19, 26, 28, 30 Theoretical Exercises
UNIFORM DISTRIBUTIONS The allows us to see two very important properties: 1. The under the of a distribution is equal. (or frequency), so some
, so some") Example 2: In a study of 420,095 cell phone users in Denmark, it was found that 135 developed cancer of the brain or nervous system. If we assume that the use of cell phones has no effect on developing
Example 2: In a study of 420,095 cell phone users in Denmark, it was found that 135 developed cancer of the brain or nervous system. If we assume that the use of cell phones has no effect on developing
G.C.E.(O.L.) Support Seminar
 Support Seminar") - 1 - G..E.(O.L.) Support Seminar - 015 Mathematics I Two Hours Part nswer all questions on this question paper itself. 1. If 50 rupees is paid as rates for a quarter for a certain house, find the value
- 1 - G..E.(O.L.) Support Seminar - 015 Mathematics I Two Hours Part nswer all questions on this question paper itself. 1. If 50 rupees is paid as rates for a quarter for a certain house, find the value
BIOSTATISTICS NURS 3324
 Simple Linear Regression and Correlation Introduction Previously, our attention has been focused on one variable which we designated by x. Frequently, it is desirable to learn something about the relationship
Objectives for Linear Activity. Calculate average rate of change/slope Interpret intercepts and slope of linear function Linear regression
 Objectives for Linear Activity Calculate average rate of change/slope Interpret intercepts and slope of linear function Linear regression 1 Average Rate of Change & Slope On a graph, average rate of change
8th Grade Standards for Algebra Readiness Solve one-variable linear equations. 3. d 8 = 6 4. = 16 5.
 Solve one-variable linear equations. 1. g 7 = 15 2. p 1 3 = 2 3 3. d 8 = 6 4. 2r 3 = 16 5. 3r 4 = 1 8 6. 4x + 7 = 11 7. 13 = h 7 8. 2(b + 5) = 6 9. 5(r 1) = 2(r 4) 6 Solve one- and two-step linear inequalities
Practice General Test # 4 with Answers and Explanations. Large Print (18 point) Edition
 Edition") GRADUATE RECORD EXAMINATIONS Practice General Test # 4 with Answers and Explanations Large Print (18 point) Edition Section 5 Quantitative Reasoning Section 6 Quantitative Reasoning Copyright 2012 by Educational
GRADUATE RECORD EXAMINATIONS Practice General Test # 4 with Answers and Explanations Large Print (18 point) Edition Section 5 Quantitative Reasoning Section 6 Quantitative Reasoning Copyright 2012 by Educational
For any negative real number x, the statement
 1. Which equation does not have a solution? w + 3 = 3w + w + 3 = w + 5 w + 3 = 4w + 6 w + 3 = w + w + 3. Which expression represents the phrase the quotient of three less than four times a number n and
The Normal Distribution Review
 The Normal Distribution Review A. Properties of the Normal Distribution Many continuous variables have distributions that are bell-shaped and are called approximately normally distributed variables. The
Edexcel GCSE Mathematics (Linear) A* Paper (not for the faint hearted) Higher Tier
 A* Paper (not for the faint hearted) Higher Tier") Edexcel GCSE Mathematics (Linear) A* Paper (not for the faint hearted) Higher Tier Time: 2 hours Materials required for examination Ruler graduated in centimetres and millimetres, protractor, compasses,
Edexcel GCSE Mathematics (Linear) A* Paper (not for the faint hearted) Higher Tier Time: 2 hours Materials required for examination Ruler graduated in centimetres and millimetres, protractor, compasses,
Representations of Motion in One Dimension: Speeding up and slowing down with constant acceleration
 Representations of Motion in One Dimension: Speeding up and slowing down with constant acceleration Name: Group Members: Date: TA s Name: Apparatus: Aluminum track and supports, PASCO Smart Cart, two cart
Lecture 1: Description of Data. Readings: Sections 1.2,
 Lecture 1: Description of Data Readings: Sections 1.,.1-.3 1 Variable Example 1 a. Write two complete and grammatically correct sentences, explaining your primary reason for taking this course and then
Introduction to Mechanics Unit Conversions Order of Magnitude
 Introduction to Mechanics Unit Conversions Order of Magnitude Lana Sheridan De Anza College Sept 28, 2017 Last time symbols for scaling units scientific notation precision and accuracy dimensional analysis
Statistic: a that can be from a sample without making use of any unknown. In practice we will use to establish unknown parameters.
 Chapter 9: Sampling Distributions 9.1: Sampling Distributions IDEA: How often would a given method of sampling give a correct answer if it was repeated many times? That is, if you took repeated samples
Mathematics Paper 2 (Calculator)
") Write your name here Surname Other names Pearson Edexcel Level 1/Level 2 GCSE (9-1) Centre Number Candidate Number Mathematics Paper 2 (Calculator) Specimen Papers Set 2 Time: 1 hour 30 minutes Foundation
Write your name here Surname Other names Pearson Edexcel Level 1/Level 2 GCSE (9-1) Centre Number Candidate Number Mathematics Paper 2 (Calculator) Specimen Papers Set 2 Time: 1 hour 30 minutes Foundation
1380/3H Edexcel GCSE Mathematics (Linear) 1380 Paper 3 (Non-Calculator) Higher Tier Thursday 15 November 2009 Morning Time: 1 hour 45 minutes
 1380 Paper 3 (Non-Calculator) Higher Tier Thursday 15 November 2009 Morning Time: 1 hour 45 minutes") 1380/3H Edexcel GCSE Mathematics (Linear) 1380 Paper 3 (Non-Calculator) Higher Tier Thursday 15 November 2009 Morning Time: 1 hour 45 minutes Materials required for examination Ruler graduated in centimetres
1380/3H Edexcel GCSE Mathematics (Linear) 1380 Paper 3 (Non-Calculator) Higher Tier Thursday 15 November 2009 Morning Time: 1 hour 45 minutes Materials required for examination Ruler graduated in centimetres
STAT 200 Chapter 1 Looking at Data - Distributions
 STAT 200 Chapter 1 Looking at Data - Distributions What is Statistics? Statistics is a science that involves the design of studies, data collection, summarizing and analyzing the data, interpreting the
1. A machine produces packets of sugar. The weights in grams of thirty packets chosen at random are shown below.
 No Gdc 1. A machine produces packets of sugar. The weights in grams of thirty packets chosen at random are shown below. Weight (g) 9.6 9.7 9.8 9.9 30.0 30.1 30. 30.3 Frequency 3 4 5 7 5 3 1 Find unbiased
PhysicsAndMathsTutor.com
 . Two cars P and Q are moving in the same direction along the same straight horizontal road. Car P is moving with constant speed 5 m s. At time t = 0, P overtakes Q which is moving with constant speed
Axioms of Probability
 Sample Space (denoted by S) The set of all possible outcomes of a random experiment is called the Sample Space of the experiment, and is denoted by S. Example 1.10 If the experiment consists of tossing
1 Probability Distributions
 1 Probability Distributions In the chapter about descriptive statistics sample data were discussed, and tools introduced for describing the samples with numbers as well as with graphs. In this chapter
Mathematics Paper 2 (Calculator)
") Write your name here Surname Other names Pearson Edexcel Level 1/Level 2 GCSE (9-1) Centre Number Candidate Number Mathematics Paper 2 (Calculator) Specimen Papers Set 2 Time: 1 hour 30 minutes Higher
Write your name here Surname Other names Pearson Edexcel Level 1/Level 2 GCSE (9-1) Centre Number Candidate Number Mathematics Paper 2 (Calculator) Specimen Papers Set 2 Time: 1 hour 30 minutes Higher
Math 131 Exam II "Sample Questions"
 Math 11 Exam II "Sample Questions" This is a compilation of exam II questions from old exams (written by various instructors) They cover chapters and The solutions can be found at the end of the document
Lesson 6b Rational Exponents & Radical Functions
 Lesson 6b Rational Exponents & Radical Functions In this lesson, we will continue our review of Properties of Exponents and will learn some new properties including those dealing with Rational and Radical
Paper Reference. Mathematics (Linear) 1380 Paper 3 (Non-Calculator) Higher Tier Thursday 5 November 2009 Morning Time: 1 hour 45 minutes
 1380 Paper 3 (Non-Calculator) Higher Tier Thursday 5 November 2009 Morning Time: 1 hour 45 minutes") Centre No. Candidate No. Paper Reference 1 3 8 0 3 H Surname Signature Paper Reference(s) 1380/3H Edexcel GCSE Mathematics (Linear) 1380 Paper 3 (Non-Calculator) Higher Tier Thursday 5 November 2009 Morning
Centre No. Candidate No. Paper Reference 1 3 8 0 3 H Surname Signature Paper Reference(s) 1380/3H Edexcel GCSE Mathematics (Linear) 1380 Paper 3 (Non-Calculator) Higher Tier Thursday 5 November 2009 Morning
Section 3.4 Normal Distribution MDM4U Jensen
 Section 3.4 Normal Distribution MDM4U Jensen Part 1: Dice Rolling Activity a) Roll two 6- sided number cubes 18 times. Record a tally mark next to the appropriate number after each roll. After rolling
Section 3.2 Measures of Central Tendency
 Section 3.2 Measures of Central Tendency 1 of 149 Section 3.2 Objectives Determine the mean, median, and mode of a population and of a sample Determine the weighted mean of a data set and the mean of a
The University of the State of New York REGENTS HIGH SCHOOL EXAMINATION ALGEBRA II. Student Name:
 ALGEBRA II The University of the State of New York REGENTS HIGH SCHOOL EXAMINATION ALGEBRA II Thursday, January 24, 2019 1:15 to 4:15 p.m., only Large-Type Edition Student Name: School Name: The possession
Chapter Solving Equations by Adding, Subtracting, Multiplying, and Dividing.notebook
 Bellwork: Write as a fraction and reduce if you can: 1) 2.7 2) 0.325 Homework Questions??? Write each as a decimal, use repeating decimals when necessary: 3) 5/2 4) 6/8 Evaluate: 5) 2x + y; x = 4, y =
Chapter 3 Probability Distributions and Statistics Section 3.1 Random Variables and Histograms
 Math 166 (c)2013 Epstein Chapter 3 Page 1 Chapter 3 Probability Distributions and Statistics Section 3.1 Random Variables and Histograms The value of the result of the probability experiment is called
Vikas Bharati Public School SAMPLE PAPER (Session ) Class: VIII Time : 3 Hrs. Subject: MATHEMATICS M.M. = 80
 Class: VIII Time : 3 Hrs. Subject: MATHEMATICS M.M. = 80") Vikas Bharati Public School SAMPLE PAPER (Session 2018-19) Class: VIII Time : Hrs. Subject: MATHEMATICS M.M. = 80 Note: 1. This question paper contains_5_ printed pages. 2. Blue-Print on last page. SECTION-A
Vikas Bharati Public School SAMPLE PAPER (Session 2018-19) Class: VIII Time : Hrs. Subject: MATHEMATICS M.M. = 80 Note: 1. This question paper contains_5_ printed pages. 2. Blue-Print on last page. SECTION-A
Chapter 5: Normal Probability Distributions
 Probability and Statistics Mrs. Leahy Chapter 5: Normal Probability Distributions 5.1 Introduction to Normal Distributions and the Standard Normal Distribution What is a Normal Distribution and a Normal
CSE 546 Final Exam, Autumn 2013
 CSE 546 Final Exam, Autumn 0. Personal info: Name: Student ID: E-mail address:. There should be 5 numbered pages in this exam (including this cover sheet).. You can use any material you brought: any book,
Marquette University
 Marquette University 2 0 7 C O M P E T I T I V E S C H O L A R S H I P E X A M I N A T I O N I N M A T H E M A T I C S Do not open this booklet until you are directed to do so.. Fill out completely the
Wednesday, January 23, :15 to 4:15 p.m., only
 ALGEBRA I The University of the State of New York REGENTS HIGH SCHOOL EXAMINATION Algebra I Wednesday, January 23, 2019 1:15 to 4:15 p.m., only Student Name School Name The possession or use of any communications
download instant at
 Chapter 2 Test B Multiple Choice Section 2.1 (Visualizing Variation in Numerical Data) 1. [Objective: Interpret visual displays of numerical data] For twenty days a record store owner counts the number
Mathematics 4306/2F (Specification A)
") Centre Number Surname Candidate Number For Examiner s Use Other Names Candidate Signature Examiner s Initials Time allowed l 1 hour 30 minutes General Certificate of Secondary Education Foundation Tier
Centre Number Surname Candidate Number For Examiner s Use Other Names Candidate Signature Examiner s Initials Time allowed l 1 hour 30 minutes General Certificate of Secondary Education Foundation Tier
MATH 360. Probablity Final Examination December 21, 2011 (2:00 pm - 5:00 pm)
") Name: MATH 360. Probablity Final Examination December 21, 2011 (2:00 pm - 5:00 pm) Instructions: The total score is 200 points. There are ten problems. Point values per problem are shown besides the questions.
Name: MATH 360. Probablity Final Examination December 21, 2011 (2:00 pm - 5:00 pm) Instructions: The total score is 200 points. There are ten problems. Point values per problem are shown besides the questions.
Concepts in Statistics
 Concepts in Statistics -- A Theoretical and Hands-on Approach Statistics The Art of Distinguishing Luck from Chance Statistics originally meant the collection of population and economic information vital
IM3 DEC EXAM PREP MATERIAL DEC 2016
 1. Given the line x 3 y 5 =1; Paper 1 - CALCULATOR INACTIVE a. Determine the slope of this line. b. Write the equation of this line in function form. c. Evaluate f ( 12). d. Solve for x if 95 = f (x).
Unit 2: Number, Algebra, Geometry 1 (Non-Calculator)
") Write your name here Surname Other names Edexcel GCSE Centre Number Mathematics B Unit 2: Number, Algebra, Geometry 1 (Non-Calculator) Wednesday 13 June 2012 Morning Time: 1 hour 15 minutes Candidate Number
Write your name here Surname Other names Edexcel GCSE Centre Number Mathematics B Unit 2: Number, Algebra, Geometry 1 (Non-Calculator) Wednesday 13 June 2012 Morning Time: 1 hour 15 minutes Candidate Number