GOALS The Samples Why Sample the Population? What is a Probability Sample? Four Most Commonly Used Probability Sampling Methods
|
|
|
- Primrose Morris
- 5 years ago
- Views:
Transcription
1
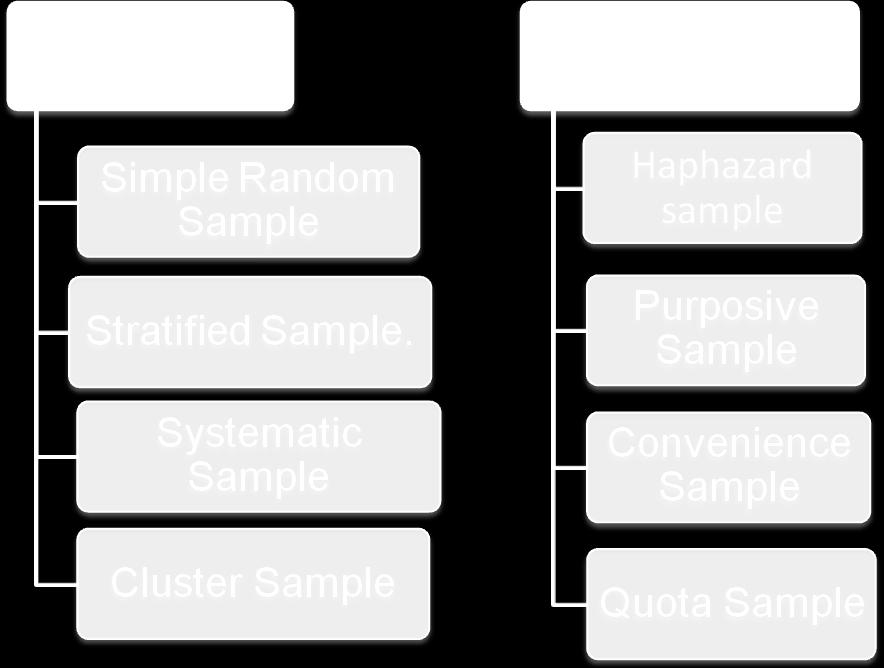
2 GOLS. Epla why a sample s the oly feasble way to lear about a populato.. Descrbe methods to select a sample. 3. Defe ad costruct a samplg dstrbuto of the sample mea. 4. Epla the cetral lmt theorem. 5. Use the cetral lmt theorem to fd probabltes of selectg possble sample meas from a specfed populato. The Samples Why Sample the Populato?. To cotact the whole populato would be tme cosumg.. The cost of studyg all the tems a populato may be prohbtve. 3. The physcal mpossblty of checg all tems the populato. 4. The destructve ature of some tests. 5. The sample results are adequate. What s a Probablty Sample? probablty sample s a sample selected such that each tem or perso the populato beg studed has a ow lelhood of beg cluded the sample. Four Most Commoly Used Probablty Samplg Methods. Smple Radom Sample. Systematc Radom Samplg 3. Stratfed Radom Samplg 4. Cluster Samplg

3 Types of Samples 3
4 ()Smple Radom Sample (SRS): Smple radom sample: sample selected so that each tem or perso the populato has the same chace of beg cluded. Ths ca oly be doe by usg Radom umbers Table, or ay other radomzato devce, e.g. computers, lottery etc. I case that the populato s homogeeous, the best samplg method to follow s the smple radom samplg. SRS s ot a good desg f the populato uder study s very large or heterogeeous. How we used the Radom umbers Table? Loo at the et Eample: We wat selected SRS, f the Populato sze () = 75 & a sample sze () = 5. Step (): ssg umber for each tem the frame from ( to ) or ( to 75). Step (): selected the startg pot the umbers table. Suppose we startg at the tersecto of (row 3 & colum ) ad move horzotally ad oly readg two umbers accordg (go horzotally or vertcally) wthout repetto. Step (3): We selected the tems umber: 7, 57, 8, 37,, 75, 65, 7, 63,,3, 30,9,66,46 ote: We dsregarded ay umber greater tha Part of a table of radom umbers If we movg vertcally the tems a sample umber: 7, 57,8, 6,, 37, 3,6, 40, 47, 46,, 5, 44,
 - Determe the sample sze (). 3-Calculate the terval sze, K = /.")

5 ()Systematc Radom Sample Systematc Radom Sample: radom startg pot s selected, ad the every th member of the populato s selected. Here the steps you eed to follow order to acheve a systematc radom sample are: - umber the uts the populato from ( to ) - Determe the sample sze (). 3-Calculate the terval sze, K = /. 4- Radomly select a teger betwee to. 5- The tae every th ut from other tervals. Eample: Selecto of Systematc Sample The frst ut, from the Table s umber 4, the the uts of the sample wll be: 4, 9, 4, 9, 4, Systematc Sample has the advatage to SRS of good coverage of the populato However, t has the same dsadvatages. (3)Stratfed Sample Stratfed Radom Sample: populato s dvded to subgroups, called strata, ad a sample s radomly selected from each stratum. Stratfed radom samplg s used whe we have heterogeeous populato regardg some characterstcs. The populato s sub-dvded to Strata. Each Stratum s homogeeous terally. 5
6 sub-sample s draw from Each Stratum ad the totalty of the sub-samples costtutes the stratfed sample sze. How draw? How may uts from each stratum? The sub-sample ca be draw usg: SRS or Systematc RS. The sze of the sub-sample from each stratum ca be determed through : Proportoal llocato: Sub-sample = Sze of stratum * sample sze Sze of populato = ( h / ) * The sub-sample s tae Proportoal to the sze of the stratum. (Larger strata wll have larger sub-sample). Eample: We wat selected radom sample form the followg table Sample sze = 40 Stratum (Studets) Freshma Sophomore Juor Seor Sze h The Sub-Samples: (Proportoal llocato): = (00/00) *40 = 40 = (600/00) *40 = 0 3 = (00/00) *40 = 0 4 = (300/00) *40 = 60 = = 40 (4) Mult- Stage or Cluster Sample: Cluster sample: populato s dvded to clusters usg aturally occurrg geographc or other boudares. The, clusters are radomly selected ad a sample s collected by radomly selectg from each cluster. The sample s selected to stages; each stage s composed of two steps: - Sub-dvso to smaller Clusters. - Selecto of some clusters. Ths goes o stages tll the ultmate ut whch s dvsble, e.g. household or a dvdual. Eample study umber of traffc accdets doe to all Saud raba: Stage Oe: - Subdvde Saud raba to ctes, (5). - Select some ctes, (say 0). Stage Two: - Sub-dvde each selected cty to streets. - Select some streets from each selected cty. 6
7 7 Revew Eample () : Compute the mea, Varace, Stadard devato of the followg populato values: 6, 3, 5, 4, ad by usg two deferet formulas Soluto: Total Summary Sample Populato The mea S Varace S S Stadard devato
8 Samplg dstrbuto: Defto Let ˆ (read "theta hat") be ay sample statstc; for eample ˆ could be the sample mea ; the sample proporto P ; the sample varace S ad so o. samplg dstrbuto of ˆ s a probablty dstrbuto obtaed by Lstg all possble values that ˆ could have from all possble samples of Sze ad the correspodg probabltes of occurrece How to draw sample from populato umber of samples Wth replacemet Wthout replacemet umber of samples The order of selected objects s ot mportat The order of selected objects s mportat Combato= Permutato= umberof samples umberof samples C P 8
9 Case () the samplg wth replacemet: K umber of samples Case () the samplg wthout replacemet: (-) the order of selected objects s mportat! umberof samples K P ( )( )( 3)...( (-)The order of selected objects s ot mportat! umberof samples K C.!! ( )( )( 3)..!! ( )... ). 9
10 Samplg dstrbuto of the sample mea: probablty dstrbuto of all possble sample meas of a gve sample sze. We study three cases: Case (): The samplg dstrbuto wth replacemet: Eample () Refer to eample () lst all possble samples of eecutves from the populato ad compute ther meas (wth replacemet).fd:. How may dfferet samples of are possble?. The probablty of selectg ay of the possble smple radom samples. 3. The mea of (the mea of samplg dstrbuto of the sample meas), the varace of (the varace of samplg dstrbuto of the sample meas), the stadard devato of (the stadard devato of samplg dstrbuto of the sample meas). Soluto: Wth replacemet. umber of samples= = 5 5. The probablty of selectg ay of the possble smple radom samples P 5 The tems: 6, 3, 5, 4, 0
11 The possble samples: Sample umber() Samples 6,6 6 6, , , , 4 6 3, , , , ,.5 5, , , , , , , , , , 3,6 4, 3.5 3, ,4 3 5, = 5 4 The mea of K 5, I ths case the statstc s a ubased estmator of the parameter.
12 The Varace of Sample umber () Samples 6, , , , , , , , , , , , , , = 5, , , , , , 3 9,6 4 6, , , , The Stadard devato of =
13 Cocluso: For case of samplg wth replacemet, the sample mea s a radom varable wth mea ad varace gve by: Case (): The samplg dstrbuto wthout replacemet: Case (-): The order of selected objects s mportat. Case (-): The order of selected objects s ot mportat. Eample (3) Refer to eample () lst all possble samples of eecutves from the populato ad compute ther meas wthout replacemet f: - The order of selected objects s mportat. - The order of selected objects s ot mportat Fd:. How may dfferet samples of are possble?. The probablty of selectg ay of the possble smple radom samples. 3. The mea of (the mea of samplg dstrbuto of the sample meas), the varace of (the varace of samplg dstrbuto of the sample meas), the stadard devato of (the stadard devato of samplg dstrbuto of the sample meas). Soluto: Case (-): Wthout replacemet ad the order of selected objects s mportat: - umber of samples! K P ( )( )( 3)...( ).! P 5! 5! 0 5!! 5 3. The probablty of selectg ay of the possble smple radom samples P 0 P 3
14 . The possble samples Sample umber() 3 4 Samples 6,3 6,5 6,4 6, Sample umber() 3 4 Samples 3,6 5,6 4,6,6 5 3,5 5 5,3 6 3,4 6 4,3 7 3, 7,3 8 5,4 8 4,5 9 5, 9,5 0 4, 0,4 3. The mea & varace Sample umber() 3 Samples 6,3 6,5 6, Sample umber() Samples 0.5 3, , , , 4 6 4, , , , , , , , , , , , 3 9 0, = The mea of 0, I ths case the statstc s a ubased estmator of the parameter The Varace of = The Stadard devato of =
15 Case (-): Wthout replacemet ad the order of selected objects s ot mportat: - The umber of samples! K C.!! ( )( )( 3).. ( )...! C! 5!! 5. The probablty of selectg ay of the possble smple radom samples P C 0 The possble samples Sample 3 umber() Samples 6,3 6,5 6,4 3. The mea & varace Sample 3 umber() Samples 6,3 6,5 6, , 4 6, ,5 5 3, ,4 6 3, , 7 3, ,4 8 5, , 9 5, , 0 4, = 0 4 The mea of 0, I ths case the statstc s a ubased estmator of the parameter The Varace of = The Stadard devato of =
16 Cocluso: For case of samplg wthout replacemet, the sample mea s a radom varable wth mea ad varace gve by: ad Summary Populato Sample Samplg dstrbuto The mea Varace Stadard devato umber of samples K S S - S K Wth replacemet Wthout replacemet Wth replacemet Wthout replacemet Wth replacemet Wthout replacemet Order mportat P Order ot C mportat 6
17 Eample (4): () ssume havg populato of 6 uts, a radom sample of sze s draw from ths populato wth replacemet. The followg formato s : 34 ad Fd: -The umber of possble samples draw from ths populato equal -The mea of the samplg dstrbuto of the sample mea -The varace of the samplg dstrbuto of the sample mea Soluto: 6 34 K 36, 6. 5, K K 36 () ssume havg populato of 6 uts, a radom sample of sze s draw from ths populato wthout replacemet ad the order s mportat. The followg formato s : 95 ad Fd: -The umber of possble samples draw from ths populato equal -The mea of the samplg dstrbuto of the sample mea -The varace of the samplg dstrbuto of the sample mea Soluto: 6 K P P 30, K 30 5, K 30 (C) ssume havg populato of 6 uts, a radom sample of sze s draw from ths populato wthout replacemet ad the order s ot mportat. The followg formato s: 97.5 ad Fd: -The umber of possble samples draw from ths populato equal -The mea of the samplg dstrbuto of the sample mea -The varace of the samplg dstrbuto of the sample mea 7
18 Soluto: 6 K C C 5, K 5 5, K Eample (5) Radom sample of sze were selected from populatos wth the meas ad varace gve here. Fd the umber of samples, the mea ad stadard devato of the samplg dstrbuto of the sample mea each case: a wth replacemet b wthout replacemet ad theorder s mpor ta c wthout replacemet Soluto: a. The umber of samples or b. The umber of samples P P or c. 876 The umber of samples C 8C ad theorder s ot mpor ta t t 8
19 or Eample (6) Radom sample of sze 3 were selected from populatos. Fd the umber of samples: a. Wth replacemet. b. Wthout replacemet ad the order s mportat. c. Wthout replacemet ad the order s ot mportat. Soluto: 3 a. The umber of samples= b. The umber of samples= P3 c. The umber of samples= C3! 3 6 Eample (7) Suppose that a radom sample of sze 8 from a o-ormal dstrbuto wth mea 50 ad varace 36(wth replacemet) Fd : a. The mea of samplg dstrbuto of the sample mea. b. The stadard error of the samplg dstrbuto of the sample mea. Soluto: a b Eample (8) If 6, Fd a. umber of samples ad the probablty of selectg ay of the possble smple radom samples case of drawg wth replacemet. b. umber of samples ad the probablty of selectg ay of the possble smple radom samples case of drawg wthout replacemet, order are mportat. 9
 30!! ( )! ( ) P ( ) 6C! 6 6 5 30 6! 6 5 5!!! 6 ote:.")
 of the samplg dstrbuto of sample meas s less tha the populato dstrbuto.(wth out replacemet) 3.")
20 c. umber of samples ad the probablty of selectg ay of the possble smple radom samples case of drawg wthout replacemet, order are ot mportat. Soluto a. P b. P c. P C P ! ( ) 30!! ( )! ( ) P ( ) 6C! ! 6 5 5!!! 6 ote:. The mea of the sample meas s eactly equal to the populato mea : (e. &3) 4. The dsperso (varato, spread) of the samplg dstrbuto of sample meas s less tha the populato dstrbuto.(wth out replacemet) 3. The samplg dstrbuto of sample meas teds to become bell-shape ad to appromate the ormal probablty dstrbuto. (e.3) 0
21 s the "stadard devato of the samplg dstrbuto of the sample mea"; ad always refer to t as the "stadard error of the mea". 4- The factor ; s called the fte populato correcto factor ad ca be gored f : 0.05 (.e. do ot use the fte populato correcto uless the sample s more tha 5 percet of the sze of the populato).
22 Theorem: If the populato follows a ormal probablty dstrbuto, the for ay sample sze the samplg dstrbuto of the sample mea wll be also ormal. Suppose that ~, sze the, ; ~ ; ad let be the mea of a sample of where; case of case of replacmet wthout replacmet Theorem (The Cetral lmt Theorem): If all sample of a partcular sze are selected from ay populato, the samplg dstrbuto of the sample mea s appromately a ormal dstrbuto. Ths appromato mproves wth larger sample ( 30 ). For a populato wth a mea ad a varace the samplg dstrbuto of the meas of all possble samples of sze geerated from the populato wll be appromately ormally dstrbuted wth mea ad stadard devato / as the sample sze becomes larger ( 30 ). Facts: () The epected value of the sample mea equal the populato mea: E Where s the mea of the Samplg dstrbuto of meas. d s the mea of the populato. () If a populato s fte or f samplg s wth replacemet, the the varace of the Samplg dstrbuto of meas s:.
23 (3) If a populato s of sze, f samplg s wthout replacemet, the the varace of the Samplg dstrbuto of meas s:. (4) Samplg dstrbuto of sample meas wll be eactly ormal f the populato s ormally dstrbuted. (5) If a populato from whch samples are tae s ormally dstrbuted wth mea ad varace the the sample mea s ormally dstrbuted wth mea ad varace. (If the populato dstrbuto s ormal, Samplg dstrbuto of the wll be eactly ormal ~ (, ) ). (6) Suppose that s a radom varable havg some dstrbuto fucto wth mea ad varace. The the samplg dstrbuto of the mea approaches a ormal dstrbuto wth mea ad stadard devato / as the sample sze becomes larger, rrespectve of the shape of the orgal dstrbuto (Cetral Lmt Theorem). (If the populato dstrbuto s o-ormal, Samplg dstrbuto of the wll be appromately ormal by Cetral lmt theorem ~ (, ) ). (7) s the sample szes creases, the varablty of each samplg dstrbuto decreases so that they become creasgly more leptourtc Eample (9) Suppose that the radom varable represet the IQ (Itellgece quotet) score for studets at certa uversty, ad that ~ 00, 75. radom sample of sze 5 studets s selected. Fd the followg:. Probablty that the mea IQ score computed from the sample wll be grater tha 5.. Probablty that the mea IQ score computed from the sample wll be less tha Probablty that the mea IQ score computed from the sample wll be betwee 70 ad 30. 3

24 Soluto:. ote that ~ 00,5 00, P P Z P 80 P Z P P Z
25 (ormal populatos) Settg : (Dr. ma l Saleh: Suppose that there are two populatos ad ; ad that s a radom varable defed o the frst populato ad that s aother radom varable defed o the secod populato. radom sample of sze s selected from populato ; let ths radom sample be deoted by: The sample mea of ths sample s deoted by : Smlarly, aother depedet radom sample of sze s selected from populato ; let ths radom sample be deoted by: The sample mea of ths sample s deoted by: We request the samplg dstrbuto of the radom Varable The samplg dstrbuto of the dfferece betwee two depedet sample meas ca be obtaed a smlar way as the samplg dstrbuto of oe sample mea dscussed before. Characterstcs of the samplg dstrbuto of the dfferece betwee two sample meas : 5
26 ~, If ;, Hece, ~ ~, The Z ~ 0, Eample (0) ssume there are two types of plat. The mea heght of type s 3 whle the mea heght of type s. The varaces of the two types are 60 ad 70 respectvely ad the heghts of both types are ormally dstrbuted. Two samples radomly selected from the two populatos, from the populato of type, 0 plats are selected ad from the populato of type, 4 plats are selected. What s the probablty that the mea of the 0 plats of type wll eceed the mea of the 4 plats of type by 5 or more? Soluto: From the above formato we fd that: d; d hece:
 The electrc lght bulbs of maufacturer have a mea lfetme of 400 hours wth a stadard devato of 00 hours, whle those of maufacturer have a mea lfetme of 00 hours wth a stadard devato of 00")
27 ~ The we request the followg probablty: P 5 PZ P 5 0 0, Z The samplg dstrbuto s show the followg fgure; the area above 5 s shaded. Eample () The electrc lght bulbs of maufacturer have a mea lfetme of 400 hours wth a stadard devato of 00 hours, whle those of maufacturer have a mea lfetme of 00 hours wth a stadard devato of 00 hours. If radom sample of 5 bulbs of each brad are tested (If the populato dstrbuto s ormal), Fd:. The probablty that the brad bulbs wll have a mea lfetme whch s at most 350 hours.. The probablty that the brad bulbs wll have a mea lfetme whch s at most0 hours. 3. The probablty that the brad bulbs wll have a mea lfetme whch s at least 60 hours more tha the brad bulbs. 4. The probablty that the brad bulbs wll have a mea lfetme whch s at least 50 hours more tha the brad bulbs Soluto:. The probablty that the brad bulbs wll have a mea lfetme whch s at most 350 hours , hr
28 ~ 400, P 350 P Z P Z P Z P Z PZ The probablty that the brad bulbs wll have a mea lfetme whch s at most0 hours. 0000, hr 00 hr 5 ~ 00, P 0 P Z P Z P Z P Z PZ The probablty that the brad bulbs wll have a mea lfetme whch s at least 60 hours more tha the brad bulbs hr ~ 00, P 60 P Z PZ PZ 0 0 P Z The probablty that the brad bulbs wll have a mea lfetme whch s at least 50 hours more tha the brad bulbs hr ~ 00,
29 P 50 P Z PZ PZ 0 0 P Z
30 (Large samples) If a radom sample of observatos s selected form a bomal populato wth parameter p, the the samplg dstrbuto of the sample proporto (P = /) Wll have a mea ad a varace Whe the sample sze s large, the samplg dstrbuto of p ca be appromated by a ormal dstrbuto. The appromato wll be adequate f 00, 0.05 < < 0.95, ( 5 ) If ~ (, ), 5 ad large, where, ~ P ~ Where,, where, p themea of Var( ) p p samllg dstrbuto of proporto E the var aceof samllg dstrbuto of proporto Var( ) ( ) p ( ) ( ) p p Var P E E Eample () I a survey, 500 parets the US were ased about the mportat of sports for boys ad grls.of the parets tervewed, 300 agreed that the geders are equal ad should have equal opportutes to partcpate sports. Fd:. The sample proporto of parets who agree that the geders are equal ad should have equal opportutes.. The true proporto the populato s equal to some uow value that call,estmate the true proporto P 30
31 Soluto: 300. P p p p P ~ , The mea of the sample dstrbuto of proporto of parets who agree that the geders are equal ad should have equal opportutes. 4. The varace of the sample dstrbuto of proporto, case of samplg wth replacemet, Eample (3) Suppose that ~ I00.0.3). Usg the ormal appromato for the bomal probabltes fd the followg probablty:. P P 0.5,. P P 0.5 Soluto: p 0.3, p 0.00, p 00 P ~ 0.3, PP 0.5 P Z P Z P Z PP 0.5 P Z P Z P Z
32 Eample(4) The "cademc Ceter of Huma Studes" has a small medcal ceter whch has lmted facltes ad serous cases the patet should trasfer to the earest hosptal for treatmet, however ths s cosder as a rare case. Ffty-four percet of all studets are favor of mprovg the medcal ceter. radom sample of 000 studets s selected, ad ased f they favor of mprovg the medcal ceter. Fd the followg:. The probablty that the percetage of studets favor of mprovg the medcal ceter s less tha 50%. Soluto: For the populato of all studets, the proporto favor of mprovg the medcal ceter ; s equal to For a radom sample of sze 000, we ca verfy that both ad ( ) are greater tha 5. The, the sample proporto of studets favor of mprovg the medcal ceter follows appromately a ormal dstrbuto wth mea ad varace gve by: 0.54 ; P P hece; ~ P 0.54, Frst: Fdg the probablty that the percetage of studets favor of mprovg the medcal ceter s less tha 50%, usg the correcto for cotuty, ths probablty s computed as follows: P ( P 0.5) P Z P Z Remar :. The samplg dstrbuto of P s completely descrbed by both ad.. I case of samplg wthout replacemet, the varace of P becomes: P 3. The samplg dstrbuto of P s appromately ormally dstrbuted f s farly large( 00 ) ad ot close to 0 or (0.05 < < 0.95). rule of thumb s that the appromato s good f both ad ( ) are greater tha or equal 5 4. s sample sze a creases, the stadard error of P s decreases.
33 (Large ad depedet samples) Theorem: Gve that P ad P are sample proportos from two depedet ( ) ( ) P P ~,, , 5 Provded that 00 ( ) 5 for,. P P Eample (5) ssume that 0.8 of uversty graduates are able to pass ICDL test, whle oly 0.5 of secodary school graduates are able to pass the test. Suppose that 0 persos are sampled from the populato of uversty graduates ad that 5 persos are sampled from the populato of secodary school graduates, ad the ICDL test s held to all of them. What s the probablty that P P 0.? Soluto: fd that: P P d P P p p ( ) ( ) (0.8)(0.) 0 ad (0.5) (0.5) 5 The; P P P 0. P Z P Z Z
Chapter 3 Sampling For Proportions and Percentages
 Chapter 3 Samplg For Proportos ad Percetages I may stuatos, the characterstc uder study o whch the observatos are collected are qualtatve ature For example, the resposes of customers may marketg surveys
Summary of the lecture in Biostatistics
 Summary of the lecture Bostatstcs Probablty Desty Fucto For a cotuos radom varable, a probablty desty fucto s a fucto such that: 0 dx a b) b a dx A probablty desty fucto provdes a smple descrpto of the
Continuous Distributions
 7//3 Cotuous Dstrbutos Radom Varables of the Cotuous Type Desty Curve Percet Desty fucto, f (x) A smooth curve that ft the dstrbuto 3 4 5 6 7 8 9 Test scores Desty Curve Percet Probablty Desty Fucto, f
Lecture 3. Sampling, sampling distributions, and parameter estimation
 Lecture 3 Samplg, samplg dstrbutos, ad parameter estmato Samplg Defto Populato s defed as the collecto of all the possble observatos of terest. The collecto of observatos we take from the populato s called
Chapter 11 Systematic Sampling
 Chapter stematc amplg The sstematc samplg techue s operatoall more coveet tha the smple radom samplg. It also esures at the same tme that each ut has eual probablt of cluso the sample. I ths method of
UNIT 4 SOME OTHER SAMPLING SCHEMES
 UIT 4 SOE OTHER SAPLIG SCHEES Some Other Samplg Schemes Structure 4. Itroducto Objectves 4. Itroducto to Systematc Samplg 4.3 ethods of Systematc Samplg Lear Systematc Samplg Crcular Systematc Samplg Advatages
CHAPTER VI Statistical Analysis of Experimental Data
 Chapter VI Statstcal Aalyss of Expermetal Data CHAPTER VI Statstcal Aalyss of Expermetal Data Measuremets do ot lead to a uque value. Ths s a result of the multtude of errors (maly radom errors) that ca
Econometric Methods. Review of Estimation
 Ecoometrc Methods Revew of Estmato Estmatg the populato mea Radom samplg Pot ad terval estmators Lear estmators Ubased estmators Lear Ubased Estmators (LUEs) Effcecy (mmum varace) ad Best Lear Ubased Estmators
{ }{ ( )} (, ) = ( ) ( ) ( ) Chapter 14 Exercises in Sampling Theory. Exercise 1 (Simple random sampling): Solution:
} (, ) = ( ) ( ) ( ) Chapter 14 Exercises in Sampling Theory. Exercise 1 (Simple random sampling): Solution:") Chapter 4 Exercses Samplg Theory Exercse (Smple radom samplg: Let there be two correlated radom varables X ad A sample of sze s draw from a populato by smple radom samplg wthout replacemet The observed
Chapter 4 Exercses Samplg Theory Exercse (Smple radom samplg: Let there be two correlated radom varables X ad A sample of sze s draw from a populato by smple radom samplg wthout replacemet The observed
Class 13,14 June 17, 19, 2015
 Class 3,4 Jue 7, 9, 05 Pla for Class3,4:. Samplg dstrbuto of sample mea. The Cetral Lmt Theorem (CLT). Cofdece terval for ukow mea.. Samplg Dstrbuto for Sample mea. Methods used are based o CLT ( Cetral
To use adaptive cluster sampling we must first make some definitions of the sampling universe:
 8.3 ADAPTIVE SAMPLING Most of the methods dscussed samplg theory are lmted to samplg desgs hch the selecto of the samples ca be doe before the survey, so that oe of the decsos about samplg deped ay ay
PROPERTIES OF GOOD ESTIMATORS
 ESTIMATION INTRODUCTION Estmato s the statstcal process of fdg a appromate value for a populato parameter. A populato parameter s a characterstc of the dstrbuto of a populato such as the populato mea,
Chapter -2 Simple Random Sampling
 Chapter - Smple Radom Samplg Smple radom samplg (SRS) s a method of selecto of a sample comprsg of umber of samplg uts out of the populato havg umber of samplg uts such that every samplg ut has a equal
Chapter -2 Simple Random Sampling
 Chapter - Smple Radom Samplg Smple radom samplg (SRS) s a method of selecto of a sample comprsg of umber of samplg uts out of the populato havg umber of samplg uts such that every samplg ut has a equal
1. The weight of six Golden Retrievers is 66, 61, 70, 67, 92 and 66 pounds. The weight of six Labrador Retrievers is 54, 60, 72, 78, 84 and 67.
 Ecoomcs 3 Itroducto to Ecoometrcs Sprg 004 Professor Dobk Name Studet ID Frst Mdterm Exam You must aswer all the questos. The exam s closed book ad closed otes. You may use your calculators but please
Chapter 8. Inferences about More Than Two Population Central Values
 Chapter 8. Ifereces about More Tha Two Populato Cetral Values Case tudy: Effect of Tmg of the Treatmet of Port-We tas wth Lasers ) To vestgate whether treatmet at a youg age would yeld better results tha
hp calculators HP 30S Statistics Averages and Standard Deviations Average and Standard Deviation Practice Finding Averages and Standard Deviations
 HP 30S Statstcs Averages ad Stadard Devatos Average ad Stadard Devato Practce Fdg Averages ad Stadard Devatos HP 30S Statstcs Averages ad Stadard Devatos Average ad stadard devato The HP 30S provdes several
MEASURES OF DISPERSION
 MEASURES OF DISPERSION Measure of Cetral Tedecy: Measures of Cetral Tedecy ad Dsperso ) Mathematcal Average: a) Arthmetc mea (A.M.) b) Geometrc mea (G.M.) c) Harmoc mea (H.M.) ) Averages of Posto: a) Meda
Simple Linear Regression
 Statstcal Methods I (EST 75) Page 139 Smple Lear Regresso Smple regresso applcatos are used to ft a model descrbg a lear relatoshp betwee two varables. The aspects of least squares regresso ad correlato
Chapter 13, Part A Analysis of Variance and Experimental Design. Introduction to Analysis of Variance. Introduction to Analysis of Variance
 Chapter, Part A Aalyss of Varace ad Epermetal Desg Itroducto to Aalyss of Varace Aalyss of Varace: Testg for the Equalty of Populato Meas Multple Comparso Procedures Itroducto to Aalyss of Varace Aalyss
A Combination of Adaptive and Line Intercept Sampling Applicable in Agricultural and Environmental Studies
 ISSN 1684-8403 Joural of Statstcs Volume 15, 008, pp. 44-53 Abstract A Combato of Adaptve ad Le Itercept Samplg Applcable Agrcultural ad Evrometal Studes Azmer Kha 1 A adaptve procedure s descrbed for
Mean is only appropriate for interval or ratio scales, not ordinal or nominal.
 Mea Same as ordary average Sum all the data values ad dvde by the sample sze. x = ( x + x +... + x Usg summato otato, we wrte ths as x = x = x = = ) x Mea s oly approprate for terval or rato scales, ot
Parameter, Statistic and Random Samples
 Parameter, Statstc ad Radom Samples A parameter s a umber that descrbes the populato. It s a fxed umber, but practce we do ot kow ts value. A statstc s a fucto of the sample data,.e., t s a quatty whose
STA 105-M BASIC STATISTICS (This is a multiple choice paper.)
") DCDM BUSINESS SCHOOL September Mock Eamatos STA 0-M BASIC STATISTICS (Ths s a multple choce paper.) Tme: hours 0 mutes INSTRUCTIONS TO CANDIDATES Do ot ope ths questo paper utl you have bee told to do
DCDM BUSINESS SCHOOL September Mock Eamatos STA 0-M BASIC STATISTICS (Ths s a multple choce paper.) Tme: hours 0 mutes INSTRUCTIONS TO CANDIDATES Do ot ope ths questo paper utl you have bee told to do
STATISTICAL PROPERTIES OF LEAST SQUARES ESTIMATORS. x, where. = y - ˆ " 1
 STATISTICAL PROPERTIES OF LEAST SQUARES ESTIMATORS Recall Assumpto E(Y x) η 0 + η x (lear codtoal mea fucto) Data (x, y ), (x 2, y 2 ),, (x, y ) Least squares estmator ˆ E (Y x) ˆ " 0 + ˆ " x, where ˆ
LECTURE - 4 SIMPLE RANDOM SAMPLING DR. SHALABH DEPARTMENT OF MATHEMATICS AND STATISTICS INDIAN INSTITUTE OF TECHNOLOGY KANPUR
 amplg Theory MODULE II LECTURE - 4 IMPLE RADOM AMPLIG DR. HALABH DEPARTMET OF MATHEMATIC AD TATITIC IDIA ITITUTE OF TECHOLOGY KAPUR Estmato of populato mea ad populato varace Oe of the ma objectves after
f f... f 1 n n (ii) Median : It is the value of the middle-most observation(s).
 Median : It is the value of the middle-most observation(s).") CHAPTER STATISTICS Pots to Remember :. Facts or fgures, collected wth a defte pupose, are called Data.. Statstcs s the area of study dealg wth the collecto, presetato, aalyss ad terpretato of data.. The
CHAPTER STATISTICS Pots to Remember :. Facts or fgures, collected wth a defte pupose, are called Data.. Statstcs s the area of study dealg wth the collecto, presetato, aalyss ad terpretato of data.. The
Lecture 7. Confidence Intervals and Hypothesis Tests in the Simple CLR Model
 Lecture 7. Cofdece Itervals ad Hypothess Tests the Smple CLR Model I lecture 6 we troduced the Classcal Lear Regresso (CLR) model that s the radom expermet of whch the data Y,,, K, are the outcomes. The
STA 108 Applied Linear Models: Regression Analysis Spring Solution for Homework #1
 STA 08 Appled Lear Models: Regresso Aalyss Sprg 0 Soluto for Homework #. Let Y the dollar cost per year, X the umber of vsts per year. The the mathematcal relato betwee X ad Y s: Y 300 + X. Ths s a fuctoal
Lecture Notes Types of economic variables
 Lecture Notes 3 1. Types of ecoomc varables () Cotuous varable takes o a cotuum the sample space, such as all pots o a le or all real umbers Example: GDP, Polluto cocetrato, etc. () Dscrete varables fte
best estimate (mean) for X uncertainty or error in the measurement (systematic, random or statistical) best
 for X uncertainty or error in the measurement (systematic, random or statistical) best") Error Aalyss Preamble Wheever a measuremet s made, the result followg from that measuremet s always subject to ucertaty The ucertaty ca be reduced by makg several measuremets of the same quatty or by mprovg
Error Aalyss Preamble Wheever a measuremet s made, the result followg from that measuremet s always subject to ucertaty The ucertaty ca be reduced by makg several measuremets of the same quatty or by mprovg
STATISTICAL INFERENCE
 (STATISTICS) STATISTICAL INFERENCE COMPLEMENTARY COURSE B.Sc. MATHEMATICS III SEMESTER ( Admsso) UNIVERSITY OF CALICUT SCHOOL OF DISTANCE EDUCATION CALICUT UNIVERSITY P.O., MALAPPURAM, KERALA, INDIA -
Unsupervised Learning and Other Neural Networks
 CSE 53 Soft Computg NOT PART OF THE FINAL Usupervsed Learg ad Other Neural Networs Itroducto Mture Destes ad Idetfablty ML Estmates Applcato to Normal Mtures Other Neural Networs Itroducto Prevously, all
Module 7. Lecture 7: Statistical parameter estimation
 Lecture 7: Statstcal parameter estmato Parameter Estmato Methods of Parameter Estmato 1) Method of Matchg Pots ) Method of Momets 3) Mamum Lkelhood method Populato Parameter Sample Parameter Ubased estmato
Lecture 3 Probability review (cont d)
") STATS 00: Itroducto to Statstcal Iferece Autum 06 Lecture 3 Probablty revew (cot d) 3. Jot dstrbutos If radom varables X,..., X k are depedet, the ther dstrbuto may be specfed by specfyg the dvdual dstrbuto
STATS 00: Itroducto to Statstcal Iferece Autum 06 Lecture 3 Probablty revew (cot d) 3. Jot dstrbutos If radom varables X,..., X k are depedet, the ther dstrbuto may be specfed by specfyg the dvdual dstrbuto
Special Instructions / Useful Data
 JAM 6 Set of all real umbers P A..d. B, p Posso Specal Istructos / Useful Data x,, :,,, x x Probablty of a evet A Idepedetly ad detcally dstrbuted Bomal dstrbuto wth parameters ad p Posso dstrbuto wth
Third handout: On the Gini Index
 Thrd hadout: O the dex Corrado, a tala statstca, proposed (, 9, 96) to measure absolute equalt va the mea dfferece whch s defed as ( / ) where refers to the total umber of dvduals socet. Assume that. The
UNIVERSITY OF OSLO DEPARTMENT OF ECONOMICS
 UNIVERSITY OF OSLO DEPARTMENT OF ECONOMICS Postpoed exam: ECON430 Statstcs Date of exam: Jauary 0, 0 Tme for exam: 09:00 a.m. :00 oo The problem set covers 5 pages Resources allowed: All wrtte ad prted
THE ROYAL STATISTICAL SOCIETY HIGHER CERTIFICATE
 THE ROYAL STATISTICAL SOCIETY 00 EXAMINATIONS SOLUTIONS HIGHER CERTIFICATE PAPER I STATISTICAL THEORY The Socety provdes these solutos to assst caddates preparg for the examatos future years ad for the
Chapter 5 Properties of a Random Sample
 Lecture 6 o BST 63: Statstcal Theory I Ku Zhag, /0/008 Revew for the prevous lecture Cocepts: t-dstrbuto, F-dstrbuto Theorems: Dstrbutos of sample mea ad sample varace, relatoshp betwee sample mea ad sample
STK4011 and STK9011 Autumn 2016
 STK4 ad STK9 Autum 6 Pot estmato Covers (most of the followg materal from chapter 7: Secto 7.: pages 3-3 Secto 7..: pages 3-33 Secto 7..: pages 35-3 Secto 7..3: pages 34-35 Secto 7.3.: pages 33-33 Secto
Estimation of Stress- Strength Reliability model using finite mixture of exponential distributions
 Iteratoal Joural of Computatoal Egeerg Research Vol, 0 Issue, Estmato of Stress- Stregth Relablty model usg fte mxture of expoetal dstrbutos K.Sadhya, T.S.Umamaheswar Departmet of Mathematcs, Lal Bhadur
Discrete Mathematics and Probability Theory Fall 2016 Seshia and Walrand DIS 10b
 CS 70 Dscrete Mathematcs ad Probablty Theory Fall 206 Sesha ad Walrad DIS 0b. Wll I Get My Package? Seaky delvery guy of some compay s out delverg packages to customers. Not oly does he had a radom package
Ordinary Least Squares Regression. Simple Regression. Algebra and Assumptions.
 Ordary Least Squares egresso. Smple egresso. Algebra ad Assumptos. I ths part of the course we are gog to study a techque for aalysg the lear relatoshp betwee two varables Y ad X. We have pars of observatos
12.2 Estimating Model parameters Assumptions: ox and y are related according to the simple linear regression model
 1. Estmatg Model parameters Assumptos: ox ad y are related accordg to the smple lear regresso model (The lear regresso model s the model that says that x ad y are related a lear fasho, but the observed
Lecture 1 Review of Fundamental Statistical Concepts
 Lecture Revew of Fudametal Statstcal Cocepts Measures of Cetral Tedecy ad Dsperso A word about otato for ths class: Idvduals a populato are desgated, where the dex rages from to N, ad N s the total umber
Lesson 3. Group and individual indexes. Design and Data Analysis in Psychology I English group (A) School of Psychology Dpt. Experimental Psychology
 School of Psychology Dpt. Experimental Psychology") 17/03/015 School of Psychology Dpt. Expermetal Psychology Desg ad Data Aalyss Psychology I Eglsh group (A) Salvador Chacó Moscoso Susaa Saduvete Chaves Mlagrosa Sáchez Martí Lesso 3 Group ad dvdual dexes
17/03/015 School of Psychology Dpt. Expermetal Psychology Desg ad Data Aalyss Psychology I Eglsh group (A) Salvador Chacó Moscoso Susaa Saduvete Chaves Mlagrosa Sáchez Martí Lesso 3 Group ad dvdual dexes
= 1. UCLA STAT 13 Introduction to Statistical Methods for the Life and Health Sciences. Parameters and Statistics. Measures of Centrality
 UCLA STAT Itroducto to Statstcal Methods for the Lfe ad Health Sceces Istructor: Ivo Dov, Asst. Prof. of Statstcs ad Neurology Teachg Assstats: Fred Phoa, Krste Johso, Mg Zheg & Matlda Hseh Uversty of
Simulation Output Analysis
 Smulato Output Aalyss Summary Examples Parameter Estmato Sample Mea ad Varace Pot ad Iterval Estmato ermatg ad o-ermatg Smulato Mea Square Errors Example: Sgle Server Queueg System x(t) S 4 S 4 S 3 S 5
SPECIAL CONSIDERATIONS FOR VOLUMETRIC Z-TEST FOR PROPORTIONS
 SPECIAL CONSIDERAIONS FOR VOLUMERIC Z-ES FOR PROPORIONS Oe s stctve reacto to the questo of whether two percetages are sgfcatly dfferet from each other s to treat them as f they were proportos whch the
Chapter 8: Statistical Analysis of Simulated Data
 Marquette Uversty MSCS600 Chapter 8: Statstcal Aalyss of Smulated Data Dael B. Rowe, Ph.D. Departmet of Mathematcs, Statstcs, ad Computer Scece Copyrght 08 by Marquette Uversty MSCS600 Ageda 8. The Sample
Comparison of Dual to Ratio-Cum-Product Estimators of Population Mean
 Research Joural of Mathematcal ad Statstcal Sceces ISS 30 6047 Vol. 1(), 5-1, ovember (013) Res. J. Mathematcal ad Statstcal Sc. Comparso of Dual to Rato-Cum-Product Estmators of Populato Mea Abstract
Sampling Theory MODULE X LECTURE - 35 TWO STAGE SAMPLING (SUB SAMPLING)
") Samplg Theory ODULE X LECTURE - 35 TWO STAGE SAPLIG (SUB SAPLIG) DR SHALABH DEPARTET OF ATHEATICS AD STATISTICS IDIA ISTITUTE OF TECHOLOG KAPUR Two stage samplg wth uequal frst stage uts: Cosder two stage
Samplg Theory ODULE X LECTURE - 35 TWO STAGE SAPLIG (SUB SAPLIG) DR SHALABH DEPARTET OF ATHEATICS AD STATISTICS IDIA ISTITUTE OF TECHOLOG KAPUR Two stage samplg wth uequal frst stage uts: Cosder two stage
STRATIFIED SAMPLING IN AGRICULTURAL SURVEYS
 3 STRATIFIED SAMPLIG I AGRICULTURAL SURVEYS austav Adtya Ida Agrcultural Statstcs Research Isttute, ew Delh-00 3. ITRODUCTIO The prme objectve of a sample survey s to obta fereces about the characterstc
Measures of Dispersion
 Chapter 8 Measures of Dsperso Defto of Measures of Dsperso (page 31) A measure of dsperso s a descrptve summary measure that helps us characterze the data set terms of how vared the observatos are from
22 Nonparametric Methods.
 22 oparametrc Methods. I parametrc models oe assumes apror that the dstrbutos have a specfc form wth oe or more ukow parameters ad oe tres to fd the best or atleast reasoably effcet procedures that aswer
A Study of the Reproducibility of Measurements with HUR Leg Extension/Curl Research Line
 HUR Techcal Report 000--9 verso.05 / Frak Borg (borgbros@ett.f) A Study of the Reproducblty of Measuremets wth HUR Leg Eteso/Curl Research Le A mportat property of measuremets s that the results should
Lecture 1. (Part II) The number of ways of partitioning n distinct objects into k distinct groups containing n 1,
 The number of ways of partitioning n distinct objects into k distinct groups containing n 1,") Lecture (Part II) Materals Covered Ths Lecture: Chapter 2 (2.6 --- 2.0) The umber of ways of parttog dstct obects to dstct groups cotag, 2,, obects, respectvely, where each obect appears exactly oe group
Lecture (Part II) Materals Covered Ths Lecture: Chapter 2 (2.6 --- 2.0) The umber of ways of parttog dstct obects to dstct groups cotag, 2,, obects, respectvely, where each obect appears exactly oe group
Outline. Point Pattern Analysis Part I. Revisit IRP/CSR
 Pot Patter Aalyss Part I Outle Revst IRP/CSR, frst- ad secod order effects What s pot patter aalyss (PPA)? Desty-based pot patter measures Dstace-based pot patter measures Revst IRP/CSR Equal probablty:
Bootstrap Method for Testing of Equality of Several Coefficients of Variation
 Cloud Publcatos Iteratoal Joural of Advaced Mathematcs ad Statstcs Volume, pp. -6, Artcle ID Sc- Research Artcle Ope Access Bootstrap Method for Testg of Equalty of Several Coeffcets of Varato Dr. Navee
Multiple Regression. More than 2 variables! Grade on Final. Multiple Regression 11/21/2012. Exam 2 Grades. Exam 2 Re-grades
 STAT 101 Dr. Kar Lock Morga 11/20/12 Exam 2 Grades Multple Regresso SECTIONS 9.2, 10.1, 10.2 Multple explaatory varables (10.1) Parttog varablty R 2, ANOVA (9.2) Codtos resdual plot (10.2) Trasformatos
Lecture 9. Some Useful Discrete Distributions. Some Useful Discrete Distributions. The observations generated by different experiments have
 NM 7 Lecture 9 Some Useful Dscrete Dstrbutos Some Useful Dscrete Dstrbutos The observatos geerated by dfferet eermets have the same geeral tye of behavor. Cosequetly, radom varables assocated wth these
Module 7: Probability and Statistics
 Lecture 4: Goodess of ft tests. Itroducto Module 7: Probablty ad Statstcs I the prevous two lectures, the cocepts, steps ad applcatos of Hypotheses testg were dscussed. Hypotheses testg may be used to
Random Variables and Probability Distributions
 Radom Varables ad Probablty Dstrbutos * If X : S R s a dscrete radom varable wth rage {x, x, x 3,. } the r = P (X = xr ) = * Let X : S R be a dscrete radom varable wth rage {x, x, x 3,.}.If x r P(X = x
Simple Linear Regression
 Correlato ad Smple Lear Regresso Berl Che Departmet of Computer Scece & Iformato Egeerg Natoal Tawa Normal Uversty Referece:. W. Navd. Statstcs for Egeerg ad Scetsts. Chapter 7 (7.-7.3) & Teachg Materal
ENGI 4421 Joint Probability Distributions Page Joint Probability Distributions [Navidi sections 2.5 and 2.6; Devore sections
 ENGI 441 Jot Probablty Dstrbutos Page 7-01 Jot Probablty Dstrbutos [Navd sectos.5 ad.6; Devore sectos 5.1-5.] The jot probablty mass fucto of two dscrete radom quattes, s, P ad p x y x y The margal probablty
ENGI 3423 Simple Linear Regression Page 12-01
 ENGI 343 mple Lear Regresso Page - mple Lear Regresso ometmes a expermet s set up where the expermeter has cotrol over the values of oe or more varables X ad measures the resultg values of aother varable
Application of Calibration Approach for Regression Coefficient Estimation under Two-stage Sampling Design
 Authors: Pradp Basak, Kaustav Adtya, Hukum Chadra ad U.C. Sud Applcato of Calbrato Approach for Regresso Coeffcet Estmato uder Two-stage Samplg Desg Pradp Basak, Kaustav Adtya, Hukum Chadra ad U.C. Sud
Chapter 13 Student Lecture Notes 13-1
 Chapter 3 Studet Lecture Notes 3- Basc Busess Statstcs (9 th Edto) Chapter 3 Smple Lear Regresso 4 Pretce-Hall, Ic. Chap 3- Chapter Topcs Types of Regresso Models Determg the Smple Lear Regresso Equato
Arithmetic Mean Suppose there is only a finite number N of items in the system of interest. Then the population arithmetic mean is
 Topc : Probablty Theory Module : Descrptve Statstcs Measures of Locato Descrptve statstcs are measures of locato ad shape that perta to probablty dstrbutos The prmary measures of locato are the arthmetc
Correlation and Simple Linear Regression
 Correlato ad Smple Lear Regresso Berl Che Departmet of Computer Scece & Iformato Egeerg Natoal Tawa Normal Uverst Referece:. W. Navd. Statstcs for Egeerg ad Scetsts. Chapter 7 (7.-7.3) & Teachg Materal
MS exam problems Fall 2012
 MS exam problems Fall 01 (From: Rya Mart) 1. (Stat 401) Cosder the followg game wth a box that cotas te balls two red, three blue, ad fve gree. A player selects two balls from the box at radom, wthout
( ) = ( ) ( ) Chapter 13 Asymptotic Theory and Stochastic Regressors. Stochastic regressors model
 = ( ) ( ) Chapter 13 Asymptotic Theory and Stochastic Regressors. Stochastic regressors model") Chapter 3 Asmptotc Theor ad Stochastc Regressors The ature of eplaator varable s assumed to be o-stochastc or fed repeated samples a regresso aalss Such a assumpto s approprate for those epermets whch
Chapter 3 Asmptotc Theor ad Stochastc Regressors The ature of eplaator varable s assumed to be o-stochastc or fed repeated samples a regresso aalss Such a assumpto s approprate for those epermets whch
CHAPTER 3 POSTERIOR DISTRIBUTIONS
 CHAPTER 3 POSTERIOR DISTRIBUTIONS If scece caot measure the degree of probablt volved, so much the worse for scece. The practcal ma wll stck to hs apprecatve methods utl t does, or wll accept the results
Multiple Linear Regression Analysis
 LINEA EGESSION ANALYSIS MODULE III Lecture - 4 Multple Lear egresso Aalyss Dr. Shalabh Departmet of Mathematcs ad Statstcs Ida Isttute of Techology Kapur Cofdece terval estmato The cofdece tervals multple
THE ROYAL STATISTICAL SOCIETY 2016 EXAMINATIONS SOLUTIONS HIGHER CERTIFICATE MODULE 5
 THE ROYAL STATISTICAL SOCIETY 06 EAMINATIONS SOLUTIONS HIGHER CERTIFICATE MODULE 5 The Socety s provdg these solutos to assst cadtes preparg for the examatos 07. The solutos are teded as learg ads ad should
THE ROYAL STATISTICAL SOCIETY GRADUATE DIPLOMA
 THE ROYAL STATISTICAL SOCIETY EXAMINATIONS SOLUTIONS GRADUATE DIPLOMA PAPER II STATISTICAL THEORY & METHODS The Socety provdes these solutos to assst caddates preparg for the examatos future years ad for
Chapter 5 Elementary Statistics, Empirical Probability Distributions, and More on Simulation
 Chapter 5 Elemetary Statstcs, Emprcal Probablty Dstrbutos, ad More o Smulato Cotets Coectg Probablty wth Observatos of Data Sample Mea ad Sample Varace Regresso Techques Emprcal Dstrbuto Fuctos More o
Handout #1. Title: Foundations of Econometrics. POPULATION vs. SAMPLE
 Hadout #1 Ttle: Foudatos of Ecoometrcs Course: Eco 367 Fall/015 Istructor: Dr. I-Mg Chu POPULATION vs. SAMPLE From the Bureau of Labor web ste (http://www.bls.gov), we ca fd the uemploymet rate for each
is the score of the 1 st student, x
 8 Chapter Collectg, Dsplayg, ad Aalyzg your Data. Descrptve Statstcs Sectos explaed how to choose a sample, how to collect ad orgaze data from the sample, ad how to dsplay your data. I ths secto, you wll
ECONOMETRIC THEORY. MODULE VIII Lecture - 26 Heteroskedasticity
 ECONOMETRIC THEORY MODULE VIII Lecture - 6 Heteroskedastcty Dr. Shalabh Departmet of Mathematcs ad Statstcs Ida Isttute of Techology Kapur . Breusch Paga test Ths test ca be appled whe the replcated data
X ε ) = 0, or equivalently, lim
 = 0, or equivalently, lim") Revew for the prevous lecture Cocepts: order statstcs Theorems: Dstrbutos of order statstcs Examples: How to get the dstrbuto of order statstcs Chapter 5 Propertes of a Radom Sample Secto 55 Covergece
Revew for the prevous lecture Cocepts: order statstcs Theorems: Dstrbutos of order statstcs Examples: How to get the dstrbuto of order statstcs Chapter 5 Propertes of a Radom Sample Secto 55 Covergece
Point Estimation: definition of estimators
 Pot Estmato: defto of estmators Pot estmator: ay fucto W (X,..., X ) of a data sample. The exercse of pot estmato s to use partcular fuctos of the data order to estmate certa ukow populato parameters.
1 Onto functions and bijections Applications to Counting
 1 Oto fuctos ad bectos Applcatos to Coutg Now we move o to a ew topc. Defto 1.1 (Surecto. A fucto f : A B s sad to be surectve or oto f for each b B there s some a A so that f(a B. What are examples of
Midterm Exam 1, section 1 (Solution) Thursday, February hour, 15 minutes
 Thursday, February hour, 15 minutes") coometrcs, CON Sa Fracsco State Uversty Mchael Bar Sprg 5 Mdterm am, secto Soluto Thursday, February 6 hour, 5 mutes Name: Istructos. Ths s closed book, closed otes eam.. No calculators of ay kd are allowed..
coometrcs, CON Sa Fracsco State Uversty Mchael Bar Sprg 5 Mdterm am, secto Soluto Thursday, February 6 hour, 5 mutes Name: Istructos. Ths s closed book, closed otes eam.. No calculators of ay kd are allowed..
Chapter 14 Logistic Regression Models
 Chapter 4 Logstc Regresso Models I the lear regresso model X β + ε, there are two types of varables explaatory varables X, X,, X k ad study varable y These varables ca be measured o a cotuous scale as
Functions of Random Variables
 Fuctos of Radom Varables Chapter Fve Fuctos of Radom Varables 5. Itroducto A geeral egeerg aalyss model s show Fg. 5.. The model output (respose) cotas the performaces of a system or product, such as weght,
TESTS BASED ON MAXIMUM LIKELIHOOD
 ESE 5 Toy E. Smth. The Basc Example. TESTS BASED ON MAXIMUM LIKELIHOOD To llustrate the propertes of maxmum lkelhood estmates ad tests, we cosder the smplest possble case of estmatg the mea of the ormal
UNIVERSITY OF OSLO DEPARTMENT OF ECONOMICS
 UNIVERSITY OF OSLO DEPARTMENT OF ECONOMICS Exam: ECON430 Statstcs Date of exam: Frday, December 8, 07 Grades are gve: Jauary 4, 08 Tme for exam: 0900 am 00 oo The problem set covers 5 pages Resources allowed:
Chapter 4 Multiple Random Variables
 Revew for the prevous lecture: Theorems ad Examples: How to obta the pmf (pdf) of U = g (, Y) ad V = g (, Y) Chapter 4 Multple Radom Varables Chapter 44 Herarchcal Models ad Mxture Dstrbutos Examples:
Introduction to local (nonparametric) density estimation. methods
 density estimation. methods") Itroducto to local (oparametrc) desty estmato methods A slecture by Yu Lu for ECE 66 Sprg 014 1. Itroducto Ths slecture troduces two local desty estmato methods whch are Parze desty estmato ad k-earest
Itroducto to local (oparametrc) desty estmato methods A slecture by Yu Lu for ECE 66 Sprg 014 1. Itroducto Ths slecture troduces two local desty estmato methods whch are Parze desty estmato ad k-earest
Lecture Notes 2. The ability to manipulate matrices is critical in economics.
 Lecture Notes. Revew of Matrces he ablt to mapulate matrces s crtcal ecoomcs.. Matr a rectagular arra of umbers, parameters, or varables placed rows ad colums. Matrces are assocated wth lear equatos. lemets
Sampling Theory MODULE V LECTURE - 14 RATIO AND PRODUCT METHODS OF ESTIMATION
 Samplg Theor MODULE V LECTUE - 4 ATIO AND PODUCT METHODS OF ESTIMATION D. SHALABH DEPATMENT OF MATHEMATICS AND STATISTICS INDIAN INSTITUTE OF TECHNOLOG KANPU A mportat objectve a statstcal estmato procedure
Statistics Descriptive and Inferential Statistics. Instructor: Daisuke Nagakura
 Statstcs Descrptve ad Iferetal Statstcs Istructor: Dasuke Nagakura (agakura@z7.keo.jp) 1 Today s topc Today, I talk about two categores of statstcal aalyses, descrptve statstcs ad feretal statstcs, ad
2.28 The Wall Street Journal is probably referring to the average number of cubes used per glass measured for some population that they have chosen.
 .5 x 54.5 a. x 7. 786 7 b. The raked observatos are: 7.4, 7.5, 7.7, 7.8, 7.9, 8.0, 8.. Sce the sample sze 7 s odd, the meda s the (+)/ 4 th raked observato, or meda 7.8 c. The cosumer would more lkely
Lecture 8: Linear Regression
 Lecture 8: Lear egresso May 4, GENOME 56, Sprg Goals Develop basc cocepts of lear regresso from a probablstc framework Estmatg parameters ad hypothess testg wth lear models Lear regresso Su I Lee, CSE
b. There appears to be a positive relationship between X and Y; that is, as X increases, so does Y.
 .46. a. The frst varable (X) s the frst umber the par ad s plotted o the horzotal axs, whle the secod varable (Y) s the secod umber the par ad s plotted o the vertcal axs. The scatterplot s show the fgure
UNIVERSITY OF EAST ANGLIA. Main Series UG Examination
 UNIVERSITY OF EAST ANGLIA School of Ecoomcs Ma Seres UG Examato 03-4 INTRODUCTORY MATHEMATICS AND STATISTICS FOR ECONOMISTS ECO-400Y Tme allowed: 3 hours Aswer ALL questos from both Sectos. Aswer EACH
Analysis of Variance with Weibull Data
 Aalyss of Varace wth Webull Data Lahaa Watthaacheewaul Abstract I statstcal data aalyss by aalyss of varace, the usual basc assumptos are that the model s addtve ad the errors are radomly, depedetly, ad
å 1 13 Practice Final Examination Solutions - = CS109 Dec 5, 2018
 Chrs Pech Fal Practce CS09 Dec 5, 08 Practce Fal Examato Solutos. Aswer: 4/5 8/7. There are multle ways to obta ths aswer; here are two: The frst commo method s to sum over all ossbltes for the rak of