Measuring Total Reactive N and its Composition
|
|
|
- Shannon Potter
- 5 years ago
- Views:
Transcription
1 Measuring Total Reactive N and its Composition Bret A. Schichtel 1, Katie Benedict 2, Christian M. Carrico 2, Anthony Prenni 2, Jr. 2, Ezra Levin 2, Derek Day 3, Doris Chen 2, John Ray 1, William C. Malm 3, Krisiti Gebhart 1, Mike Barna 1, Jeffrey L. Collett 2, Sonia M. Kreidenweis 2 1 National Park Service, CSU/CIRA, Fort Collins, Colorado Department of Atmospheric Science, Colorado State University 3 Cooperative Institute for Research in the Atmosphere (CIRA), CSU
2 Long-Term Reactive Nitrogen Deposition Assessment Goals Important (deposition levels and bioavailability) reactive nitrogen constituents deposited in sensitive ecosystem are known Methods to measure important constituents suitable for routine monitoring networks are developed Models to simulate total reactive nitrogen deposition in sensitive ecosystem and its composition are developed Tools to assess the causes for excess reactive nitrogen deposition, e.g. source apportionment, are developed
 (Reduced)")

 + R-ONO (organic")
.")
 + other reduced")
3 Measuring Total Chemically Reactive N TCRN = NOy + NHx (Oxidized) (Reduced) NOy NO + NO 2 + NO 3 + 2xN 2 O 5 + HNO 3 + HONO + HO 2 NO 2 + R-ONO 2 (organic nitrates such as PAN and alkyl nitrates) + R-ONO (organic nitrites) + NO 3 - (particulate nitrate). NHx = NH 3 + NH 4 + amines (R-NHx) + HCN (acetonitrile) + other reduced organic molecules Everything but N 2 O and N 2
4 NPS and Collaborators Efforts to Develop Methods and Understand Missing Components ROMANS II Characterization of total RN deposition and its sources at Rocky Mtn NP; Nov 2008-Nov 2009 GrandTReNDS - Characterization of total RN deposition and its sources in Grand Teton NP; April Sep 2011 Begin to address some needs listed in the table: Quantify the contribution of organic N to total N deposition Speciated organic and inorganic wet and dry N flux in areas relevant to critical loads research IMPROVE NH4, NH3, & amines measurement study, Apr 11 Aug 12 CSU- CO Front Range passive NH3 network Modeling reactive N in Rocky Mountains using CAMx; Barna et al., Snow pack chemistry George Ingersoll will send snow pack samples to CSU to be analyzed for ON, NO3, NH4, SO4and analyzed for chemistry New fine particulate total nitrogen measurement (Chow and Watson, DRI)

5 GrandTReNDS (April Sept 2011) Grand Tetons Reactive Nitrogen Deposition Study Grand Teton NP Personnel Forest Service Personnel Grand Targhee Ski Area Planning NPS: Bret Schichtel, Ellen Porter, Mike Barna, Kristi Gebhart, William Malm CSU: Jeff Collet, Sonia Kreidenweis Data Collection and Analysis Derek Day Yi Li Amy Sullivan Tony Prenni Doris Chen Ezra Levin, Yury Desyaterik, Misha Schurman, Taehyoung Lee
6 To identify issues, develop solutions, and track changes in N deposition: Determine the total nitrogen deposition in Grand Teton and its composition Any past or future projections based on incomplete data assumes the omitted fraction is small, remains constant in time, or highly correlated with measured N Determine the origin of deposited nitrogen N Deposition in Yellowstone (Teton) has increased Why? Increased natural emissions from fires or climate change? Increased anthropogenic emission? What important anthropogenic sources are likely to change? Bill in Idaho House to strengthen Right to Farm Act: The bill would make it easier for farmers to enlarge their feedlot operations but more difficult for opponents to challenge those plans in court (Intermountain Farm & Ranch, 966 March 4 th, 2011)


7 GrandTReNDS Grand Tetons Reactive Nitrogen Deposition Study Grand Targhee Snowfall ~50 feet by mid-april
 (2 week and 4 week) 7/21 9/20/2011 Precipitation Passive (NH 3 & HNO 3 ) 7/5 9/20/2011 Passive (NH 3 & HNO 3 ) 7/5 9/20/2011 Daily URG Daily HiVol")
8 Targhee Ski Resort Daily URG Daily HiVol Precipitation Met Station Passive, PILS Gas Rack Sizing Rack, AMS 4/21 (lower) 7/27-9/20 (upper) Driggs Daily URG Precipitation Passive (NH 3 & HNO 3 ) Met. Station 4/6 9/20/2011 Passive (NH 3 & HNO 3 ) (2 week and 4 week) 7/21 9/20/2011 Precipitation Passive (NH 3 & HNO 3 ) 7/5 9/20/2011 Passive (NH 3 & HNO 3 ) 7/5 9/20/2011 Daily URG Daily HiVol Precipitation Met Station Passive (NH 3 & HNO 3 ) 5/15 9/20/2011


9 Passive Ammonia Concentrations, µg/m Idaho/Wyoming Border FR Driggs 3.3 Driggs SB GT HL SL DC NC MJ TS Craters of the Moon RP 4.8 Bell, Allen, et al., Craters of the Moon Passive NH3 Study; June 17, 2010 to July 1, 2010 GrandTReNDS Passive NH3 Study, July 7 (27) - Sep 20, 2011
10 Deposition Pathways site comparison DR: July 27 - Sept. 21 Wet NO3 20% NH4 2% Wet NH4 27% NO3 0% Wet ON 11% HNO 3 4% NH3 36% GT: July 27 Driggs: - Sept. April Sept. NC: 21 July 27- Sept. 21 NH4 2% Wet NO3 17% Wet NH4 29% NO3 0% Wet ON NH % Wet 13% ON 16% Wet NO3- HNO % 3 8% HNO % NH % NH % NO NH4 0% 2% Wet NO3 18% Wet NH4 29% NO3 0% Wet NH % Wet ON 18% HNO 3 6% NH3 27%

11 Total Water Soluble Particulate Organic nitrogen WSON = TN (NO NO NH 4+ ) Total water soluble N Shimadzu TOC V CSH total organic carbon analyzer with a total nitrogen module NO 2-, NO 3-, NH 4 + ion chromatography Individual organic nitrogen compounds Liquid Chromatography with Time of Flight Mass Spectrometry using electrospray ionization PM2.5 Hivol samplers Benedict et al., 2011

12 Total Water Soluble Particulate Organic Nitrogen Grand Targhee

13 Total Water Soluble Particulate Organic Nitrogen Rocky Mountain NP Benedict et al., 2011


 is coordinating monitoring,")
14 IMPROVE NHx and Methylamine Monitoring Sites April 2011-Aug 2012 Using IMPROVE infrastructure: Site operators, RTI performing IC analysis CSU (Collett et al.,) is coordinating monitoring, QA/QC, data reduction, filter prep
15 Monthly Average NHx (1-in-3 day sampling), Apr Dec 2011 Doris Chen, et al.,
16 Monthly Average Methylamine (1-in-3 day sampling) Doris Chen, et al.,
17 Yellowstone, WY Daily (3 rd day) NH3 concentrations Rocky Mtn, CO Cedar Bluff, KS Bondville, IL Chiricahua, AZ

18 Chiricahua National Monument NH X * Chiricahua Annual 2006 NH3 emissions


19 Horseshoe 2 Fire Start: May 8th Containment: June 25th, 2011 June 8 th June 14 th
20 Total Particulate Nitrogen Judy Chow and John Watson Desert Research Institute (DRI), Reno NV DRI conducts all IMPROVE and CSN filter analysis to measure fine particulate carbonaceous aerosols Thermal Optical Reflectance (TOR) carbon analyzer measures OC and EC on quartz fiber filters Instrument can be modified to measure total particulate carbon, sulfur, hydrogen, oxygen and nitrogen


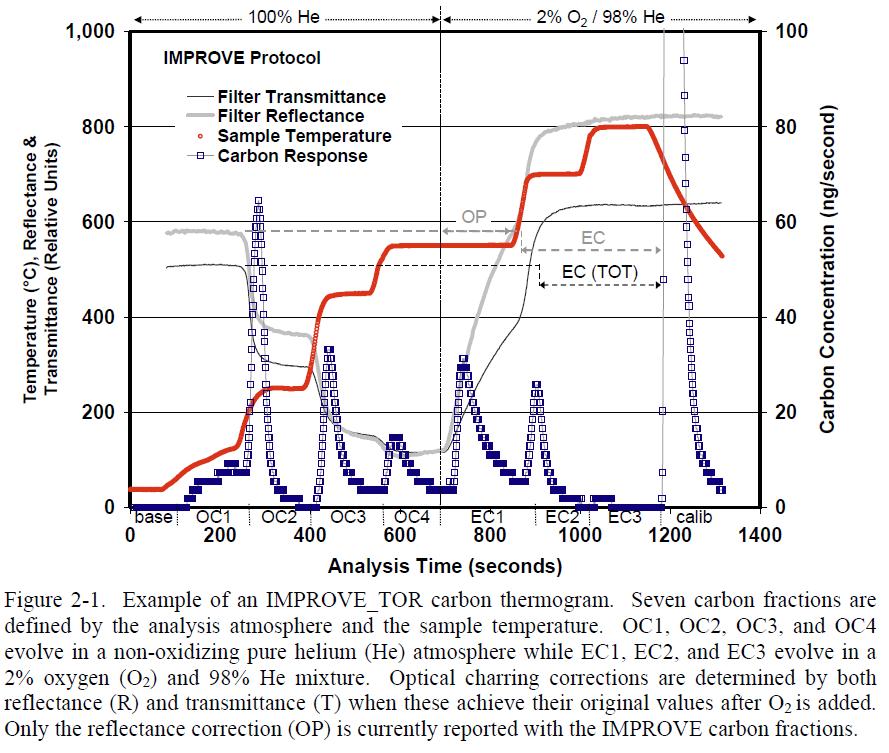
21 Grabowsky et al., 2011) Thermal Optical Reflectance (TOR) Particulate Carbon Analyzer
22 Potential configuration for next generation of thermal/optical analysis for elemental and optical properties Flow Control Network He, CH4 UV-VIS-NIR Light Source (λ= nm) Filter Thermocouple Oven Filter Loading Push Rod He, O2, NO, SO2 He Optical Fibers 98% He,2% O2 Optical Spectrometer (Reflectance) Flow Splitter Filter Holder Optical Spectrometer (Transmittance) O Reactor (C/Ni) O CO Unoxidized species H 2 O/Gas Trap Soda Lime Mg(ClO 4) 2 CHNS Reactor (MnO 2 ) C CO 2, H H 2 O, N NO x /N 2, S SO 2 Oxidation Oven (CuO) CO CO2 Oxidation Oven (CuO) CO CO2 Heated Fused Silica Capillary NDIR CO 2 Detector Mass Spectrometer Vent Four-Way Solenoid Valve Outputs: Reflectance/ Transmittance Spectra O Mass Spectra C, H, N, S Calibration Gases Carrier/Reaction Gases
23 C,H,N,S, and O can be determined using current processes Carbon Mass by Elemental Analyzer (µg) Ion Signal (a.u.) NDIR Signal (mv) 1.2e+6 1.0e+6 8.0e+5 1.2e+5 1.0e+5 8.0e+4 6.0e+4 4.0e+4 2.0e (b) (a) 140 C 100% He 98% He / 2% O C m/z=44 (CO + 2 ) 740 C 280 C Temperature 480 C 580 C Calibration CH 4 Injection m/z=28 (CO +, N 2 + ) m/z=18 (H 2 O + ) m/z=30 (NO + ) m/z=64 (SO 2 + ) Time (min) time vs Temp Time vs m/z18 NDIR Time vs m/z28 Time vs m/z30 Time vs m/z C 280 C 140 C Temperature 100% He 580 C Calibration O 2 Injection Time (min) Oven Temperature ( C) Oven Temperature ( C) Thermogram of Fresno ambient aerosol sample for (a) CHNS, and (b) O following the IMPROVE_A protocol. Comparison of carbon fractions measured by elemental analyzer and DRI thermal/optical carbon analyzer EC3 y = 0.926x R² = OC1 EC2 OC4 OC2 OC3 1:1 Line Carbon Mass by Carbon Analyzer (µg) EC1
24 Expected N (µg) Expected S (µg) Expected C (µg) C,H,N,S Calibration of MS-TOA using Sulfanilamide (C 6 H 8 N 2 O 2 S) C: y = 22.81x R² = Normalized m/z=44 (CO 2+ ) Signal Expected H (µg) H: y = 99.94x R² = Normalized m/z=18 (H 2 O + ) Signal N: y = 98.84x R² = S: y = 59.07x R² = Normalized m/z=30 (NO + ) Signal Normalized m/z=64 (SO 2+ ) Signal
25 Total Fine Particulate Organic Nitrogen IMPROVE measures particulate nitrate and could measure ammonium Particulate ON (PON) = Total N f(n_no3) f(n_nh4) Water insoluble PON = PON water soluble PON DRI has unsuccessfully submitted proposals for additional instrument development

26 Questions? Grand Targhee Resort, top of Sacagawea lift
27 Species of interest Measured Routinely : HNO 3, particle NO 3 and NH 4 Wet: NO 3-, NH 4 + *NH 3 Missing Species *NO x (NO and NO 2 ) *Can be (starting to be) measured in routine network ~Components can be measured in special studies ~Reduced organic gases (Aliphatic amines..) ~Oxidized organic gases (PAN - alkyl nitrates ) ~Reduced and oxidized organic nitrogen containing particulates Wet Species *Total organic nitrogen Oxidized and reduced organic compounds ~Occult deposition
 34% Missing")
28 Why the Missing Components Matter Deposition (Spring) ON (estimated) 10% NOx NH3 4% Total Deposition Budget (Spring) 9% 1% 3%? Wet Wet ON 20% Measured NO3 4% NH4 12% NH3 37% NH3 NOx ON Gas/particles NO3 NH4 HNO3 7% Wet NH4 Wet NO3 20% ON Gas/particles (estimated) 34% Missing 26% NOx 13% ROMANS data
Measuring Total Reactive N and its Composition
 Measuring Total Reactive N and its Composition Bret A. Schichtel 1, Katie Benedict 2, Christian M. Carrico 2, Anthony Prenni 2, Jr. 2, Ezra Levin 2, Derek Day 3, Doris Chen 2, John Ray 1, William C. Malm
Reactive Nitrogen Monitoring
 Reactive Nitrogen Monitoring Some definitions NOy NO + NO 2 + NO 3 + 2xN2 2 O 5 + HNO 3 + HONO + HO 2 NO 2 + RONO 2 (organic nitrates such as PAN and alkyl nitrates) + RONO (organic nitrites) + NO 3 -
Continuous measurement of airborne particles and gases
 Continuous measurement of airborne particles and gases Jeff Collett and Taehyoung Lee Atmospheric Science Department Colorado State University Funding: USDA/AES and NPS Outline Why measure particles and
Air quality impacts of oil and gas development in the Bakken formation region
 Air quality impacts of oil and gas development in the Bakken formation region J. L. Collett, Jr. 1, A. Evanoski Cole 1, A. Prenni 2, D. Day 2, A. Sullivan 1, Y. Li 1, B. Sive 2, Y. Zhou 1, A. Hecobian
Jeff Collett Department of Atmospheric Science Colorado State University
 Jeff Collett Department of Atmospheric Science Colorado State University People CSU Atmos Sci: Arsineh Hecobian, Tony Prenni, Yi Li, Andrea Clements, Ashley Evanoski, Jeff Pierce, Brad Wells, Kira Shonkwiler,
Review of the IMPROVE Equation for Estimating Ambient Light Extinction
 Review of the IMPROVE Equation for Estimating Ambient Light Extinction Jenny Hand 1 Bill Malm 2 1 CIRA, Colorado State University 2 National Park Service OUTLINE Introduction Sampling Biases Chemical forms
Spatial and Seasonal Patterns and Temporal Variability of Haze and its Constituents in the United States
 IIMP MPR RO V E Interagency Monitoring of Protected Visual Environments Spatial and Seasonal Patterns and Temporal Variability of Haze and its Constituents in the United States Acadia NP PM2.5 (µg/m3)
MULTI-WAVELENGTH OPTICAL CALIBRATION OF THERMAL/OPTICAL ANALYZER AND
 MULTI-WAVELENGTH OPTICAL CALIBRATION OF THERMAL/OPTICAL ANALYZER AND POTENTIAL APPLICATIONS John G. Watson, Judith C. Chow, L.-W. Antony Chen, Xiaoliang Wang, Ben Sumlin Division of Atmospheric Sciences,
Supplement of Multi-wavelength optical measurement to enhance thermal/optical analysis for carbonaceous aerosol
 Supplement of Atmos. Meas. Tech., 8, 45 46, 25 http://www.atmos-meas-tech.net/8/45/25/ doi:.594/amt-8-45-25-supplement Author(s) 25. CC Attribution 3. License. Supplement of Multi-wavelength optical measurement
The Importance of Ammonia in Modeling Atmospheric Transport and Deposition of Air Pollution. Organization of Talk:
 The Importance of Ammonia in Modeling Atmospheric Transport and Deposition of Air Pollution Organization of Talk: What is modeled Importance of NH 3 emissions to deposition Status of NH 3 emissions (model-based)
Uncertainties in PM2.5 Gravimetric and Speciation Measurements and What Can We Learn from Them
 Uncertainties in PM2.5 Gravimetric and Speciation Measurements and What Can We Learn from Them William Malm Cooperative Institute for Research in the Atmosphere, Colorado State University, Fort Collins,
ARTICLE IN PRESS. Journal of Aerosol Science
 Journal of Aerosol Science 41 (2010) 99 107 Contents lists available at ScienceDirect Journal of Aerosol Science journal homepage: www.elsevier.com/locate/jaerosci Use of proton backscattering to determine
Fine Particles: Why We Care
 Fine Particles: Why We Care Visibility/Radiative Forcing Health Effects A function of chemical composition PM2.5 Mostly 1) Sulfate 2) Carbonaceous - Organic - Elemental (Soot) 3) Metals, minerals, Metals,
6.5 Interrelationships of Fine Mass, Sulfur and Absorption Daily Scatter Plots Shenandoah National Park
 TABLE OF CONTENTS Chapter Page OVERVIEW AND SUMMARY S-1 S.1 Optical and Aerosol Data S-1 S.2 Spatial and Seasonal Distribution of Aerosol Concentration and S-4 Chemical Composition S.3 Light Extinction
Chemical mass closure of atmospheric aerosol collected over Athens, Greece.
 Chemical mass closure of atmospheric aerosol collected over Athens, Greece. Paraskevopoulou D. 1, 2, Liakakou E. 1, Theodosi C. 2, Zarmpas P. 2, Gerasopoulos E. 1 1, 2*, Mihalopoulos N. 1 Institute for
John G. Watson Judith C. Chow Mark C. Green Xiaoliang Wang Desert Research Institute, Reno, NV
 One Year Survey of Brown and Black Carbon Contributions in the U.S. John G. Watson (john.watson@dri.edu) Judith C. Chow Mark C. Green Xiaoliang Wang Desert Research Institute, Reno, NV Presented at: 17
Mobile Atmospheric Chemistry Laboratory
 Mobile Atmospheric Chemistry Laboratory Page 1 of 21 Page 2 of 21 Page 3 of 21 MACL Instrumentation 1. Saturn 4000 gas chromatograph + ion trap mass spectrometer (Varian) 2. Two channel VOC preconcentrator
Lab 4 Major Anions In Atmospheric Aerosol Particles
 Georgia Institute of Technology School of Earth and Atmospheric Sciences EAS 4641 Spring 2008 Lab 4 Major Anions In Atmospheric Aerosol Particles Purpose of Lab 4: This experiment will involve determining
Atmospheric and Depositional Nitrogen Monitoring J N Cape, Y S Tang, R I Smith, M A Sutton, E Nemitz, D Famulari, D Fowler
 Atmospheric and Depositional Nitrogen Monitoring J N Cape, Y S Tang, R I Smith, M A Sutton, E Nemitz, D Famulari, D Fowler Centre for Ecology & Hydrology, Edinburgh, UK Sources of reactive N What to monitor
Haze Communication using the CAMNET and IMPROVE Archives: Case Study at Acadia National Park
 Haze Communication using the CAMNET and IMPROVE Archives: Case Study at Acadia National Park Light absorption by fine Light scattering by fine Clear line of sight in absence of fine Light extinction is
Atmospheric chemistry Acidification
 Atmospheric chemistry Acidification Presented by Pontus Roldin Most material from Erik Swietlicki Avd. för Kärnfysik Fysiska institutionen Lunds universitet Acidification 1 Acidification Sulphur- and nitrogen-containing
Ambient Ammonium Contribution to total Nitrogen Deposition
 Ambient Ammonium Contribution to total Nitrogen Deposition 2016 NADP Annual Meeting Santa Fe, New Mexico November 3, 2016 Rich Scheffe, Jason Lynch, Donna Schwede, James Kelly, Halil Cakir, Adam Reff U.S.
Who is polluting the Columbia River Gorge?
 Who is polluting the Columbia River Gorge? Final report to the Yakima Nation Prepared by: Dan Jaffe, Ph.D Northwest Air Quality, Inc. 7746 Ravenna Avenue NE Seattle WA 98115 NW_airquality@hotmail.com December
Big Bend Regional Aerosol & Visibility Observational Study
 Big Bend Regional Aerosol & Visibility Observational Study BRAVO - Results Bret Schichtel National Park Service, Schichtel@cira.colostate.edu Presented at the BRAVO Public Meeting Alpine, Texas September
Ann M. Dillner, Travis Ruthenburg. UC Davis. IMPROVE Steering Committee Meeting, 2011
 FT-IR: a promising method for checking consistency between Teflon and quartz channels and measuring OM on IMPROVE samples Ann M. Dillner, Travis Ruthenburg UC Davis IMPROVE Steering Committee Meeting,
5. Light Extinction In The Desert Southwest
 5. Light Extinction In The Desert Southwest This chapter describes the spatial and temporal variations of light extinction and its components over the study area. 5.1 Principles of Light Extinction Perception
Supplementary Material for. Reactive Uptake of Ammonia by Secondary Organic Aerosols: Implications for Air Quality
 Supplementary Material for Reactive Uptake of Ammonia by Secondary Organic Aerosols: Implications for Air Quality Jeremy R. Horne, 1 Shupeng Zhu, 1 Julia Montoya-Aguilera, 2 Mallory L. Hinks, 2 Lisa M.
Supplement of Evaluation of the performance of a particle concentrator for online instrumentation
 Supplement of Atmos. Meas. Tech., 7, 11 135, 1 http://www.atmos-meas-tech.net/7/11/1/ doi:1.519/amt-7-11-1-supplement Author(s) 1. CC Attribution 3. License. Supplement of Evaluation of the performance
2.444 A FEASIBILTY STUDY OF THE MARGA TOOL AS AN AEROSOL ANALYZER
 2.444 A FEASIBILTY STUDY OF THE MARGA TOOL AS AN AEROSOL ANALYZER Rufus Ty White ac, Dr. Vernon Morris abc Department of Chemistry a, Program in Atmospheric Science b, NOAA Center for Atmospheric Science
Combustion Generated Pollutants
 Combustion Generated Pollutants New Delhi Peking Climate change Combustion Generated Pollutants Greenhouse gases: CO 2, methane, N 2 O, CFCs, particulates, etc. Hydrocarbons: Toxins and a major contributor
Summary of Recent Work on the Fragmentation Table & Oven Aerodyne
 Summary of Recent Work on the Fragmentation Table & Oven Temperature @ Aerodyne Tim Onasch - Aerodyne Boulder AMS Users Mini Meeting University of Colorado March 9-, 23 Fragmentation Waves AMS Users Meeting
MARGA Continuous monitoring of aerosols and gases in ambient air. Ed Lemon, Product Manager Metrohm Applikon, The Netherlands
 MARGA Continuous monitoring of aerosols and gases in ambient air Ed Lemon, Product Manager Metrohm Applikon, The Netherlands Introduction Measurement principles Data management Benchmarking Measurement
The Canadian ADAGIO Project for Mapping Total Atmospheric Deposition
 The Canadian ADAGIO Project for Mapping Total Atmospheric Deposition Amanda S. Cole Environment & Climate Change Canada (ECCC) MMF-GTAD Workshop Geneva, Switzerland February 28, 2017 ADAGIO team Amanda
Air Monitoring. Semi-continuous determination of ambient air quality
 Air Monitoring Semi-continuous determination of ambient air quality The Particle Into Liquid Sampler a simple solution for the determination of ions in aerosol particles 02 Combustion of fossil fuels for
ATOC 3500/CHEM 3152 Week 9, March 8, 2016
 ATOC 3500/CHEM 3152 Week 9, March 8, 2016 Hand back Midterm Exams (average = 84) Interaction of atmospheric constituents with light Haze and Visibility Aerosol formation processes (more detail) Haze and
Climatography of the United States No
 Climate Division: CA 6 NWS Call Sign: TOA Elevation: 11 Feet Lat: 33 2W Temperature ( F) Month (1) Min (2) Month(1) Extremes Lowest (2) Lowest Month(1) Degree s (1) Base Temp 65 Heating Cooling 1 Number
Updated Dust-Iron Dissolution Mechanism: Effects Of Organic Acids, Photolysis, and Dust Mineralogy
 Updated Dust-Iron Dissolution Mechanism: Effects Of Organic Acids, Photolysis, and Dust Mineralogy Nicholas Meskhidze & Matthew Johnson First International Workshop on the Long Range Transport and Impacts
Measurement of Ammonia Concentrations and Fluxes: Recent Examples Using Denuder and Chemiluminescence Technologies
 Measurement of Ammonia Concentrations and Fluxes: Recent Examples Using Denuder and Chemiluminescence Technologies John Walker U.S. Environmental Protection Agency National Risk Management Research Laboratory
A Review of the 2007 Water Year in Colorado
 A Review of the 2007 Water Year in Colorado Nolan Doesken Colorado Climate Center, CSU Mike Gillespie Snow Survey Division, USDA, NRCS Presented at the 28 th Annual AGU Hydrology Days, March 26, 2008,
Aerodyne Chinese AMS/ACSM Clinic, Nanjing, April Why are we here? Data Analysis Clinics Boulder, PSI. Barcelona, Boulder
 Aerodyne Chinese AMS/ACSM Clinic, Nanjing, 20-22 April 2018 2001 2002 2003 2004 2005 2006 2007 2008 2009 2010 2011 2012 2013 2014 2015 2016 2017 1st/2nd AMS Users Meeting Portland / Aerodyne 3rd Aerodyne
Studies on the dry deposition estimation and concentration monitoring in the Acid Deposition Monitoring Network in East Asia (EANET) countries
 countries") Studies on the dry deposition estimation and concentration monitoring in the Acid Deposition Monitoring Network in East Asia () countries Tomomi Endo This study aimed to understand the dry deposition amount
Studies on the dry deposition estimation and concentration monitoring in the Acid Deposition Monitoring Network in East Asia () countries Tomomi Endo This study aimed to understand the dry deposition amount
Source apportionment of fine particulate matter over the Eastern U.S. Part I. Source sensitivity simulations using CMAQ with the Brute Force method
 S1 SUPPORTING MATERIAL Source apportionment of fine particulate matter over the Eastern U.S. Part I. Source sensitivity simulations using CMAQ with the Brute Force method Michael Burr and Yang Zhang Department
Direct radiative forcing due to aerosols in Asia during March 2002
 Direct radiative forcing due to aerosols in Asia during March 2002 Soon-Ung Park, Jae-In Jeong* Center for Atmospheric and Environmental Modeling *School of Earth and Environmental Sciences, Seoul National
The National Atmospheric Deposition Program (NADP)
") The National Atmospheric Deposition Program (NADP) Christopher Lehmann Director, Central Analytical Laboratory National Atmospheric Deposition Program Illinois State Water Survey - Prairie Research Institute
The National Atmospheric Deposition Program (NADP) Christopher Lehmann Director, Central Analytical Laboratory National Atmospheric Deposition Program Illinois State Water Survey - Prairie Research Institute
DOCUMENT HISTORY. Initials Section/s Modified Brief Description of Modifications
 Page 2 of 13 DOCUMENT HISTORY Date Modified Initials Section/s Modified Brief Description of Modifications Page 3 of 13 Table of Contents 1. Purpose and Applicability... 4 2. Definitions... 4 3. Procedures...
Tracking the Climate Of Northern Colorado Nolan Doesken State Climatologist Colorado Climate Center Colorado State University
 Tracking the Climate Of Northern Colorado Nolan Doesken State Climatologist Colorado Climate Center Colorado State University Northern Colorado Business Innovations November 20, 2013 Loveland, Colorado
Comparing Modal and Sectional Approaches in Modeling Particulate Matter in Northern California
 Comparing Modal and Sectional Approaches in Modeling Particulate Matter in Northern California K. Max Zhang* [1], Jinyou Liang [2], Anthony S. Wexler [1], and Ajith Kaduwela [1,2] 1. University of California,
CHAPTER 8. AEROSOLS 8.1 SOURCES AND SINKS OF AEROSOLS
 1 CHAPTER 8 AEROSOLS Aerosols in the atmosphere have several important environmental effects They are a respiratory health hazard at the high concentrations found in urban environments They scatter and
Figure 1. A terrain map of Texas and Mexico as well as some major cites and points of interest to the BRAVO study.
 Big Bend Regional Aerosol and Visibility Observational (BRAVO) Study Results: Air Quality Data and Source Attribution Analyses Results from the National Park Service / Cooperative Institute for Research
Exploration of Nitrogen Total Deposition Budget Uncertainty at the Regional Scale
 Exploration of Nitrogen Total Deposition Budget Uncertainty at the Regional Scale Robin L. Dennis, Donna Schwede, Jesse Bash and Jon Pleim Atmospheric Modeling and Analysis Division NERL, EPA NADP Annual
Wet plus Dry Deposition of Atmospheric Hg in the SE U.S. NADP Technical Meeting Sept , 2007 Boulder, CO, USA
 Wet plus Dry Deposition of Atmospheric Hg in the SE U.S. NADP Technical Meeting Sept. 10-12, 2007 Boulder, CO, USA Outline Routine Measurements and Deposition Estimates Coarse Particle Hg Further Thoughts
Global Mercury Modeling at Environment Canada. Ashu Dastoor &Didier Davignon. Air Quality Research Division Environment Canada
 Global Mercury Modeling at Environment Canada Ashu Dastoor &Didier Davignon Air Quality Research Division Environment Canada Atmospheric Mercury Cycling in Environment Canada s Mercury Model - GRAHM Transport
Climatography of the United States No
 Climate Division: AK 5 NWS Call Sign: ANC Month (1) Min (2) Month(1) Extremes Lowest (2) Temperature ( F) Lowest Month(1) Degree s (1) Base Temp 65 Heating Cooling 90 Number of s (3) Jan 22.2 9.3 15.8
Impact of Weather House Design on REMP Air Sampler Results. Heather Baxter, Senior Scientist, Duke Energy
 Impact of Weather House Design on REMP Air Sampler Results Heather Baxter, Senior Scientist, Duke Energy Air Sampling Stations Originally, Harris Nuclear Plant had 6 air particulate/air iodine monitoring
Climatography of the United States No
 Climate Division: TN 1 NWS Call Sign: Month (1) Min (2) Month(1) Extremes Lowest (2) Temperature ( F) Lowest Month(1) Degree s (1) Base Temp 65 Heating Cooling 100 Number of s (3) Jan 47.6 24.9 36.3 81
Comparison of Particulate Monitoring Methods at Fort Air Partnership Monitoring Stations
 Comparison of Particulate Monitoring Methods at Fort Air Partnership Monitoring Stations Melanie Larsen Harry Benders RS Environmental (Tom Dann) March 13, 2014 Executive Summary Historically FAP has acquired
Trends in the Saharan Air Layer Composition Observed at Izaña - Tenerife
 Izaña: 1916-2016 Trends in the Saharan Air Layer Composition Observed at Izaña - Tenerife Izaña Sergio Rodríguez srodriguezg@aemet.es Izaña Atmospheric Research Centre, Tenerife 1 -North Africa: 50-70%
Investigating Mechanisms of Cool Season Upper Colorado River Basin Precipitation
 Investigating Mechanisms of Cool Season Upper Colorado River Basin Precipitation Benjamin Hatchett 1,2, Nina Oakley 1,2, John Abatzoglou 3, and Jon Rutz 4 1 Division of Atmospheric Sciences, Desert Research
Climatography of the United States No
 Climate Division: TN 3 NWS Call Sign: BNA Month (1) Min (2) Month(1) Extremes Lowest (2) Temperature ( F) Lowest Month(1) Degree s (1) Base Temp 65 Heating Cooling 100 Number of s (3) Jan 45.6 27.9 36.8
Colorado State University, Fort Collins, CO Weather Station Monthly Summary Report
 Colorado State University, Fort Collins, CO Weather Station Monthly Summary Report Month: December Year: 2016 Temperature: Mean T max was 39.7 F which is 3.1 below the 1981-2010 normal for the month. This
Fig. 3.2 on Page 101. Warming. Evidence for CO 2. History of Global Warming-2. Fig. 3.2 Page 101. Drilled cores from ocean floors
 Chemistry in Context: Chapter 3:The Chemistry of Global Warming Practice Problems: All Ch. 3 problems with the blue codes or answers on Page 521. Venus Atmospheric pressure is 90x that of Earth 96% CO
Climatography of the United States No
 Climate Division: CA 4 NWS Call Sign: Elevation: 2 Feet Lat: 37 Month (1) Min (2) Month(1) Extremes Lowest (2) Temperature ( F) Lowest Month(1) Degree s (1) Base Temp 65 Heating Cooling 1 Number of s (3)
Climatography of the United States No
 Climate Division: CA 5 NWS Call Sign: Elevation: 1,14 Feet Lat: 36 Month (1) Min (2) Month(1) Extremes Lowest (2) Temperature ( F) Lowest Month(1) Degree s (1) Base Temp 65 Heating Cooling 1 Number of
Climatography of the United States No
 Climate Division: CA 4 NWS Call Sign: Elevation: 13 Feet Lat: 36 Month (1) Min (2) Month(1) Extremes Lowest (2) Temperature ( F) Lowest Month(1) Degree s (1) Base Temp 65 Heating Cooling 1 Number of s
Climatography of the United States No
 Climate Division: CA 5 NWS Call Sign: Elevation: 6 Feet Lat: 37 Month (1) Min (2) Month(1) Extremes Lowest (2) Temperature ( F) Lowest Month(1) Degree s (1) Base Temp 65 Heating Cooling 1 Number of s (3)
IMPROVE Sampling & Analysis: Evaluation & Development
 IMPROVE Sampling & Analysis: Evaluation & Development Chuck McDade Crocker Nuclear Laboratory University of California, Davis Okefenokee, Georgia October 2008 AEROSOL GENERATION CHAMBER Selected Species
Lab 6 Major Anions In Atmospheric Aerosol Particles
 Georgia Institute of Technology School of Earth and Atmospheric Sciences EAS 4641 Spring 2007 Lab 6 Major Anions In Atmospheric Aerosol Particles Purpose of Lab 6: This experiment will involve determining
Climatography of the United States No
 Climate Division: CA 6 NWS Call Sign: LAX Elevation: 1 Feet Lat: 33 Month (1) Min (2) Month(1) Extremes Lowest (2) Temperature ( F) Lowest Month(1) Degree s (1) Base Temp 65 Heating Cooling 1 Number of
Locations of Monitoring Stations in the Mercury Trends Network
 Locations of Monitoring Stations in the Mercury Trends Network Three sets of geographic criteria were used to determine the locations for the regionally representative MTN monitoring stations: ecoregion,
Effect of Life on the Atmosphere: The Rise of Oxygen and Ozone
 Some preliminary chemistry Chapter 11 Effect of Life on the Atmosphere: The Rise of Oxygen and Ozone Chemical reactions involve the giving and taking of electrons between atoms. the nucleus is not affected
The Air Quality Model Evaluation International Initiative (AQMEII)
") The Air Quality Model Evaluation International Initiative (AQMEII) Christian Hogrefe 1, Stefano Galmarini 2, Efisio Solazzo 2, Ulas Im 3, Marta Garcia Vivanco 4,5, Augustin Colette 4, and AQMEII modeling
The Air Quality Model Evaluation International Initiative (AQMEII) Christian Hogrefe 1, Stefano Galmarini 2, Efisio Solazzo 2, Ulas Im 3, Marta Garcia Vivanco 4,5, Augustin Colette 4, and AQMEII modeling
The aerosol distribution in Europe derived with CMAQ: comparison to near surface in situ and sunphotometer t measurements
 Volker Matthias, GKSS Research Center, Geesthacht, Germany The aerosol distribution in Europe derived with CMAQ: comparison to near surface in situ and sunphotometer t measurements PAGE Page1 1 Outline
2012 Parts Catalog Phone (919) URG
 URG") 2012 Parts Catalog Phone (919)942-2753 www.urgcorp.com 5 URG Air Samplers Ambient Ion Monitor Time Resolved Direct Measurement of Nitrate, Sulfate and Ammonium State-of-the-Art Sampler with the Ability
2012 Parts Catalog Phone (919)942-2753 www.urgcorp.com 5 URG Air Samplers Ambient Ion Monitor Time Resolved Direct Measurement of Nitrate, Sulfate and Ammonium State-of-the-Art Sampler with the Ability
Operation and Maintenance of Networking of CAAQM stations at Bangalore and Chennai.
 2014-15 CENTRAL POLLUTION NTROL BOARD ZONAL OFFICE (SOUTH), BENGALURU 560079 Project II-.Scientific & Technical Activities and R & D Operation and Maintenance of Networking of CAAQM stations at Bangalore
Potential impacts of aerosol and dust pollution acting as cloud nucleating aerosol on water resources in the Colorado River Basin
 Potential impacts of aerosol and dust pollution acting as cloud nucleating aerosol on water resources in the Colorado River Basin Vandana Jha, W. R. Cotton, and G. G. Carrio Colorado State University,
Climatography of the United States No
 Month (1) Min (2) Month(1) Extremes Lowest (2) Temperature ( F) Lowest Month(1) Degree s (1) Base Temp 65 Heating Cooling 100 Number of s (3) 42.6 24.2 33.4 79 1950 25 44.2 1974-16 1994 19 18.8 1977 977
Chapter Eight: Conclusions and Future Work
 2004 PhD Thesis 202 Chapter Eight: Conclusions and Future Work 8.1 Conclusions The Aerodyne aerosol mass spectrometer is capable of providing quantitative information on the chemical composition of the
Global modeling of atmospheric deposition of N, P and Fe with TM4- ECPL
 Global modeling of atmospheric deposition of N, P and Fe with TM4- ECPL M. Kanakidou, S. Myriokefalitakis, N. Daskalakis, G. Fanourgakis Environmental Chemical Processes Laboratory Department of Chemistry,
TYPES OF CHEMICAL REACTIONS
 TYPES OF CHEMICAL REACTIONS http://www.youtube.com/watch?v=te4668aarck&feature=related The Five Major Class of Chemical Reaction http://www.youtube.com/watch?v=i HHvx1VC_8 Jan 2 8:07 PM 1 Nov 19 8:48 AM
Climatography of the United States No
 Month (1) Min (2) Month(1) Extremes Lowest (2) Temperature ( F) Lowest Month(1) Degree s (1) Base Temp 65 Heating Cooling 100 Number of s (3) Jan 54.3 40.1 47.2 75 1998 17 53.0 1995 18 1949 11 41.7 1972
The Chemistry of Global Warming
 The Chemistry of Global Warming Venus Atmospheric pressure is 90x that of Earth 96% CO 2 and sulfuric acid clouds Average temperature = 450 C Expected temperature based on solar radiation and distance
Ammonia Emissions and Nitrogen Deposition in the United States and China
 Ammonia Emissions and Nitrogen Deposition in the United States and China Presenter: Lin Zhang Department of Atmospheric and Oceanic Sciences, School of Physics, Peking University Acknowledge: Daniel J.
Climatography of the United States No
 Month (1) Min (2) Month(1) Extremes Lowest (2) Temperature ( F) Lowest Month(1) Degree s (1) Base Temp 65 Heating Cooling 100 Number of s (3) Jan 63.9 39.3 51.6 86 1976 16 56.6 1986 20 1976 2 47.5 1973
Climatography of the United States No
 Temperature ( F) Month (1) Min (2) Month(1) Extremes Lowest (2) Lowest Month(1) Degree s (1) Base Temp 65 Heating Cooling 100 Number of s (3) Jan 32.8 21.7 27.3 62 1918 1 35.8 1983-24 1950 29 10.5 1979
OUT OF THE DARKNESS AN ECLIPSE AND A POWER OUTAGE. Or..
 OUT OF THE DARKNESS AN ECLIPSE AND A POWER OUTAGE Or.. HOW ZAC BROWN AND A COSMIC EVENT SAVED TETON COUNTY COLORADO ASSOCIATION OF SKI TOWNS CONFERENCE TETON VILLAGE, WY JANUARY 17, 2019 No one can whistle
Chemistry of SO 2 in tropospheric volcanic plumes
 Chemistry of SO 2 in tropospheric volcanic plumes by Dr. Lizzette A. Rodríguez Iglesias Department of Geology University of Puerto Rico Mayagüez Campus Photo: L. Rodriguez http://volcano-pictures.info/glossary/volcanic_gas.html
Chemistry Assessment Unit AS 2
 Centre Number 71 Candidate Number ADVANCED SUBSIDIARY (AS) General Certificate of Education January 2011 Chemistry Assessment Unit AS 2 assessing Module 2: Organic, Physical and Inorganic Chemistry [AC121]
MODULE 4.3 Atmospheric analysis of particulates
 MODULE 4.3 Atmospheric analysis of particulates Measurement And Characterisation Of The Particulate Content 1 Total particulate concentration 1 Composition of the particulate 1 Determination of particle
Drought in Southeast Colorado
 Drought in Southeast Colorado Nolan Doesken and Roger Pielke, Sr. Colorado Climate Center Prepared by Tara Green and Odie Bliss http://climate.atmos.colostate.edu 1 Historical Perspective on Drought Tourism
The Atmospheric Chemistry and Physics of Ammonia
 The Atmospheric Chemistry and Physics of Ammonia Russell Dickerson Dept. Meteorology, The University of Maryland Presented at the National Atmospheric Deposition Program Ammonia Workshop October 23, 2003
Aqueous-Phase Chemistry in TM4-ECPL: SOA Formation via Cloud Processes Stelios Myriokefalitakis 1 Kostas Tsigaridis 2,3 Maria Kanakidou 1
 TM meeting, Heraklion, June 2010 Aqueous-Phase Chemistry in TM4-ECPL: SOA Formation via Cloud Processes Stelios Myriokefalitakis 1 Kostas Tsigaridis 2,3 Maria Kanakidou 1 1 Environmental Chemical Processes
Hydroclimatic Variability and Change: Issues in the Intermountain West
 Hydroclimatic Variability and Change: Issues in the Intermountain West Kelly Redmond Western Regional Climate Center Desert Research Institute Reno NV Collaborative and Interdisciplinary Climate Change
Climatography of the United States No
 No. 2 1971-2 Asheville, North Carolina 2881 COOP ID: 42713 Climate Division: CA 7 NWS Call Sign: Elevation: -3 Feet Lat: 32 Month (1) Min (2) Month(1) Extremes Lowest (2) Temperature ( F) Lowest Month(1)
Climatography of the United States No
 No. 2 1971-2 Asheville, North Carolina 2881 COOP ID: 46175 Climate Division: CA 6 NWS Call Sign: 3L3 Elevation: 1 Feet Lat: 33 Month (1) Min (2) Month(1) Extremes Lowest (2) Temperature ( F) Lowest Month(1)
Climatography of the United States No
 Climate Division: CA 7 NWS Call Sign: Month (1) Min (2) Month(1) Extremes Lowest (2) Temperature ( F) Lowest Month(1) Degree s (1) Base Temp 65 Heating Cooling 100 Number of s (3) Jan 54.4 36.9 45.7 77+
Climatography of the United States No
 Climate Division: CA 6 NWS Call Sign: Month (1) Min (2) Month(1) Extremes Lowest (2) Temperature ( F) Lowest Month(1) Degree s (1) Base Temp 65 Heating Cooling 100 Number of s (3) 68.5 45.7 57.1 90 1971
Climatography of the United States No
 Climate Division: CA 7 NWS Call Sign: Month (1) Min (2) Month(1) Extremes Lowest (2) Temperature ( F) Lowest Month(1) Degree s (1) Base Temp 65 Heating Cooling 100 Number of s (3) 56.0 35.7 45.9 83 1975
Climatography of the United States No
 Climate Division: CA 5 NWS Call Sign: Month (1) Min (2) Month(1) Extremes Lowest (2) Temperature ( F) Lowest Month(1) Degree s (1) Base Temp 65 Heating Cooling 100 Number of s (3) 59.3 31.5 45.4 80 1976
Climatography of the United States No
 Climate Division: CA 2 NWS Call Sign: Month (1) Min (2) Month(1) Extremes Lowest (2) Temperature ( F) Lowest Month(1) Degree s (1) Base Temp 65 Heating Cooling 100 Number of s (3) 53.7 32.7 43.2 79 1962
Climatography of the United States No
 Climate Division: CA 2 NWS Call Sign: Month (1) Min (2) Month(1) Extremes Lowest (2) Temperature ( F) Lowest Month(1) Degree s (1) Base Temp 65 Heating Cooling 100 Number of s (3) 53.3 31.8 42.6 74+ 1975