APPLICATION COMPENDIUM
|
|
|
- Nigel Crawford
- 5 years ago
- Views:
Transcription

1 APPLICATION COMPENDIUM [ ionkey/ms ]


2 Dear Colleague, The 214 introduction of the ionkey/ms System was a turning point for LC-MS. The promise of increased levels of sensitivity from smaller sample sizes was finally a reality. We were confident we had designed a system that, in the hands of our customers, would ultimately move microscale into the mainstream. We had reasons to be confident. The ionkey/ms System was the product of the largest beta collaboration in Waters history. We worked closely with customers in drug discovery and development, food and environmental testing, academia, contract, and core laboratories. I am thrilled to say that our confidence in 214 has been confirmed even beyond our expectations. Today, the ionkey/ms System has become a mainstream technology with customers across a wide array of applications. This application compendium shows just how far reaching this technology has become in the fields of bioanalysis, clinical research, food research, forensic toxicology, lipodomics, metabolomics, and proteomics. We ve received numerous industry awards, and we re not finished by any means. Waters is committed to continuously advance the technology in chemistries, instrument hardware, and software into the foreseeable future. If you haven t considered the benefits of the ionkey/ms System until now, we hope that you ll find this compendium informative and inspiring. Sincerely, Ian King Senior Vice President Instrument Technology


3 Introduction to ionkey/ms ionkey/ms ENHANCED MS WITH THE TURN OF A KEY THE LC-MS YOU KNOW, LIKE YOU VE NEVER SEEN BEFORE ionkey/ms Systems integrate the UPLC separation into the source of the mass spectrometer, delivering a level of ease of use and performance not achievable any other way. It is the UPLC separations you already know, robust, reproducible, and reliable, tried and tested by the world s most demanding laboratories, now easier to use and more sensitive. ionkey/ms Systems provide users with: Up to 4x increase in sensitivity A simplified user experience The ability to perform multiple analyses with limited sample volumes The power to analyze smaller sample sizes Reduced solvent consumption WITH ionkey/ms, WATERS TRANSFORMS WHAT YOUR LABORATORY CAN DO A wide range of laboratories are benefitting from the use of ionkey/ms, including: Drug discovery and development laboratories Contract laboratories Food research laboratories Academic and research laboratories Core/central laboratories 1


4 THE ikey SEPARATION DEVICE The ikey Separation Device is one of the enabling technologies behind the ionkey/ms System. The ikey eliminates the need for traditional fittings and thus greatly simplifies the microflow LC-MS user experience. Available with an internal diameter of 15 µm and in 5 mm and 1 mm lengths, the ikey brings microflow LC-MS into the mainstream of chromatographic laboratories. Providing reliable performance, resolution, and speed, the embedded separation channel fully leverages the separation power of sub-2-µm particles for complex sample analysis. ikey Separation Device ikey Separation Device with Post Column Addition Fittingless 15 µm I.D. separation device All liquid, gas, and electronic connections for LC-MS separations are made with the turn of a key Integrated heater and emitter Includes separation channel and PCA channel Solvents can be added post-separation The easy addition of modifier solvents may greatly enhance the sensitivity of the LC-MS analysis ionkey/ms MAKES ASSAYS WHICH WERE NOT POSSIBLE IN A ROUTINE LAB, POSSIBLE 2
5 PARTICLE TECHNOLOGY FOR THE ikey SEPARATION DEVICE Hybrid Particles Silica-based Particles 13Å 3Å 13Å 3Å 1.7 µm 1.7 µm 1.7 µm 1.8 µm C 18 C 18 C 4 C 18 T3 High retentivity for basic compounds Excellent peak shape at elevated ph Good universal column choice for a wide variety of compounds Stable across a wide ph range For separations at high temperatures (8 C) Good separation for basic compounds under low ph conditions Excellent MS performance with formic acid as a mobile phase modifier Fast ph switching and column equilibration High retentivity for polar organic compounds and metabolites Balanced retention of polar and hydrophobic analytes High strength silica particles for UPLC separations Selectivity Features: The BEH stationary phase is a universal media choice, suitable for a diverse range of analytes, especially for the separation of basic compounds under elevated ph conditions. The trifunctionally-bonded alkyl column is a method development tool that can impact the retention, selectivity, and sensitivity of ionizable compounds (with mobile-phase ph) while delivering low- and high-ph stability for all analyte types. Bonding: Trifunctional C 18 ligand, fully end-capped, bonded to Ethylene Bridge Hybrid (BEH) substrate. Selectivity Features: CSH Technology utilizes a controlled, low-level surface charge to provide enhanced selectivity and exceptional peak shape, particularly for basic compounds under low ph conditions in low-ionic strength mobile phases and exhibits little dependence on strong ion pairing agents. CSH accepts greater peptide mass loads than many other columns which enhances the ability to detect potentially important low level constituents contained with the major components of interest. Rapid equilibration after ph changes in the mobile phase decreases the time between sample injections, resulting in a higher sample throughput. Bonding: Trifunctional C 18 ligand, fully end-capped, bonded to Charged Surface Hybrid (CSH) substrate. Selectivity Features: The High Strength Silica [HSS] particle technology is designed for UPLC separations where silica-based selectivities are desired. The particle technology provides increased retentivity for polar analytes and metabolites. This may result in enhanced sensitivity due to improved desolvation as polar analytes elute in a higher percentage organic mobile phase. The low ligand density T3 (C 18 ) substrate enables analytes to more readily access the pore structure of the material, providing balanced retention of polar and hydrophobic molecules without the need for ion-pair reagents. Bonding: Trifunctional C 18 ligand, fully end-capped, bonded to High Strength Silica (HSS) substrate. The Peptide Separation Technology stationary phases used for ikeys are specifically QC tested with tryptic digests of cytochrome c to ensure consistent performance for peptide separations. The Protein Separation Technology stationary phases used for ikeys are specifically designed for the high resolution analysis of proteins of various sizes, hydrophobicities, and isoelectric points. Particles are QC tested using a protein standard mix. 3
6 Table of Contents BIOANALYSIS An Improved SPE-LC-MS/MS Method for the Quantification of Bradykinin in Human Plasma Using the ionkey/ms System... 8 Development of a High Sensitivity SPE-LC-MS/MS Assay for the Quantification of Glucagon in Human Plasma Using the ionkey/ms System Exploring Extra Sensitivity Using ionkey/ms with the Xevo G2-XS Q-Tof HRMS for Small Molecule Pharmaceutical Analysis in Human Plasma Improving a High Sensitivity Assay for the Quantification of Teriparatide in Human Plasma Using the ionkey/ms System Increasing Sensitivity and Minimizing Sample Volume for the Quantification of Therapeutic and Endogenous Cyclic Peptides in Plasma Using ionkey/ms Reducing Sample Volume and Increasing Sensitivity for the Quantification of Human Insulin and 5 Analogs in Human Plasma Using ionkey/ms Robustness of ionkey/ms System in the Analysis of Pharmaceutical Compounds in Biological Fluids Ultra High Sensitivity Bioanalyis by Improved Ionization and 2D-Microuhplc Applying Chip Technology... POSTER Ultrasensitive Quantification Assay for Oxytocin in Human Plasma Using the ionkey/ms System High Sensitivity Intact Mass Analysis of Antibodies (IgG1) Using ionkey/ms CLINICAL RESEARCH Development of a High-Sensitivity Micro LC-MS Method for Estradiol Quantification... POSTER Improving the Detection of Thyroglobulin in Human Plasma for Clinical Research by Combining SISCAPA Enrichment and Microflow LC-MS Multiplexed Analysis of Steroid Hormones Using ionkey/ms FOOD RESEARCH A Novel Strategy to Screen and Profile Steviol Glycosides of Natural Sweeteners in Food Using ionkey/ms Ion Mobility Mass Spectrometry Exploring the Benefits and Potential of ikey Microfluidic Chromatography and Time-of-Flight Mass Spectrometry for Pesticide Residue Analysis Illustration of the Selectivity of Collision Cross Section Ion Mobility Screening for the Analysis of Pesticide Residues in Food Using ionkey/ms ionkey/ms Ion Mobility: A New Approach to Authentication and Routine Screening of Ginsenoside Isomers in Functional Food Products Pesticide Screening of Food Samples Using the ionkey/ms System Using the Routine Separation Dimension and Identification Criteria of ionkey/ms Ion Mobility to Enhance Specificity in Screening Complex Samples
7 FORENSIC TOXICOLOGY Femtogram Detection of 11-Nor-9-Carboxy-Thc in Methanolic Solutions Using an Integrated Microfluidics MS System... POSTER High Sensitivity Analysis of Opioids in Oral Fluid Using ionkey/ms LIPIDOMICS, METABOLOMICS, AND PROTEOMICS High-Throughput LC-MS MRM Disease Protein Marker Verification Using the ionkey/ms System Singulus Pulpitum: Microfluidics Coupled With Mass Spectrometry for Multi-Omics and Targeted Assays in Translational Research... POSTER Targeted Lipidomics Using the ionkey/ms System GENERAL Chromatographic Reproducibility of the Novel ionkey/ms System ionkey/ms System: Moving Toward Greener, More Sustainable Chemistry Methods by Reducing Mobile Phase Consumption The ikey Separation Device as a More Efficient, Yet Simple-to-uise, Alternative to Conventional Capillary Columns WHITE PAPERS Enhancing Mass Spectrometry Sensitivity by Reducing Chromatographic Flow Rates with ionkey/ms Taking Advantage of Significant Reductions in Ion Suppression Using IonKey/MS Compared to Standard Flow LC-MS Post-Column Addition as a Tool to Enhance Performance in Microflow LC-MS High throughput analysis at microscale: performance of ionkey/ms with Xevo G2-XS QTof under rapid gradient conditions PEER REVIEWED PUBLICATIONS For a complete list of peer reviewed publications with ionkey/ms, please go to 5
8
9 BIOANALYSIS
10 An Improved SPE-LC-MS/MS Method for the Quantification of Bradykinin in Human Plasma Using the ionkey/ms System Mary E. Lame, Erin E. Chambers, and Kenneth J. Fountain Waters Corporation, Milford, MA, USA APPLICATION BENEFITS 2x reduction in sample and 1x increase in sensitivity facilitates multiple injections of samples for improved accuracy or to meet guidelines for ISR. 5x reduction in solvent consumption reduces cost of analysis. SPE using mixed-mode SPE reduces matrix interferences and enhances selectivity of the extraction for bradykinin in plasma. 96-well µelution plate format enables concentration of the sample while maintaining solubility and minimizes peptide losses due to adsorption to reach detection limits of 2.5 pg/ml for brakyinin in plasma. Selective, fast SPE extraction (<3 minutes) without time-consuming immunoaffinity purification. WATERS SOLUTIONS ionkey/ms System ACQUITY UPLC M-Class System ionkey Source Xevo TQ-S ikey Separation Device MassLynx 4.1 Software Oasis WCX 96-well µelution Plate Waters Collection Plate TargetLynx Application Manager KEY WORDS bioanalysis, Oasis, sample preparation, peptide quantification, bradykinin, UPLC, 2D Technology, plasma, ionkey/ms, ikey INTRODUCTION The need for robust and sensitive analysis of peptide species challenges both chromatographic separation and mass spectrometry. Peptides, in general, are often difficult to analyze by LC-MS/MS, as mass spectrometer (MS) sensitivity is low due to the formation of multiple precursors and poor or overly extensive fragmentation, making liquid chromatography (LC) and sample preparation even more critical. A previous application note (724833EN) described in detail the development of a fast, flexible analytical scale, SPE-LC-MS/MS method for the quantification of the peptide bradykinin (Figure 1) in human plasma for use as a biomarker in the preclinical or discovery setting. 1 Accurate quantification of bradykinin in plasma is particularly challenging because it is present in low pg/ml levels, is rapidly metabolized, and is also artificially produced during blood sampling and sample preparation via proteolytic processes. 2 Figure 1. Representative structure and amino acid sequence of bradykinin. In this work, the LC-MS platform was updated to incorporate the use of the ionkey/ms System which integrates the UPLC analytical separation directly into the source of the MS (Figure 2). The ikey Separation Device (15 µm I.D.), shown in Figure 3, contains the fluidic channel, electronics, ESI interface, heater, ecord, and the chemistry to perform UPLC separations. Additionally, this technology offers significant increases in sensitivity compared to 2.1 mm I.D. chromatography, making it ideal for peptide analyses. Most bioanalytical LC-MS/MS assays often consume high volumes of both solvent and sample, thus increasing the cost of the assay and limiting the number of replicates that can be analyzed. In addition to the sensitivity increase the ionkey/ms System provides over the 2.1 mm diameter scale, it also reduces solvent and sample consumption and provides enough sample to perform multiple injections that may be required to meet incurred sample reanalysis (ISR) guidelines. 8
11 E X P E R IM E N TA L Method conditions UPLC conditions LC system: ACQUITY UPLC M-Class with 2D Technology configured with optional trap and back flush elution Separation device: Key Peptide BEH C 18 Separation Device, 3Å, 1.7 µm, 15 µm x 5 mm (p/n ) Trap column: ACQUITY UPLC M-Class Symmetry C18, 5 µm, 3 µm x 5 mm (p/n ) Mobile phase A:.1 formic acid in water Mobile phase B:.1 formic acid in acetonitrile Loading solvent: 99:1 mobile phase A:B, 25 µl/min for first two minutes, reverse valve Valve position: Initial position one (forward loading of trap), switch to position two at two minutes (back flush elute of trap onto the analytical column) Analytical gradient: See Table 1 MS conditions MS system: Ionization mode: Capillary voltage: Xevo TQ-S Mass Spectrometer with ionkey Source and ikey Seperation Device ESI positive 3.8 kv Source temp.: 12 C Cone gas flow: 5 L/hr Collision cell pressure: 3.83 x 1 (-3) mbar Collision energy: Optimized by component, see Table 2 Cone voltage: Optimized by component, see Table 2 Data management Chromatography software: MassLynx 4.1 Quantification Time Flow software: rate Composition TargetLynx Composition Curve (min) (ml/min) A () B () Initial Table 1. UPLC gradient conditions. Elution flow rate: 2.5 µl/min ikey temp.: 75 C Sample temp.: 15 C Injection vol.: 1 µl Total run time: Collection plates: 12. minutes Waters 1 ml collection plates (p/n ) An Improved SPE-LC-MS/MS Method for the Quantification of Bradykinin in Human Plasma Using the ionkey/ms System 9
12 This study utilizes specifically designed blood collection techniques to inhibit bradykinin formation ex vivo, takes advantage of mixed mode solid-phase extraction (SPE) and use of the novel and highly efficient ionkey/ms System for selective, sensitive, and robust chromatographic separation, and quantification of the nonopeptide bradykinin. The sensitivity increase that ionkey/ms System provides over the 2.1 mm diameter scale method for bradykinin enables a 2x reduction in plasma and a 7 1x increase in signal-to-noise (S:N). As a result, we can accurately and precisely quantify 2.5 pg/ml of bradykinin above the basal level. Sample preparation Blood collection Human plasma was obtained from one male donor whose blood was collected in BD P1, P7, P8, and blood collection tubes containing only K2EDTA. The various BD P blood collection tubes contain various mixtures of proprietary stabilizers/inhibitors that immediately solubilize during blood collection, and enable preservation of human plasma proteins and peptides. Sample pretreatment 1 μl of the internal standard (IS), [Lys-des-Arg9]-bradykinin (5 ng/ml) was added to 1 μl of human plasma and mixed. The samples were then diluted 1:1 with 5 NH4OH in water and mixed. Sample extraction Pretreated plasma samples were extracted according to the protocol in Figure 4. All solutions are made up by volume. All extraction steps were applied to all wells of the Oasis WCX 96-well μelution Plate that contained samples. Oasis WCX µelution Protocol Part Number: Condition: 2 µl MeOH Equilibrate: 2 µl 5 NH 4 OH in H 2 O Figure 2. ionkey/ms System: comprised of the Xevo TQ-S, the ACQUITY UPLC M-Class, the ionkey Source, and the ikey Separation Device. Load: 2 µl Pretreated Plasma Wash 1: 2 µl 5 NH 4 OH in H 2 O Wash 2: 2 µl 1 ACN in H 2 O Elute: 2 x 25 µl of 1 TFA in 75:25 ACN:H O Dilute: 1 µl H 2 O 2 Figure 3. ikey Separation Device. Figure 4. Oasis μelution WCX extraction protocol. 1 An Improved SPE-LC-MS/MS Method for the Quantification of Bradykinin in Human Plasma Using the ionkey/ms System
13 RESULTS AND DISCUSSION Mass spectrometry The 3+ precursors of bradykinin (m/z ) and IS (344.94) were used for quantitation. The fragment at m/z y3 1+ was chosen as the primary fragment for bradykinin quantitative analysis, while the m/z b4 1+ fragment was used for confirmatory purposes. For the IS, the fragment at m/z b7 2+ was chosen. Optimal MS conditions are shown in Table 2. Although many peptides produce intense fragments below m/z 2, these ions (often immonium ions) result in high background in extracted samples due to their lack of specificity. In this assay, the use of highly specific b or y ion fragments with m/z values higher than their precursors yielded significantly improved specificity, facilitating the use of simpler LC and SPE methodologies. Compound Precursor MRM transition Bradykinin [Lys-des-arg9]- Bradykinin(IS) Cone voltage (V) Collision energy (ev) Production type [M+3H] > [1H + ] 1/g3 [M+3H] > [1H + ] 1/b4 [M+3H] > [2H + ] 1/b7 Table 2. MRM transitions, collision energies, and cone voltages for bradykinin and [Lys-des-Arg9] bradykinin, the internal standard (IS). Chromatographic separation Chromatographic separation of bradykinin and its IS was achieved using the novel microfluidic chromatographic ikey Separation Device. The ikey Separation Device has a channel with UPLC-grade, sub-2-µm particles that permits operation at high pressure and results in highly efficient LC separations. By integrating microscale LC components into a single platform design, problems associated with capillary connections, including manual variability, leaks, and excessive dead volume are avoided. Use of the ikey Peptide BEH C18 Separation Device, 3Å, 1.7 µm, 15 µm x 5 mm (p/n ) provided excellent peak shape, increased peak height, and improved S:N compared to the analytical scale (2.1 mm I.D.) LC-MS analysis. Representative chromatograms of bradykinin and the IS using the ikey Separation Device are shown in Figure 5. The use of multidimensional chromatography, specifically a trap and back-elute strategy, provided further sample cleanup and facilitated the loading of 1 μl of the high organic SPE eluate (required to maintain solubility of the peptides) without experiencing analyte break through. Additionally, the ability to inject the larger sample volumes typical for analytical scale LC analysis (e.g. 1 μl) on the ikey Separation Device can provide the substantial gains in sensitivity that are often required to accurately and reliably detect low pg/ml levels of peptide and protein in complex matrices. An Improved SPE-LC-MS/MS Method for the Quantification of Bradykinin in Human Plasma Using the ionkey/ms System 11
14 1 Bradykinin 6.19 MRM of 3 Channels ES > (Bradykinin 3+) 2.98e MRM of 3 Channels ES > (Lys DesArg9) 9.13e5 [Lys -des -Arg9] -Bradykinin (IS) Time Figure 5. UPLC separation of bradykinin and internal standard, from extracted plasma, using the ikey Peptide BEH C 18 Separation Device, 3Å, 1.7 µm, 15 µm x 5 mm (p/n ) Enhanced sensitivity with the use of ionkey/ms System Use of the ionkey/ms System facilitated the development of a highly efficient LC separation of bradykinin in plasma with significant improvement in sensitivity and S:N over the analytical scale LC-MS using 2.1 mm I.D. chromatography. Initially, samples were extracted using the protocol described in the previous application note (724833EN). Briefly, 2 μl of plasma was extracted followed by a 1:1 dilution of the eluate with water. A 3 μl injection of this sample on the ikey Separation Device provided a 5x improvement in S:N compared to a 1 μl injection of the same sample analyzed at the 2.1 mm scale, and is shown in Figure 6. The improvement in ionization efficiency and subsequent increase in sensitivity afforded by the ikey Separation Device facilitated this lower injection volume. The ability to obtain comparable or improved sensitivity with smaller injection volumes (1 3 μl) using the ionkey/ms System makes this technology ideal when sample is limited or when multiple injections are required to meet ISR guidelines. 1 ikey (15 µm I.D.) 5x > S:N with 1/3 the injection volume 3 µl injection S:N=3583 Time Analytical Scale (2.1 mm I.D.) 1 µl injection S:N= E6 1.4E6 Figure 6. Comparison of 1 ng/ml over-spiked bradykinin extracted from human plasma (2 μl): ikey Separation Device (15 μm I.D.) vs. traditional analytical flow (2.1 mm I.D.). 12 An Improved SPE-LC-MS/MS Method for the Quantification of Bradykinin in Human Plasma Using the ionkey/ms System
15 Method optimization resulted in the reduction of the required plasma sample by half and an increase in eluate dilution to 1:2, both of which minimized matrix interferences. A comparison of a 1 μl injection of extracted plasma (using the optimized method) the ionkey/ms System and a traditional analytical flow system (ACQUITY UPLC and Xevo TQ-S with UNIFI ) resulted in a 1x increase in signal and 7x increase in S:N with the ionkey/ms System. This improvement is illustrated in Figure 7, with a comparison of endogenous levels of bradykinin. Ultimately, the use of the 15 µm ikey Separation Device enabled the development of a low flow quantitative MRM method for bradykinin that achieved a detection limit of 2.5 pg/ml with only 1 μl of plasma. 1 ikey (15 µm I.D.) 1 µl injection S:N= E5 7x > S:N Time Analytical Scale (2.1 mm I.D.) 1 µl injection S:N=92 3.4E4 Figure 7. Comparison of endogenous levels of bradykinin extracted from human plasma (1 μl): ikey Separation Device (15 μm I.D.) vs. traditional analytical flow (2.1 mm I.D.). Sample preparation The development and optimization of the SPE method was described in detail in the previous application note (724833EN) and was employed for this study. Use of the Oasis WCX SPE, provided both reversed-phase and ion-exchange modes of retention, enabling greater sample cleanup, selectivity, and ultimate sensitivity for this peptide. Additionally, the Oasis WCX 96-well µelution Plate (p/n ) can be processed manually in under 3 minutes and is compatible with most liquid-handling robotic systems for automation to meet sample throughput requirements. This format also provides the ability to elute in very small sample volumes of only 5 μl, minimizing the potential for peptide losses that might occur during evaporation due to adsorption to the walls of collection plates and/or chemical instability. An Improved SPE-LC-MS/MS Method for the Quantification of Bradykinin in Human Plasma Using the ionkey/ms System 13
16 Linearity, accuracy, and precision To generate standard curves, human plasma (derived from blood collected in BD P1 tubes) was fortified with bradykinin at the following final concentrations: 2.5, 5, 1, 2, 4, 6, 1, 6, 1,, 2,, 4,, and 8, pg/ml. Each standard level was prepared in duplicate. Quality control (QC) samples were prepared from the same plasma at 15, 3, 5, 15, 3, 8, and 6, pg/ml. QC samples at each level were prepared in triplicate. [Lys-des-Arg9]-Bradykinin (final concentration of.5 ng/ml) was used as the internal standard (IS). Peak area ratios (PARs) of the analyte peak area to the IS peak were calculated. The calibration curve was constructed using PARs of the calibration samples by applying a one/concentration (1/x) weighted linear regression model. All QC sample concentrations were then calculated from their PARS against the calibration curve. Due to the presence of endogenous bradykinin, standard addition was used. The mean basal level of bradykinin (.19 ng/ml) in control plasma samples was determined by calculating the x-intercept. The calculated basal level was then added to the spiked concentration for all standard curve and QC samples to enable accurate quantification. Using 1/x regression, bradykinin was linear with an R 2 value of >.99. A summary of standard curve performance is shown in is shown in Table 3. Results from QC analysis are shown in Table 4. At all levels, QC samples demonstrated very good accuracy and precision, with mean accuracies ranging from and mean CV s of These results easily meet the recommended FDA acceptance criteria outlined in the white papers describing best practices in bioanalytical method validation for LC-MS/MS assays. 3,4 Bradykinin overspiked concentration (ng/ml) Final bradykinin concentration (ng/ml) Area IS area Response Calculated bradykinin concentration (pg/ml) Mean accuracy Table 3. Standard curve summary and statistics for bradykinin extracted from human plasma. 14 An Improved SPE-LC-MS/MS Method for the Quantification of Bradykinin in Human Plasma Using the ionkey/ms System
17 Bradykinin overspiked concentration (ng/ml) Bradykinin QC concentration (ng/ml) Mean concentration (ng/ml) SD CV Mean accuracy Table 4. QC statistics from bradykinin extracted from human plasma. Assessment of pre-analytical handling and endogenous bradykinin levels Accurate quantification of bradykinin in plasma is particularly challenging because it is metabolized rapidly, with a half life of less than 3 seconds, and can be artificially produced during blood sampling and sample preparation, via proteolytic processes. 2,5,6 To assess the best preservation of bradykinin in blood, as well as to prevent the formation of bradykinin ex vivo, particular attention was paid to the protocol for blood collection which employed the use of commercially-available blood collection tubes containing proprietary additives that provide enhanced recovery plasma analytes. More specifically, the BD P1, P7, and P8 collection tubes provide a means of preservation of plasma to be used in peptide and protein analysis. 7 The original work presented (724833EN) only assessed the preservation of bradykinin in P1 blood collection tubes. The BD P1 and P7 blood collection tubes contain proprietary mixtures of additives and inhibitors. The BD P1 collection tubes also contain a mechanical separator that allow for ease of collection and separation of the plasma after blood centrifugation. The P7 tubes contain the same inhibitors as the P1 tubes, with an additional inhibitor for stabilization of Glucagon-Like Peptide I (GLP-1) and contains no mechanical separator. P8 blood collection tubes, like the P1 and P7 blood cllection tubes, contain a proprietray cocktail of inhibitors that provide preservation of bioactive peptide in plasma, and contains no mechanical separator. The P8 blood collection tubes are marketed for assays that require quantitation and measurement of the GLP-1, Glucose-Dependent Insulinotropic Polypeptide (GIP), Glucagon, and Ghrelin. An Improved SPE-LC-MS/MS Method for the Quantification of Bradykinin in Human Plasma Using the ionkey/ms System 15
18 Mean extracted endogenous plasma bradykinin concentrations, in which the blood was collected with (P1, P7), and without protease inhibitors (K2EDTA only, days 1 and 4) are shown in Table 5. Average CV s of the endogenous bradykinin levels ranged from , indicating a very robust and reproducible method. Representative chromatograms for these results are shown in Figure 8 (panels A-D). Panel A is a representative chromatogram of endogenous plasma bradykinin obtained from blood collected in the P1 tubes, with a mean calculated concentration of.186 ng/ml. P7 blood collection yielded a mean endogenous bradykinin plasma level of.945 ng/ml, and is shown in Panel B. This concentration was approximately half of the concentration determined using the P1 tubes. The artifactual formation of bradykinin in plasma without inhibitor is demonstrated in panels C and D. In these cases, blood was collected in K2EDTA-only blood collection tubes, and the subsequent plasma was brought though 1 freeze/thaw (F/T) cycle. Panel C represents the bradykinin concentration on day 1, where the bradykinin plasma level increased to.817 ng/ml. Panel D represents the bradykinin concentration after 4 days of storage at 1 C, where bradykinin plasma levels increased to ng/ml. Endogenous levels of bradykinin using the P8 showed relative area counts similar to that of the P7 collection (data not shown), but due to a 1x signal loss of the IS in the P8 tube samples endogenous levels of bradykinin were not calculated for the P8 sample collection. It is assumed that the analogue IS was not protected from metabolism and/or degradation in the P8 tube due to differences in the cocktail of inhibitors. Further, the reduced endogenous bradykinin plasma levels using the P7 collection tube indicated that this cocktail of inhibitors may be more appropriate for stabilization and prevention of ex vivo bradykinin formation. However, another possibility that was not explored was that the presence of the plasma mechanical separator provided a mechanism of bradykinin formation prior or during blood collection and centrifugation. These results further emphasize the need for proper sample collection and storage to accurately quantify endogenous bradykinin plasma levels. 1 A Area 9364 Endogenous Bradykinin, BD -P1 with K 2 EDTA.186 ng/ml Plasma treatment Mean concentration (ng/ml) SD CV 1 B Endogenous Bradykinin, BD -P7 with K 2 EDTA.945 ng/ml BD-P BD-P BD-No inhibitor with K2EDTA, 1F/T C D Endogenous Bradykinin, No Inhibitor with K 2 EDTA, 1 F/T.817 ng/ml Endogenous Bradykinin, No Inhibitor with K 2 EDTA, 1F/T and 4 Day 1 C ng/ml BD-No inhibitor, K 2 EDTA, 1 F/T, 4 days at 1 C Table 5. Mean extracted endogenous plasma bradykinin, in which the blood was collected with (P1, P7), and without protease inhibitors (K2 EDTA only, days 1 and 4) Time Figure 8. Representative chromatograms of extracted endogenous plasma bradykinin, in which the blood was collected with (P1, P7), and without protease inhibitors (K2EDTA only). 16 An Improved SPE-LC-MS/MS Method for the Quantification of Bradykinin in Human Plasma Using the ionkey/ms System
19 CONCLUSIONS Use of the ionkey/ms System, mixed-mode SPE and higher m/z b or y ion MS fragments provided the level of selectivity and sensitivity necessary to accurately quantify bradykinin and distinguish subtle differences in concentrations. The current analysis uses 1 μl of plasma and provides a significant improvement in sensitivity and S:N over the analytical scale LC-MS analysis which uses twice as much sample. The use of the 15 µm ikey Separation Device enabled the development of a highly sensitive, low flow quantitative MRM method for bradykinin that could distinguish a change of 2.5 pg/ml of bradykinin over the basal level. Standard curves were accurate and precise from 2.5 8, pg/ml. QC samples at all levels easily met recommended FDA regulatory criteria 4,5 with mean accuracies ranging from and mean CV s of , indicating an accurate, precise, and reproducible method. Furthermore, an injection of the same volume (1 μl) of sample corresponded to a >1x increase in on-column sensitivity as compared to the traditional analytical flow method for this peptide. In addition to the sensitivity increase the ionkey/ms System provides over the 2.1 mm I.D. scale, it also reduces solvent and sample consumption, thereby reducing cost and allowing for multiple injections of samples for improved accuracy or to meet the guidelines for ISR. This study also demonstrates the importance of proper sample collection with appropriate additives for the stabilization/preservation of bradykinin in plasma to accurately represent endogenous levels. This method shows great promise for high sensitivity quantification of bradykinin in patient samples from PK and clinical studies using the ionkey/ms System if further validation was performed. References 1. Lame ME, Chambers EE, Fountain KJ, Development of a Quantitative SPE LC-MS/MS Assay for Bradykinin in Human Plasma, Waters Application Note EN Murphey LJ, Hachey DL, Oates JA, Morrow JD, and Brown NJ, Metabolism of Bradykinin In Vivo in Humans: Identification of BK1-5 as a Stable Plasma Peptide Metabolite J Pharmacol Exp Ther July 1, 2 294: Viswanathan CT, Bansal S, Booth B, DeStefano AJ, Rose MJ, Sailstad J, Shah VP, Skelly JP, Swann PG, Weiner R, Quantitative bioanalytical methods validation and implementation: best practices for chromatographic and ligand binding assays, Pharm. Res., 24 (27) Bansal S, DeStefano A, Key elements of bioanalytical method validation for small molecules, AAPS J., 9 (27) E Cugno M, Agostoni P, Brunner HR, Gardinali M, Agostoni A, Nussberger. Plasma bradykinin levels in human chronic congestive heart failure J. Clin Sci (Lond). 2 Nov; 99(5): Nussberger J, Cugno M, Amstutz C, Cicardi M, Pellacani A, Agostoni A. Plasma bradykinin in angio-oedema. Lancet Jun 6; 351(9117): Molecular Diagnostics and Proteomics Blood Collection Systems, BD Diagnostics Corporation. proteomics/pdfs/molecular_proteomics_catalog.pdf Acknowledgements We would like to thank: Jeffrey Widdos and Biological Specialty Corporation for providing excellent service and assistance in the special collection of human plasma used in this work. David Craft and BD Diagnostics Corporation for providing blood collection tubes for assessment of bradykinin plasma levels, and for the technical discussion regarding the various BD blood collection tubes. Waters, The Science of What s Possible, UPLC, Oasis, ACQUITY UPLC, Xevo, Symmetry, MassLynx, and UNIFI are registered trademarks of Waters Corporation. ionkey, μelution, ionkey/ms, ikey, and TargetLynx are trademarks of Waters Corporation. All other trademarks are the property of their respective owners Waters Corporation. Produced in the U.S.A. February EN AG-PDF Waters Corporation 34 Maple Street Milford, MA 1757 U.S.A. T: F: An Improved SPE-LC-MS/MS Method for the Quantification of Bradykinin in Human Plasma Using the ionkey/ms System 17
20 Development of a High Sensitivity SPE-LC-MS/MS Assay for the Quantification of Glucagon in Human Plasma Using the ionkey/ms System Mary E. Lame, Erin E. Chambers, Sukhdev S. Bangar, and Kenneth J. Fountain Waters Corporation, Milford, MA, USA APPLICATION BENEFITS High sensitivity assay with LOD of 12.5 pg/ml in human plasma. Reduced solvent consumption (5X) compared to 2.1 mm scale means significant cost savings. Use of mixed-mode solid-phase extraction (SPE) reduces matrix interferences and enhances selectivity of the extraction. 96-well μelution plate format enables concentration of the sample while maintaining solubility and minimizes peptide loss due to adsorption. Selective, fast SPE extraction (<3 minutes) without time-consuming immunoaffinity purification. The ionkey/ms System yielded 4X greater S:N and a 1X improvement in sensitivity over 2.1 mm scale allowing for greater confidence in results, more tests per sample, and more injections. WATERS SOLUTIONS ionkey/ms System ACQUITY UPLC M-Class System ionkey Source Xevo TQ-S Mass Spectrometer ikey Separation Device Oasis MAX 96-well µelution Plate MassLynx 4.1 Software Waters Collection Plate INTRODUCTION Glucagon for Injection (rdna origin) is a polypeptide hormone identical to human glucagon and is used to treat severe hypoglycemia (low blood sugar). 1 It is a single chain polypeptide that contains 29 amino acids residues with a molecular weight of 3483 (Figure 1). As a research tool, accurate quantification of glucagon from biological matrices can help us to better understand diabetes as a function of disease progression and/or drug treatment. Many assays, using different methodologies exist for glucagon analysis in biological samples. 2-7 Glucagon, like other biologics, has historically been quantified using ligand binding assays (LBAs). 2-5 With advances in MS and chromatography technologies over the past few years there has been a trend toward the analysis of large molecules by LC-MS/MS. This is, in part, driven by the fact that LBAs can suffer from significant cross-reactivity issues and lack of standardization. Additionally, LC-MS/MS also has the advantage of shorter development times, greater accuracy and precision, the ability to multiplex, and can readily distinguish between closely related analogues, metabolites or endogenous interferences. Large peptides, such as glucagon, are particularly difficult to analyze by LC-MS/MS as MS sensitivity is low due to poor transfer into the gas phase and poor fragmentation. In addition, glucagon suffers from significant non-specific binding, poor solubility, and must be properly stabilized in biological matrices during collection and sample preparation, 6-8 making LC and sample preparation method development challenging. KEY WORDS Oasis, sample preparation, bioanalysis, peptide quantification, Glucagon, UPLC, plasma, ionkey/ms, ikey Figure 1. Representative amino acid sequence of glucagon. 18
21 E X P E R IM E N TA L Sample prepration Step 1: Pretreatment Commercially available plasma was treated with a protease inhibitor cocktail (1:1). Plasma was then spiked with various concentrations of glucagon and mixed. These samples (2 µl) were acidified with acetic acid (.5 final concentration) and vortexed, followed by dilution with 2 µl 5 ammonium hydroxide in water. Step 2: SPE using a Oasis MAX µelution 96-well Plate (p/n ) CONDITION: 2 µl methanol EQUILIBRATE: 2 µl water LOAD SAMPLE: Entire diluted plasma sample (4 µl) was loaded onto the extraction plate WASH 1: 2 µl 5 ammonium hydroxide in water WASH 2: 2 µl 1 acetonitrile in water ELUTE: 2 X 25 µl 65:25:1 acetonitrile:water: acetic acid DILUTE: 5 µl water Valve position: Initial position one (forward loading of trap), switch to position two at two minutes (back flush elute of trap onto the analytical column) Analytical gradient: see Table 1 Elution flow rate: 2. µl/min Column temp.: 75 C Sample temp.: 15 C Injection volume: 5 µl Total run time: 14.5 min Gradient: Time Profile (min) A B Curve Table 1. LC gradient conditions. INJECT: 5 µl Collection plates: Waters 1 ml Collection Plates Method conditions UPLC conditions LC System: ACQUITY UPLC M-Class, configured for trap and back-flush elution Separation device: ikey Peptide BEH C18, 13Å, 1.7 µm, 15 µm x 1 mm (p/n ) Trap column: ACQUITY UPLC M-Class Symmetry C18 Trap Column, 1Å, 5 µm, 3 µm x 5 mm (p/n ) Mobile phase A:.1 formic acid in water Mobile phase B:.1 formic acid in acetonitrile Loading solvent: 85:15 mobile phase A:B, 25 µl/min for first two minutes, reverse valve MS conditions MS system: Ionization mode: Capillary voltage: Xevo TQ-S ESI positive 3.8 kv Source temp.: 12 C Cone gas flow: 1 L/hr Collision cell pressure: 5.5 x 1 (-3) mbar Collision energy: Optimized by component, see Table 2 Cone voltage: Optimized by component, see Table 2 Data management Chromatography software: MassLynx 4.1 Quantification software: TargetLynx Development of a High Sensitivity SPE-LC-MS/MS Assay for the Quantification of Glucagon in Human Plasma Using the ionkey/ms System 19

22 The pharmacokinetic profile of administered exogenous glucagon is characterized by a rapid absorption and elimination with a half-life of <2 minutes, resulting in a total duration of exposure to the peptide of ~2 hours. At the practical clinical dose, ng/ml, maximum glucagon levels of ~8 ng/ml are reached in 2 minutes. Endogenous glucagon in plasma is present in low pg/ml levels (<1 pg/ml), which makes detection by LC-MS/MS even more difficult. The work described herein uses a combination of selective μelution mixed-mode SPE sample preparation, optimal MS precursor and fragment choice, and the ionkey/ms System (Figure 2) for the highly selective and sensitive quantification of glucagon in human plasma. Detection limits of 12.5 pg/ml using only 2 μl of plasma were achieved with a linear dynamic range from 12.5 to 1, pg/ml. This work also capitalizes on the attributes of the ionkey/ms System enabling a 5X reduction in injection volume, a 1X increase in sensitivity, and 4X increase in signal-to-noise (S:N) compared to 2.1 mm I.D. analytical scale method. Figure 2. ionkey Source. 2 Development of a High Sensitivity SPE-LC-MS/MS Assay for the Quantification of Glucagon in Human Plasma Using the ionkey/ms System
23 RESULTS AND DISCUSSION Mass spectrometry The 4+(m/z 871.5) and 5+(m/z 697.1) multiply charged precursors were observed for glucagon; MSMS spectra for these precursors, obtained at their optimal collision energies, are shown in Figure 3. The fragments at m/z and 94.2 of the 5+ precursor, and 14.2 of the 4+ precursor were chosen for quantification (Table 2). Although many peptides produce intense fragments below m/z 2, these ions (often immonium ions) result in high background in extracted samples due to their lack of specificity. In this assay, the use of highly specific b/y fragments yielded significantly improved specificity, facilitating the use of simpler LC and SPE methodologies * 14.4 Daughters of 871ES+ 1.88e6 A [M+4H] m/z B * [M+5H]5+ Daughters of 697ES+ 3.22e * m/z Figure 3. MSMS spectra of the 4+ (A) and 5+ (B) precursors of glucagon. Fragments chosen for quantitation are indicated by asterisks (*). Precursor MRM transition Cone voltage (V) Table 2. MS Conditions for glucagon. Collision energy (ev) Product ion type [M+5H] > Ammonia loss(5+) [M+5H] > b24(3+) [M+4H] > b26(3+) Development of a High Sensitivity SPE-LC-MS/MS Assay for the Quantification of Glucagon in Human Plasma Using the ionkey/ms System 21
24 Liquid chromatography Chromatographic separation of glucagon was achieved using the novel microfluidic chromatographic ikey Separation Device. The ikey Separation Device (Figure 4) is packed with UPLC -grade sub-2-µm particles that permits operation at high pressure and results in highly efficient LC separations. By integrating microscale LC components into a single platform design, problems associated with capillary connections, including manual variability, leaks, and excessive dead volume, are avoided. Use of the ikey Separation Device provided excellent peak shape, narrow peak widths (<4. secs at base), and resolution from endogenous matrix interferences. Glucagon was eluted using a linear gradient from B over 6 minutes. Representative chromatograms are shown in Figure 5. The use of multidimensional chromatography, specifically a trap and back-flush elution strategy, provided further sample cleanup and facilitated the loading of 5 μl of the high organic SPE eluate (required to maintain solubility of the peptides) without experiencing analyte breakthrough. Additionally, the ability to inject sample volumes typical for analytical scale LC analysis on the ikey Separation Device can provide the substantial gains in sensitivity that are often required to accurately and reliably detect low pg/ml levels of peptides and proteins in complex matrices. Figure 4. ikey Separations Device. 1 MRM of 4 Channels ES > 94.2 (Glucagon) 3.56e6 [M+5H]5+/b24(3+) MRM of 4 Channels ES > 14.2 (Glucagon) 3.56e [M+4H]4+/b26(3+) MRM of 4 Channels ES > (Glucagon) 3.56e6 [M+5H]5+/Ammonia Loss Time Figure 5. UPLC separation of glucagon from extracted plasma, using the ikey Peptide BEH C 18, 13Å 1.7 µm, 15 µm x 1 mm (p/n ). 22 Development of a High Sensitivity SPE-LC-MS/MS Assay for the Quantification of Glucagon in Human Plasma Using the ionkey/ms System
25 Enhanced sensitivity with the use of the ionkey/ms System Versus analytical scale (2.1 mm I.D.), the ionkey/ms System generally offers increased sensitivity, making it ideal for glucagon analysis. This also facilitates the use of smaller sample volumes whilst maintaining or improving sensitivity. For a 25 pg/ml plasma extracted sample, the same injection volume (5 μl) on the ionkey/ms System yielded 4X greater S:N and a 1X improvement in sensitivity versus 2.1 mm scale (Figure 6). Using the 15 µm ikey Separation Device, low pg/ml levels of glucagon were detected in extracted plasma. Figure 7 demonstrates the improvements the ionkey/ms System provides for a 25 pg/ml extracted plasma sample. Versus 2.1 mm scale (25 μl injection), a 5 μl injection on the ionkey/ms System yields 5X greater sensitivity and a 3X improvement in S:N. Ultimately, the use of the ionkey/ms System enabled the development of a low flow quantitative MRM method for glucagon that achieved detection limits of 12.5 pg/ml from only 2 μl of plasma. Sample preparation Development of this assay was challenging due to a high degree of non-specific binding (NSB) and difficulty maintaining peptide solubility throughout the SPE extraction and elution process. SPE was performed using Oasis MAX, a mixed-mode sorbent, to enhance selectivity. To ensure glucagon stability during sample preparation and extraction, human plasma was treated with protease inhibitor cocktail. Glucagon was then spiked at various concentrations into the plasma and mixed. These samples were then acidified with acetic acid (.5 final concentration). Acidification helped disrupt protein binding. Plasma samples were then pre-treated with 5 NH4OH in water to adjust ph prior to SPE. The diluted plasma (ph >1) samples were then applied to conditioned SPE plates. Glucagon was well retained on the SPE sorbent during the load step, with no breakthrough occurring. At this basic ph, glucagon will carry a net negative charge, putting it in the proper charge state to bind to Oasis MAX (quaternary amine) by ion exchange. Optimization of the elution solution was critical to maximize recovery, maintain its solubility, and minimize interferences from the plasma matrix. The optimum elution solution was 65 organic, 25 water, with 1 acetic acid. The enhanced selectivity of the Oasis MAX SPE extraction was imperative to accurately detect and quantify low pg/ml levels of glucagon in plasma. This is especially important where the use of the less specific 5+ precursor and ammonia loss fragment MRM transition might be necessary to achieve low limits of detection. During method development, use of reversed-phase (RP) only SPE was assessed. RP SPE yielded 1 15 greater recovery than the strong anion-exchange mixed-mode SPE (MAX). However, endogenous background was higher and yielded greater matrix effects (data not shown). In particular, matrix effects were >3 for the ammonia loss MRM transition when RP only extraction was employed. This greatly limited its use for robust quantification. Alternatively, the enhanced selectivity of the Oasis MAX SPE device greatly reduced matrix effects (<15) and facilitated use of the less specific ammonia loss fragment for accurate quantification. In addition, the 96-well Oasis µelution Plate can be processed manually in under 3 minutes and is compatible with most liquid-handling robotic systems for automation to meet sample throughput requirements. This format also provides the ability to elute in very small sample volumes, minimizes the potential for adsorptive peptide losses and chemical instability, as well as concentrates the sample for increased sensitivity. Development of a High Sensitivity SPE-LC-MS/MS Assay for the Quantification of Glucagon in Human Plasma Using the ionkey/ms System 23
26 1 S/N:PtP=51.4 MRM of 4 Channels ES > 94.2 (Glucagon) 1.26e5 ionkey/ms method (15 µm ID) 4X > S:N and 1X > intensity 5 L injection 51:1 S:N MRM of 4 Channels ES > (Glucagon ) 1.26e5 Original method (2.1 mm ID) 5 L injection 13:1 S:N S/N:PtP= Time Figure 6. Comparison of 25 pg/ml glucagon extracted from human plasma (2 µl): ikey Separation Device (15 µm I.D.) vs. traditional analytical flow (2.1 mm I.D.). 1 MRM of 4 Channels ES > 94.2 (Glucagon) 2.81e4 3X > S:N and 5X > intensity 5 L injection 15:1 S:N S/N:PtP=14.96 ionkey/ms method (15 µm ID) MRM of 4 Channels ES > (Glucagon ) 2.81e4 25 L injection 5:1 S:N Original method (2.1 mm ID) S/N:PtP= Time Figure 7. Comparison of 25 pg/ml glucagon extracted from human plasma: ikey Separation Device (5 µl injection) vs. traditional analytical flow (25 µl injection). 24 Development of a High Sensitivity SPE-LC-MS/MS Assay for the Quantification of Glucagon in Human Plasma Using the ionkey/ms System
27 Specificity vs. sensitivity Triple quadrupole mass spectrometers, when operated in MRM mode, offer a unique combination of sensitivity, specificity, and dynamic range. However, in biological matrices, the task of achieving analyte specificity can be difficult, particularly with large peptides due to the high abundance of other endogenous proteins and peptides. Thus, the challenge of improving specificity lies not only in the sample preparation, and chromatography, but also selective choice of MRM transition for analysis. In the case of glucagon, the 697.1/693.5 MRM transition, corresponding to the 5+ precursor and ammonia loss fragment, resulted in a 1X greater signal than any of the other selective precursor/fragment transitions when tested in neat standard solution (data not shown) and in extracted plasma. However, in extracted plasma samples it was not as specific and resulted in higher background noise. Figure 8 shows a 5 pg/ml extracted plasma sample, and demonstrates the increased sensitivity and lack of specificity of the ammonia loss transition compared to the selective b-ion transitions. Std. conc (pg/ml) Area Calc. conc. (pg/ml) Dev Accuracy Blank Blank Table 3. Glucagon standard curve summary statistics from ,. pg/ml extracted from human plasma Specific b24 ion S:N 23 MRM of 4 Channels ES > 94.2 (Glucagon) 1.61e S/N:RMS= Specific b26 ion S:N 243 MRM of 4 Channels ES > 14.2 (Glucagon) 1.61e6 S/N:RMS= Non-specific ammonia loss S/N:RMS= S:N 244 MRM of 4 Channels ES > (Glucagon) 1.61e Time Figure 8. Comparison of glucagon MRM transition sensitivity and specificity in a 5 pg/ml extracted human plasma sample. Development of a High Sensitivity SPE-LC-MS/MS Assay for the Quantification of Glucagon in Human Plasma Using the ionkey/ms System 25
28 Although the intensity using the 697.1/ MRM transition is 1X greater than the b-specific ion transitions (697.1>94.2 and >14.2), its sensitivity is mitigated by the accompanying higher background signal, as is demonstrated by the equivalent S:N ratios of all 3 MRM transitions. Additionally, measured matrix effects for the b-specific ion transitions were less than 1 in plasma, while the ammonia loss transition resulted in matrix effects between A summary of standard curve performance is shown in Table 3, and is illustrated in Figure 9. Using a 1/X regression, glucagon was linear from ,. pg/ml with R 2 values of >.99 for all 3 MRM transitions monitored. Representative chromatograms for extracted glucagon plasma standard samples are shown in Figure 1. Response Compound name: Glucagon 14 Correlation coefficient: r = , r 2 =.9974 Calibration curve: * x Response type: External Std, Area Curve type: Linear, Origin: Exclude, Weighting: 1/x, Axis trans: None pg/ml Figure 9. Representative standard curve in human plasma, from ,. pg/ml Area MRM of 4 Channels ES > 14.2 (Glucagon) 9.86e5 Area MRM of 4 Channels ES > 14.2 (Glucagon) 5 pg/ml 6.7e5 Area pg/ml MRM of 4 Channels ES > 14.2 (Glucagon) 2.78e5 Area MRM of 4 Channels ES pg/ml > 14.2 (Glucagon) 8.45e4 Area MRM of 4 Channels ES pg/ml > 14.2 (Glucagon) 4.62e4 Area MRM of 4 Channels ES pg/ml > 14.2 (Glucagon) 2.5e4 Area MRM of 4 Channels ES pg/ml > 14.2 (Glucagon) e4 Area MRM of 4 Channels ES+ Blank plasma > 14.2 (Glucagon) 3.49e , pg/ml Time Figure 1. Representative chromatograms from glucagon extracted from plasma at 12.5, 25, 5, 1, 25, 5, and 1, pg/ml, compared to blank plasma. 26 Development of a High Sensitivity SPE-LC-MS/MS Assay for the Quantification of Glucagon in Human Plasma Using the ionkey/ms System
29 CONCLUSIONS The combination of the ionkey/ms System, mixed-mode µelution SPE, and higher m/z b or y ion MS fragments provided the level of selectivity and sensitivity necessary to accurately quantify low pg/ml concentrations of glucagon in extracted plasma. Use of µelution format SPE eliminated the need for evaporation, reducing glucagon losses due to adsorption and non-specific binding. The 15 µm ikey Separation Device enabled the development of a highly sensitive, low flow quantitative MRM method for glucagon with an LOD of 12.5 pg/ml and a dynamic range from ,. pg/ml. The current analysis uses 2 µl of plasma and provides a significant improvement in sensitivity and S:N over the analytical scale (2.1 mm I.D.) analysis using 1/5 th the sample injection volume. Furthermore, an injection of the same volume (5 µl) of sample corresponded to a 1X increase in on-column sensitivity allowing for greater confidence in results, as compared to the traditional analytical method for this peptide. In addition, the ionkey/ms System reduces solvent and sample consumption, thereby reducing cost and allowing for multiple injections of samples for improved accuracy or to meet the guidelines for incurred sample reanalysis (ISR). References 1. Eli Lilly and Company Glucagon United States package insert R&D Systems, Inc. Quantikine ELISA Glucagon Immunoassay, Catalog Number DGCG. For the Quantitative Determination of Glucagon Concentrations in Cell Culture Supernates, Serum, and Plasma. R&D Systems, Inc., Minneapolis, MN, USA (211). 3. EMD Millipore Corporation. Glucagon Chemiluminescent ELISA Kit, 96-Well Plate (Cat # EZGLU-3K). EMD Millipore Corporation, St. Charles, MO, USA (212). 4. Millipore. Glucagon RIA Kit, 25 Tubes (Cat. # GL-32K). Millipore, St. Charles, MO, USA (211). 5. ALPCO Diagnostics. Glucagon RIA: For the Quantitative Determination of Glucagon in Plasma. ALPCO Diagnostics, Salem, NH, USA (211). 6. Lapko V, Brown P, Nachi R et al. Exploring quantification of peptides: measurement of glucagon in human plasma by LC-MS/MS. Presented at: EBF 3rd Annual Open Symposium: From Challenges to Solutions. Barcelona, Spain, 1 3 December Lapko VN, Miller PS, Brown GP, Islam R et al. Sensitive glucagon quantification by immunochemical and LC-MS/MS methods. Bioanalysis (213) 5(23). 8. Gerich JE, Lorenzi M, Bier DM et al., Effects of physiologic levels of glucagon and growth hormone on human carbohydrate and lipid metabolism. Studies involving administration of exogenous hormone during suppression of endogenous hormone secretion with somatostatin. J.Clin Invest Apr; 57(4): Waters, The Science of What s Possible, ACQUITY UPLC, Xevo, Oasis, MassLynx, ACQUITY, Symmetry, and UPLC are registered trademarks of Waters Corporation. μelution, ionkey/ms, ikey, ionkey, and TargetLynx are trademarks of Waters Corporation. All other trademarks are the property of their respective owners Waters Corporation. Produced in the U.S.A. January EN AG-PDF Waters Corporation 34 Maple Street Milford, MA 1757 U.S.A. T: F: Development of a High Sensitivity SPE-LC-MS/MS Assay for the Quantification of Glucagon in Human Plasma Using the ionkey/ms System 27
30 Exploring Extra Sensitivity Using ionkey/ms with the Xevo G2-XS QTof HRMS for Small Molecule Pharmaceutical Analysis in Human Plasma Yun Wang Alelyunas, Mark D. Wrona, Jim Murphy, Angela Doneanu, Gregory Roman, and Paul Rainville Waters Corporation, Milford, MA, USA APPLICATION BENEFITS High sensitive quantitation using high resolution mass spectrometry (HRMS) Fully integrated HRMS and microfluidics solution for bioanalysis Flexible HRMS platform with full scan, quan-qual (MS E ) and purely quantitative (Tof-MRM) modes of operation Trap and elute to enable high sample load with the ionkey/ms System Trap and elute to increase retention and peak shape of polar compound WATERS SOLUTIONS ACQUITY UPLC M-Class System ionkey/ms System Xevo G2-XS QTof ikey HSS T3 Separation Device ACQUITY UPLC M-Class HSS T3 Trap Column MassLynx Software with TargetLynx Application Manager KEY WORDS Propranolol, verapamil, clopidogrel, buspirone, UPLC, HRMS, XS, QTof, Tof-MRM, LOQ, sensitivity, linearity, linear dynamic range, ikey Separation Device, ionkey/ms System INTRODUCTION The need for unambiguous data to support milestone transition and compound selection for drug discovery and development has fueled an unrelenting desire for instruments with higher sensitivity. Consequently sensitivity enhancement has been a critical attribute in each evolution of modern LC-MS instrumentation. To address this need, Waters has focused on integrating and optimizing both the inlet and the MS detector. The ionkey/ms System integrates the separation into the source of the Xevo G2-XS QTof Mass Spectrometer, yielding a single integrated platform. The ikey Separation Device is a microfluidic separation device that combines a traditional column, column oven, and electrospray emitter into one, and is integrated into the source of the mass spectrometer. Through enhanced ionization efficiency and reduced matrix interference, the ionkey/ms System produces signal enhancements for small molecule analysis, compared to analytical scale LC. The Xevo G2-XS QTof delivers enhanced mass resolution and sensitivity compared to its predecessor. This enhanced sensitivity is realized through a collision cell design that improves ion focusing and reduces losses in ion transfer through the cell. In addition to new hardware, innovative software, and acquisition methods were also introduced to enable simple Tof-MRM modes of operation targeted for routine bioanalytical work. Here, a variety of drugs in human plasma were analyzed using several configurations of the ionkey/ms System with the Xevo G2-XS QTof. In the first series of experiments, the linearity and limits of quantitation (LOQ) were determined using direct injection and under Tof-MRM mode of operation. In the second set of experiments, a trap valve manager was configured to load samples onto the trap column for initial injection and wash, before being switched into the LC stream for compound elution, thus significantly increasing the injectable sample volume. Trapping using either single pump or dual pump configuration is described. The advantages of using trap-and-elute for optimum peak shape and higher sample volume is discussed. 28
31 E X P E R IM E N TA L LC conditions LC system: Separation device: Trapping column: Separation device temp.: 45 C Sample temp.: 1 C Injection vol.: Flow rate: Mobile phase A: Mobile phase B: ACQUITY UPLC M-Class System ikey HSS T3 Separation Device, 1Å, 1.8 μm, 15 μm x 5 mm (p/n ) ACQUITY UPLC M-Class HSS T3 Trap Column, 1Å, 5 µm, 3 µm x 5 mm (p/n ) various 3 μl/min water with.1 formic acid 9 acetonitrile/1 methanol with.1 formic acid Sample description Human plasma was prepared by protein precipitation with the addition of acetonitrile (ACN) using a volume ratio of 3:1. The solution was centrifuged at 13, relative centrifugal force (RCF) and the supernatant was transferred to a new vial and further diluted 1:4 with water. The final ACN in sample was approximately 19. Test compounds (propranolol, verapamil, buspirone, and clopidogrel) were combined in a 1 ng/ml solution in diluted human plasma as previously described. The mixture was then serially diluted using diluted human plasma from a range of 1 ng/ml to <1 pg/ml. Method conditions The analytical LC-MS experiments were performed using the ionkey/ms System with the ACQUITY UPLC M-Class System and the Xevo G2-XS QTof Mass Spectrometer. MassLynx Software was used for data acquisition and TargetLynx Application Manager was used for data processing. Gradient: MS conditions MS system: Ionization mode: Acquisition range: Capillary voltage: Cone voltage: 2 6 B in 3.5 min, 6-95 in.5 min, held at 95 B for 3 min before returning to the initial condition. The total run time was 1 min. Xevo G2-XS QTof ESI+, sensitivity mode (>3, FWHM) 5-1,2 m/z 3.5 kv 3 V Source temp.: 11 C Cone gas flow: Scan time: Experiment MS settings: Tof-MRM settings: 5 L/hr.2 s, continuum see results section product ions, see result section for details Data management MassLynx Software with TargetLynx Application Manager Exploring Extra Sensitivity Using ionkey/ms with the Xevo G2-XS Q-Tof HRMS for Small Molecule Pharmaceutical Analysis in Human Plasma 29

32 RESULTS AND DISCUSSION Part I. Direct injection of sample using the ionkey/ms System The instrument configuration for direct injection is shown in Figure 1, where the sample solution is introduced to the ikey Separation Device directly from the autosampler. Serially diluted samples in human plasma are analyzed using Tof-MRM acquisition mode. In this mode, the precursor ion is selected in the quadrupole (MS-MS) and passes through the collision cell, where collision energy is applied to produce a fragment ion. The Tof pusher at the detector entrance is then synchronized with m/z of the fragment ion for target enhancement. Figure 2 is a screen capture of the MS method editor, showing the MS function table and MRM target enhancement settings. Signal enhancement and advantages using Tof-MRM in relationship to MS and MS E scans can be found in a recent application note. 1 For pure quantitation purposes, the Tof-MRM mode of data acquisition is generally recommended. Figure 3 is a representative chromatogram of the sample with 98 fg on column using the Tof-MRM mode of data acquisition. The data was processed following bioanalysis validation criteria where the linear standard curve was fitted using 1/X2 weighing and 15 deviation used as the data exclusion criterion. Figure 4 is a sample screen capture of TargetLynx results for clopidogrel, where linearity, linear dynamic range, and LOQ were determined. Table 1 is a data summary of these three compounds. Auto Sampler Pump ionkey/ms System Figure 1. Instrument configuration for direct sample injection onto the ionkey/ms System. Figure 2. Screen captures of MS method editor in MassLynx Software. Function 1 table on the left shows three compounds monitored under Tof-MRM mode of data acquisition. Conditions for collision energy and target enhancement for each compound are defined in the MRM editor window. The buspirone example on the right shows collision energy of 3 kv and product ion m/z = 122 for the target enhancement. Buspirone Verapamil Clopidogrel Figure 3. Structures of probe pharmaceuticals and extracted ion chromatograms (XIC) in human plasma using Tof-MRM mode of data acquisition. 3 Exploring Extra Sensitivity Using ionkey/ms with the Xevo G2-XS Q-Tof HRMS for Small Molecule Pharmaceutical Analysis in Human Plasma
 Table 1.")
33 Figure 4. TargetLynx results for clopidogrel. Top is a summary table for the data set. Lower left is the calibration curve using linear fitting and 1/X2 fitting. Lower right is a sample chromatogram at 1.5 pg/ml or 1.5 fg amount on-column. Compound CE ramp Transition Linear range [Log] (pg/ml) Table 1. Summary of MS method setting, linear range, linear dynamic range, and quantification limit for the three compounds analyzed. The data was acquired using a 1 µl sample loop. R 2 LOQ (pg/ml) LOQ (fg) amount-on-column Buspirone > ,5 [3.9] Clopidogrel > ,5 [4.2] Verapamil > ,5 [3.6] Results indicate excellent linearity for all three compounds. The linear dynamic range ranges from Log = 3.6 for verapamil to Log = 4.2 for clopidogrel. The low quantitation limits for three compounds range from.8 to 3 pg/ml, which translates to.8 to 3 fg on column. The signal to noise ratio at the low quantitation limits ranges from 9 to 79. These attributes indicate that the ionkey/ms System with the Xevo G2-XS QTof is well suited to meet the needs for routine bioanalysis. The added advantages of the ionkey/ms System, such as user friendliness and greater than 9 reduction in solvent usage compared to analytical LC, make the ionkey/ms System with the Xevo GS-XS QTof an excellent choice for today s most demanding analytical needs. Part II. Single pump trap-and-elute using the ionkey/ms System It is well known in liquid chromatography that injection volume and sample solvent strength can affect peak width or resolution. The effect is more pronounced for early eluting peaks, as the sample solvent is typically stronger than the initial mobile phase strength in gradient elution. Thus, too large of an injection volume or a high organic concentration in the sample can cause peak distortion or broadening. 2 At the microfluidics scale of the ionkey/ms System, with smaller column I.D. and system volume, this effect is expected to be more pronounced. Exploring Extra Sensitivity Using ionkey/ms with the Xevo G2-XS Q-Tof HRMS for Small Molecule Pharmaceutical Analysis in Human Plasma 31
34 The potential peak distortion is explained in Figure 5 in which 5 µl of the drug mixture in human plasma, containing ~19 ACN, was injected onto an ikey Separation Device. While the late eluting clopidogrel maintains excellent peak shape, the early eluting peaks for buspirone and propranolol are showing peak fronting. One approach to resolve this would be to dilute the sample further with weak solvent, however, this will also further dilute analyte concentration in the sample. The other approach is to inject the sample onto a trapping column before the ikey Separation Device. The trapping column has a larger inner diameter and runs at a higher flow rate making more mobile phase available for diluting out the strong sample solvent, resulting in effective focusing of the analytes onto the trapping column. It should be noted that comparing to analytical scale column (2.1 mm I.D.), the volumes being injected on the ikey Separation Device (15 µm I.D.) are far higher relative to the column volume. To put this into perspective, injecting 5 µl onto an ikey Separation Device is approximately equivalent to injecting 1 ml onto a 2.1 mm column, which is typically beyond normal operating boundaries. At 5 µl injections, the ikey Separation Device can be used for many compounds, especially if the sample diluent is low organic, but trapping offers a mechanism to allow larger injection volumes in routine analysis. The ionkey/ms System configured for single pump trapping is shown in Figure 6, using one pump and a trapping valve manager between the autosampler and the ikey Separation Device. The valve is set at trap position during sample injection, where weak solvent is pumped through the trapping column for dilution of the strong sample solvent, and concentrates the analyte at the head of the trapping column. After a set time, as defined by the user, the valve is switched to elute position, when the pump starts gradient elution to back flush the analyte onto the ikey Separation Device for separation and MS detection. Figure 7 shows the same 5 µl sample injection with trapping; the peak shape of both early eluting buspirone and propranolol, and late eluting clopidogrel are excellent. Buspirone Clopidogrel Propranolol Figure 5. XIC of 5 µl injection of sample in human plasma containing ~19 ACN. Both early eluting buspirone and propranolol show peak fronting, while clopidogrel shows excellent peak shape (sample loop was 5 µl; sample concentration was 3 ng/ml.) Auto Sampler Pump Buspirone Clopidogrel Propranolol IonKey/MS Trap TRAP Position waste IonKey/MS Figure 6. Instrument configuration using single pump trapping. Figure 7. XIC of 5 µl injection of sample in human plasma containing 19 ACN using one pump trapping configuration. The sample concentration was 98 pg/ml or 98 femtogram on column. The trapping column used was an ACQUITY UPLC M-Class HSS T3, 5 µm, 3 µm x 5 mm Column (p/n ). Trapping flow rate was isocratic at 15 µl/min 99.5 A/.5 B. Trapping time was 2 minutes. Sample loop was 5 µl. MS scan mode of data acquisition was used. Trap ELUTE Position waste 32 Exploring Extra Sensitivity Using ionkey/ms with the Xevo G2-XS Q-Tof HRMS for Small Molecule Pharmaceutical Analysis in Human Plasma
35 Part III. Dual pump trap-and-elute for optimum ikey Seperation Device protection and enhanced sample loading The trapping and subsequent sample elution can also be carried out using a two pump configuration as shown in Figure 8. The two pumps are identical ACQUITY UPLC M-Class Binary Solvent Managers. For the sake of differentiation, one pump is labeled trap and the other pump labeled ikey. Under this configuration, both the ikey Separation Device and trapping column are under active flow at all times. Similar to the single pump trapping configuration, the valve is initially set at trap position during sample injection, where weak solvent is pumped through the trapping column for dilution of strong sample solvent, and concentration of analyte at the head of the trapping column. After a set time as defined by the loading time in the LC method, the valve is switched to elute position when the pump starts gradient elution to back flush the analyte onto the ikey Separation Device for separation and MS detection. After the analytes are eluted from the trap column, one has the option of switching the valve back to the trap position and washing the trap column with high organic mobile phase at high flow rate. This way, high lipophillic endogenous plasma components that are largely retained on the trapping column can be diverted to waste, rather than eluted onto the ikey Separation Device and MS. In this configuration, the trap column also acts as a pseudo guard column for the ikey Separation Device, and the wash cycle of the ikey Separation Device can be potentially shortened. More detailed description of inlet method parameters for the trap-and-elute can be found in the Appendix. By installing a 2 µl sample loop into the autosampler of this dual pump trap-and-elute configuration, samples prepared in human plasma were injected with varying injection volume from 1 µl to 2 µl. Figure 9 shows an overlaid extracted mass chromatogram of samples at 1, 5, 1, and 2 µl injection. Data shows that peak resolution and peak shape were maintained for all volumes injected, and that the ikey Separation Device is capable of handling 2 µl injection of human plasma sample, with no adverse effect on peak shape or resolution. IonKey/MS System IonKey/MS System Pump (ikey) waste Trap Trap Auto Sampler Pump (Trap) TRAP Position ELUTE Position Figure 8. Instrument configuration dual pump trap-and-elute. Propranolol Buspirone Verapamil Clopidogrel 1 L 5 L 1 L 2 L Figure 9. Overlaid XIC of sample with injection volume at 1, 5, 1, and 2 µl using a 2 µl sample loop. Peak retention and peak area are labeled in the graph. The solution concentration is 3 ng/ml for each compound in human plasma. MS full scan at scan rate of.2 s was used for the data acquisition. Trap and elute LC conditions are explained in the Appendix. Exploring Extra Sensitivity Using ionkey/ms with the Xevo G2-XS Q-Tof HRMS for Small Molecule Pharmaceutical Analysis in Human Plasma 33
36 The peaks of propranolol and buspirone, that had fronting at 5 µl direct injection without trapping, showed no fronting at the high 2 µl injection. Figure 1 is the plot of injection volume versus peak area of propranolol, buspirone, and verapamil. A linear response with R 2 >.995 were observed indicating complete sample recovery using the trapping column. For highly lipophilic, poorly soluble compounds, such as clopidogrel, a stronger mobile-phase solvent is needed to prevent sample precipitation from the sample loop. Figure 11 is the plot of injection volume versus peak area of clopidogrel at two trapping solvent compositions. At low.5 ACN in trapping mobile phase solvent, the plot shows a downward curve, indicating incomplete elution of sample post injection. Increasing ACN in trapping mobile phase solvent to 5, the response becomes linear indicating complete recovery. It should be noted that even injecting 2 µl of human plasma sample to a 2.1 mm I.D. x 5 mm analytical column (an injection to column volume ratio of.11) is already challenging, and potentially results in poor peak shape or loss of resolution. At microfluidics scale of the ikey Separation Device, the 2 µl injected is 23 times that of an empty ikey Separation Device volume, a much higher injection to column volume compared to the analytical scale. This is equivalent to injecting 4 ml of sample into a 2.1 mm I.D. x 5 mm analytical column. Yet, excellent peak shape and resolution are maintained. This demonstrated how high volume injections using the ionkey/ms System would further broaden the usability and versatility of the system using traditional bioanalysis and DMPK lab sample volume workflows. To summarize, the trap-and-elute configurations allow analysts to extend the usable inject sample volume range in order to further enhance detection of weak signals. Peak Area Propranolol y = 465x R = Peak Area ACN Peak Area Peak Area Inj. Volume (µl) Buspirone 2 y = x R = Inj. Volume (µl) Verapamil 5 y = x R = Inj. Volume (µl) Peak Area ACN Inj. Volume (µl) y = x R = Inj. Volume (µl) Figure 11. Plot of peak area versus injection volume of clopidogrel at two different trapping mobile phase composition: (left).5acn/99.5h 2 O, and (right) 5ACN/95H 2 O. Figure 1. Plot of peak area versus injection volume. Trapping mobile phase consists of.5acn/99.5h 2 O. 34 Exploring Extra Sensitivity Using ionkey/ms with the Xevo G2-XS Q-Tof HRMS for Small Molecule Pharmaceutical Analysis in Human Plasma
37 CONCLUSIONS High sensitivity is demonstrated in the present study using the ionkey/ms System with the Xevo G2-XS HRMS. Using samples in human plasma, the system routinely reaches sub-femtogram on-column sensitivity using direct 1 µl injection and using Tof-MRM mode of data acquisition. The observed linear dynamic range and signal-to-noise ratio at quantitation limit fully support the HRMS system to be used in routine bioanalysis. Adding to this, the system can be extended using trap-and-elute configurations. The use of a trapping column can dilute strong sample solvent that might affect peak shape and peak resolution, especially those for early eluting compounds. The trap-and-elute configurations will also allow large volumes to be injected, which further enhances the sensitivity of the system. The option of using valve switching to divert late eluting endogenous plasma components to waste can help protect the ikey Separation Device and MS detector from contaminations by highly lipophilic components in the sample matrix. An injection volume as high as 2 µl is demonstrated to produce excellent peak shape and peak resolution for compounds with diverse polarity. All these observations coupled with user friendliness of the ikey Separation Device and tremendous solvent savings, suggest the ionkey/ms System with the Xevo-G2-XS HRMS is an ideal platform to meet modern challenges of both quantitative and qualitative analysis in pharmaceutical applications. References 1. Yun W. Alelyunas, Mark D. Wrona, Russell J. Mortishire- Smith, Nick Tomczyk, and Paul D. Rainville. Quantitation by High Resolution Mass Spectrometry: Using Target Enhancement and Tof-MRM to Achieve Femtogram-level On-column Sensitivity for Quantitation of Drugs in Human Plasma. Waters application note, 214, EN. 2. Lloyd R. Snyder, John W. Dolan. High-Performance Gradient Elution: The Practical Application of the Linear-Solvent-Strength Model. Wiley, 26, pp ISBN: Exploring Extra Sensitivity Using ionkey/ms with the Xevo G2-XS Q-Tof HRMS for Small Molecule Pharmaceutical Analysis in Human Plasma 35
38 APPENDIX Programming inlet method conditions for the two pumps trap-and-elute After the connection of two pumps and a trap valve manager in the analytical or elute position. The length of the valve spent at the the UPLC, these modules are visible in the inlet panel as shown in trapping position is defined by loading time, in this case, 2 minutes Figure A-1. With inclusion of the trap valve manager in the system, is used (the shaded box in Figure A-1). After trapping is completed, a new tab called trapping is visible in each of the pump pages, the system automatically switches to the analytical or elute position. where the LC mobile phase conditions are defined, when the trap The following screen captures are from the method used in the present valve is at trap stage. The analytical tab on the pump page is used two pump trap-and-elute method, more details are described in each to define LC mobile phase conditions, when the valve is switched to figure caption. A-1 A-2 Figure A-1. LC pump mobile phase conditions when trap valve is set at trap position. The method shows that the trap pump is delivering 99.5 A/.5 B isocratic to the trap column. The ikey pump is delivering 98 A/2B isocratic, the initial gradient condition, to the ikey Separation Device. This is maintained for 2 minutes as shown in the loading time window. A-2 A-3 Figure A-2. LC pump gradient conditions for sample elution. After 2 minutes, the valve is switched to elute position. Mobile phase conditions for each of the pumps are defined by the analytical tab of the pump method panel. For the ikey pump, a full gradient cycle is applied to elude the sample from the trap column, to the ikey Separation Device, then into the MS. For the trap pump, a full gradient cycle is also written to wash the sample loop, the trap column (after it is switched back into loop) uses a strong organic solvent of 5 A/95 B, and then goes back to the initial condition. 36 Exploring Extra Sensitivity Using ionkey/ms with the Xevo G2-XS Q-Tof HRMS for Small Molecule Pharmaceutical Analysis in Human Plasma
 is defined.")


39 A-3 Figure A-3. Trap value parameter settings. The trap value method consists of two parts. Under the general tab, the exact valve position for trap-and-elute (analytical) is defined. In this case, position 1 is used for analytical and position 2 for trapping. A valve position diagram can be found on the inside panel of the trap valve manager. To wash late eluting components on the trap column into waste, the valve is switched back to trap position during the run by using the analytical event tap. In this case, the valve is switched after 6 minutes to the trap position, where the late eluting plasma components on the trap column are washed using the trap pump at 15 µl/min with 95 B/5A. Waters, The Science of What s Possible, Xevo, ACQUITY UPLC, and MassLynx are registered trademarks of Waters Corporation. ionkey/ms, ikey, and TargetLynx are trademarks of Waters Corporation. All other trademarks are the property of their respective owners Waters Corporation. Produced in the U.S.A. January EN AG-PDF Waters Corporation 34 Maple Street Milford, MA 1757 U.S.A. T: F: Exploring Extra Sensitivity Using ionkey/ms with the Xevo G2-XS Q-Tof HRMS for Small Molecule Pharmaceutical Analysis in Human Plasma 37
40 Improving a High Sensitivity Assay for the Quantification of Teriparatide in Human Plasma Using the ionkey/ms System Mary E. Lame and Erin E. Chambers Waters Corporation, Milford, MA, USA APPLICATION BENEFITS High sensitivity assay with LOD of 1 pg/ml in human plasma Reduced solvent consumption (5X) compared to 2.1 mm scale means significant cost savings Use of solid-phase extraction (SPE) reduces matrix interferences and enhances selectivity of the extraction for teriparatide in plasma 96-well μelution plate format enables concentration of the sample while maintaining solubility and minimizes peptide losses due to adsorption INTRODUCTION Teriparatide (FORTEO ), Figure 1, is a recombinant form of a fragment of human parathyroid hormone, used in the treatment of osteoporosis. Osteoporosis is responsible for 1.5 million bone fractures a year and teriparatide is the first treatment that stimulates new bone formation. It is an anabolic drug that acts to build up bones and has the potential to improve skeletal micro architecture and increase bone density. Teriparatide is the first 34 amino acids (the biologically active region) of the 84-amino acid human parathyroid hormone (PTH), and is also referred to as, rhpth (1 34). 1 Selective, fast SPE extraction (<3 minutes) without time-consuming immuno-affinity purification Compared to 2.1 mm scale, proof of concept studies yield 4X greater S:N from 4X less sample and half the injection volume allowing for greater confidence in results, more tests per sample, and more injections WATERS SOLUTIONS Bradykinin Amino Acid Sequence: RPPGFSPFR ionkey/ms System ACQUITY UPLC M-Class System ionkey Source Xevo TQ-S ikey Separation Device Oasis HLB 96-well μelution Plate Waters Collection Plate MassLynx Software TargetLynx KEY WORDS bioanalysis, Oasis, sample preparation, peptide quantification, teriparatide, UPLC, 2D Technology, plasma, ionkey/ms, ikey Figure 1. Representative structure and amino acid sequence of teriparatide. Although biologics have historically been quantified using ligand binding assays (LBAs), over the past few years, there has been a trend toward the analysis of large molecules by LC-MS/MS. This is, in part, driven by the fact that LBAs can suffer from significant cross-reactivity issues and lack of standardization. LC-MS/MS has the advantage of shorter development times, greater accuracy and precision, the ability to multiplex, and can readily distinguish between closely related analogues, metabolites or endogenous interferences. 38
41 E X P E R IM E N TA L Sample prepration Samples were pretreated using protein precipitation (PPT) and extracted on an Oasis HLB 96-well µelution Plate, 2 mg Sorbent per Well, 3 µm (p/n BA) particle size according to a previously published method. 3 Method conditions Elution flow rate: 2. µl/min UPLC conditions LC system: Separation device: Trap column: Mobile phase A: Mobile phase B: Loading solvent: Valve position: ACQUITY UPLC M-Class with 2D Technology configured with optional trap and back flush elution ikey Peptide BEH C 18 Separation Device, 13Å, 1.7 µm, 15 µm x 5 mm (p/n ) ACQUITY UPLC M-Class Symmetry C 18 Trap Column, 1Å, 5 µm, 3 µm x 5 mm (p/n ).1 formic acid in water.1 formic acid in acetonitrile 95:5 mobile phase A:B, 35 µl/min for first two minutes, reverse valve Initial position one (forward loading of trap), switch to position two at two minutes (back flush elute of trap onto the analytical column) Final optimized analytical gradient: See Table 1 ikey temp.: 75 C Sample temp.: 15 C Final injection vol.: 15 µl Total run time: Collection plates: MS conditions MS system: Ionization mode: Capillary voltage: 13. minutes Waters 1 ml Collection Plates (p/n 6143) Xevo TQ-S ESI positive 3.6 kv Source temp.: 12 C Cone gas flow: 5 L/hr Collision cell pressure: 3.83 x 1 (-3) mbar Collision energy: Optimized by component, see Table 2 Cone voltage: Optimized by component, see Table 2 Data management Chromatography software: MassLynx 4.1 Quantification software: TargetLynx Improving a High Sensitivity Assay for the Quantification of Teriparatide in Human Plasma Using the ionkey/ms System 39
42 The need for robust and sensitive analysis of peptide species challenges both chromatographic separation and mass spectrometry. Peptides, in general, are often difficult to analyze by LC-MS/MS, as MS sensitivity is low due to the formation of multiple precursors and poor or overly extensive fragmentation, making LC and sample preparation even more critical. In addition, teriparatide also suffers from significant non-specific binding and poor solubility, making LC and sample preparation method development challenging. The pharmacokinetics of teriparatide are characterized by rapid absorption within 3 minutes and rapid elimination with a half-life of 1 hour, resulting in a total duration of exposure (to the peptide) of approximately 4 hours. 1,2 At the practical clinical dose of 2 µg the typical teriparatide levels are ~5 pg/ml, which makes detection by traditional LC-MS/MS even more difficult. Through a combination of selective sample preparation, optimal MS precursor and fragment choice, and UPLC separation on a charged surface column, we developed and published an analytical scale method for accurate, precise, teriparatide quantification with a detection limit of 15 pg/ml. 3 In this current work however, we undertook to a) transfer this method to the ionkey/ms System (phase 1), and b) further improve the method through the inherent characteristics of the ionkey/ms System (phase 2). This technology integrates the UPLC analytical separation directly into the source of the mass spectrometer (Figure 2). The ikey Separation Device (15 µm I.D.), shown in Figure 3, contains the fluidic channel, electronics, ESI interface, heater, ecord, and the chemistry to perform UPLC separations. Additionally, the ionkey/ms System can provide increased sensitivity compared to 2.1 mm I.D. chromatography with the same injection volume, or equivalent or greater sensitivity with reduced sample consumption, making it ideal for peptide analyses. It is common for bioanalytical LC-MS assays to consume high volumes of both solvent and sample, thus increasing the cost of the assay and limiting the number of replicates that can be analyzed. This study combines µelution SPE and the novel and highly efficient ionkey/ms System to improve a quantitative assay for teriparatide in human plasma. In phase 1, we will demonstrate the effective transfer of the previously developed analytical method using a 2 µl sample size to the ionkey/ms System. Results will show that we can readily achieve a limit of detection (LOD) of 1 pg/ml with a linear dynamic range of 1 3, pg/ml in human plasma, using 1/3 of the injection volume. Mean accuracy and precision of quality control samples were 12.9 and 3.5, respectively. In phase 2, we show proof of concept for further method improvement, fully capitalizing on the attributes of the ionkey/ms System to reduce the sample volume by 4X, reduce injection volume by half, and increase signal-to-noise (S:N) by 4X over the 2.1 mm I.D. scale. Time (min) Flow rate (µl/min) Composition A () Composition B () Curve Initial Table 1. UPLC gradient conditions. 4 Improving a High Sensitivity Assay for the Quantification of Teriparatide in Human Plasma Using the ionkey/ms System
.")
43 Figure 2. ionkey/ms System: comprised of the Xevo TQ-S, the ACQUITY UPLC M-Class, the ionkey Source, and the ikey Separation Device. Figure 3. ikey Separation Device. RESULTS AND DISCUSSION Mass spectrometry Several multiple-charged precursors were observed for teriparatide and rhpth (1-38). The 6+ charge state of teriparatide at m/z was determined to be the most intense and yielded a selective fragment at m/z for quantitative analysis. The 7+ precursor at m/z 589 was also intense, but did not yield any useable fragments. CID of the 5+ precursor at m/z produced fragment ions of sufficient intensity to be used for confirmatory purposes. The 6+ charge state of the IS [rhpth(1-38)] at m/z and its fragment ion at m/z was used for quantitation. Although many peptides produce intense fragments below m/z 2, these ions (often immonium ions) result in high background in extracted samples due to their lack of specificity. In this assay, the use of highly specific y ion fragments above m/z 7 yielded significantly improved specificity, facilitating the use of simpler SPE methodologies. Improving a High Sensitivity Assay for the Quantification of Teriparatide in Human Plasma Using the ionkey/ms System 41
44 Phase I. Initial chromatographic separation Chromatographic separation of teriparatide and its IS was achieved using the novel microfluidic chromatographic ikey Separation Device. The ikey Separation Device has a channel with UPLC-grade, sub-2-µm particles that permits operation at high pressure and results in highly efficient LC separations. By integrating microscale LC components into a single platform design, problems associated with capillary connections, including manual variability, leaks, and excessive dead volume are avoided. ikey Peptide BEH C18 Separation Device, 13Å, 1.7 µm, 15 µm x 5 mm (p/n ) provided excellent peak shape, narrow peak widths (<2.5 secs at base), and resolution from endogenous matrix interferences. Representative chromatograms of teriparatide and the IS, eluted using an initial linear gradient from 8 to 65 B over 5 minutes, on an ikey Peptide BEH C18 Separation Device, 13Å, 1.7 µm, 15 µm x 5 mm (p/n ), are shown in Figure 4. These samples were extracted from 2 µl of sample and 1 µl was injected. This corresponded to injecting 1/3 of the sample required for the 2.1 mm I.D. scale, but extracting the same sample volume. The use of multidimensional chromatography, specifically a trap and back-elute strategy, provided further sample cleanup and facilitated the loading of 1 15 µl of the high organic SPE eluate (required to maintain solubility of the peptides) without experiencing analyte break through. Additionally, the ability to inject the larger sample volumes typical for analytical scale LC analysis on the ikey Separation Device can provide the substantial gains in sensitivity that are often required to accurately and reliably detect low pg/ml levels of peptide and protein in complex matrices MRM of 4 Channels ES+ 687 > (Teriparatide 6+) 1.5e6 Teriparatide - Time MRM of 4 Channels ES > (Human Par 1-38 (IS)7+) 3.5e5 rhpth (1-38), IS - Time Figure 4. UPLC separation of teriparatide and IS, from extracted plasma, using the ikey Peptide BEH C 18 Separation Device, 13Å, 1.7 µm, 15 µm x 5 mm (p/n ). 42 Improving a High Sensitivity Assay for the Quantification of Teriparatide in Human Plasma Using the ionkey/ms System
45 Sample preparation Development of this assay was challenging due to non-specific binding (NSB) and maintenance of peptide solubility throughout the SPE extraction and elution process. Sample pretreatment prior to SPE proved to be critical in improving recovery and specificity. Protein precipitation (1:1) with 5 NH4OH in acetonitrile resulted in 8 1 recovery without precipitating the peptide itself. Use of Oasis HLB SPE provided a reversed-phase mode of retention, enabling sample cleanup, selectivity, concentration of the sample, and ultimate sensitivity for this peptide. Teriparatide and the IS were well retained on this SPE sorbent during the basic ph load step, with no break through occurring. Optimization of the elution solution was critical to fully elute teriparatide, maintain its solubility and minimize interferences from the plasma matrix. The optimum elution solution was 6 organic, with 1 trifluoroacetic acid, and 5 trifluoroethanol (TFE), the latter being added to maintain solubility of the compound. Additionally, the Oasis HLB 96-well µelution Plate can be processed manually in under 3 minutes and is compatible with most liquid-handling robotic systems for automation to meet sample throughput requirements. This format also provides the ability to concentrate the sample and elute in very small sample volumes, minimizing the potential for peptide losses that might occur during evaporation due to adsorption to the walls of collection plates and/or chemical instability. Linearity, accuracy, and precision To generate standard curves, human plasma was fortified with teriparatide at the following final concentrations: 1, 2, 4, 6, 1, 3, 6, 1,, and 3, pg/ml. Each standard level was prepared in duplicate. Quality control (QC) samples (N=5) were prepared from the same plasma at 25, 5, 8, 2, and 5 pg/ml. Human parathyroid hormone 1-38 [rhpth (1-38)] was used as the internal standard (IS). Peak area ratios (PARs) of the analyte peak area to the IS peak were calculated. The calibration curve was constructed using PARs of the calibration samples by applying a one/concentration (1/x) weighted linear regression model. Using 1/x regression, teriparatide was linear with an R 2 value of >.99. A summary of standard curve performance (1 3, pg/ml) is shown in Table 3. All QC sample concentrations were then calculated from their PARS against the calibration curve. Results from QC analysis are shown in Table 4. Figure 5 contains representative chromatograms for QC samples containing teriparatide at 25, 5, 8, 2, and 5 pg/ml extracted from 2 µl human plasma as compared to blank extracted plasma. At all levels, QC samples demonstrated very good accuracy and precision, with mean accuracies ranging from and mean CV s of These results easily meet the recommended FDA acceptance criteria outlined in the white papers describing best practices in bioanalytical method validation for LC-MS/MS assays. 4,5 Peptide MRM transition Cone voltage (V) Collision energy (ev) Teriparatide > > > > Human Parathyroid 1-38 (ISTD) Table 2. MRM transitions, collision energies, and cone voltages for teriparatide and human parathyroid hormone 1-38 [rhpth (1-38)], the IS. Improving a High Sensitivity Assay for the Quantification of Teriparatide in Human Plasma Using the ionkey/ms System 43
46 Teriparatide concentration (pg/ml) Teriparatide/IS ratio response Calculated teriparatide concentration (pg/ml) Mean accuracy , , Table 3. Standard curve summary and statistics from 1 3, pg/ml for teriparatide extracted from human plasma. Teriparatide QC concentration (pg/ml) Mean (N = 5) calculated concentration (pg/ml) Table 4. QC statistics from teriparatide extracted from human plasma. SD CV Mean accuracy Blank human plasma pg/ml -3 5 pg/ml - 8 pg/ml - 2 pg/ml Figure 5. Representative QC chromatograms of teriparatide 5 pg/ml extracted from 2 µl of human plasma at 25, 5, 8, 2, and 5 pg/ml compared to extracted blank plasma. Time Improving a High Sensitivity Assay for the Quantification of Teriparatide in Human Plasma Using the ionkey/ms System
47 Phase II. Minimizing sample requirements and reducing injection volume using the ionkey/ms System Initial validation of the method using the ionkey/ms System demonstrated increased sensitivity over the 2.1 mm I.D. scale, which allowed us to make significant further improvements. Two of the key benefits of integrated microscale separations are the ability to maintain or improve sensitivity using smaller sample volumes, and lower injection volumes. This obviously has the advantage of preserving precious study samples or allowing one to gain more information from each sample, especially if initial volume is limited (i.e. rat or mouse samples.) Following the original validation using 2 µl of sample, further chromatographic refinements were made and a proof of concept study was performed where only 5 µl of sample were extracted. Representative chromatograms from these QC samples containing teriparatide at 15, 25, and 5 pg/ml, as compared to blank extracted plasma, are shown in Figure 6. The linearity of the method (R 2 =.998) extracting 5 µl sample and injecting 15 µl, is shown in Figure 7. Finally, S:N for a 2 pg/ml extracted sample comparing the 2.1 mm published method to the ionkey/ms System proof of concept work is shown in Figure 8. While S:N is approximately 11:1 at the 2.1 mm I.D. scale, it is 45:1 using the ionkey/ms System with 4X less sample, and half the injection volume. The cumulative sensitivity and sample reduction benefits are particularly significant for labs where ultra-high sensitivity is required, especially from small samples _Terip_ pg/ml 5 pg/ml qc 6.23;195 MRM of 4 Channels ES+ 687 > (Teriparatide 6+) 6.13e4 Area _Terip_ _Terip_ _Terip_ pg/ml MRM of 4 Channels ES+ 687 > (Teriparatide 6+) 6.13e4 Area - 15 pg/ml MRM of 4 Channels ES+ 687 > (Teriparatide 6+) 6.13e4 Area Blank human plasma MRM of 4 Channels ES+ 687 > (Teriparatide 6+) 6.13e4 Area - Time Figure 6. Representative QC chromatograms of teriparatide extracted from 5 µl human plasma at 15, 25, and 5 pg/ml compared to extracted blank plasma. Improving a High Sensitivity Assay for the Quantification of Teriparatide in Human Plasma Using the ionkey/ms System 45
48 Compound name: Teriparatide 687 Correlation coefficient: r = , r 2 = Calibration curve:.1184 * x Response type: Internal Std (Ref 4), Area * (IS Conc./IS Area) Curve type: Linear, Origin: Exclude, Weighting: 1/x, Axis trans: None Residual pg/ml 1. Response pg/ml Figure 7. Linearity of the optimized ionkey/ms System assay. 1 MRM of 4 Channels ES+ 687 > (Teriparatide 6+) 5.e4 S/N:RMS=45.34 ionkey/ms method MRM of 4 Channels ES > (Teriparatide 6+) 5.e S/N:RMS= Original 2.1 mm method Time Figure 8. A comparison of 2 pg/ml teriparatide extracted from human plasma using the optimized ionkey/ms System method and an optimized 2.1 mm scale method. 5 µl of plasma were extracted for the ionkey/ms System and 2 µl plasma for 2.1 mm scale. 46 Improving a High Sensitivity Assay for the Quantification of Teriparatide in Human Plasma Using the ionkey/ms System
49 CONCLUSIONS The combination of the ionkey/ms System, μelution reversed-phase SPE, and higher m/z b or y ion MS fragments provided the level of selectivity and sensitivity necessary to accurately quantify low pg/ml concentrations of teriparatide in extracted plasma. Use of the μelution format SPE plate eliminated the need for evaporation, reducing teriparatide losses due to adsorption and non-specific binding. The use of the 15 µm ikey Separation Device enabled the development of a highly sensitive, quantitative MRM method for teriparatide with an LOD of 1 pg/ml from only 2 μl of plasma with a 1 μl injection of sample. Standard curves were accurate and precise from 1 3, pg/ml. QC samples at all levels easily met recommended FDA regulatory criteria 4,5 with mean accuracies ranging from and mean CV ranges of , indicating an accurate, precise, and reproducible method. The ionkey/ms System method was further optimized to provide a 4X improvement in S:N over the 2.1 mm I.D. scale using 4X less sample and half the injection volume. In addition, the ionkey/ms System also reduces solvent and sample consumption, thereby reducing cost and allowing for multiple injections of samples for improved accuracy or to meet the guidelines for ISR. This method shows great promise for high sensitivity quantification of teriparatide in patient samples from PK and clinical studies using the ionkey/ms System if further validation was performed. References 1. Eli Lilly and Company (29) Teriparatide [rhpth(1 34)] (Forteo) United States package insert. 2. Satterwhite J, Heathman M, Miller PD, Marin F, Glass EV, Dobnig H. Pharmacokinetics of teriparatide (rhpth[1 34]) and calcium pharmacodynamics in postmenopausal women with osteoporosis. Calcif Tissue Int 21 Dec;87(6): Chambers E, Lame M, et al., Journal of Chromatography B, 938 (213) Viswanathan CT, Bansal S, Booth B, DeStefano AJ, Rose MJ, Sailstad J, Shah VP, Skelly JP, Swann PG, Weiner R, Quantitative bioanalytical methods validation and implementation: best practices for chromatographic and ligand binding assays, Pharm. Res., 24 (27) Bansal S, DeStefano A, Key elements of bioanalytical method validation for small molecules, AAPS J., 9 (27) E Waters, The Science of What s Possible, UPLC, ACQUITY UPLC, Xevo, Oasis, Symmetry, and MassLynx are registered trademarks of Waters Corporation. μelution, ecord, ionkey/ms, ikey, and TargetLynx are trademarks of Waters Corporation. All other trademarks are the property of their respective owners Waters Corporation. Produced in the U.S.A. January EN AG-PDF Waters Corporation 34 Maple Street Milford, MA 1757 U.S.A. T: F: Improving a High Sensitivity Assay for the Quantification of Teriparatide in Human Plasma Using the ionkey/ms System 47
50 Increasing Sensitivity and Minimizing Sample Volume for the Quantification of Therapeutic and Endogenous Cyclic Peptides in Plasma Using ionkey/ms Mary E. Lame, Erin E. Chambers, and Kenneth J. Fountain Waters Corporation, Milford, MA, USA APPLICATION BENEFITS High sensitivity assay with LOQ of <1 pg/ml with only 1 μl of plasma Use of the ionkey/ms System facilitates detection limits of 2.5 pg/ml from only 25 μl of plasma Use of mixed-mode solid-phase extraction (SPE) reduces matrix interferences and enhances selectivity of the extraction in plasma 96-well μelution plate format enables concentration of the sample while maintaining solubility and minimizes peptide loss due to adsorption Selective, fast SPE extraction (<3 minutes) without time-consuming immuno-affinity purification Reduced solvent consumption (4X) compared to 2.1 mm scale means significant cost savings WATERS SOLUTIONS ionkey/ms System ACQUITY UPLC M-Class System ionkey Source Xevo TQ-S Mass Spectrometer ikey Separation Device Oasis WCX 96-well µelution Plate Waters Collection Plate MassLynx 4.1 Software TargetLynx Software INTRODUCTION The use of peptides and proteins as therapeutic agents has increased significantly in recent years. Thus, the demand for their analysis for toxicokinetic and pharmacokinetic studies is increasing as well. Historically, biologics have been quantified using ligand binding assays (LBAs). However, with recent advances in mass spectrometry (MS) and liquid chromatography (LC) technologies current approaches towards peptide quantification in biological fluids now include LC-MS/MS. This is in part driven by the fact that LBAs can suffer from significant cross-reactivity issues and lack of standardization. Additionally, LC-MS/MS also has the advantage of greater accuracy and precision, broader dynamic ranges, specificity, and speed of method development. However, accurate quantification of peptides by LC-MS/MS is often not without its own challenges. Peptides have diverse pharmacokinetic profiles, often low circulating plasma levels (pg/ml), generally low MS sensitivity, and require chromatographic resolution from endogenous isobaric matrix interferences. 1 Therefore, to achieve low pg/ml quantification limits, large plasma sample volumes (.2 1 ml) and sample injection volumes are often required. 2-6 These volumes are often impractical in discovery studies. Thus, the demand for quantitative bioanalytical assays that use decreased sample volumes, while maintaining or improving sensitivity are highly desired. This application investigates the improved sensitivity and decreased sample volume requirements for the therapeutic and endogenous cyclic peptides: desmopressin, vasopressin and octreotide. 7-9 The general properties of these peptides are shown in Table 1. Using a combination of selective μelution mixedmode SPE sample preparation, optimal MS precursor and fragment choice, and the ionkey/ms System (source shown in Figure 1), limits of quantification of 1 pg/ml in plasma were achieved. Capitalizing on the attributes of the ionkey/ms System facilitated reducing plasma sample required to 25 1 μl. KEY WORDS bioanalysis, Oasis, sample preparation, peptide quantification, octreotide, desmopressin, vasopressin, UPLC, 2D Technology, plasma, ionkey/ms, ikey, ionkey/ms 48
51 E X P E R IM E N TA L Method conditions UPLC conditions LC system: ACQUITY UPLC M-Class, configured for trap and back-flush elution Separation device: ikey HSS T3, 1.8 µm, 1Å, 15 µm x 1 mm ikey (p/n ) Trap column: ACQUITY UPLC M-Class Symmetry C18, 5 µm, 3 µm x 5 mm (p/n ) MS conditions MS system: Xevo TQ-S Ionization mode: ESI positive Capillary voltage: 3.8 kv Source temp.: 12 C Cone gas flow: 1 L/hr Collision cell pressure: 5.5 x 1 (-3) mbar Collision energy Optimized by component, see Table 3 Cone voltage: Optimized by component, see Table 3 Mobile phase A: Mobile phase B: Loading solvent: Valve position:.1 formic acid in water.1 formic acid in acetonitrile 98:2 mobile phase A:B, 25 µl/min for first two minutes, reverse valve Initial position one (forward loading of trap), switch to position two at two minutes (back flush elute of trap onto the analytical column) Data management Chromatography software: MassLynx 4.1 Quantification software: TargetLynx Analytical gradient: See Table 2 Elution flow rate: 3. µl/min ikey temp.: 75 C Sample temp.: 15 C Injection volume: 5 µl Total run time: Collection plates: 12. min Waters 1 ml Collection Plates Increasing Sensitivity and Minimizing Sample Volume for the Quantification of Therapeutic and Endogenous Cyclic Peptides 49
52 Table 1. Peptide chemical properties. Peptide Amino acid sequence MW pi HPLC index Octreotide 8Phe-Cys-Phe-Trp-Lys-Thr-Cys-Thr-ol [Disulfide bridge: 2-7] Desmopressin Mpa-Tyr-Phe-Gln-Asn-Cys-Pro-Arg-Gly-NH2 [Disulfide Bridge: 1-6] Vasopressin Cys-Tyr-Phe-Gln-Asn-Cys-Pro-Arg-Gly-NH2 [Disulfide Bridge: 1-6] Gradient: Time (min) Profile A B Curve Figure 1. ionkey Source. Table 2. LC gradient conditions. Sample preparation Sample pre-treatment 1 μl of human plasma was diluted 1:1 with 4 H3PO4 in water and mixed. Sample extraction with Oasis WCX Pre-treated plasma samples were extracted according to the protocol in Figure 2. All solutions are made up by volume. All extraction steps were applied to all wells of the μelution plate that contained samples. Oasis WCX µelution Protocol Part Number: Condition: 2 µl MeOH Equilibrate: 2 µl H 2 O Load: 2 µl Diluted Plasma Wash 1: 2 µl 5 NH 4 OH in H 2 O Wash 2: 2 µl 1 ACN in H 2 O Elute: 2 x 25 µl of 2 FA in 5:5 ACN:H 2 O Dilute: 5 µl H 2 O Figure 2. Oasis µelution WCX extraction protocol. 5 Increasing Sensitivity and Minimizing Sample Volume for the Quantification of Therapeutic and Endogenous Cyclic Peptides
53 RESULTS AND DISCUSSION Mass spectrometry The 2+ precursors of desmopressin (m/z ), vasopressin (m/z ), and octreotide (m/z 51.3) were used for quantitation. Their corresponding fragments and optimal MS conditions are shown in Table 3. In this assay, the use of highly specific b/y ion specific fragments was more challenging due to the small size and cyclic nature of these peptides. The fragment at m/z 328.2, corresponding to a y3 1+ ion, was chosen for desmopressin and vasopressin. The fragment at m/z 12.1, corresponding to the phenylalanine immonium ion, was used for octreotide. Table 3. MS conditions for cyclic peptides. Peptide Precursor MRM Transition Cone Voltage (V) Collision Energy (ev) Product Ion type Desmopressin [M+2H] > y3 (1+) Vasopressin [M+2H] > y3 (1+) Octreotide [M+2H] > immonium ion (Phe) Chromatographic separation Chromatographic separation was achieved using the novel microfluidic chromatographic ikey Separation Device. The ikey Separation Device (Figure 3) is packed with UPLC -grade sub-2-µm particles that permit operation at high pressure and results in highly efficient LC separations. By integrating microscale LC components into a single platform design, problems associated with capillary connections, including manual variability, leaks, and excessive dead volume, are avoided. Use of the ikey HSS T3, 1.8 µm, 1Å, 15 µm x 1 mm (p/n ) provided chromatographic retention, excellent peak shape, narrow peak widths (<4.5 seconds at base), and resolution from endogenous matrix interferences. 714_spe_25uL_ MRM of 4 Channels ES >328.2 (Vasopressin 2) 3.39e4 Vasopressin Figure 3. ikey Separations Device. The peptides were eluted using a linear gradient from 2 5 B over 5 minutes, Table 2. Representative chromatograms are shown in Figure 4. The use of a trap and back-flush elution strategy, provided further sample cleanup and facilitated the loading of 5 μl of the high organic SPE eluate (required to maintain solubility of the peptides) without experiencing analyte breakthrough. Additionally, the ability to inject sample volumes typical for 2.1 mm analytical scale LC analysis on the ikey Separation Device can provide the substantial gains in sensitivity that are often required to accurately and reliably detect low pg/ml levels of peptides and proteins in complex matrices. 714_spe_25uL_ MRM of 4 Channels ES > (Desmopressin 2) 9.84e4 Figure 4. UPLC separation of desmopressin, vasopressin, and octreotide, using the ikey HSS T3, 1.8 µm, 1Å, 15 µm x 1 mm (p/n ) Desmopressin Octreotide MRM of 4 Channels ES > 12.1 (Octreotide 3) 1.6e5 Time Increasing Sensitivity and Minimizing Sample Volume for the Quantification of Therapeutic and Endogenous Cyclic Peptides 51
54 Enhanced sensitivity with the use of ionkey/ms Versus analytical scale (2.1 mm I.D.), the ionkey/ms System generally offers increased sensitivity, making it ideal for high sensitivity peptide analysis. This also facilitates the use of smaller sample volumes whilst maintaining or improving sensitivity. In Figures 5 and 6, detection of 2.5 pg/ml of desmopressin and octreotide was easily obtained from extraction of 25, 1, or 2 μl human plasma, using injection volumes 1 μl. 1 2 µl extraction, 5 µl injection 5.76;368 MRM of 4 Channels ES > (Desmopressin 2) 9.9e3 Area µl extraction, 5 µl injection MRM of 4 Channels ES > (Desmopressin 2) 9.9e3 Area 25 µl extraction, 1 µl injection MRM of 4 Channels ES > (Desmopressin 2) 9.9e3 Area Time Figure 5. Enhanced sensitivity using the ionkey/ms System: Extraction volume comparison of desmopressin (2.5 pg/ml) from human plasma. 1 2 µl extraction, 5 µl injection MRM of 4 Channels ES > 12.1 (Octreotide 3) 9.3e4 Area µl extraction, 5 µl injection µl extraction, 1 µl injection MRM of 4 Channels ES > 12.1 (Octreotide 3) 9.3e4 Area MRM of 4 Channels ES > 12.1 (Octreotide 3) 9.3e4 Area Time Figure 6. Enhanced sensitivity using the ionkey/ms System: Extraction volume comparison of octreotide (2.5 pg/ml) from human plasma. 52 Increasing Sensitivity and Minimizing Sample Volume for the Quantification of Therapeutic and Endogenous Cyclic Peptides
55 Sample preparation SPE was performed using Oasis WCX, which has both reversed-phase and ion-exchange modes of retention. The orthogonality introduced by the use of mixed-mode sorbents such as these enables greater sample cleanup, improved selectivity, and the sensitivity required for these peptides. Briefly, desmopressin, vasopressin, and octreotide were spiked at various concentrations into the plasma and mixed. These samples were then acidified with 4 H3PO4, which helped disrupt protein binding and reduce sample viscosity, improving contact time with the sorbent. Samples were loaded to the SPE device, and washed with 5 NH4OH followed by 1 acetonitrile. The optimum elution solution was 5 organic, 25 water, with 2 formic acid. The 96-well Oasis μelution Plate format facilitates fast sample processing (under 3 minutes), and is compatible with automation by most liquid-handling robotic systems, improving sample throughput. Additionally, this format also provides the ability to elute in very small sample volumes, minimizes the potential for adsorptive peptide losses, as well as concentrates the sample for increased sensitivity. Linearity, accuracy, and precision To generate standard curves, human plasma was fortified with desmopressin, vasopressin and octreotide at the following final concentrations: 1, 2.5, 5, 1, 25, 5, 1, 25, 5, 1, and 2 pg/ml. SPE of the fortified plasma samples was performed as described above. The calibration curves were constructed using peak areas of the calibration samples by applying a one/concentration (1/x) weighted linear regression model. Using 1 μl of plasma, calibration lines were obtained for each peptide and are shown in Figure 7, panels A, B, C. Compound name: Desmopressin Correlation coefficient: r = , r 2 = Calibration curve: * x Response type: External Std, Area Curve type: Linear, Origin: Exclude, Weighting: 1/x, Axis trans: None Residual Response pg/ml - pg/ml Compound name: Vasopressin Correlation coefficient: r = , r 2 = Calibration curve: * x Response type: External Std, Area Curve type: Linear, Origin: Exclude, Weighting: 1/x, Axis trans: None Residual Response Residual Response pg/ml Compound name: octreotide Correlation coefficient: r = , r 2 = Calibration curve: * x Response type: External Std, Area Curve type: Linear, Origin: Exclude, Weighting: 1/x, Axis trans: None A B C pg/ml pg/ml 25 - pg/ml Figure 7. Calibration lines obtained for the quantification of desmopressin (A), vasopressin (B), and octreotide (C) in extracted plasma. Increasing Sensitivity and Minimizing Sample Volume for the Quantification of Therapeutic and Endogenous Cyclic Peptides 53
56 A summary of standard curve performance is shown in is shown in Table 4. Using 1/X regressions, quantification was linear from 1 2, pg/ml with R 2 values of >.99 for all 3 peptides monitored. Representative chromatograms for extracted desmopressin, vasopressin, and octreotide plasma standard samples are shown in Figures pg/ml pg/ml pg/ml pg/ml pg/ml pg/ml Blank Human Plasma MRM of 4 Channels ES > (Desmopressin 2) 7.36e4 Area MRM of 4 Channels ES > (Desmopressin 2) 5.14e4 Area MRM of 4 Channels ES > (Desmopressin 2) 3.9e4 Area MRM of 4 Channels ES > (Desmopressin 2) 1.12e4 Area MRM of 4 Channels ES > (Desmopressin 2) 4.96e3 Area MRM of 4 Channels ES > (Desmopressin 2) 5.23e3 Area MRM of 4 Channels ES > (Desmopressin 2) 4.77e3 Area Time Figure 8. Representative chromatograms from desmopressin extracted from plasma at 1, 2.5, 5, 1, 25, and 5 pg/ml, compared to blank plasma. 1 5 pg/ml MRM of 4 Channels ES > (Vasopressin 2) 6.47e4 Area 1 25 pg/ml MRM of 4 Channels ES > (Vasopressin 2) 3.87e4 Area 1 1 pg/ml MRM of 4 Channels ES > (Vasopressin 2) 1.55e4 Area 1 5 pg/ml MRM of 4 Channels ES > (Vasopressin 2) 7.28e3 Area pg/ml MRM of 4 Channels ES > (Vasopressin 2) 4.78e3 Area pg/ml MRM of 4 Channels ES > (Vasopressin 2) 3.63e3 Area MRM of 4 Channels ES > (Vasopressin 2) Blank Human Plasma 4.58e3 12 Area Time Figure 9. Representative chromatograms from vasopressin extracted from plasma at 1, 2.5, 5, 1, 25, and 5 pg/ml, compared to blank plasma. 54 Increasing Sensitivity and Minimizing Sample Volume for the Quantification of Therapeutic and Endogenous Cyclic Peptides
57 1 5 pg/ml MRM of 4 Channels ES+ 51.3>12.1 (Octreotide 3) 7.58e5 Area pg/ml MRM of 4 Channels ES+ 51.3>12.1 (Octreotide 3) 4.59e5 Area pg/ml 5163 MRM of 4 Channels ES+ 51.3>12.1 (Octreotide 3) 1.72e5 Area pg/ml 2679 MRM of 4 Channels ES+ 51.3>12.1 (Octreotide 3) 1.1e5 Area pg/ml 1377 MRM of 4 Channels ES+ 51.3>12.1 (Octreotide 3) 7.34e4 Area pg/ml MRM of 4 Channels ES+ 51.3>12.1 (Octreotide 3) 5.93e4 Area Blank Human Plasma MRM of 4 Channels ES+ 51.3>12.1 (Octreotide 3) 1.68e4 Time Figure 1. Representative chromatograms from octreotide extracted from plasma at 1, 2.5, 5, 1, 25, and 5 pg/ml, compared to blank plasma. Table 4. Summary of standard curve performance. Desmopressin plasma concentration (pg/ml) Area Calculated desmopressin concentration (pg/ml) Mean accuracy Vasopressin plasma concentration (pg/ml) Area Calculated vasopressin concentration (pg/ml) Mean accuracy Octreotide plasma concentration (pg/ml) Area Calculated octreotide concentration (pg/ml) Mean accuracy Increasing Sensitivity and Minimizing Sample Volume for the Quantification of Therapeutic and Endogenous Cyclic Peptides 55
58 CONCLUSIONS The combination of the ionkey/ms System and mixed-mode µelution SPE provided enhanced selectivity and increased sensitivity, whilst simultaneously significantly reducing sample volume requirements. Use of µelution format SPE eliminated the need for evaporation, reducing peptide losses due to adsorption and non-specific binding. The 15 µm ikey Separation Device enabled the development of a highly sensitive, low flow quantitative MRM method that simultaneously detects vasopressin, desmopressin, and octreotide with LOD <1pg/mL, and dynamic ranges from 1 2, pg/ml. The current analysis uses 1 µl of plasma and provides a significant improvement in sensitivity and S:N over analytical scale (2.1 mm I.D.) analysis. Furthermore, detection limits of 2.5 pg/ml are achievable from only 25 µl of plasma. In addition, the ionkey/ms System reduces solvent and sample consumption, thereby reducing cost and allowing for multiple injections of samples for improved accuracy or to meet the guidelines for incurred sample reanalysis (ISR). References 1. Ewles M, Goodwin L, Bioanalytical approaches to analyzing peptides and proteins by LC-MS/MS. Bioanalysis (211) 3(12), Jiang Y, Wang J, Wang Y, Du X, Zhang Y, Fawcett JP, Gu J, Determination of long-acting release octreotide, an octapeptide analogue of somatostation, in human plasma by liquid chromatography/tandem mass spectrometry. Rapid Commun. Mass Spectrom. 27; 21: Sidibé J, Varesio E, Hopfgartner G, Quantification of ghrelin and des-acyl ghrelin in human plasma by using cubicselected reaction-monitoring LCMS. Bioanalysis May 214, Vol. 6, No. 1, Pages Kim MK, Lee TH, Suh JH, Eom HY, Min JW, Yeom H, Kim U, Jung HJ, Cha KH, Choi YS, Youm JR, Han SB, Development and validation of a liquid chromatography-tandem mass spectrometry method for the determination of goserelin in rabbit plasma. Journal of Chromatography B, 878 (21) Neudert, L, Zaugg M, Wood S, Struwe P, High Sensitivity Dual Solid Phase Extraction LC-MS/MS Assay for the Determination of the Therapeutic Peptide Desmopressin in Human Plasma. Celerion ehistory, accessed July 6, 214, 211/9/A-High-Sensitivity-Dual-Solid-Phase-Extract-LC- MSMS-Assay-for-the-Determination-of-the-Therapeutic- Peptide-Desmopressin-in-Human-Plasma_211.pdf 6. Morin LP, Landry F, Mess JN, Jonakin K, Aiello M, Misonne X, Gary Impey, Cardenas J and Garofolo F, Challenge in Trying to Reach Femtogram per Milliliter (fg/ml) Sensitivity in Plasma for the Quantification of a Cyclic Peptide: Desmopressin. Poster session presented at: 61 st Annual Conference of the American Society for Mass Spectrometry; 213 June 9 13; Minneapolis, MN. 7. JHP (21) Vasopressin Injection United States drug package insert products/pi/115213/jhp-pharmaceuticals- Pitressin pdf 8. Ferring (28) Desmopressin United States drug package insert. CommitteesMeetingMaterials/PediatricAdvisoryCommittee/ UCM2159.pdf 9. Novartis (1988) Octreotide United States drug package insert us.novartis.com/product/pi/pdf/sandostatin_lar.pdf Waters, The Science of What s Possible, ACQUITY UPLC, Xevo, Oasis, MassLynx, Symmetry, and UPLC are registered trademarks of Waters Corporation. μelution, ionkey/ms, ionkey, ikey, and TargetLynx are trademarks of Waters Corporation. All other trademarks are the property of their respective owners Waters Corporation. Produced in the U.S.A. January EN AG-PDF Waters Corporation 34 Maple Street Milford, MA 1757 U.S.A. T: F: Increasing Sensitivity and Minimizing Sample Volume for the Quantification of Therapeutic and Endogenous Cyclic Peptides
59 Reducing Sample Volume and Increasing Sensitivity for the Quantification of Human Insulin and 5 Analogs in Human Plasma Using ionkey/ms Erin E. Chambers and Kenneth J. Fountain Waters Corporation, Milford, MA, USA APPLICATION BENEFITS High sensitivity assay with LLOQ of <25 5 pg/ml in human plasma Reduced solvent consumption (5X) compared to 2.1 mm scale = significant cost savings Use of mixed-mode SPE reduces matrix interferences and enhances selectivity of the extraction for insulins in plasma 96-well μelution plate format enables concentration of the sample while maintaining solubility and minimizes peptide losses due to adsorption Selective, fast SPE extraction (<3 minutes) without time-consuming immuno-affinity purification Versus 2.1 mm scale, proof of concept studies yield greater signal-to-noise from 2.5X less sample and 1/3 injection volume, allowing for greater confidence in results, more tests per sample, and more injections INTRODUCTION Recombinant human insulin and its analogs (Figure 1) are perhaps the best known and most widely sold biotherapeutics. Historically, such biologics have been quantified using ligand binding assays (LBAs). However, specifically in the case of insulin and analogs, these affinity-based assays lack standardization, are subject to matrix effects, and in some cases lack adequate specificity. Furthermore, multiplexing is desirable as diabetes treatment typically consists of combination dosing with both long and fast acting versions. LBAs do not allow for simultaneous quantification of human insulin and its important analogs. In spite of these short comings, LBAs are incredibly sensitive and consume only minimal sample. Over the past few years, there has been a trend toward the analysis of large molecules by LC-MS/MS. LC-MS/MS has the advantage of shorter development times, greater accuracy and precision, the ability to multiplex, and can readily distinguish between closely related analogues, metabolites, or endogenous interferences. However LC-MS has struggled to achieve the sensitivity of LBAs and often requires significantly more sample. The need for robust and sensitive analysis of peptide species challenges both the chromatographic separation and mass spectrometry. WATERS SOLUTIONS ionkey/ms System ACQUITY UPLC M-Class ionkey Source Xevo TQ-S Mass Spectrometer ikey Separation Device Oasis MAX 96-well μelution Plate Human Insulin MW 588 Insulin glargine (Lantus ) Avg MW 663 Insulin A Chain Insulin A Chain Insulin B Chain Insulin A Chain Insulin B Chain Insulin A Chain Humalog (insulin lispro) Insulin aspart (Novalog ) Avg MW 5826 Waters Collection Plate MassLynx 4.1 Software TargetLynx Software Insulin detemir (Levemir ) Avg MW 5917 Insulin A Chain Insulin B Chain Insulin B Chain Insulin A Chain Insulin glulisine (Apidra ) Avg MW 5823 KEY WORDS bioanalysis, Oasis, sample preparation, peptide quantification, insulin, UPLC, 2D Technology, plasma, ionkey, ionkey/ms, ikey, M-Class, lispro, glargine, detemir, aspart, glulisine Insulin B Chain Insulin B Chain Figure 1. Structures for human insulin and analogs quantified in this application. 57
60 E X P E R IM E N TA L Sample prepration Samples were pretreated using protein precipitation (PPT) and extracted on an Oasis MAX 96-well μelution Plate according to a previously published method. [1] For this work, either 1 or 5 µl of human plasma were extracted. Method conditions Collection plates: Waters 1 ml Collection Plates UPLC conditions LC system: ACQUITY UPLC M-Class, configured with optional trap and back flush elution Separation device: ikey Peptide BEH C18, 13Å, 1.7 µm, 15 µm x 1 mm (p/n ) Trap column: Symmetry C 18 NanoEase Column, 3Å, 5 µm, 3 µm x 5 mm (p/n ) Mobile phase A:.1 formic acid in water Mobile phase B:.1 formic acid in acetonitrile Loading solvent: 85:15 mobile phase A:B, 25 µl/min for first two minutes, reverse valve Valve position: Initial position one (forward loading of trap), switch to position two at two minutes (back flush elute of trap onto the analytical column) MS conditions MS system: ionkey/ms Ionization mode: ESI positive Capillary voltage: 3.6 kv Source temp.: 12 C Cone gas flow: 5 L/hr Collision cell pressure: 3.83 X 1 (-3) mbar Collision energy: Optimized by component, see Table 1 Cone voltage: Optimized by component, see Table 1 Data management Chromatography software: MassLynx 4.1 Quantification software: TargetLynx Gradient: Elution flow rate: B over 5 minutes 2.5 µl/min ikey temp.: 75 C Sample temp.: 15 C Final injection volume: 1 µl Total run time: 13.5 minutes 58 Reducing Sample Volume and Increasing Sensitivity for the Quantification of Human Insulin and 5 Analogs in Human Plasma Using ionkey/ms

61 In an earlier publication, 1 we described an ultra-high sensitivity quantitative assay for human insulin and 5 analogs. The method was carefully optimized to maximize sensitivity for the insulins in the following manner: a multi-dimensional LC system was used to enable at-column-dilution and a trap/back elute strategy to increase loading volume and then refocus the analyte band. Mixed-mode SPE and a high-efficiency chromatographic system using a solid-core column with a positively-charged particle surface improved specificity and facilitated the differentiation of human insulin and insulin LisPro. In this earlier method, 25 µl of human plasma were extracted to reach detection limits between 5 and 2 pg/ml with a 3 µl injection volume. Many of the insulins described in the earlier method have either recently come off patent or are due to shortly. This has resulted in a flurry of research activity aimed at alternate dosing regimes, pediatric extensions, and the development of replacement insulins. In many of these cases, a further decrease in detection limit and reduction in sample volume required were requested. In this current work, we undertook to a) transfer the original analytical scale method to the ionkey/ms System, and b) to decrease sample volume and further increase sensitivity through the inherent characteristics of the ionkey/ms System. The ionkey/ms System integrates UPLC analytical separation directly into the source of the mass spectrometer. The ikey Separation Device (15 µm internal diameter), shown in Figure 2, contains the fluidic channel, electronics, ESI interface, heater, ecord, and the chemistry to perform UPLC separations. Perhaps most importantly, The ionkey/ms System can provide increased sensitivity compared to 2.1 mm chromatography with the same injection volume, or equivalent or greater sensitivity with reduced sample consumption, making it ideal for insulin analyses. As previously mentioned, it is common for bioanalytical LC-MS assays to consume high volumes of both solvent and sample, thus increasing the cost of the assay and limiting the number of replicates that can be analyzed. This study combines µelution solid-phase extraction (SPE) and the novel and highly efficient ionkey/ms System to improve a quantitative assay for insulins in human plasma. Figure 2. ikey Separation Device. Reducing Sample Volume and Increasing Sensitivity for the Quantification of Human Insulin and 5 Analogs in Human Plasma Using ionkey/ms 59
62 We investigated the potential for increasing sensitivity whilst simultaneously reducing sample volume using the ionkey/ms System. This study demonstrates a cumulative ~15X benefit over a 2.1 mm I.D. scale method for all 6 insulins studied. We were able to reduce sample size by 2.5X, reduce injection volume 3X, and increase sensitivity by a minimum of 2X through effective adaptation of the method to the ionkey/ms System. Specifically, sample volume was decreased to 1 µl and an LLOQ of 25 pg/ml was achieved for most insulins. A human plasma starting volume of 5 µl yielded a 5 pg/ml LLOQ. RESULTS AND DISCUSSION Mass Spectrometry A stock solution of all insulins was infused via an infusion ikey Separation Device to confirm mass spectrometry conditions previously described for an analytical scale method. 1 Methods in the literature have demonstrated that it is possible to see a shift in relative abundance of multiply-charged peptide precursors at different flow rates. 2 It becomes important, therefore, to evaluate this when adapting a method from analytical LC flow to microflow. In this instance, MS conditions remained the same and are summarized in Table 1. Specific insulin MRM transition Cone voltage (V) Collision energy (ev) Glargine Lispro Detemir Aspart Glulisine Bovine (IS) Human insulin Table 1. MRM transitions and MS conditions for human insulin, 5 insulin analogs, and the internal standard bovine insulin; transitions highlighted in blue are the primary quantitative MRMs. 6 Reducing Sample Volume and Increasing Sensitivity for the Quantification of Human Insulin and 5 Analogs in Human Plasma Using ionkey/ms
63 Chromatography Chromatographic separation of human insulin, 5 key analogs, and the IS was achieved using a novel microfluidic chromatographic ikey Separation Device (shown in Figure 2). The ikey Separation Device has a channel with UPLC grade sub-2-µm particles that permits operation at high pressure and results in highly efficient LC separations. By integrating microscale LC components into a single platform design, problems associated with capillary connections, including manual variability, leaks, and excessive dead volume are avoided. Insulin peak widths are 3 to 4.2 seconds wide at base, as shown in chromatograms from extracted human plasma, Figure 3. Interestingly, at analytical scale human insulin and insulin lispro completely co-elute. Normally, one would expect to have to resort to nano-flow, very shallow gradients, and unduly long run times to affect separation. However, the two peaks begin to separate under the microflow conditions shown here, within a run time that is compatible with routine bioanalytical assays. 1 Insulin detemir (Levemir) 6.76;32169 MRM of 9 Channels ES >454.2 (Levemir) 5.94e5 Area ; Insulin glulisine (Apidra) MRM of 9 Channels ES >137.1 (Apidra) 4.5e6 Area ;6253 Insulin Lispro (Humalog) MRM of 9 Channels ES >217 (Humalog) 1.3e6 Area ;33694 Human Insulin MRM of 9 Channels ES+ 1162>226.3 (Human Insulin) 6.55e5 Area ;59881 Insulin glargine (Lantus) MRM of 9 Channels ES > (Lantus) 1.28e6 Area ;9316 Insulin aspart (Novolog) MRM of 9 Channels ES >66.9 (Novolog) 1.96e5 Area Time Figure 3. Representative chromatograms of human insulin and analogs extracted from 1 µl human plasma. Reducing Sample Volume and Increasing Sensitivity for the Quantification of Human Insulin and 5 Analogs in Human Plasma Using ionkey/ms 61

64 The separation was performed using the optional Trap Valve Manager (TVM) configured for single-pump trapping in trap and back elute mode, Figure 4. This configuration facilitates the injection of larger volumes of plasma extracts to improve sensitivity. In this application, the injection volume is 1 µl, which, if properly scaled to a 2.1 mm I.D. column, would equate to approximately a 2 ml injection. Even at analytical scale, this would normally require some type of trapping to focus the analyte band. Furthermore, the final injection solvent (after SPE of the plasma and dilution of the eluate with water) is 3 methanol and 5 acetic acid. This composition is necessary in order to keep the insulins soluble throughout the chromatographic process. Direct injection without the TVM would result in severe breakthrough due to the organic content which cannot be reduced further without resulting in adsorptive losses and poor solubility. The composition of the injection solvent also plays a key role in eliminating non-column related carry-over. Representative chromatograms of human insulin and analogs extracted from 1 µl human plasma are shown in Figure 3. Figure 4. Configuration for single pump trapping on the ionkey/ms System. Linearity and sensitivity To demonstrate proof of principle, standard curve points were prepared by fortifying human plasma with human insulin and the 5 analogs at the following final concentrations: 25, 5, 1, 2, 5, 1,, 2,, 5,, and 1, pg/ml. Quality control (QC) samples were prepared separately at 15, 75, 2,5, and 7,5 pg/ml. Bovine insulin was used as the internal standard (IS). Peak area ratios (PARs) of the analyte to the IS peak were calculated. The calibration curve was constructed using PARs of the calibration samples by applying a one/concentration (1/x) weighted linear regression model. All QC sample concentrations were then calculated from their PARS against the calibration curve. For human insulin, the standard addition method was used for quantification. Basal insulin level was determined by calculating the x intercept from the slope of the calibration line. Using 1/x regression, standard curves for all insulins were linear, with all R 2 values greater than.99. Representative standard curves are shown in Figure 5. A summary of standard curve performance for all insulins (25 1, pg/ml) is shown in Table Reducing Sample Volume and Increasing Sensitivity for the Quantification of Human Insulin and 5 Analogs in Human Plasma Using ionkey/ms
65 Compound name: Humalog Correlation coefficient: r= , r 2 = Calibration curve: * x Response type: Internal Std (Ref 2), Area * (IS Conc./IS Area) Curve type: Linear, Origin: Exclude, Weighting: 1/x, Axis trans: None Compound name: Novolog Correlation coefficient: r= , r 2 = Calibration curve: e-5 * x Response type: Internal Std (Ref 2), Area * (IS Conc./IS Area) Curve type: Linear, Origin: Exclude, Weighting: 1/x, Axis trans: None Residual. -1. Conc Residual Conc Response Conc Response Conc Compound name: Apidra Correlation coefficient: r= , r 2 = Calibration curve:.8518 * x Response type: Internal Std (Ref 2), Area * (IS Conc./IS Area) Curve type: Linear, Origin: Exclude, Weighting: 1/x, Axis trans: None Compound name: Levemir Correlation coefficient: r=.99645, r 2 = Calibration curve: * x Response type: Internal Std (Ref 2), Area * (IS Conc./IS Area) Curve type: Linear, Origin: Exclude, Weighting: 1/x 2, Axis trans: None Residual. -1. Conc Residual -1 Conc Response Conc Response Conc Compound name: Human Insulin Correlation coefficient: r= , r 2 = Calibration curve: * x Response type: Internal Std (Ref 2), Area * (IS Conc./IS Area) Curve type: Linear, Origin: Exclude, Weighting: 1/x, Axis trans: None Compound name: Lantus Correlation coefficient: r = , r 2 = Calibration curve: * x Response type: Internal Std (Ref 2), Area * (IS Conc./IS Area) Curve type: Linear, Origin: Exclude, Weighting: 1/x, Axis trans: None Residual Conc Residual Conc Response Conc Response Conc Figure 5. Representative standard curves for human insulin and analogs. Reducing Sample Volume and Increasing Sensitivity for the Quantification of Human Insulin and 5 Analogs in Human Plasma Using ionkey/ms 63
66 Figure 6 and Figure 7 contain representative chromatograms for insulin glargine and insulin glulisine (respectively) at 25, 5, and 1 pg/ml extracted from 1 µl human plasma, as compared to blank extracted plasma. All QC samples demonstrated very good accuracy and precision, with mean accuracies ranging from and mean CV s of A summary of QC statistics is shown in Table 3. These results easily meet the recommended FDA acceptance criteria outlined in the white papers describing best practices in bioanalytical method validation for LC-MS/MS assays. 3,4 1 2 pg/ml Lantus 4.75;2245 MRM of 5 Channels ES > (Lantus) 6.2e4 Area pg/ml Lantus 4.75;1218 MRM of 5 Channels ES > (Lantus) 3.34e4 Area pg/ml Lantus MRM of 5 Channels ES > (Lantus) 2.91e4 Area ~41 amol on column at LOD Blank extracted plasma MRM of 5 Channels ES > (Lantus) 2.75e4 Area Time Figure 6. The ionkey/ms System s analysis of insulin glargine (Lantus) from 1 µl human plasma sample, 1 µl injection. 1 µl plasma, 1 µl injected 4.96; pg/ml Apidra MRM of 9 Channels ES >137.1 (Apidra) 6.32e4 Area pg/ml Apidra 4.97;1477 MRM of 9 Channels ES >137.1 (Apidra) 3.14e4 Area pg/ml Apidra MRM of 9 Channels ES >137.1 (Apidra) 2.47e4 Area ~41 amol on column at LOD Blank human plasma MRM of 9 Channels ES >137.1 (Apidra) 1.92e4 Time Figure 7. The ionkey/ms System s analysis of insulin glulisine (Apidra) from 1 µl human plasma sample, 1 µl injection. 64 Reducing Sample Volume and Increasing Sensitivity for the Quantification of Human Insulin and 5 Analogs in Human Plasma Using ionkey/ms
67 Insulin variant Std curve range (pg/ml) R 2 Avg accuracy Avg. CV Human 25 1, Glargine 25 1, Aspart 25 1, Glulisine 25 1, Detemir 5 1, Lispro 25 1, Table 2. Summary statistics for standard curve performance in a proof of principle study for human insulin and 5 analogs. Insulin Variant Avg accuracy QC 1 (15 pg/ml) Avg accuracy QC 2 (75 pg/ml) Avg accuracy QC 3 (2,5 pg/ml) Avg accuracy QC 4 (7,5 pg/ml) Human Glargine Aspart Glulisine Detemir Lispro Table 3. Summary QC statistics for human insulin and 5 analogs, extracted from human plasma. When comparing sensitivity, the current ionkey/ms System method provides a cumulative benefit of approximately 15X over earlier work 1 from our labs. The ionkey/ms System used 2.5X less sample, injects 3X less, and achieves at least a 2X improvement in detection limit. While the original method had an LOD of ~618 amol on column, the ionkey/ms System has an LLOQ of only 41 amol on column (Figures 6 and 7). If a further reduction in sample volume is desired, comparable performance (with a slightly higher LLOQ) can be achieved extracting only 5 µl of human plasma. Chromatograms of insulin glargine and insulin glulisine are used as representatives and are shown in Figures 8 and 9. Reducing Sample Volume and Increasing Sensitivity for the Quantification of Human Insulin and 5 Analogs in Human Plasma Using ionkey/ms 65
68 1 1 pg/ml Lantus MRM of 9 Channels ES > (Lantus) 2.49e4 Area 1 1 pg/ml Apidra 4.97;1665 MRM of 9 Channels ES > (Apidra) 3.55e4 Area pg/ml Lantus MRM of 9 Channels ES > (Lantus) 2.8e4 Area 1 5 pg/ml Apidra MRM of 9 Channels ES > (Apidra) 2.95e4 Area Blank extracted plasma MRM of 9 Channels ES > (Lantus) 2.27e4 Area 1 Blank human plasma MRM of 9 Channels ES > (Apidra) 2.59e Time Time Figure 8. The ionkey/ms System s analysis of insulin glargine (Lantus) from 5 µl human plasma sample, 1 µl injection. Figure 9. The ionkey/ms System s analysis of insulin glulisine (Apidra) from 5 µl human plasma sample, 1 µl injection. CONCLUSIONS The use of the ionkey/ms System facilitated a reduction in sample volume and concomitant, increase in sensitivity for the quantification of human insulin, and 5 important analogs. Extraction of 1 µl human plasma yields an LLOQ of 25 pg/ml for insulin glargine, lispro, glulisine, aspart, and endogenous insulin, with a 1 μl injection. Extraction of 5 μl of human plasma yields quantification limits of 5 pg/ml for most insulins. Standard curves were accurate and precise from 25 1, pg/ml. QC samples at all levels easily met recommended FDA regulatory criteria with mean accuracies ranging from and mean CVs of , indicating an accurate, precise, and reproducible method. The ionkey/ms System provided a cumulative 15X benefit over an existing analytical scale method by reducing sample required by 2.5 to 5X, reducing injection volume 3X, all whilst increasing sensitivity >2X. In addition, the ionkey/ms System also reduces solvent consumption by approximately 6X, thereby reducing cost. The reduction in sample volume required for this analysis allows for multiple injections of samples for improved accuracy, more tests per sample, or to meet the guidelines for ISR. This method shows great promise for high sensitivity quantification of intact insulins in patient samples from PK studies using the ionkey/ms System if further validation was performed. References 1. Chambers, E.E., et al., Multidimensional LC-MS/MS Enables Simultaneous Quantification of Intact Human Insulin and 5 Recombinant Analogs in Human Plasma. Analytical Chemistry, (1): p Chambers, E.E., et al., Development of a fast method for direct analysis of intact synthetic insulins in human plasma: the large peptide challenge. Bioanalysis, (1): p Guidance for Industry Bioanalytical Method Validation, C. FDA, CVM, Editor 21: Rockville, MD. 4. Bansal, S. and DeStafano, A. Key elements of bioanalytical method validation for small molecules. The AAPS Journal, 27. 9(1): p. E19 E114. Waters, The Science of What s Possible, UPLC, ACQUITY UPLC, Xevo, Oasis, and MassLynx are registered trademarks of Waters Corporation. μelution, ionkey/ms, ikey, ecord, ionkey, and TargetLynx are trademarks of Waters Corporation. All other trademarks are the property of their respective owners Waters Corporation. Produced in the U.S.A January EN AG-PDF Waters Corporation 34 Maple Street Milford, MA 1757 U.S.A. T: F: Reducing Sample Volume and Increasing Sensitivity for the Quantification of Human Insulin and 5 Analogs in Human Plasma Using ionkey/ms
69 Robustness of the ionkey/ms System in the Analysis of Pharmaceutical Compounds in Biological Fluids Paul D. Rainville and Catalin Doneanu Waters Corporation, Milford, MA, USA APPLICATION BENEFITS This work illustrates the robustness of the ionkey/ms System when analyzing complex biological samples produced by common bioanalytical sample preparation techniques. INTRODUCTION The robustness and reliability of pharmacokinetic (PK) data is an essential part of bioanalysis. LC-MS is the technique of choice in quantitative bioanalysis due to the high selectivity and sensitivity the technique offers. The use of reduced-bore chromatographic column dimensions such as 18 3 µm I.D. for the analysis of biological fluids can be traced back to the late 199 s by Fraser et al. and has been shown as a means to increase assay sensitivity as well as reduce the amount of sample required to perform drug metabolism and pharmacokinetic (DMPK) analysis. 1,2 However, the implementation of these scales of chromatography require: specialized equipment, smaller tubing I.D.s, and connections-related dead volumes in order to achieve the best chromatographic performance. Plugging of the small scale chromatographic components by the relative dirtiness of biological samples can be a major concern when implementing this scale of chromatography. In this work, we present the robustness in the utilization of the novel ionkey/ms System for analysis of plasma samples prepared by crude protein precipitation (PPT), liquid-liquid extraction (LLE), and by immunoaffinity isolation followed by trypsin digestion (IA/TD). WATERS SOLUTIONS ionkey/ms System ACQUITY UPLC M-Class System ionkey Source Xevo TQ-S ikey Separation Device MassLynx 4.1 Software KEY WORDS TQ-S, ikey, ionkey, Bioanalysis, robustness 67
70 E X P E R IM E N TA L UPLC conditions LC system: ACQUITY UPLC M-Class Separation device: ikey Peptide BEH 13Å, ikey temp.: 4 C Sample temp.: 4 C Injection vol.: 1 µl Flow rate: Mobile phase A: Mobile phase B: Gradient (PPT): Gradient (LLE): Gradient (IA/TD): MS conditions MS system: Ionization: Acquisition mode: Capillary voltage: 1.7 µm, 15 µm x 5 mm (p/n ) 4 µl/min.1 Formic acid in water.1 Formic acid in Acetonitrile 5 B to 95 B over 5 minutes 5 B to 95 B over 5 minutes B to 3 B over 5 minutes Xevo TQ-S Positive ESI MRM 3.2 kv Cone voltage and collision energies were optimized for each compound. Data management Chromatography software: MassLynx 4.1 Sample preparation Protein precipitation (PPT) Human plasma was prepared by the addition of acetonitrile in a ratio of 2:1 (acetonitrile:plasma). The plasma sample was then vortex mixed for one minute and subsequently centrifuged at 5, relative centrifugal force (RCF) for five minutes. The supernatant was then removed, pipetted into an LC vial, and injected onto the LC-MS system. At regular intervals of fifty injections, a QC standard, consisting of dextromethorphan and propranolol, was monitored to access chromatographic performance over the test period. Liquid-liquid extraction (LLE) Human plasma was prepared by the addition of hexane in a ratio of 1:1. The plasma sample was then vortex mixed for one minute and subsequently centrifuged at 5, RCF for five minutes. The supernatant was then removed into a new vial. The sample was then dried down and reconstituted in one fifth the initial volume, and injected onto the LC-MS system. At regular intervals of twenty injections, a QC standard, consisting of dextromethorphan and propranolol, was monitored to access chromatographic performance over the test period. Immunoaffinity isolation and tryptic digestion of a monoclonal antibody (IA/TD) Samples were kindly obtained from Bristol Myers Squibb (BMS). Human plasma was spiked with a therapeutic monoclonal antibody (mab) and immunoaffinity isolation, implemented in the magnetic bead format, was used for the isolation of the mab from plasma. After denaturation, the mab was digested with trypsin. Over 1, injections of the mab digest were performed and two signature peptides were monitored in each LC-MS run to evaluate the chromatographic performance over the test period. 68 Robustness of ionkey/ms System in the Analysis of Pharmaceutical Compounds in Biological Fluids
71 RESULTS AND DISCUSSION Routine analysis within a bioanalytical laboratory usually consists of a batch of two to four 96-well sample plates that have been prepared by the bench chemist using protein precipitation, liquid-liquid extraction, or in the case of biopharmaceuticals such as monoclonal antibodies, immunoaffinity isolation followed by proteolytic digestion. Of these techniques, protein precipitation is the most commonly utilized due to the speed and relative low cost of the technique for the analysis of small molecules. 3 However this technique is also the crudest in its ability to produce clean samples for analysis. Because of this fact, robustness testing of a novel 15 µm ikey Separations Device was carried out under these conditions as they provided the most challenging of the samples preparation techniques of biological fluids. The ionkey/ms System, comprised of the Xevo TQ-S Mass Spectrometer, the ACQUITY UPLC M-Class, the ionkey Source, and the ikey Separation Device is shown in Figure 1. The ikey Separation Device consists of the ceramic-based separations device with an integrated emitter together in a single device that is placed directly into the source of the mass spectrometer. Figure 1. ionkey/ms System: comprised of the Xevo TQ-S, the ACQUITY UPLC M-Class, the ionkey Source, and the ikey Separation Device. Robustness of ionkey/ms System in the Analysis of Pharmaceutical Compounds in Biological Fluids 69
72 Figure 2 illustrates the separation of dextromethorphan and propranolol, during a generic five minute LC gradient. Here we observe a peak width at 1 height for dextromethorphan and propranolol of one second. The calculated resolution at this peak height was.8. In Figure 2 we again show the injection of the QC standard after 1, injections (5 days) of continuous 1 µl injections of the protein precipitated human plasma. It should be noted that a 1 µl injection on the 15 µm I.D. ikey Separation Device is equivalent to 2 µl on a traditional 2.1 mm I.D. analytical column. The comparison of the data shown in Figure 2 indicates that excellent peak symmetry and chromatographic resolution of.9 were maintained over the course of the testing period _WAA176_CD_1 2: MRM of 1 Channel ES > 171 (Dextromethorphan) 9.9e _WAA176_CD_1228 2: MRM of 1 Channel ES > 171 (Dextromethorphan) 6.6e Time Time Figure 2. Resolution of propranolol (1) and dextromethorphan (2) at the start and finish of 1, continuous 1 μl injections of human plasma, prepared by protein precipitation. psi First injection Last injection nbsm System Pressure Range: 2426 Figure 3. IonKey/MS System pressure traces at injection 1 and injection 1,, after continuous injections of 1 µl of protein precipitated human plasma. Time The system pressure traces from the study are shown in Figure 3. Here we observe no discernible increases in the system pressure, indicating that none of the frits, tubing or connective fittings have been blocked over the course of the study. It should again be noted that this injection volume of 1 µl is analogous to injecting roughly 2 times this volume or roughly 2 µl onto a standard 2.1 mm I.D. column. Cleanliness of the MS source is often a key parameter in the continued acquisition of quality data over the course of a study. The inherent ability in the use of smaller volumes to achieve similar sensitivity results as with standard 2.1 mm I.D. scale LC-MS equates to less contamination of the MS source from the sample. 7 Robustness of ionkey/ms System in the Analysis of Pharmaceutical Compounds in Biological Fluids
73 Figure 4 illustrates the stability of the peak area from the QC sample over a course of 1 injections of the protein precipitated human plasma sample. This data further illustrates the robustness, not only of the ikey Separations Device, integrated emitter, MS source but the entire system. The system was next challenged with human plasma samples prepared by LLE. This test utilized the same experimental conditions as with the previous example. Figure 5 shows the QC standard of propranolol and dextromethorphan at injection 1 and injection 1 and illustrates that both the chromatographic peak shape and the resolution where maintained over the course of the study, much in the same manner as with the previous example. It should be further noted that again no discernible increase in system backpressure was observed. Peak Area Peak Area RSD: 5.5 No of plasma injections Figure 4. Dextromethorphan peak area counts from various test time points for the QC sample taken during the robustness testing with human plasma prepared by protein precipitation. Injection 1 Injection 1, QC Mix 1 3OCT213_9 1 MRM of 2 Channels ES > (proranolol) 2.86e5 QC Mix 1 1NOV213_4 1 MRM of 2 Channels ES > (proranolol) 2.1e Time Time Figure 5. Resolution of propranolol (1) and dextromethorphan (2) at the start and finish of 1, continuous 1 μl injections of human plasma, prepared by liquid-liquid extraction. Robustness of ionkey/ms System in the Analysis of Pharmaceutical Compounds in Biological Fluids 71
74 Due to the increase in the development of biopharmaceuticals, such as antibody therapeutics, the robustness of the ionkey/ms System was tested with a common sample preparation scheme of affinity isolation followed by digestion and subsequent analysis of peptides generated from the sample preparation. As with the previous studies chromatographic performance and system pressure where monitored. In this example, specific peptides produced by the trypsin digestion of the antibody where monitored over the course of the study. Figure 6 illustrates the peak shape at injection 1 and injection 1, for two of the signature peptides monitored during the study. The typical peptide peak widths (at 1 peak height) observed under the experimental conditions employed were 3 4 seconds. Peptide 1 First injection Injection 1 Figure 6. MRM chromatograms of two signature peptides from a therapeutic mab digested with trypsin following immunoaffinity isolation from mouse serum. As in the previous experiments, pressure traces were recorded throughout the entire study and the first and the last pressure traces are displayed in Figure 7. Last injection (no. 1,) First injection Figure 7. ionkey/ms System pressure traces recorded for the first and the last (1, th ) injection of a mab isolated by immunoaffinity from mouse serum and digested with trypsin. 72 Robustness of ionkey/ms System in the Analysis of Pharmaceutical Compounds in Biological Fluids
75 CONCLUSIONS The performance of the ionkey/ms System, using a novel 15 µm I.D. ikey Separation Device packed with 1.7 µm chromatographic particles, in the analysis of biological fluids was shown to be: Robust for over 1, injections of human plasma prepared by protein precipitation, liquid-liquid extraction, and by immunoaffinity isolation with trypsin digestion, using injection volumes of 1 µl. This volume is roughly equivalent to a 2 µl injection on a standard 2.1 mm I.D. column. Capable of maintaining excellent peak symmetry and resolution for a critical pair of small molecules over a continuous testing period of 5 days. The resolution and peak width measured at 1 peak height was.8 and 1 second, at injection 1 and injection 1, respectively. Capable of maintaining very good chromatographic performance in terms of peak shape and peak width over 1, injections of a complex mab digest sample. References 1. Fraser, I., et al., The use of capillary high performance liquid chromatography with electrospray mass spectrometry for the analysis of small volume blood samples from serially bled mice to determine the pharmacokinetics of early discovery compounds, Rapid Communications in Mass Spectrometry, 1999, 13, Dear, G., et al., Applications of capillary LC(-MS) to drug metabolism studies, LCGC Europe, 21, Wells, D.A., High throughput bioanalytical sample preparation, 23, Elsevier, St. Paul, Minnesota, USA. Waters would like to thank Eugene Ciccimaro, Bogdan Sleczka, Celia D Arienzo, and Timothy Olah from BMS for the production and use of the digested antibody samples utilized in this study. Maintaining consistent system pressure over the course of the study, indicating no accumulation of plasma components in the narrow I.D. tubing, or frits that could lead to poor chromatographic performance and system over-pressure. Waters, The Science of What s Possible, ACQUITY UPLC, Xevo, and MassLynx are registered trademarks of Waters Corporation. ionkey/ms, ionkey, and ikey are trademarks of Waters Corporation. All other trademarks are the property of their respective owners Waters Corporation. Produced in the U.S.A. February EN AG-PDF Waters Corporation 34 Maple Street Milford, MA 1757 U.S.A. T: F: Robustness of ionkey/ms System in the Analysis of Pharmaceutical Compounds in Biological Fluids 73

, better accuracy due to increased signal-to-noise ratio or smaller sample sizes.")
 a new API source where ionization is achieved through interaction of a high velocity droplet stream,")
76 Ultra high sensitivity bioanalyis by improved ionization and 2D-microUHPLC applying chip technology INTRODUCTION Arnaud Lubin 1 ; Liesbeth Vereyken 1 ; Ronald de Vries 1 ; Willy Cools 1 ; Steve Bajic 2 ; Hilary Major 2 ; Jill Lord 2 ; Isabelle Francois 3 ; Lieve Dillen 1 ; Rob Vreeken 1 ; Filip Cuyckens 1 1 Pharmacokinetics, Dynamics & Metabolism, Janssen R&D, Beerse, Belgium; 2 MS Technology Centre, Waters, Wilmslow, UK; 3 Waters, Saint-Quentin en Yvelines, France; Sensitivity is often one of the most critical parameters in quantitative analyses in drug discovery. Increased sensitivity allows new applications (e.g., microdose studies, novel biomarkers, microsampling), better accuracy due to increased signal-to-noise ratio or smaller sample sizes. Major progress has been made through boosting MS detector sensitivity, but the gain in sensitivity obtained with newer instrumentation becomes ever smaller. We evaluated two methods to improve LC/MS sensitivity for our bioanalytical assays further: (i) a new API source where ionization is achieved through interaction of a high velocity droplet stream, from a grounded probe, with a closely coupled high voltage electrode [Major et al. ASMS212] and (ii) high sample volume injections on a 2D µuplc system using chip based ionkey/ms TM technology. UNISPRAY Heartcutting 2D-LC - Ionkey MS METHODS high velocity droplet stream high voltage electrode (1 kv) Figure 1: Unispray source. Figure 2: reference compounds: MW range g/mol, log P range and pka range A mix of pharmaceutical compounds (Fig. 2) were analyzed by infusion with Unispray (Fig. 1) and ESI in positive ionization mode using a gradient from 5 to 95 organic in steps of 5 at 3 flow rates (1, 4 and 8 µl/min), 3 ph s (2.7, 7 and 9) and two organic solvents (MeOH or ACN). METHODS Sample 1 ng/ml midazolam and 1 -OH-midazolam in plasma 5 µl plasma + 1 µl DMSO + 3 µl ACN centrifuged at 6 g for 1 min Cycles 1D trap (H): 25 µl/min (C) H 2 O/ACN/IPA (4/4/2) + 1 µl/min (B) H 2 O 1D analysis (I): 5 µl/min (C) 2 95 B in 2 min A A:.1 FA in H 2 O; B: ACN 2D trap (J): + 1 µl/min (B) H 2 O 2D analysis (K): 2 µl/min (A) 5 95 in 3.4 min A: Amm. Ac. 1 mm ph5.5; B: ACN E D C B G J F H F waste I waste K L A NanoAcquity UPLC pump B NanoAcquity auxiliary pump C M-Class NanoAcquity UPLC pump D Autosampler E Trap valve manager containing valves F F 2 x 6-port valves G Vici high-pressure 6-port valve H 2.1 x 2 mm CSH phenyl (5 µm) I 1 x 5 mm CSH phenyl (1.7 µm) J 1 x 5 mm Exp Cart C4 (3 µm; Opt Techn.) K IonKey.15 x 5 mm C18 BEH (1.7 µm) L Xevo TQS mass spectrometer RESULTS max RESULTS average Q3 median Q1 A MID B MID C 1 -OH D MID min 1 -OH MID 1 -OH 25 x 1 -OH 34 x Figure 3: Intensity ratios Unispray/ESI per compound (sum of all conditions). Figure 4: Intensity ratios Unispray/ESI at different ph and solvent conditions (sum of all compounds and flow rates). Figure 5: Unispray and ESI intensities at different flow rate and gradient conditions (sum of all solvent conditions and compounds). CONCLUSIONS Unispray showed on average a 2 5 fold increase in signal intensity compared to ESI under the same conditions The relative increase in signal is higher at more polar gradient conditions and higher ph Unispray works well at normal LC flow rates (1 8 µl/min), higher flow rates result in a higher response No structure relationship (MW, logp, pka) could be inferred from the data to predict the relative sensitivity gain compared to ESI Figure 6: (A).5 µl ionkey, (B).2 µl ionkey, (C) 5 µl online SPE + 1D-LC 1 x 5 mm CSH phenyl and (D) 5 µl 2D-LC ionkey analysis of a midazolam (MID) and 1- OH-midazolam plasma sample. Figure 7: Background TIC s for the same sample analyzed by the different methods. CONCLUSIONS Heartcutting 2D-LC + ionkey results in largely improved sensitivity by combining microlc (15 µm ID column) sensitivity with injection volumes larger than typically applied for bioanalysis on 2.1 x 5 mm colums; midazolam and its 1- OH metabolite were analyzed in the same run. The heartcutting 2D-LC approach resulted in a similar background compared to a 25 fold lower direct injection of the same plasma sample The use of a trap column between the 1D and 2D separation allows the selection of orthogonal conditions in 2D independent from the 1D separation
77 Ultrasensitive Quantification Assay for Oxytocin in Human Plasma Using the ionkey/ms System Catalin E. Doneanu and Paul Rainville Waters Corporation, Milford, MA, USA APPLICATION BENEFITS Ultrasensitive quantification of a therapeutic peptide in plasma. LLOQ equivalent to ELISA assays, but the MRM method is less time-consuming to develop, more reliable, and more precise. Protein precipitation followed by SPE clean-up reduces significantly the amount of matrix in the final extract, thus providing increased assay robustness. The ionkey/ms System offers significant advantages in terms of operating costs of the assay when compared to analytical-scale chromatographic separations. WATERS SOLUTIONS ionkey/ms System ACQUITY UPLC M-Class System ikey Separation Device Xevo TQ-S Mass Spectrometer Oasis HLB 96-well Plates MassLynx 4.2 Software TargetLynx Application Manager ionkey Source RapiGest KEY WORDS Capillary-flow microfluidic system, LC-MS, LC-MRM, ESI-MS, bioanalysis, quantification, oxytocin, plasma, protein precipitation, SPE, protein binding INTRODUCTION Quantitative LC-MRM (multiple reaction monitoring) methods for small molecule drugs are used to provide bioanalytical support in various stages of drug discovery and development. These methods can routinely achieve lower limits of quantification (LLOQ) in the range of 5 to 1 pg/ml, in various biological matrices, using analytical-scale chromatography (e.g., 2.1 mm I.D. UPLC Columns). In the case of peptide therapeutics, these assays are more challenging because lower LLOQs are often required. One method that allows significant sensitivity enhancements is to operate the LC-MS system at lower LC flow rates, which provides reduced chromatographic peak volumes and increased ionization efficiency with electrospray ionization mass spectrometry (ESI-MS). However, most homemade capillary-flow LC-MS configurations suffer from a lack of robustness and are often not able to provide adequate sample throughput. The ionkey/ms System is an integrated capillary-flow microfluidic system that is designed to operate in the flow range of 1 to 5 µl/min, which can provide a 1- to 2-fold increase in sensitivity for therapeutic peptides when compared to conventional analytical-scale LC-MS platforms. Oxytocin (OT) is a mammalian, 9-amino-acid cyclic peptide (CYIQNCPLG-NH2) that acts primarily as a neurotransmitter in the brain. Quantitative measurement of endogenous OT in biological samples is very challenging, because it is present at low pg/ml concentrations in human plasma. 1 ELISA 2-3 and mass spectrometry assays 3-6 have been previously reported for measurement of endogenous OT levels. However, the LLOQ of commercial ELISA assays for OT is above the endogenous level. Several methods using mass spectrometry have been developed recently using affinity capture for OT enrichment, 3 two-dimensional (2D) LC-MS/MS using a tandem quadrupole MS in conjunction with large-volume sample extraction (1.4 ml human plasma), 4 or 2D-LC-MS/MS with large volume injection 5 to achieve the required sensitivity. Here we report an LC-MRM method developed on the ionkey/ms System that is able to detect very low levels of OT in human plasma, at an LLOQ of 1 pg/ml. 75
78 E X P E R IM E N TA L LC conditions LC system: Separation device: Mobile phase A: Mobile phase B: ACQUITY UPLC M-Class System ikey BEH C 18 Separation Device, 13Å, 1.7 µm, 15 µm x 1 mm (p/n ).1 Formic acid (FA) in water.1 Formic acid in acetonitrile (ACN) Flow rate and gradient: See Table 1 ikey temp.: 6 C Sample temp.: 1 C Injection vol.: 3 µl Total run time: MS conditions MS system: Ionization mode: ESI voltage: 8 min Xevo TQ-S with ionkey Source +ESI 3.2 kv Source temp.: 1 C Nebulizing gas pressure:.2 bar MRM transitions: See Table 2 Cone voltage: See Table 2 Collision energy: See Table 2 Data management Chromatography software: Quantification software: MassLynx Software TargetLynx Application Manager Sample preparation Oxytocin (Sigma Aldrich, St. Louis, MO, USA) was spiked in 2 µl of K2-EDTA human plasma (Bioreclamation, East Meadow, NY, USA) at the following concentrations: 1, 2, 1, 2, 1,, 1,, and 2, pg/ml. 13 C 15 N-isotopically labeled OT (CYIQNCPLG- NH2, Sigma Aldrich) was added as an internal standard (IS) at 1 pg/ml in all samples. Protein precipitation was performed after adding 2 µl of acetonitrile to achieve 1:1 sample dilution. Samples were vortexed briefly (5 1 sec), and then were spun at 4, RPM for 15 minutes (at room temperature) using a 581R centrifuge (Eppendorf, Hauppauge, NY, USA). The supernatant (2 µl) was diluted with 1.8 ml of 4 H3PO4 and sample clean-up was performed using an Oasis HLB 96-well Plate, 5 mg sorbent per well, 3 µm Particle Size (p/n 18639). The HLB extraction protocol is provided in Figure 1. After 1:1 dilution with.1 formic acid in DI water, 3 µl of sample were injected on the ionkey/ms System. Time (min) Flow rate (μl/min) Eluent A () Eluent B () Table 1. Gradient conditions for the OT assay. Oasis HLB Extraction Protocol P/N Conditioning: 5 μl CH 3 OH Equilibration: 5 μl 1 H 3 PO 4 Sample loading: 2 ml of diluted supernatant from PPT Washing step no 1: 5 μl 1 H 3 PO 4 Washing step no 2: 5 μl 5 CH 3 OH Elution: 1 x 2 μl 3 ACN,.1 FA Dilution: 1:1 with.1 FA Figure 1. Oasis HLB extraction protocol. 76 Ultrasensitive Quantification Assay for Oxytocin in Human Plasma Using the ionkey/ms System
79 RESULTS AND DISCUSSION One of the first experiments performed when developing an LC-MRM assay for a peptide therapeutic is to record a full scan ESI-MS spectrum of the analyte to establish its most abundant precursor. Figure 2A shows the ESI-MS spectrum of OT (average of 1 scans) recorded during analyte elution at a flow rate of 3 µl/min, after the injection of a standard containing 1 ng/ml OT, on the ionkey/ms System. Surprisingly, the most intense peptide precursor is the singly charged species at m/z = 17.4 and not the expected doubly protonated ion at m/z = This observation can be explained by the fact that OT contains a disulfide bond that restricts peptide protonation. In a separate LC injection, the MS/MS spectrum of OT (1 average scans) displayed in Figure 2B was produced from the same OT standard. Fragmentation of the singly charged precursor using a collision energy of 25 V produced a very abundant fragment ion at m/z = assigned to a b6 ion. The best responding MRM transition ( ) was then optimized in terms of cone voltage and collision energy. The optimized parameters for OT and its internal standard are summarized in Table 2. Peptide sequence SRM transition Dwell time (ms) Cone voltage (V) Collision energy (V) CYIQNCPLG-NH CYIQNCPLG-NH Table 2. Optimized MRM transitions _WAA176_CD_ (5.529) 1 A MS2 ES+ 1.e m/z 1 B b6 ion 723. Daughters of 17ES+ 1.22e6 C-Y-I-Q-N-C-P-L-G-NH m/z Figure 2A. ESI-MS spectrum of oxytocin (OT). Figure 2B. ESI-MS/MS spectrum of OT produced by the fragmentation of the singly charged precursor using a CE of 28 V. Ultrasensitive Quantification Assay for Oxytocin in Human Plasma Using the ionkey/ms System 77
80 The sample preparation protocol was optimized to achieve efficient removal of sample matrix. While SPE is typically used as a one-step sample clean-up in many peptide therapeutic protocols, the amount of residual sample matrix can still be significant and can cause poor chromatography and decreased assay robustness after hundreds of sample injections on capillary-scale chromatography. Protein precipitation offers an efficient way to decrease the amount of protein component matrix from plasma and it was used here in conjunction with SPE to increase method robustness. In addition, protein precipitation also provides a good opportunity to check for protein binding, as many peptide therapeutics are typical substrates for plasma proteins. Protein binding can have significant negative effects on the ability of the LC-MRM assay to quantify the therapeutic peptide. Protein binding can be disrupted by surfactants (e.g., RapiGest) or protein denaturants (e.g., guanidine hydrochloride). In the case of oxytocin, protein binding was evaluated by comparing analyte recovery after protein precipitation in the presence and absence of several protein-binding disrupting reagents. Peak areas of OT, obtained for pre-spiked and post-spiked protein precipitated plasma samples, were used to calculate the OT recovery and the results are summarized in Table 3. With the exception of RapiGest recoveries, the values presented in this table indicate high analyte recoveries (7 to 85) regardless of the precipitation protocol. Clearly, OT is not affected by protein binding and protein precipitation can be safely performed in the absence of detergents or protein denaturants. Reagent concentration OT Recovery () added to plasma Rep1 Rep2 Rep3 Rep4 Rep5 Mean RSD () No reagent RapiGest mm Guanidine HCl mm Guanidine HCl mm Guanidine HCl Table 3. OT recoveries for protein precipitated samples. RapiGest (.1) and guanidine hydrochloride (8 mm, 8 mm and.8 mm) were added in plasma before protein precipitation in order to disrupt potential binding of OT to plasma proteins. OT was spiked in 2 µl of K2-EDTA human plasma at the following concentrations: 1, 2, 1, 2, 1,, 1,, and 2, pg/ml. 13 C 15 N-isotopically labeled OT (CYIQNCPLG-NH2) was added as an IS at 1 pg/ml in all samples. Following protein precipitation, the supernatant was diluted 1-fold with 4 H3PO4 and SPE was performed on an Oasis HLB Sorbent to isolate the analyte and the IS. Extracts were diluted 1:1 with.1 FA and injected on the ionkey/ms System. 78 Ultrasensitive Quantification Assay for Oxytocin in Human Plasma Using the ionkey/ms System
81 The LLOQ of the OT assay was 1 pg/ml and the MRM chromatograms recorded at the LLOQ level are displayed in Figure 3. The chromatograms shown in Figure 3A represent three successive injections of solvent A blank (.1 FA), human plasma blank and 1 pg/ml OT spiked in human plasma. The analyte signal detected in the plasma blank was probably produced by the endogenous oxytocin present in human plasma. The OT peak area in the spiked sample is approximately twice the area of the blank signal. Replicate injections at the LLOQ level (Figure 3B) indicate good data reproducibility, with a peak area RSD of A 1 Solvent A (.1 FA) blank MRM of 2 Channels ES > (Oxytocin) 8.e3 Area MRM of 2 Channels ES > (Oxytocin) 8.e3 Area Human plasma blank pg/ml OT spiked in human plasma MRM of 2 Channels ES > (Oxytocin) 8.e3 Area Time B 1 1 pg/ml OT spiked in human plasma MRM of 2 Channels ES > (Oxytocin) 8.e3 Area Peak Area RSD: MRM of 2 Channels ES > (Oxytocin) 8.e3 Area MRM of 2 Channels ES > (Oxytocin) 8.e3 Area MRM of 2 Channels ES > (Oxytocin) 8.e3 Area MRM of 2 Channels ES > (Oxytocin) 8.e3 Area Time Figure 3A. Three successive injections of solvent A blank (.1 FA), human plasma blank, and 1 pg/ml OT spiked in human plasma. Figure 3B. Assay reproducibility. Ultrasensitive Quantification Assay for Oxytocin in Human Plasma Using the ionkey/ms System 79
82 The assay was tested for dynamic range exceeding three orders of magnitude (1 to 2, pg/ml oxytocin in human plasma) and a table containing the peak area ratios (OT area/is area) along with the corresponding RSDs is presented in Table 4. The TargetLynx calibration curve for the same concentration range is shown in Figure 4 and has very good linearity (r 2 =.998). Concentration Ratio of OT/IS peak area (pg/ml) Rep1 Rep2 Rep3 Rep4 Rep5 Mean RSD () , , , Table 4. Reproducibility of the OT assay in human plasma across the entire concentration range (1 to 2, pg/ml). Compound name: OT Correlation coefficient: r = , r 2 = Calibration curve:.64473* x Response type: Internal Std (Ref 2), Area* (IS Conc./IS Area) Curve type: Linear, Origin: Exclude, Weighting: Null, Axis trans: None 1 Response pg/ml Figure 4. Target Lynx calibration curve for OT spiked in human plasma in the range of 1 to 2, pg/ml. 8 Ultrasensitive Quantification Assay for Oxytocin in Human Plasma Using the ionkey/ms System
83 The carryover of the assay was evaluated by injecting a blank (.1 FA, solvent A) following the injection of the highest concentration spiked sample (2 ng/ml OT spiked in human plasma). According to the data displayed in Figure 5, the analyte carryover was.2 and the peak area recorded for the blank sample was approximately two-fold below the peak area at the LLOQ level. 1 2 ng/ml OT spiked in human plasma MRM of 2 Channels ES > (Oxytocin) 2.e4 Area Blank (.1 FA, Solvent A) MRM of 2 Channels ES > (Oxytocin) 2.e4 Area Carryover: Time Figure 5. Blank sample injected after the highest concentrated OT sample (2 ng/ml). Analyte carryover is very low (.2) for this assay. The quantification method developed with the ionkey/ms System is simple, specific, robust and has been implemented in a high-throughput (96-well plate) format. In addition, the ionkey/ms System offers significant advantages in terms of operating costs when compared to analytical scale LC-MRM: the cost of mobile phase solvents are typically reduced by 1-fold and sample preparation costs are typically reduced 5- to 1-fold because smaller injection volumes are required (1 to 5 µl). Ultrasensitive Quantification Assay for Oxytocin in Human Plasma Using the ionkey/ms System 81
84 CONCLUSIONS Using the ionkey/ms System, a fast, robust, ultra-sensitive LC-MRM method was developed for the quantification of oxytocin in human plasma. An LLOQ of 1 pg/ml was achieved for oxytocin. The analyte signal detected in the plasma blank was probably produced by the endogenous oxytocin present in human plasma. Linearity of the assay was maintained over three orders of magnitude (1 to 2, pg/ml oxytocin spiked in human plasma). Assay reproducibility was better than 15 at all concentrations. The carryover of the LC-MRM assay was very low (.2). References 1. Burd JM, Weightman DR, Baylis PH. J Immunoassay. 1985;6(3): Fisher LA, Fernstrom JD. Life Sci Mar 3;28(13): Cool DR, DeBroose D. J Chromatogr B. 23 Jul 25;792(2): Zhang G, Zhang Y, Fast DM, Lin Z, Steenwyk R. Anal Biochem. 211 Sep 1;416(1): Sobhi HR, Vatansever B, Wortmann A, Grouzmann E, Rochat B. J Chromatogr A. 211 Nov 25;1218(47): Mabrouk OS, Kennedy RT. J Neurosci Methods. 212 Jul 3;29(1): Waters, The Science of What s Possible, UPLC, ACQUITY UPLC, Xevo, Oasis, and MassLynx are registered trademarks of Waters Corporation. ionkey/ms, ikey, TargetLynx, and RapiGest are trademarks of Waters Corporation. All other trademarks are the property of their respective owners Waters Corporation. Produced in the U.S.A. February EN AG-PDF Waters Corporation 34 Maple Street Milford, MA 1757 U.S.A. T: F: Ultrasensitive Quantification Assay for Oxytocin in Human Plasma Using the ionkey/ms System
85 High Sensitivity Intact Mass Analysis of Antibodies (IgG1) Using ionkey/ms Gregory T. Roman, Henry Shion, James P. Murphy, and Weibin Chen Waters Corporation, Milford, MA, USA APPLICATION BENEFITS Improved sensitivity for monoclonal antibody analysis enabling 1 ng on-column detection limits. Ideal for sample limited environments, or preservation of precious samples. The rugged and easy to use ionkey/ms System greatly facilitates the utilization of micro-lc-ms for highly sensitive intact mass analysis. Integrated ESI, column, and fluidic fittings enable rapid setup and ease of operation. Significantly reduced solvent consumption over existing ACQUITY UPLC methods by at least ten fold. WATERS SOLUTIONS ionkey/ms System ikey BEH 3Å C4 Separation Device ACQUITY UPLC M-Class System Xevo G2-XS QTof Mass Spectrometer MassLynx 4.1 Software Intact mab Mass Check Standard KEY WORDS ionkey/ms, antibody, antibody drug conjugate, microfluidic, intact protein, biotherapeutic characterization INTRODUCTION LC-MS has emerged as a powerful and robust tool for the characterization of intact proteins. This approach has been widely applied to heterogeneous therapeutic monoclonal antibodies, antibody drug conjugates, bispecific mab, antibodyantigen complexes, and antibody mixtures, to name a few. The ability to also separate the proteins from impurities, small molecules, and dissociated light and heavy chains, allows for cleaner spectra with less ion adducts. It also allows for the ability to discern glycoform variants, post translational modifications, and genetic modifications, for example. The data from such experiments is a critical component to the biopharmaceutical drug development process. The ionkey/ms System offers a number of advantages for therapeutic monoclonal antibody analysis, including increased ESI efficiency leading to improved MS sensitivity, reduced sample overheads, and reduced solvent consumption for high throughput analysis. The ikey Separation Device contains the fluidic connections, electronics, ESI interface, column heater, ecord, and chemistry to perform UPLC separations in the source of the mass spectrometer. It provides ease-of-use that has historically not been present with microflow LC-MS systems. Specifically, integrated microfluidics combined with clamp-on connections allows for zero dead volume connections in seconds. Alternative chemistries and maintenance can be performed rapidly with minimal system downtime. In addition, integrated heating elements, memory, and ESI tips provide easy programming, control of LC-gradients and ESI spray in a customized environment. The ionkey/ms System consisting of the ACQUITY UPLC M-Class System, ionkey Source, and the Xevo G2-XS QTof provides high sensitivity for biotherapeutic applications. Data from this configuration can be processed in UNIFI Scientific Information System to provide an automated solution that reduces human error in data workup. Results from an intact IgG1 mab mass analysis were used to illustrate the sensitivity capabilities that can help biopharmaceutical laboratories extend precious samples, and detect low level glycoforms. 83
86 E X P E R IM E N TA L UPLC conditions LC system: ACQUITY UPLC M-Class System Separation device: ikey Protein BEH C 4 Separation Device, 3Å, 1.7 µm, 15 µm x 5 mm (p/n ) ikey temp.: 8 C Loop size: 1 µl Injection volume: Full loop mode Flow rate: 5. µl/min Mobile phase A: Water with.1 formic acid Mobile phase B: Acetonitrile with.1 formic acid Weak needle wash: Water with.1 formic acid Strong needle wash: 5 acetonitrile, 25 methanol, 25 water Seal wash: 9:1 water:acetonitrile Gradient: Time Flow A B Curve (min) (µl/min) initial initial MS conditions MS system: Xevo G2-XS QTof with ionkey/ms Ionization mode: ESI + Capillary voltage: 3.5 kv Source temp.: 15 C Cone voltage: 19 V Source offset: 15 V Cone gas: 5 L/h Nano Flow gas:.1 Bar Quad profile Auto Scan: 5 4, Da, 1 second Data format: Continuum Analyzer mode: Sensitivity RF settings: RF Amplitude: Collision 4 V Gain 1 V Sample preparation and analytical conditions A Waters glycosylated Intact mab Mass Check Standard (p/n ) was constituted in 3 acetonitrile and.1 formic acid, sonicated for 5 minutes, and vortexed prior to insertion into the sample manager at 1 C. New samples were prepared daily. RESULTS AND DISCUSSION Detection and quantification using ionkey/ms with the Xevo G2-XS QTof The Intact mab Mass Check Standard was serially diluted and injected with the on-column mass noted in Figure 1, followed by a blank. The results illustrate an integrated total ion chromatogram (TIC), and show the total charge envelope of the mab (left) and a single charge state (52+) selected from this envelope (right). Glycoform variants were clearly detected down to 1 ng (on-column) including (GF/GF, GF/G1F, G1F/G1F, G1F/G2F, and G2F/G2F). Figure 1. Overlay showing intact IgG spectra of a serially diluted Intact mab Mass Check Standard, and solvent blank. (Left) Total charge state envelope of IgG. (Right) a single charge state selected from the charge envelope. 84 High Sensitivity Intact Mass Analysis of Antibodies (IgG1) Using ionkey/ms
87 Figure 2 demonstrates a deconvoluted spectrum from both the 1 and 5 ng (on-column) loads. Deconvoluted spectrum was a result of TIC integration followed by a MaxEnt deconvoluted MS spectrum that corresponds to the summed spectra under the detected peak. The spectrum was within 2 ppm, illustrating no significant deterioration of mass accuracy at the 1 ng detection limit of the Waters mass check mab standard. Accurate mass of the glycoforms were achievable between 1 1 ng on-column. Reproducibility studies were performed over a 1 replicate injections for the Waters standard. Figure 3 demonstrates the 1 replicate for the Waters standard with 1 ng on-column loading. Glycoform variants were robustly measured over this range with good retention time reproducibility and peak height reproducibility, as shown in Figure 4. Figure 2. Deconvoluted spectra from the analysis of either 1 ng (top pane) or 5 ng (bottom pane) on-column loads, respectively. Figure 3. Peak height reproducibility and charge state spectra for 1 replicate injections of 1 ng (on-column). High Sensitivity Intact Mass Analysis of Antibodies (IgG1) Using ionkey/ms 85
88 Figure 4. Retention time reproducibility and peak height reproducibility for Intact mab Mass Check Standard. CONCLUSIONS The ionkey/ms System with the Xevo G2-XS QTof can perform rugged and easy to use microflow LC-MS analysis of monoclonal antibodies at improved sensitivity when compared to 2.1 mm I.D. columns. Integrated ikey Separation Device enables high reproducibility at the microflow-lc scale, this was demonstrated in both peak height intensity reproducibility and retention time for standard mab. Improvement in sensitivity enabling customers to further detect intact mab at 1 ng (on-column). Low flow rates of 5. µl/min allow for 1 fold savings in solvent consumption and costly hazardous waste disposal charges to improve a laboratories bottom line. Waters, The Science of What s Possible, ACQUITY UPLC, Xevo, MassLynx, UPLC, and UNIFI are registered trademarks of Waters Corporation. ionkey/ms, ikey, and ecord are trademarks of Waters Corporation. All other trademarks are the property of their respective owners. 215 Waters Corporation. Produced in the U.S.A. April EN AG-PdF Waters Corporation 34 Maple Street Milford, MA 1757 U.S.A. T: F: High Sensitivity Intact Mass Analysis of Antibodies (IgG1) Using ionkey/ms

89 CLINICAL RESEARCH


90 DEVELOPMENT OF A HIGH-SENSITIVITY MICRO LC/MS METHOD FOR ESTRADIOL QUANTIFICATION Jim Murphy and Angela Doneanu Waters Corporation, Milford MA OVERVIEW METHODS LC CONDITIONS A negative mode assay for estradiol quantification using the ionkey/ms TM system. Post-column addition of modifiers to facilitate deprotonation and enhance the ionization process. Positive-negative polarity switching allows analysis of estradiol and testosterone in a single run. INTRODUCTION Measurement of estradiol is critical in understanding human biology and health 1. However, achieving the required level of sensitivity in positive ESI-MS is challenging due to the non-polar structure and low proton affinity of estradiol. Estradiol derivatization 2 can compromised the assay specificity and the lengthy and delicate sample preparation is less suitable for large-scale studies. There are numerous applications where a basic ph is necessary to promote ionization. However, while stationary phases specifically designed for higher ph operation are available, developing a suitable LC method may be inconvenient or even impossible. Using postcolumn addition, we can adjust the ph without affecting the chromatographic separation. Estradiol is well suited for reversed phase chromatography without any mobile phase modifiers. However, its negative electrospray ionization is challenging and can be improved by addition of a suitable modifier. Since the pka value of estradiol is 1.7, adjusting the eluent ph with a volatile base to facilitate deprotonation is advantageous. The ionization process can be further improved by post-column addition of isopropanol to lower the surface tension of the LC eluent. The experiments were performed using an ionkey/ms TM system comprised of an ACQUITY UPLC M-Class system in combination with a Xevo TQ-S mass spectrometer. Preliminary trapping was achieved using a Symmetry C8, 3 µm x 5 mm trap column. The post-column addition (PCA) ikey TM contains two channels. The separation channel used was 15 µm ID and 5 cm long, packed with sub-2-µm reverse-phased HSS T3 particles. An empty channel used for modifier addition was tee in after the separation channel. The effluents from the separation channel and the post-column addition (PCA) channel are merged and collected at the inlet of the emitter. Mobile phases A: 1 Acetonitrile in water B: 1 Acetonitrile PCA: 5/5 isopropanol/2 ammonium hydroxide Trapping: 2 l/min for 2 min with 1 solvent A Gradient: Time Flow A B Flow Rate: 2 l/min; ikey Temperature: 6 o C Injection volume: 2 µl PCA flow rate: 1 l/min MS CONDITIONS Ionization mode: Polarity ESI -ve; 2.5kV ESI +ve; 3.5kV MRM Transition RESULTS Cone voltage (V) Collision Energy (ev) Estradiol - 271> Estrone - 269> Estriol - 287> Testosterone + 289> Figure 3. Quantification of various levels of estradiol by LC/MS Compound name: Estradiol Correlation coefficient: r = , r^2 = Calibration curve: * x Response type: External Std, Area Curve type: Linear, Origin: Exclude, Weighting: 1/x, Axis trans: None Response Conc Figure 4. Standard curve of estradiol. Figure 5. SRM chromatograms of Estrone (E1), Estradiol (E2) and Estriol (E3). Standard solution of 5 pg/ml each in 25 methanol. Figure 6. SRM chromatograms of estradiol (-ve mode;.5 ng/ml) and testosterone (+ve mode; 5 ng/ml). CONCLUSION Figure 1. Steroids structures. Figure 2. Post-column addition PCA ikey. The analytical channel is connected to the upper port and the postcolumn addition channel is connected to the right port. One concern over post-column addition of a modifier is the prospect of extra-column band broadening. The setup used in these experiments is design to minimize any dead volume. When compared with a regular ikey, the average peak widths at 1 for a.5 l/min post-column addition flow rate were similar: 3.96 sec (for the PCA ikey) versus 4.3 sec (for the regular ikey). (A gradient of 3.7 B/ min) In this study, we present a negative electrospray ionization method for detection and accurate quantification of estradiol that provides high reproducibility of analysis with enhanced sensitivity without the need for derivatization. The use of a 2D trap-and-elute configuration enabled the system to handle relatively large volume injections of 2 µl while maintaining excellent peak shape, further enhancing sensitivity and system flexibility. In this method, isopropanol was introduced post-column to lower the surface tension of the LC eluent and enhance the ionization process and consequently the sensitivity. The ammonium hydroxide with its high gas-phase basicity facilitates deprotonation and is also known to be effective in improving sensitivity for small molecules in negative mode LC-MS. The standard calibration curve was linear between 1 and 5 pg/ml with a R 2 value of.99. The lower limit of quantitation was < 1 pg/ml (CV =9). The same LC conditions were applied for the separation of a mixture of three estrogens: Estrone (E1), Estradiol (E2) and Estriol (E3). The selectivity of the HSS T3 material allowed an adequate resolution of the three analytes with a total run time of 12 minutes (Figure 5). The method was also successfully tested for the simultaneous analysis of estradiol and testosterone using positive/negative ion switching. A highly sensitive and robust method for low-level quantitation of underivatized Estradiol has been developed. A PCA ikey was used to assist the ionization process by post-column addition of ammonium hydroxide and isopropanol. The ammonium hydroxide facilitates deprotonation and the isopropanol lowers the surface tension of the LC eluent. The combination of these modifiers enhances the ionization process and consequently the sensitivity. References 1. Rosner, W., Hankinson, S.E., Sluss, P.M., Vesper, H.W., Wierman, M.E. J.Clin.Endocrinol Metab, April 213, 98 (4); Kushnir, MM., Rockwood, AL., Bergquist, J., et al., Clin. Chem 28; 129; TO DOWNLOAD A COPY OF THIS POSTER, VISIT Waters Corporation
91 Improving the Detection of Thyroglobulin in Human Plasma for Clinical Research by Combining SISCAPA Enrichment and Microflow LC-MS Jay S. Johnson, 1 Morteza Razavi, 2 James Murphy, 1 Selena Larkin, 2 and Paul Rainville 1 1 Waters Corporation, Milford, MA, USA; 2 SISCAPA Assay Technologies, Washington, DC, USA APPLICATION BENEFITS ionkey/ms configured for dual-pump trapping is well suited to analyze SISCAPA eluents Sub 1 ng/ml quantitation level of thyroglobulin is achieved using 1x less plasma than the comparable standard flow method Accuracy is highly correlated with the values obtained from the standard flow method but offers higher levels of precision LC over 4 replicates Dual-pump trapping significantly reduces cycle times to under 7 minutes allowing a similar number of samples to be run in the same time frame as the best in literature standard flow method Microflow is a viable and attractive solution for clinical research WATERS SOLUTIONS ACQUITY UPLC M-Class System ionkey/ms System Xevo TQ-S ikey Separation Device MassLynx Software INTRODUCTION Current research immunoassays for Tg may be subject to high false negative rates in a significant portion of the sample population due to the presence of endogenous anti-tg autoantibodies (Tg-AAbs) that block the binding epitope resulting in the reporting of a negative result in the immunoassay. The prevalence of these negative results has lead researchers to look for alternative analytical approaches that can improve the quality of the result. Stable isotope standards and capture by anti-peptide antibodies (SISCAPA) enrichment for Tg combined with standard flow LC-MS has been implemented as an alternative approach in clinical research labs. The high analytical selectivity and specificity of the capture step using anti-peptide antibodies specific for a proteolytic peptide unique to Tg greatly enhances the detection and quantitiation of Tg down to levels of approximately 1 ng/ml or 1.52 amol/µl. However, standard flow LC-MS requires 2 4 µl of plasma to reach these relevant LOQ levels, a very large volume of sample. Microflow LC-MS, exemplified by the ionkey/ms System, operating at 1 s of µl/min offers substantial analytical sensitivity benefits over standard flow using less starting plasma in sample-limited applications. 1 Accordingly, we investigate here if the ionkey/ms System operating in a dual-pump trapping configuration can provide reductions in LLOQ levels for Tg, using less plasma while maintaining the requisite accuracy, precision, and throughput exemplified by published standard flow LC-MS assays. The dual-pump trapping configuration was explicitly chosen due to the ability of the set-up to handle relatively large injection volumes compared to ikey column volume, reduce carryover coming from the sample loop and trap column, and decrease cycle time by affording load ahead capability on the trap column and independent washing and equilibration of the trap column and analytical ikey. TargetLynx Application Manager KEY WORDS Thyroglobulin, SISCAPA, UPLC, MRM, TQ-S, ionkey/ms, dual-pump trapping, health sciences, high throughput 89
92 E X P E R IM E N TA L LC conditions LC system: Analytical column: ACQUITY UPLC M-Class ikey Peptide BEH C 18 Separation Device, 13Å, 1.7 µm, 15 µm x 5 mm (p/n ) Data management Chromatography software: MassLynx v4.1 Quantification software: TargetLynx Trap column: Prototype Symmetry C 18 Microfluidic Trap Column, 1Å, 5 µm, 3 µm x 5 mm (p/n TBD) ikey temp.: 45 C Sample temp.: 12 C Injection volume: 2 µl partial loop in a 22.8 µl loop Flow rate: 3 µl/min Mobile phase A:.1 formic acid in water Mobile phase B:.1 formic acid in acetonitrile WNW:.1 formic acid in water SNW: 2 formic acid in 25/25/25/25 water/ acetonitrile/isopropanol/methanol Gradient: 9.9 B to 27.5 B in 2.2 min Trap loading: 99.5 A at 5 µl/min for.8 min Total cycle time: 6.75 min injection to injection MS conditions MS system: Xevo TQ-S operating in MRM Mode with Unit Mass Resolution Ionization mode: ESI Positive Capillary voltage: Optimized through infusion of analyte of interest Source temp.: 1 C Cone gas flow: 5 L/Hr Nano gas flow: Off Collision energy: Optimized through infusion of analyte of interest, see Table 1 Sample preparation The generic SISCAPA enrichment workflow coupled with ionkey/ms is detailed in Figure 1. The sample preparation detailed in this application note was performed by SISCAPA Assay Technologies following their recommended procedures. 1. Plasma sample is digested using trypsin Any potential auto Tg antibodies are digested along with the target, Tg, to their corresponding peptides 2. A highly selective and specific antibody against a proteotypic peptide unique to Tg with the amino acid sequence FSPDDSAGASALLR (FSP) is conjugated to a magnetic bead support 3. A stable isotope standard (SIS) of the FSP peptide and the bead-conjugated antibody is added to the plasma digest 4. The FSP peptide and SIS are selectively enriched by the anti-peptide antibody bead complex in an automated fashion in the 96-well plate format 5. The beads are then washed to remove unbound matrix material and the bound peptides are released using acid elution 6. The resulting eluent is subjected to microflow LC-MS using the conditions described below Peptide Precursor Product CE Cone voltage FSP.light FSP.heavy FSP.light FSP.heavy FSP.light FSP.heavy Cone voltage: Optimized through infusion of analyte of interest, see Table 1 Table 1. Optimized MRM transition parameters for the heavy and light versions of FSP. The qualifier MRMs are shown in bold. These parameters were optimized thru infusion using the onboard fluidics of the Xevo TQ-S and an infusion ikey. 9 Improving the Detection Limits of Thyroglobulin in Human Plasma by Combining Siscapa Enrichment and Microflow LC/MS


93 Instrumental set-up In attempts to decrease cycle time and allow more samples to be run on the ionkey/ms System, the configuration chosen was a dual-pump trapping configuration as shown in Figure 2. In dual-pump trapping a dedicated binary solvent manager plumbed with larger I.D. transfer lines handles the loading of the trap column. A second binary solvent manager is dedicated for gradient elution of the analyte of interest off of the trap column to the analytical ikey. Due to the fact that the loading pump is plumbed with larger I.D. transfer lines, this loading step can occur at a faster flow rate without reaching the pressure limit of the system. The optimized loading flow rate in this method was found to be 5 µl/min, however, flow rates of up to 7 µl/min are possible. Furthermore as we employ two dedicated pumps, the loading of the trap column by the loading pump can be overlapped with the equilibration of the analytical ikey by the gradient pump, effectively cancelling out the sample loading time from the total cycle time, resulting in considerable analytical time savings. After the set loading time, the valve is switched to the elution configuration as seen in Figure 2 and 3, and the gradient pump forms a gradient that back flushes the analyte off the trap column to the analytical ikey. During this elution step the loading pump is in line with the sample loop and can be used to flush the loop at a high flow rate with any mixture of mobile phase which should help manage carryover. Figure 1. Analytical workflow employed combining SISCAPA enrichment and microflow LC-MS using the ionkey/ms System for the sensitive detection of Tg. The dual-pump trapping configuration also allows heart cutting type experiments in which the trap is decoupled from the analytical ikey just after the last analyte of interest elutes by switching the trapping valve back into the loading configuration. Decoupling is beneficial from an analytical column and MS optics cleanliness standpoint as any later eluting matrix components such as proteins and phospholipids will be directed to waste. # Length ID Fittings Part # Order # T1 4" 4 µm V-F T2 3" 25 µm M-V T3 3" 4 µm M-V T4 31".1" PEEK T5 26" 4 µm V-V T6 6" 4 µm V-V Figure 2. The dual-pump trapping set-up contains a dedicated binary solvent manager for fast sample loading onto the loop and trap column and a dedicated gradient elution pump. In this set-up line T3 has a 4 µm I.D. which affords a loading flow rate of 5 µl/min. The gradient transfer line, T2, remains a 25 µm I.D. Improving the Detection Limits of Thyroglobulin in Human Plasma by Combining Siscapa Enrichment and Microflow LC/MS 91

94 RESULTS AND DISCUSSION The analytical sensitivity of the ionkey/ms System in the dual-pump trapping configuration, using the parameters defined previously, was first evaluated using synthetic standards of the light and heavy FSP peptides. A 6 point calibration curve was created comprising a concentration range of 2, amol/µl down to.64 amol/µl utilizing a 1 in 5 dilution with 3 acetonitrile in.1 formic acid. Each calibration point was run in triplicate and we observed an excellent linear response and reproducibility over the calibration range as detailed in Figure 4 with the 13 amol level having a coefficient of variation (CV) of approximately 16. This data reinforces the ability of the platform and method described to analyze synthetic standards of FSP. amol on Avg light Avg heavy CV column area area CV Load pump events Trap equilibration/sample loading onto loop Time (min).95 Gradient pump events Time (min) ikey equilibration 1.75 Trap loading.8 Wash loop 3.4 Gradient 2.2 Wash trap 1.6 Wash ikey 1.2 Delay volume 1.35 Housekeeping.25 Cycle time 6.75 Cycle Time 6.75 Figure 3. Schedule of events in the optimized dual-pump trapping workflow. Figure 4. Calibration curve expressed in amol on column for the analysis of the synthetic standards of both the heavy and light versions of FSP. We observed an excellent linear response and reproducibility when working with these standard variants of the peptide. 92 Improving the Detection Limits of Thyroglobulin in Human Plasma by Combining Siscapa Enrichment and Microflow LC/MS
95 Next, to demonstrate that the platform is compatible with SISCAPA eluates and can actually detect endogenous Tg in human plasma, we performed a plasma titration experiment where varying amounts of pooled human plasma were digested followed by SISCAPA enrichment of the FSP peptide. Accordingly, it is expected that the PAR value, or the ratio of the endogenous light FSP to the heavy SIS FSP added after digestion at a consistent concentration, should increase linearly when plotted against pooled human plasma amount. The results shown in Figure 5 show the expected linear response was achieved for human plasma amounts down to 4 µl, with no observed backpressure fluctuations in the analytical ikey. Accordingly, it can be concluded that the platform is compatible, robust, and analytically sensitive for endogenous FSP in human plasma enriched using the SISCAPA workflow. Furthermore, as a positive control, the experiment was replicated on an Agilent 129/649 QqQ instrument operating in the standard flow regime and utilizing the recommended method parameters for the instrument. A high linear correlation of R 2 =.998 as seen in Figure 6 was achieved between the two platforms confirming the accuracy of the PAR values as measured on the ionkey platform. Additional evidence of the agreement between the PAR values obtained on the standard flow and ionkey/ms can be visualized in the Bland- Altman plot seen in Figure 7. Agreement between all measurements is within the 95 confidence interval. Furthermore, the ionkey/ms System showed better precision across 4 replicates than the standard flow system. This suggests microflow offers tangible improvements in the precision of measurement of FSP while maintaining the accuracy expected of the conventional standard flow approach. Figure 5. A linear response was achieved for pooled human plasma amounts down to 4 µl with no observed backpressure fluctuations demonstrating the ionkey/ms platform as described is compatible, robust, and sensitive for SISCAPA eluates. Plasma (µl) ionkey/ms CV Agilent 649 CV Figure 6. The experiment above was replicated on a standard flow Agilent system as a positive control and an excellent correlation was obtained. The high correlation and better precision across 4 replicates proves that microflow offers tangible benefits in the analysis of Tg over the conventional standard flow approach. Improving the Detection Limits of Thyroglobulin in Human Plasma by Combining Siscapa Enrichment and Microflow LC/MS 93
96 To further study the analytical sensitivity of the platform in terms of LLOD and LLOQ, a reverse curve was generated by titrating the heavy FSP peptide from 5 amol/µl down to.75 amol/µl and spiking synthetic light peptide at a constant level in human plasma. The LLOD, defined in this work as the point below which the CV is consistently above 3 for FSP, was determined to be 15 amol on column. The LLOQ, defined in this work as the point below which the CV is consistently greater than 2, was 45 amol column. Representative chromatograms for the LLOD and LLOQ levels along with the reverse curve can be seen in Figure 8. The LLOQ of 45 amol is slightly higher than that estimated in the synthetic standard FSP work as one would expect due to the influence of the matrix. Figure 7. Bland-Altman Plot showing all differences between the standard flow Agilent method and the microflow method measurements of the FSP PAR value lie within the upper and lower confidence intervals. Agreement is therefore expected for 95 of the samples. Figure 8. A reverse curve was generated to determine the approximate LLOD and LLOQ of the peptide measurement. The LLOD is 15 amol FSP on column. The LLOQ is 45 amol FSP on column. 94 Improving the Detection Limits of Thyroglobulin in Human Plasma by Combining Siscapa Enrichment and Microflow LC/MS
97 A final curve was generated by titrating purified Tg protein in bovine plasma known to be deficient in Tg from 152 to.152 amol/µl followed by SISCAPA enrichment in attempts to get an estimated LLOQ value for the entire assay including the digestion step. The LLOQ of the method using only 5 µl of plasma as shown in Figure 9 is estimated to be approximately 1.18 amol/µl (.78 ng/ml). Accordingly, the method achieves quantitation levels of Tg in bovine serum of 1.52 amol/µl (1 ng/ml) with ease. Figure 9. A curve was generated by titrating purified Tg in bovine plasma from 152 to.152 amol/µl. The LLOQ of the assay including the digestion step using 5 µl of sample is estimated to be 1.2 amol/µl (.78 ng/ml). Improving the Detection Limits of Thyroglobulin in Human Plasma by Combining Siscapa Enrichment and Microflow LC/MS 95
98 CONCLUSIONS Use of an optimized SISCAPA enrichment that is highly specific for a signature peptide of Tg combined with LC/MS using a vetted dual-pump trapping ionkey/ms configuration provides a sub 1.52 amol/µl (1 ng/ml) quantification limit of Tg protein with a cycle time of 6.75 min. This quantification limit is comparable with the best in literature for standard flow. However, the ionkey/ms methodology outlined above also offers a few tangible benefits to the standard flow method including; a simplified enrichment procedure, the use of ten times less starting plasma prior to enrichment, an injection volume that is two times smaller, and significantly less solvent consumption. Additionally, evidence is provided in a head-to-head comparison with standard flow in which the microflow approach offers highly correlated PAR measurements while being significantly more precise across 4 replicate measures. Furthermore, the cycle time on the microflow system is only.25 min longer than the standard flow method outlined in the literature allowing a similar number of samples to be run in the same time frame but with higher analytical sensitivity and lower sample volumes. References 1. Lame, M.E., Chambers, E.E., Improving a High Sensitivity Assay for the Quantification of Teriparatide in Human Plasma Using the ionkey/ms System, Library Number APNT , PN EN. We therefore conclude that the ionkey/ms System operating in the dual-pump trapping configuration does provide acceptable LLOQ levels for Tg using significantly less plasma while maintaining the requisite accuracy, better precision, and throughput levels exemplified by standard flow LC-MS methods. Accordingly, microflow is a viable and attractive solution for clinical research. For Research Use Only. Not for Use in Diagnostic Procedures. Waters, The Science of What s Possible, ACQUITY UPLC, Xevo, Symmetry, and MassLynx are registered trademarks of Waters Corporation. ionkey/ms, ikey, and TargetLynx are trademarks of Waters Corporation. All other trademarks are the property of their respective owners. 215 Waters Corporation. Produced in the U.S.A. October EN AG-PDF Waters Corporation 34 Maple Street Milford, MA 1757 U.S.A. T: F: Improving the Detection Limits of Thyroglobulin in Human Plasma by Combining Siscapa Enrichment and Microflow LC/MS
99 Multiplexed Analysis of Steroid Hormones Using ionkey/ms Carolyn Broccardo, 1 James P. Murphy, 2 Giuseppe Astarita, 2 and Jessica Prenni 1 1 Colorado State University, Fort Collins, CO, USA 2 Waters Corporation, Milford, MA, USA APPLICATION BENEFITS A highly analytically sensitive multiplexed assay was developed for targeted quantitation of five steroids in human serum. The use of the ionkey source and the 15 µm ikey Separation Device yielded a 1 4 fold increase in on-column sensitivity while at the same time decreasing solvent usage by 15 fold as compared to standard flow methods. The increased on-column analytical sensitivity allowed for simplification of the steroid extraction procedure which in turn streamlined the sample preparation and reduced per/sample assay cost. INTRODUCTION The measurement of steroids in human serum is an important clinical research tool. Traditionally, these assays are performed using a variety of biochemical techniques including radioimmunoassay (RIA), enzyme-linked immunosorbent assay (ELISA), and chemiluminescent immunoassay (CLIA). However, immunoassays suffer from antibody cross-reactivity with structural isomers which has been shown to result in an overestimation of steroid levels. Recently, LC-MS/MS has emerged as a viable alternative for this important assay in the clinical research setting. While providing improved accuracy as compared to antibody based techniques, standard flow LC-MS/MS assays also consume high levels of solvent and often require time-consuming sample extraction procedures such as liquid-liquid or solid phase extraction to adequate analytical sensitivity. In this application, we report the use of the newly developed 15 µm ionkey/ms System for the multiplexed quantitation of five important steroid compounds in human serum: testosterone, dihydrotestosterone, progesterone, cortisone, and cortisol. The reduced flow method results in a 15 fold decrease in solvent consumption and a 1 4 fold increase in on-column analytical sensitivity. 1 WATERS SOLUTIONS ionkey/ms System nanoacquity UPLC ionkey Source Xevo TQ-S Mass Spectrometer ikey Separation Device BEH C18 MassLynx 4.1 Software KEY WORDS Xevo, TQ-S, ikey, ionkey/ms, multiplexed 97
100 E X P E R IM E N TA L Method conditions LC conditions LC system: Sample loop: 5 µl Separation device: ikey temp.: 45 C Flow rate: Mobile phase A: Mobile phase B: Volume injected: Gradient: nanoacquity UPLC ikey BEH C18, Separation Device 13Å, 1.7 µm, 15 µm x 5 mm (p/n ) 3.6 µl/min Water +.1formic acid Methanol +.1 formic acid.5 µl using partial loop mode Time (min) A B Curve Initial Initial MS conditions Mass spectrometer: Acquisition mode: Ionization mode: Capillary voltage: Xevo TQ-S MRM ESI positive 3.2 kv Source temp.: 1 C Source offset: Collision gas: Dwell times for all compounds: 5 V argon.11 s Sample preparation Serum samples were precipitated with 3.7 volumes of ice cold methanol containing stable isotope-labeled internal standards for each steroid at a level of 1 ng/ml. Samples were incubated at -8 C for 3 minutes, centrifuged at 327 x g for 1 minutes and supernatant was collected. All sample preparation and injections were conducted in 96-well plates..5 µl of extracted serum was injected and separation was performed using a nanoacquity UPLC connected to an ionkey source using a 15 µm ikey packed with BEH C18 (1.7 µm particles). The column effluent was monitored using a Xevo TQ-S Mass Spectrometer operated in multiple reaction monitoring (MRM) positive ion electrospray mode. Compound MRM time acquisition window (min) MRM transition Cone (V) Collision energy (V) testosterone > dihydrotestosterone > d3 testosterone > d3 dihydrotestosterone > progesterone > C3 progesterone > cortisone > cortisol > d4 cortisol > d7 cortisone > Table 1. MRM transitions and instrument settings for each compound. (Broccardo 213) Data analysis Quantification was performed using linear regression against a standard curve in MassLynx Software. Peak areas for each compound were normalized to the corresponding internal standard in each sample. 98 Multiplexed Analysis of Steroid Hormones Using ionkey/ms
101 RESULTS AND DISCUSSION Chromatographic separation of the five compounds is illustrated in Figure 1. An average peak width of 6s was achieved. Figure 1. Chromatographic separation of the five steroid compounds in human serum. (Broccardo 213) Figure 2. Calibration curve for cortisone measured in human serum. (Broccardo 213) A typical calibration curve is shown in Figure 2. The correlation coefficients for all compounds were.99 or greater. Multiplexed Analysis of Steroid Hormones Using ionkey/ms 99
102 The lower limit of quantification (LOQ) and lower limit of detection (LOD) for all five compounds is listed in Table 2. These values represent a 1 4 fold increase in on-column analytical sensitivity as compared to published standard flow assays which typically require injection volumes of 5 2 µl of extracted sample; 2,4 only.5 µl of extracted sample is used in the assay presented here. Analyte LOD (ng/ml) LOQ (ng/ml) testosterone dihydrotestosterone progesterone.3.4 cortisone.9.29 cortisol Table 2. LOD and LOQ values for the five steroids in human serum. (Broccardo 213) CONCLUSIONS The ionkey/ms System with the Xevo TQ-S and 15 µm ikey enabled the development of a low flow MRM assay of five steroids in human serum for clinical research. The low flow regime resulted in an increase in on-column analytical sensitivity and a 15 fold decrease in solvent consumption, as compared to standard flow multi-use methods in the literature. References 1. C. J. Broccardo, K. L. Schauer, W.M. Kohrt, R.S. Schwartz, J.P. Murphy, J.E. Prenni, J Chromatogr B Analyt Technol Biomed Life Sci (213) N. Janzen, S. Sander, M. Terhardt, M. Peter, J. Sander, J Chromatogr B Analyt Technol Biomed Life Sci 861 (28) M.M. Kushnir, A.L. Rockwood, W.L. Roberts, B. Yue, J. Bergquist, A.W. Meikle, Clin Biochem 44 (211) I.A. Ionita, D.M. Fast, F. Akhlaghi, J Chromatogr B Analyt Technol Biomed Life Sci 877 (29) 765. For Research Use Only. Not for use in diagnostic procedures. Waters, The Science of What s Possible, ACQUITY UPLC, MassLynx, and Xevo are registered trademarks of Waters Corporation. ionkey/ms, ionkey, and ikey are trademarks of Waters Corporation. All other trademarks are the property of their respective owners Waters Corporation. Produced in the U.S.A. January EN AG-PDF Waters Corporation 34 Maple Street Milford, MA 1757 U.S.A. T: F: Multiplexed Analysis of Steroid Hormones Using ionkey/ms

103 FOOD RESEARCH
104 A Novel Strategy to Screen and Profile Steviol Glycosides of Natural Sweeteners in Food Using the ionkey/ms System s Ion Mobility Mass Spectrometry 1 M. McCullagh, 1 D. Douce, 1 R. Rao, and 2 S. Goscinny 1 Waters Corporation, Wilmslow, UK 2 Wetenschappelijk Instituut Volksgezondheid-Institut Scientifique de Santé Publique, Brussels, Belgium APPLICATION BENEFITS Leverages the ionkey/ms System and the selectivity of ion mobility collision cross sections (CCS) for enhanced ionization/ transmission efficiency, providing greater sensitivity for profiling stevioside isomers in complex food commodities. Separation of chromatographically co-eluting isomeric species can be achieved using ion mobility. Enables unequivocal stevioside isomer identification to authenticate route of origin in food products, i.e. natural, synthesized, semi-synthesized, and manufacturing processes. WATERS SOLUTIONS ionkey/ms System ikey PCA Separation Device ACQUITY UPLC M-Class System Waters Ion Mobility Mass Spectrometry Systems UNIFI Scientific Information System KEY WORDS Isomer identification, stevioside, isomers, ion mobility, CCS, sweeteners, natural food products, plant profiling, stevia, microflow INTRODUCTION Stevia rebaudiana Bertoni is a perennial shrub of the Asteraceae (Compositae) family native to regions of South America. Stevia is of significant economic value due to the high content of natural, dietetically valuable sweeteners in its leaves. It is referred to as the sweet herb of Paraguay. Currently, the stevia plant or its extracts are used as sweeteners in North America, South America, Asia, and some European countries. The Joint FAO/WHO Expert Committee on Food Additives (JECFA) has established regulations for steviol glycosides demanding a purity level of at least 95 of the seven chemically defined steviol glycosides. 1 Complete residue analysis of steviol glycosides in food, is a challenge due to nature of the task, i.e. the detection of low steviol glycoside isomer concentrations in complex food commodities, where generic extraction procedures have been used. The challenge is two-fold where low concentrations are present, because they may be used in conjunction with other sweeteners or sugars. In addition, detection at low concentrations is difficult where one or two of the glycosides are at very high concentrations (e.g. rebaudioside A). Isomers of substances may have different chemical properties they can have different flavor, as well as possible variability in their absorption, distribution, metabolism, elimination, and toxicity. Hence it is necessary to have information on the make up of substances that can contribute to flavor. An initial highly selective, sensitive screening method could be used, where the focus is only aimed towards qualitative, but much more specific detection is required to determine the sweetener s purity, as the purity can impact taste. 2-4 Full scan high resolution mass spectrometry (HRMS) offers high specificity with theoretically no limitation in the number of compounds that can be detected. The continued technology advances of time-of-flight (Tof) mass spectrometry have brought higher sensitivities, resolution, and mass accuracy (typically sub-2 ppm). Tof MS is used in combination with time tolerances, isotopic matching, fragment ions/ratios, and response thresholds to help reduce false positive and false negative detections in screening assays. 12
105 Advances in mass spectrometry have vastly improved sensitivity for full spectral analysis, but further enhancements would improve the mass spectral data quality. This is especially important to avoid compromised precursor ion or fragment ion information, and ensure high mass accuracy at low levels. Despite these MS enhancements it can still be a challenge to rapidly and efficiently identify targeted isomeric compounds present in a sample, particularly with large numbers of co-extracted matrix components. Improvements in sensitivity, and the other benefits of using the ionkey/ms System have been described previously, 5 including enabling sample dilution to reduce matrix suppression, and subsequently increasing the overall analyte signal-to-noise values that can be achieved. In this application note, we illustrate the selectivity of collision cross section (CCS) measurements used in combination with other recent MS technology enhancements for profiling complex mixtures. A combination of high resolution mass spectrometry and high efficiency ion mobility based measurements and separations is used. Ion mobility is a rapid orthogonal gas separation phase technique that allows another dimension of separation to be obtained within an LC timeframe. Compounds can be differentiated based on size, shape, and charge. A CCS value is a robust and precise physicochemical property of an ion. It is an important distinguishing characteristic that is related to its chemical structure and three-dimensional conformation. 6 Using nitrogen-based travelling wave collision cross sections ( TW CCSN2) measurements can increase non targeted screening specificity. Previously generated TW CCSN2 measurements have been entered into the UNIFI Scientific Library. This allows the expected and determined TW CCSN2 values to be utilized for screening and confirming the presence of steviol glycosides. Here we present a unique approach to screen food products for steviol glycosides using the ionkey/ms System and ion mobility mass spectrometry (IM-MS), which provides unequivocal specificity and sensitivity. The structures of steviol and the steviol glycosides of interest are shown in Figure 1. OH H H HO H HO HO H H H H HO H CH 3 CH 3 H O O HO H O H O H 2 C H OH OH H Dulcoside A [M-H] - = Da HO HO H H OH H O H CH 3 O O O O HO HO HO H 3 CH H CH 3 O OH O H CH 3 OH OH HO OH OH O O O OH O OH O O CH 2 HO HO HO Rebaudioside A [M-H] - = = Da CH 3 H OH CH 2 Steviol [M-H] - = Da H H HO OH H O HO HO H HO H H H H H O OH HO H 3 CH H O H H OH O O CH O OH 3 O OH HO H HO H H O H OH H H O HO H HO H 2 C H H H H H H O OH H O HO Rebaudioside D [M-H] - = = Da H H HO OH H O HO HO H H H O HO H 3 CH OH H H O O CH OH HO H 3 O HO H H O H OH H O HOH 2 C H H H H H H O OH H O HO Rebaudioside F [M-H] - = Da H 3 C H H 3 C O O O HO HO H HO O OH OH HO O CH 2 OH OH HO HO HO OH HO O H H 3 C OH O O OH O O CH 3 CH 2 H OH HO HO HO O HO HO O O OH O O OH O O CH 3 CH 2 H CH 3 H OH OH OH OH HO HO O O OH H H CH 3 O OH HO HO CH 3 OH O OH O O OH O CH 2 OH OH Rubusoside [M-H] - = Da Steviolbioside [M-H] - = Da Rebaudioside B [M-H] - = Da Stevioside [M-H] - = Da OH H H H H HO OH H O HO HO H HO H H H H H O OH HO H 3 CH H O H H O O OH H CH O 3 O OH HO H O H H O HO H H 2 C H OH OH H Rebaudioside E [M-H] - = Da OH CH 3 H H 2 C H O HO O OH H O H H CH 3 O H O O H H OH H H HO H HO OH H OH H H HO H Rebaudioside C [M-H] - = Da H OH HO H H OH O H O OH H 3 C O H H Figure 1. Structures of steviol and steviol glycoside used in the study. A Novel Strategy to Screen and Profile Steviol Glycosides of Natural Sweeteners in Food Using ionkey/ms Ion Mobility Mass Spectrometry 13
106 E X P E R IM E N TA L LC conditions LC system: Mobile phase A: Mobile phase B: Gradient: ACQUITY UPLC M-Class System 1 Water (.1 formic acid) 1 Acetonitrile (.1 formic acid) Time (min) Flow rate A B Flow rate: Injection volume: Separation device: 2. µl/min Separation device temp.: 4 C 1 µl (full loop) ikey BEH C 18 PCA Separation Device, 13Å, 1.7 µm, 15 µm x 5 mm (p/n ) MS conditions MS system: SYNAPT G2-Si Ionization mode: ESI- Capillary voltage: 2.6 kv Sample cone voltage: 2 V Lock mass and CCS: Leucine enkephalin, [M-H] - = Acquisition range: 5 to 1,2 m/z Acquisition rate: 1 spectra/sec Collision energy ramp: 3 to 7 ev Resolution: 2, FWHM (Res mode) Default IMS parameters IMS T-Wave velocity ramp: IMS T-Wave pulse height: IMS gas flow: IMS duty cycle: Start: 1, m/s End: 3 m/s 4 V 9 ml 1.8 ms Extraction conditions Blank chocolate spread sample was purified in two steps. First, fat removal was performed by liquid-liquid extraction. The fat-free extract was subjected to a C18 solid phase extraction to remove other matrix components. The final extract was dissolved in acetonitrile. At the end of the sample preparation step, the matrix content in the extract was.1 g/ml. Steviol glycosides 1 steviol glycosides + steviol at 1 mg/ml in methanol (Table 1) were used to prepare dilutions for matrix fortification post cleanup. Compound Stock conc. mg/ml* Solvent standard stock solutions (H 2 O) Dilution 1 conc. ng/µl Dilution 2 conc. ng/µl Dilution 3 conc. ng/µl Expected rt Rebaudioside E Rebaudioside D Rebaudioside F Rubusoside Rebaudioside B Steviolbioside Stevioside Rebaudioside A Steviol Rebaudioside C Dulcoside A Table 1. Concentration of solvents standards used to prepare stevioside spiked chocolate spread extract samples. * Indicated initial concentrations are sub 1 mg/ml for 7 out of 11 analytes used. Spiking protocol Fortification was performed on blank processed matrix after cleanup to avoid any recovery problems (Table 2). The strategy undertaken in conjunction with CCS profiling, was to determine detection levels in a complex matrix, hence acquisitions were performed with a constant matrix concentration of 1 mg/ml (Table 3). 14 A Novel Strategy to Screen and Profile Steviol Glycosides of Natural Sweeteners in Food Using ionkey/ms Ion Mobility Mass Spectrometry
 Volume of matrix Volume of solvent standards dilution 2 Volume of H 2 O Final concentration.")
107 Starting mass of commodity sample (g/ml) Volume of matrix Volume of solvent standards Dilution 1 Volume of H 2 O Final concentration.1 1 µl 1 µl 79 µl Steviosides 1 pg/µl Matrix=1 mg/ml Starting mass of commodity sample (g/ml) Volume of matrix Volume of solvent standards dilution 2 Volume of H 2 O Final concentration.1 1 µl 1 µl 79 µl Steviosides 1 pg/µl Matrix=1 mg/ml Starting mass of commodity sample (g/ml) Volume of matrix Volume of solvent standards dilution 3 Volume of H 2 O Final concentration.1 1 µl 1 µl 79 µl Steviosides 1 pg/µl Matrix=1 mg/ml Table 2. Method of preparation of diluted end-spiked chocolate spread extracts at 1 mg/ml, and stevioside concentrations at 1 pg/µl, 1 pg/µl and 1 pg/µl. Parameter Sample loading details ikey Separation Device Injection solvent composition H 2 /Acetonitrile (9:1) Spiking concentration of matrix (mg/kg) Stevioside solution concentration in the final extract (ng/ml) Matrix load (μg/ml) Injection volume (μl) Loop size (μl) and injection mode On column steviol + stevioside mass (pg) 1 μg/kg, 1 mg/kg, 1 mg/kg 1 ng/ml, 1 ng/ml, 1 ng/ml 1 mg/ml 1 μl 1 μl full loop Variable see Table 2 Table 3. Sample and matrix loadings for spiked stevioside using the ikey Separation Device. A Post Column Addition ikey PCA Separation Device (p/n ), shown in Figure 2, incorporates a 1.7 µm, ACQUITY UPLC BEH C18, stationary phase in a 15 μm diameter separation channel. The ikey Separation Device temperature was set to 4 C, and the eluent from the separation channel flows directly to an integrated ESI emitter. All microfluidic, gas, and electrical connections are automatically engaged when the ikey Separation Device is inserted into the source enclosure and locked into place. The device incorporated an additional channel, enabling post column addition of IPA solvent. The make up solvent was configured to be delivered from channel A of the MS system fluidics for this feasibility study. Figure 2. Post Column Addition ikey PCA Separation Device. PCA ikey Separation Device Analytical Channel Post-Column Addition Channel A Novel Strategy to Screen and Profile Steviol Glycosides of Natural Sweeteners in Food Using ionkey/ms Ion Mobility Mass Spectrometry 15
, accurate mass, fragment ions, and retention time have been obtained to profile the steviol glycosides rebaudioside A to F,")
108 RESULTS AND DISCUSSION In this feasibility study, unique sensitivity and selectivity for screening steviol glycosides in complex mixtures has been achieved. Nitrogen based travelling wave collision cross sections ( TW CCSN2), accurate mass, fragment ions, and retention time have been obtained to profile the steviol glycosides rebaudioside A to F, rubusodside, steviol, dulcoside A, steviolbioside, and stevioside. CCS measurements were readily obtained for the marker standards at 1 pg/μl, and this information was used to create a scientific library within UNIFI incorporating the expected steviol glycoside TW CCSN2 values. Previous studies have shown the benefits of TW CCSN2 screening, including spectral cleanup, avoidance of false positives, and discovery of pesticide protomers. 7-9 The challenge of the assay is further complicated by the requirement to unequivocally identify three pairs of isomers. The steviol glycosides readily fragment and can be prone to insource fragmentation, resulting in isomeric fragments that can result in false positive identifications. 1 Compound Formula [M-H] - Expected Rt Expected TW CCSN 2 (Å 2 ) Rebaudioside E C44H7O Rebaudioside D C5H8O Rebaudioside F C43H68O Rubusoside C32H5O Rebaudioside B C38H6O Steviolbioside C32H5O Stevioside C38H6O Rebaudioside A C44H7O Steviol C2H3O Rebaudioside C C44H7O Dulcoside A C38H6O A chocolate spread extract (1 mg/ml) was spiked with the analytes and analyzed using the ionkey/ms System combined with ion mobility, then screened against the stevioside TW CCSN2 library within UNIFI. The TW CCSN2 assignment for glycosides isomer pairs (rubusodside Å 2 /steviolbioside Å 2 ), (rebaudioside B Å 2 /stevioside Å 2 ), and (rebaudioside A Å 2 /rebaudioside E Å 2 ), shown in Table 4, have been determined using stevioside standards. For steviol and the remaining steviosides, CCS measurements were also determined: steviol ( Å 2 ), dulcoside A (27.75 Å 2 ), rebaudioside F ( Å 2 ), rebaudioside C ( Å 2 ), and rebaudioside D ( Å 2 ). The expected TW CCSN2 and measured TW CCSN2 values for steviosides spiked into chocolate spread extract are presented in Table 4. The UNIFI Component Summary results obtained (Figure 3) clearly show the benefits of using CCS measurements and the ionkey/ms System with ion mobility. When comparing the expected and measured collision cross sections, the TW CCSN2 measurement errors were typically <.4, and the mass measurement error RMS=1.85 ppm obtained for 1 pg on column loading (actual concentrations have been added (Figure 3 in red text). Table 4. Expected retention times and expected CCS values for steviol and steviosides. Figure 3. UNIFI Component Summary for steviol and profiled steviosides 1 pg/µl (actual on column concentration for each analyte (pg/μl) shown in red text) spiked into chocolate spread extract. Three pairs of isomers are highlighted with colored stars, where each pair has been differentiated using CCS. 64pg 68pg 72pg 1pg 1pg 7pg 76pg 1pg 92pg 1pg 8pg 16 A Novel Strategy to Screen and Profile Steviol Glycosides of Natural Sweeteners in Food Using ionkey/ms Ion Mobility Mass Spectrometry

109 In Figure 4, the results obtained at 1 pg/µl are presented in the UNIFI Component Summary, where an overall RMS error of 2.72 ppm was obtained. However the mass error for rubusoside, was ppm, where the peak area response was just 63. At this low level the mass measurement error has been affected by other more abundant ions from the matrix background. Screening with a mass meaurement tolerance of 1 ppm and CCS tolerance of 2 has enabled rubusoside to be identified with confidence at trace levels (68 fg) and false negative detections have been avoided. 64fg 68fg 72fg 1pg 1pg 7fg 76fg 1pg 1pg 92fg 8fg Figure 4. Component Summary for steviol and profiled steviosides 1 pg/µl (actual on column concentration for each analyte (pg/μl shown in red text) spiked into chocolate spread extract. Three pairs of isomers are highlighted with colored stars, where each pair has been differentiated using CCS. The combined extracted mass chromatogram for steviol and profiled steviosides 1 pg/µl spiked into chocolate spread extract are shown in Figure 5. It can be seen that stevioside and rebaudioside A coelute at 7.18 minutes. Figure 5. Extracted mass chromatogram for steviol and profiled steviosides 1 pg/µl spiked into chocolate spread extract. A Novel Strategy to Screen and Profile Steviol Glycosides of Natural Sweeteners in Food Using ionkey/ms Ion Mobility Mass Spectrometry 17
, and coeluting stevioside (green m/z 83.37) is shown in Figure 7. A: CCS=261.15Ǻ 2 Rebaudioside Fragment m/z 83.377 A B B: CCS=269.48Ǻ 2 Stevioside m/z 83.")
110 However Figure 6 reveals using ion mobility, that there are two isobaric species at m/z present at retention time 7.18 mins. The retention time aligned multicomponent spectrum at 7.19 mins for rebaudioside A (brown m/z 965.4), and coeluting stevioside (green m/z 83.37) is shown in Figure 7. A: CCS=261.15Ǻ 2 Rebaudioside Fragment m/z A B B: CCS=269.48Ǻ 2 Stevioside m/z Figure 6. UNIFI ion mobility 3D Data Viewer showing two mobility separated compounds at m/z , calculated TW CCSN 2 values Å 2 and Å 2 at retention time 7.18 mins. Figure 7. Retention time aligned multicomponent spectrum at 7.19 mins for rebaudioside A (brown m/z 965.4) and coeluting stevioside (green m/z 83.37). Also shown (lower) is the retention time aligned fragmentation spectrum. 18 A Novel Strategy to Screen and Profile Steviol Glycosides of Natural Sweeteners in Food Using ionkey/ms Ion Mobility Mass Spectrometry
111 Using the cleaned up ion mobility product ion spectra, that are retention and drift time aligned, it is possible to obtain the single component precursor and ion mobility product ion spectra for stevioside (Figure 8) and rebaudioside A (Figure 9) resolved from co-eluting components. Use of ion mobility reveals coelution of isobaric species, which would not have been observed without ion mobility separation. As Figure 6 shows, rebaudioside A has produced an insource fragment ion with a CCS of Å, 2 compared to Å 2 for stevioside. Figure 8. Retention time (7.19 mins) and drift (7.24 ms) aligned spectrum for stevioside (green m/z 83.37). Also retention/drift time aligned ion mobility product ion spectrum. Figure 9. Single component spectrum at retention time (7.17 mins) and drift (7.83 ms) aligned spectrum for rebaudioside A (green m/z 965.4). Also retention/drift time aligned ion mobility product ion spectrum. For the first time unique CCS measurements, precursor ion, and corresponding isomer fragmentation spectra for steviol glycosides have been obtained using microfluidic chromatography TW CCSN2 ion mobility screening. This approach reduces the quantity of two expensive commodities, i.e. high purity standards and solvent, and it has the potential to negate the requirement to repeatedly purchase expensive high purity standards, ( 25 for the standards used in this study) for future screening assays. A Novel Strategy to Screen and Profile Steviol Glycosides of Natural Sweeteners in Food Using ionkey/ms Ion Mobility Mass Spectrometry 19
112 CONCLUSIONS The ionkey/ms System with ion mobility offers some unique advantages for profiling complex matrices: Sensitivity in combination with high resolution full spectra acquisition. Spectral clean up. Collision cross section to provide unique selectivity and added confidence in identification. Ion mobility selectivity has been illustrated, where accurate mass measurement and TW CCSN2 measurement have been used to successfully detect and differentiate stevioside isomer residues at trace levels. Chromatographically coeluting isomeric species (stevioside and rebaudioside fragment) have been separated. The ikey/ms System provides increased sensitivity in order to profile steviosides at low concentrations. For the analyst, the ionkey/ms System, brings the benefits of microfluidic chromatography to the required routine use platform, in combination with routine ion mobility screening. The application of the ionkey/ms System ion mobility offers the potential to reduce analysis costs: Reduced solvent consumption and waste disposal. Reduced requirement to purchase expensive analytical standards. References 1. J Pól, B Hohnová, T Hyötyläinen. Joint FAO/WHO Expert Committee on Food Additives (JECFA) (21) Compendium of Food Additive Specifications,Monograph 5, Steviol glycosides. (accessed November 21) 73rd JECFA (21) published in FAO JECFA Monographs 1 (3). 2. EFSA Journal 211; 9(5): C Well, O Frank, T Hofmann.* Quantitation of Sweet Steviol Glycosides by Means of a HILIC-MS/MS-SIDA Approach. J Agric Food Chem. 61: , R Shah, L S De Jager, T H Begley. Simultaneous determination of steviol and steviol glycosides by liquid chromatography-mass spectrometry. Food Additives & Contaminants: Part A. 29,12: , No. 12, December M McCullagh, S Goscinny, V Hanot, R Tyldesley Worster, and D Douce. Exploring the Benefits and Potential of ikey Microfluidic Chromatography and Time-of-Flight Mass Spectrometry for Pesticide Residue Analysis. Waters Application Note en, The use of collision cross section measurements (CCS) in food and environmental analysis. Waters Technical Note en, M McCullagh, G Cleland, V Hanot, J Williams, S Goscinny. Collision Cross Section a New Identification Point for a Catch All Non Targeted Screening Approach. Waters Application Note 72555en, M McCullagh, V Hanot, S Goscinny. The Use of Ion Mobility Spectral Cleanup and Collision Cross Section Values to Increase Confidence and Efficiency in Pesticide Residues Screening Strategies. Waters Application Note 7258en, M McCullagh, D Eatough, V Hanot, S Goscinny. Discovery of Pesticide Protomers Using Routine Ion Mobility Screening. Waters Application Note 72528en, B F Zimmermann. Tandem mass spectrometric fragmentation patterns of known and new steviol glycosides with structure proposals. Rapid Commun. Mass Spectrom. 25: , 211. Waters, ACQUITY UPLC, SYNAPT, High Definition Mass Spectrometry, HDMS, UNIFI, UPLC, and The Science of What s Possible are registered trademarks of Waters Corporation. T-Wave, ionkey/ms, ikey, and ionkey are trademarks of Waters Corporation. All other trademarks are the property of their respective owners Waters Corporation. Produced in the U.S.A. February EN AG-PDF Waters Corporation 34 Maple Street Milford, MA 1757 U.S.A. T: F: A Novel Strategy to Screen and Profile Steviol Glycosides of Natural Sweeteners in Food Using ionkey/ms Ion Mobility Mass Spectrometry
113 Exploring the Benefits and Potential of ikey Microfluidic Chromatography and Time-of-Flight Mass Spectrometry for Pesticide Residue Analysis Michael McCullagh, 1 Severine Goscinny, 2 Vincent Hanot, 2 Richard Tyldesley Worster, 1 and David Douce 1 1 Waters Corporation, Wilmslow, UK 2 Wetenschappelijk Instituut Volksgezondheid Institut Scientifique de Santé Publique, Brussels, Belgium APPLICATION BENEFITS Enhanced ionization/transmission efficiency provides higher sensitivity to detect pesticides residues in complex food commodities at regulatory limits. Removal of matrix suppression with sample dilution. Enhanced spectral quality at MRL. Green technology with a significant reduction in solvent consumption. WATERS SOLUTIONS ionkey/ms System ACQUITY UPLC M-Class System Xevo G2-S QTof ACQUITY UPLC BEH C 18 Column MassLynx Software UNIFI Scientific Information System ikey Separation Device KEY WORDS ionkey, QTof INTRODUCTION Pesticides have been widely used throughout the world since the middle of the 2 th century. The Pesticide Manual Online lists information on more than 1,6 pesticides, with 1,4 product names, 3,1 discontinued products, and information for superseded materials believed to be no longer manufactured, or marketed for crop protection use. This information does set the scene for the challenge of pesticide residue analysis. The number of pesticides listed in the Pesticide Manual far exceeds the 357 pesticides approved for use within the EU. 1 In addition, the regulations are constantly changing. For example, the impact of pesticide residues on bee populations has prompted legislation modification. The use of seed products containing the active plant protection substances clothianidin, thiamethoxam, and imidacloprid have been prohibited, within the constraints of approved conditions of use. 2 Food commodities are sourced from a global network supply chain, therefore a residue screening strategy should be considered from a global perspective. Alder et al. indicated that there are more than 5 strictly regulated compounds that are routinely used and analyzed using GC-MS and LC-MS. 3 With increasing global trade there is a need for qualitative multi-analyte screening strategies that are capable of efficiently detecting residue violations to protect consumer safety. Countries have different regulations concerning authorization of pesticides and Maximum Residue Limits (MRLs) established. The SANCO/12571/213 guidance document describes the method validation and analytical quality control requirements to support the validity of data used for checking compliance with MRLs, enforcement actions, or assessment of consumer exposure to pesticides in the EU. 4 Pesticide residue analysis in food has become a difficult task considering the increasing number of compounds and complex food commodities that need to be monitored at low concentrations with generic extraction procedures. The direct consequences are that complex extracts may include the presence of potentially interfering matrix components for which multiple injections may have to be performed, while achieving a dwell time and duty cycle balance. 111
114 Screening methods are a practical alternative, where the focus is primarily aimed towards qualitative detection in which neither requirements for recovery nor linearity are defined. Full scan High Resolution MS (HRMS) offers high specificity with, theoretically, no limitation in the number of compounds detected. Although timeof-flight mass spectrometry (Tof-MS) has provided the benefits of higher sensitivity and resolution, it is still a challenge to rapidly and efficiently identify targeted compounds in the presence of a large number of co-extracted matrix components. The benefits of full spectra acquisition and specificity of accurate mass measurement are well characterized and have been used in combination with retention time tolerances, isotope fits, fragment ions/ratios, and response thresholds to reduce false positive/negative identifications in non targeted screening assays. Also the ability to perform retrospective data review can be advantageous. From the mass spectral data generated, the challenge reverts to minimizing false detections through careful optimization of software screening parameters, while ensuring that when dealing with the impact of such complex matrices, false negative identifications do not result. Over the last decade LC-MS has become the predominant approach for the analysis of small organic molecules, such as pesticide residues in food commodities. Multi-residue analysis utilizes generic sample extraction and chromatographic methodology; hence the analysis of very complex mixtures remains a challenge that the residue analyst has to deal with on a day-to-day basis. Recent advances in MS and separations technology, such as enhanced MS ion transmission and the increased peak capacity of UltraPerformance Liquid Chromatography (UPLC ) have the potential to facilitate complex mixture analysis. StepWave, a unique off-axis ion source technology, provides additional sensitivity and increases the dynamic range required for routine pesticide screening. Such enhancements in Tof technology provide improved precision and accuracy in the data generated, but also necessitate the creation and utilization of more intelligent data processing software packages. Nonetheless, the ability to rapidly and efficiently identify targeted compounds present in a sample with a large number of co-extracted matrix components remains a challenge. Advances in Waters mass spectrometry technology have vastly improved sensitivity for full spectral analysis, enabling Waters to provide the only unique fully validated pesticide screening solution. 5 The drive to improve and develop new technology solutions continues in order to meet the ever changing requirements of residue analysis and more stringent regulations. Further sensitivity enhancements would help improve mass spectral data quality, which is especially important in order to avoid compromised precursor ion or fragment ion information and ensure high mass accuracy ( 2 mda) below the legislated levels. This study aims to characterize sensitivity enhancements and reduction of matrix suppression for residue analysis. The ionkey/ms System was comprised of the nanoacquity UPLC System,* the Xevo G2-S QTof Mass Spectrometer, the ionkey Source, and the ikey Separation Device, all controlled with MassLynx Software. Presented in Figure 1, the ionkey/ms System incorporates UPLC separation into the mass spectrometer source, delivering exceptional performance and a simplified user experience. Figure 1. The ionkey Source, which incorporates the ACQUITY UPLC Peptide BEH C 18 Column and ionization emitter. *Replaced by the ACQUITY UPLC M-Class System. 112 Exploring the Benefits and Potential of ikey Microfluidic Chromatography and Time-of-Flight Mass Spectrometry for Pesticide Residue Analysis
115 E X P E R IM E N TA L LC conditions LC system: Mobile phase A: Mobile phase B: nanoacquity UPLC* 1 Water.1 Formic acid 1 Acetonitrile.1 Formic acid *Replaced by the ACQUITY UPLC M-Class System. Gradient: Time Flow rate Flow rate A B (min) (µl/min) (µl/min) UPLC ikey Flow rate: Injection volume: UPLC column: UPLC: 45 μl/min ikey: 1 μl/min UPLC: 5 μl ikey: 2 μl Column temp.: 3 C Separation device: ikey temp.: 45 C ACQUITY UPLC Peptide BEH C18, 13Å 1.7 μm, 2.1 mm x 1 mm (p/n ) ikey Peptide BEH C 18, 3Å, 1.7 µm, 15 µm x 1 mm (p/n ) MS conditions MS system: Xevo G2-S QTof Ionization mode: ESI+, conventional probe and ionkey Source Desolvation temp.: 55 C (UPLC) Mass range: to 1,2 Da Acquisition rate: 1 spectra/s Capillary voltage: 1 kv Cone voltage: 2 V Collision energy ramp: 1 to 45 ev Resolution: 3, (FWHM) Lockmass: m/z (Leucine enkephalin) Samples The assay was based on the analysis of solvent standards in addition to matrix samples: organic mandarin, ginger, leek, and pear extracts, plus matrix matched calibrants. Sample preparation 1 g of homogenized sample was extracted with 6 ml of 2 mm ammonium acetate in methanol using an Ultra-Turrax device. Then, the crude extract was filtered and diluted up to 1 ml with 5 mm ammonium acetate in water prior to injection. Spiking protocol Organic samples were homogenized and 1 g was extracted with 6 ml of 2 mm acetate ammonium in a methanol/water (95:5; v/v) solution. Then 5 ml and 3 ml of raw extract were transferred to six volumetric flasks. For the spiking of.1,.5,.1 mg/kg levels, 5, 25, 5 µl respectively of a mix solution were added containing the targeted pesticides at.1 µg/ml. For the higher levels,.2,.5, and 1. mg/kg were added (1, 25, and 5 µl respectively) of a mix solution containing the targeted pesticides at 1 µg/ml. Then the final volumes were adjusted to 5 ml with 5 mm ammonium acetate in water/methanol (9/1; v/v). Exploring the Benefits and Potential of ikey Microfluidic Chromatography and Time-of-Flight Mass Spectrometry for Pesticide Residue Analysis 113
116 Chromatographic method Starting mass of crop sample (g) Crop equivalent in the final extract Spiking concentration (mg/kg) Solution concentration (ng/ml) Dilution factor applied during the extraction procedure UPLC 1.1 g/ml.1 1. x1 ikey 1.1 g/ml.1.1 x1, Table 1. Illustration of spiking concentrations, solution concentrations, and dilution factors applied using the Granby extraction method for UPLC/iKey comparison. Matrix comparison In order to take into consideration the different injection volumes and sample dilutions, on-column loadings were used in order to generate extrapolated comparative results. For the ionkey/ms System reduction matrix suppression studies, samples were diluted using 25 water:75 acetonitrile. Parameter Chromatographic mode and sample loading details ikey UPLC Injection solvent composition 25(water):75(acetonitrile) Methanol Dilution factor applied to the final extract x1 x1 Spiking concentration (mg/kg) 1..1 Pesticide solution concentration 1 ng/ml 1 ng/ml in the final extract (ng/ml) Matrix load (ng/ml).1 ng/ml.1 ng/ml Injection volume (μl) 2 μl 5 μl Loop size (μl) and injection mode 2 μl 5 μl On-column mass (pg) 2 pg 5 pg Table 2. Parameters used for the direct comparison of the ikey and ACQUITY UPLC Systems in matrix extraction. The ikey Separation Device, shown in Figure 2, incorporates a 1.7 µm, ACQUITY UPLC BEH C18 Column (p/n ), stationary phase in a 15 μm diameter separation channel. The ikey Separation Device temperature was set to 45 C, and the eluent from the separation channel flows directly to the integrated ESI emitter. All microfluidic, gas, and electrical connections are automatically engaged when the ikey Separation Device is inserted into the source enclosure and the handle is turned locking it into place. Figure 2. The ikey Separation Device incorporates fluidic/ electronic connections and an ionization emitter. Data processing Data were processed using MassLynx Software and the UNIFI Scientific Information System. Peak volume was determined using UNIFI s 3D peak detection algorithm. 114 Exploring the Benefits and Potential of ikey Microfluidic Chromatography and Time-of-Flight Mass Spectrometry for Pesticide Residue Analysis

 with the integrated ikey (Figure 2), was interfaced to a Xevo G2-S QTof Mass Spectrometer, where the acquisition of precursor and fragment ions (MS E ) was performed.")


117 RESULTS AND DISCUSSION A direct comparison of UPLC and the ionkey/ms System for screening of pesticide residues in food was performed to explore the potential benefits of ikey microfluidic chromatography combined with time-of-flight mass spectrometry for residue analysis purposes. Analysis of mandarin, pear, leek, and ginger extracts, for pesticide residues was performed. The acquired MassLynx data were processed with the UNIFI Scientific Information System, which has been specifically designed for non-targeted accurate mass screening applications. An ionkey Source (Figure 1) with the integrated ikey (Figure 2), was interfaced to a Xevo G2-S QTof Mass Spectrometer, where the acquisition of precursor and fragment ions (MS E ) was performed. Improvements in ionization transmission efficiency produced using the ionkey/ms System can be observed in Figure 3. The proximity of the ikey Separation Device emitter to the sampling cone orifice allows the finer, smaller droplets produced to enter the mass spectrometer. Using conventional electrospray, even with visual inspection, the droplet sizes in the plume were larger and also only a part of the plume was sampled. In addition to the improved transmission efficiency using the ikey Separation Device, an increase in ionization efficiency was also observed. Figure 4 shows the linearity and dynamic range obtained for imazalil in a mandarin extract. A correlation coefficient of R 2 =.994 was obtained for.1 ng/ml to 1 ng/ml (.1 pg/μl-1 pg/μl) using the ionkey Source. Figure 5 shows the limit of detection (LOD), where both precursor and retention time aligned fragment ion information was obtained for imazalil, at 5 fg/μl level in vial. Fine ESI plume Broad diverse ESI plume Figure 3. ESI plumes from the integrated emitter on the ikey and conventional electrospray probe. Figure 4. Reconstructed ion chromatograms (RICs) for imazalil precursor/fragment ions in mandarin matrix and linearity plot showing a linearity correlation coefficient of R 2 =.99 for.1 ng/ml to 1 ng/ml (.1 pg/μl to 1 pg/μl) using the ionkey/ms System. Figure 5. Reconstructed ion chromatograms (RICs) of the precursor/fragment ions of imazalil and MS E precursor/fragment ion spectra obtained for imazalil in mandarin matrix for imazalil, 5 fg/μl in vial (1 pg on column). Exploring the Benefits and Potential of ikey Microfluidic Chromatography and Time-of-Flight Mass Spectrometry for Pesticide Residue Analysis 115


118 The characteristic imazalil isotope distribution is highlighted in green. A further example of fortified mandarin extract is presented for thiabendazole in Figures 6 and 7. A correlation coefficient of R 2 =.999 was obtained over a concentration range of.1 ng/ml to 1 ng/ml (.1 pg/μl to 1 pg/µl); also both precursor and retention time aligned fragment ion information is illustrated for thiabendazole. It is significant to note that for imazalil and thiabendazole, LODs of 1 fg/μl in vial were obtained; precursor ion data only was achieved in this case. Both precursor ion and fragment ions were obtained at 5 fg/μl in vial. Mandarin, pear, leek, and ginger fortified extracts were analyzed, and acceptable linearity was observed for all four matrices, with R 2 s of the order of.95 or above. Typical correlation coefficients obtained for pesticides in the matrix matched samples analyzed are presented in Table 3. Figure 6. Reconstructed ion chromatograms (RICs) of the precursor/fragment ions of thiabendazole in mandarin matrix showing a linearity correlation coefficient of R 2 =.99 for.1 ng/ml to 1 ng/ml (.1 pg/μl to 1 pg/µl) using ionkey/ms. Figure 7. Reconstructed ion chromatograms (RICs) of the precursor/fragment ions of obtained for thiabendazole in mandarin matrix, for 5 fg/μl in vial (1 pg on column) and MS E precursor/fragment ion spectra obtained. Correlation Coefficients (R 2 ) Pesticide Mandarin Ginger Leek Pear chlobromuron cyazofamid dichlorvos diuron fenbuconazole imazalil indoxacarb pencycuron prochloraz pyrimethanil pyriproxyfen tebuconazole tetraconazole thiabenazole triasulfuron Comparison of UPLC-MS versus the ionkey/ms System The results presented for thiabendazole/imazalil clearly illustrate the spectral quality and linearity that can be obtained using the ionkey/ms System. LODs of 1 fg/µl in vial have been determined using time-of-flight full spectral analysis. In order to determine how the increased sensitivity and exceptional system performance has been generated, comparison of data from the pesticide solvent standards and matrix matched samples was undertaken. During the electrospray process, creation of droplets with an excess of positive charges occurs. Ionization efficiency can be impacted by a number of factors such as flow rate, interface design, solvent composition, buffer concentration, matrix composition, or analyte properties (polar/non-polar). In general, as the eluent flow to the electrospray emitter decreases, ionization efficiency increases because of an increase in the production of smaller charged droplets at lower flow rates. Table 3. Typical correlation coefficients obtained for pesticides in the matrix matched samples analyzed using the ionkey/ms System. 116 Exploring the Benefits and Potential of ikey Microfluidic Chromatography and Time-of-Flight Mass Spectrometry for Pesticide Residue Analysis
119 In this study, optimum sensitivity was determined at 1 µl/min. Electrospray current in cone-jet mode (when a liquid meniscus held at the exit of a metallic capillary tube is charged to a high voltage, the free surface often takes the form of a cone whose apex emits a steady micro jet) increases approximately as the square root of the volumetric flow rate; therefore the number of available charges per analyte molecule increases as the flow rate decreases. This can be explained if droplet size is considered. For example, 1, droplets with a 1 μm diameter have the same volume as one droplet with a diameter of 1 μm. However the surface area of the 1, droplets is 1 times higher, than that of the 1 μm diameter droplet. Hence small droplets are able to carry a higher percentage of charge. Smaller initial droplets and increased amount of charge available per analyte molecule improve the ionization of analytes with lower surface activity, improving quantitation and reducing matrix suppression effects. More efficient solvent evaporation results from smaller droplet sizes and as a result, fewer coulombic fission events are required to create gas phase ions In Figure 8, the improvement in sensitivity achieved using the ionkey/ms System is shown. The responses for pesticides in solvent at 1 pg/µl in vial, were compared using the optimized UPLC-MS and the ionkey/ms System conditions. The response factor increase of the ionkey/ms System to standard UPLC-MS is shown on the X axis and the bars correspond to the number of pesticides that demonstrated the factor increase. The red curve shows the cumulative percentage of total pesticides in the analysis. It can be observed from the data that the factor increase produced by the ionkey/ms System for 8 (identified from the cumulative frequency curve) of the pesticides was up to x45, with the final 2 having a factor increase of > x45 in response. The factor increase in response (3D peak volume) does vary and is compound dependent. Aldicarb sulfone, diafenthiaurion, fenpyroximate, and isofenphos-methyl exhibited the lowest response factor increases, while linuron, chlorbromuron, and dichlorvos exhibited the highest response factor increases. Figure 9 shows a summary of the information in Figure 8. Overall, approximately 3 of the pesticides have a factor increase in response of 2 to 5 when using the ionkey/ms System compared UPLC-MS for solvent standards. The injection volumes for UPLC (5 µl) and ikey (2 µl) should also be noted for this comparison and the response obtained using the ionkey/ms System has been extrapolated to take into consideration the different injection volumes. Number of pesticides Factor increase observed for 1 pg/µl solvent standard pesticides using the ionkey/ms System vs UPLC-MS Factor Increase More Pesticides Cumulative Figure 8. Factor increase to number of pesticides from solvent standards for the ionkey/ms System versus UPLC-MS. The increase is shown as a bar graph, with the percentage cumulative frequency also plotted. Pesticides Percentage of pesticides associated with factor increase ranges and above Factor Increase Range Figure 9. Summary of percentage of pesticides associated with factor increase using the ionkey/ms System compared to UPLC-MS for pesticide solvent standards. Exploring the Benefits and Potential of ikey Microfluidic Chromatography and Time-of-Flight Mass Spectrometry for Pesticide Residue Analysis 117
120 Reduction in matrix effects Typical screening parameters can include the precursor ion (with adducts), fragment ions, retention time, mass accuracy (precursor ion and fragments), and isotope ratios. The accuracy of LC-MS measurements can be influenced by matrix effects during atmospheric pressure ionization, which inevitably can impact the detection results. IUPAC defines matrix effects as the combined effect of all components of the sample other than the analyte on the measured quantity. 17 Ionization suppression is believed to occur because of the number of excess charges and the limited space on the surface of the charged droplets produced in the ion source. Competition for surface position and charge can be dominated by matrix components over analytes. Solvent evaporation and Raleigh fission can also be inhibited because of increased surface tension and viscosity caused by the matrix. Advantages and limitations of approaches to compensate for matrix effects in multi-class and multi-residue analyses were discussed by Lehotay et al. 18 These include the separation of large matrix components for multiple analytes, matrix removal without impacting analyte recoveries, and the requirements of many blank extracts. The impact of dilution on final extracts is also discussed, along with improved quantification limits. Stanke et. al., performed a systematic study of the dilute and shoot approach for reducing matrix suppression with the desire to determine a relationship between matrix concentration and suppression effect. 19 This work also used generic extraction techniques, which are convenient, but contain high matrix concentrations. Stanke concluded that matrix can cause significant suppression of analytes. Using a 1-fold dilution, suppression resulting from generic extraction techniques, such as QuEChERS, can be reduced by 25 to 5. In order to remove matrix effects, a 1-fold dilution step, or alternatively, a sample extraction method achieving 99 matrix removal would be required. Conventional ESI source designs may have a slight influence on suppression, but would not affect the principal relationship between matrix effect and matrix suppression. 18 The Granby extraction method was utilized in this collaborative project, where unlike QuEChERS, no sample cleanup step is performed. 2 In order for an analyte to appear in the mass spectrum it must successfully compete for a place on the charged surface of the droplets. The extent of matrix effects depends on the ability of the matrix to occupy the surface of a droplet. With transmission at low flow rates that the ikey Separation Device design enables, samples can now be diluted further to minimize matrix suppression, while still attaining the required LODs for contaminant analysis. To assess what this might mean for pesticide analysis, a comparison between UPLC-MS System and the ionkey/ms System was undertaken in spiked matrix samples. The analysis of the solvent standards presented here captures the ionization improvements that can be gained using the ionkey/ms System. The improvement in sensitivity allows for the dilution of the matrix within the sample preparation workflow. In order to capture the combined impact of both ionization improvement and the option for matrix dilution, the concentration of the analytes was kept constant while diluting the matrix component for the ionkey/ms System experiment. Therefore, a solution concentration of 1 pg/μl was used for both the UPLC-MS and the ionkey/ms System measurements. Table 2 summarizes the sample information used for the direct comparison of the ikey and UPLC chromatographic systems. The pesticide residue response for fortified mandarin matrix is presented in Figure 1. For 8 of the pesticides (identified from the cumulative frequency curve), the factor increase produced using the ikey Separation Device was up to x6. The final 2 have a factor increase of > x6 in response. The increase in response does vary and is known to be dependent on the physicochemical properties of the compound. This is highlighted by the varied increases in response in Figure 1, where 1 pesticides in mandarin matrix have a factor increase of x25, and a factor increase of x45 was observed for another Exploring the Benefits and Potential of ikey Microfluidic Chromatography and Time-of-Flight Mass Spectrometry for Pesticide Residue Analysis
121 Factor increase observed for Mandarin matrix containing pesticides at 1 pg/µl, ionkey/ms System vs UPLC-MS Detected Pesticides Factor increase 1 More Pesticides Cumulative Figure 1. Factor increase to the number of pesticides in mandarin matrix matched samples for the ionkey/ms System compared to UPLC-MS. The increase is shown as a bar graph, with the percentage cumulative frequency also plotted. The impact of matrix suppression reduction is also apparent when comparing signal-to-noise (S/N). In Figure 11, a comparison of S/N measured for tetraconazole using UPLC-MS and the ionkey/ms System is illustrated. The S/N was determined for pesticide residues spiked into mandarin matrix at 1 pg/μl in vial (UPLC) and 1 pg/μl in vial x1 dilution (ikey). The concentration injected on column in each case was therefore 1 pg/μl. For UPLC, a S/N of 128 was obtained, compared to a S/N of 1361 using the ikey Separation Device. This is a 1x improvement in S/N. The injection volumes for UPLC (5 µl) and ikey Separation Device (2 µl) should also be noted for this comparison. Even with 2.5 times more injected on UPLC, the ionkey/ms System gave a 1x increase in S/N. Comparison of S/N for imazalil is presented in Figure 12, where for UPLC, a S/N 616 was obtained, compared to a S/N of 2163 for the ionkey/ms System, which equates to a x3.5 improvement in S/N. Variations in the S/N and response improvement reflect the extent to which matrix suppression has been reduced, as well as different improvements in ionization efficiency for each of the analytes. To compare the responses obtained for imazalil for example, using UPLC (5 μl injection) and ikey Separation Device (2 μl injection), the ikey Separation Device absolute response was multiplied by 2.5 and divided by the UPLC absolute response. ikey separation device UPLC S/N 1361 S/N 128 ikey Separation Device S/N RESPONSE Amount On Column Calculated Gain e 5 2pg Extrapolated Response: X27 UPLC pg Figure 11. Comparison of S/N for UPLC-MS and the ionkey/ms System for tetraconazole in mandarin matrix, where the S/N, absolute response and extrapolated increase in response are presented. Exploring the Benefits and Potential of ikey Microfluidic Chromatography and Time-of-Flight Mass Spectrometry for Pesticide Residue Analysis 119
122 ikey Separation Device UPLC S/N 2163 S/N 616 ikey Separation Device S/N Response Amount On Column Calculated Gain e 5 2pg Extrapolated Response:X15 UPLC e 4 5pg Figure 12. Comparison of S/N for UPLC-MS and ionkey/ms for imazalil in mandarin matrix, where the S/N, absolute response and extrapolated increase in response are presented. Data acquired from solvent standards and mandarin matrix samples were compared so that the effect of dilution on the matrix effects could be investigated for both chromatographic systems. The factor difference of pesticide solvent standards (the ionkey/ms System versus UPLC-MS) shows the improvement predominantly due to ionisation efficiency. The factor difference of mandarin matrix samples (the ionkey/ms System versus UPLC) shows improvement from both ionisation efficiency and the reduction of matrix effects (due to x1 dilution). By comparing the improvements observed in both experiments, we can gauge the improvement that comes from the difference due to matrix effect alone. In Figure 13, a summary of the percentage of pesticides associated with factor increase using the ionkey/ms System compared to UPLC-MS for pesticide solvent standards and diluted mandarin extracts is presented. In the diluted mandarin matrix sample, 42 of the pesticides experienced a 2 to 5-fold increase in response. This compared to 3 for the solvent standards. These data indicate that matrix suppression was reduced for a large number of the pesticides, while an increase in sensitivity using the ionkey/ms System was observed. Pesticides of pesticides associated with factor increase ranges for solvent standards and fortified matrix and above Factor increase range Solvent standards Mandarin Extract Figure 13. Summary of the percentage of pesticides associated with factor increases using theionkey/ms System compared to UPLC-MS for pesticide solvent standards and diluted mandarin extracts. 12 Exploring the Benefits and Potential of ikey Microfluidic Chromatography and Time-of-Flight Mass Spectrometry for Pesticide Residue Analysis
123 In Figure 14, a comparison of the response gains obtained for the solvent standards and those obtained in the diluted matrix is summarized in a statistics histogram chart, which estimates the probability of distribution of a continuous variable. For the 48 pesticides detected in the mandarin matrix, a factor of 2 increase in sensitivity was observed. An improvement is clearly observed for 8 of the pesticides, with an additional factor of x2 or better improvement in the ionkey/ms System response due to the reduction of matrix suppression. It is clear that the ionkey/ms System can improve absolute sensitivity and help to reduce the challenges of low level residue detection in food matrices. The matrices analyzed are complex and representative of challenging food commodities. The ability to dilute sample matrix and still obtain excellent response and S/N of analytes was demonstrated using the ionkey/ms System. The robust design of the ionkey Source enables the analyst to explore microfluidic chromatography as a routine analytical tool. The ionkey/ms System offers an improvement in data quality at and below required legislative LODs. ionkey/ms System vs UPLC-MS mandarin matrix samples factor increase compared to ionkey/ms System vs UPLC-MS solvent standards factor increase. Number of pesticides Pesticides Cumulative More Response factor increase from reduced matrix suppression Figure 14. The factor difference specifically observed due to reduction of matrix suppression for all of pesticides analyzed in the mandarin matrix. Exploring the Benefits and Potential of ikey Microfluidic Chromatography and Time-of-Flight Mass Spectrometry for Pesticide Residue Analysis 121
124 CONCLUSIONS Significant sensitivity gains were observed due to the improvements in transmission and ionization efficiency of the ionkey Source. Linearity for the pesticides using matrix matched standards produced correlation coefficients (R 2 ) of.95. Extrapolated sensitivity improvements for the ionkey/ms System (2 µl) versus UPLC-MS (5 µl) were shown, to have a factor improvement up to x45 for 8 of the pesticides when analyzed as solvent standards. Extrapolated sensitivity improvements for the ionkey/ms System (2 µl) versus UPLC-MS (5 µl) were shown to have a factor improvement up to x6 for 8 of the pesticides when analysed as matrix (diluted) matched standards. Dilution of the matrix samples resulted in a reduction in matrix suppression. IonKey/MS System provides enhanced MS with the turn of a key this enables reduced sample/solvent consumption and less sample complexity. For the analyst, the advanced design of the ionkey Source delivers the benefits of microfluidic chromatography to a routine analytical platform for both research and surveillance monitoring purposes. IonKey/MS System offers some unique advantages for profiling complex matrices. Sensitivity enhancements enable sample dilution and hence matrix suppression reduction in residue screening assays, while maintaining data quality. It may be possible to reduce the need to closely matrix match QC samples to the test samples by introducing large sample dilution factors to negate the matrix load and thus benefit from efficiency savings within routine surveillance monitoring. References 1. EC (211) COMMISSION IMPLEMENTING REGULATION (EU) No 54/211 of 25 May 211 implementing Regulation (EC) No 117/29 as regards the list of approved active substances. Official Journal of the European Communities L EC (213) COMMISSION IMPLEMENTING REGULATION (EU) No 485/213 of 24 May 213 amending Implementing Regulation (EU) No 54/211 as regards to the conditions of approval of the active substances clothianidin, thiamethoxam, and imidacloprid, and prohibiting the use and sale of seeds treated with plant protection products containing those active substances. Official Journal of the European Communities L Alder L, Greulich K, Kempe G, Vieth B. Mass Spectrometry Reviews. 25: 6, , Method Validation & Quality Control Procedures for Pesticide Residues Analysis in Food & Feed: Document No. SANCO/12571/ Cleland G et al. A New Accurate Mass Screening Solution Incorporating the UNIFI Scientific Information System for the Analysis of Pesticide Residues at Regulatory Limits in Food. Waters application note no EN. November, Kebarle P, Tang L. Anal Chem. 65: A972 A986, Schneider B B, Javaheri H, Covey T R. Rapid Commun. Mass Spectrom. 2: , Cole R B. J Mass Spectrom. 35: , Cech N B, Enke C G. Mass Spectrom Rev. 2: , Wilm M S, Mann M. Int J Mass Spectrom Ion Processes. 136: , Wahl J H, Goodlett D R, Udseth H R, Smith R D. Electrophoresis. 14: , Goodlett D R, Wahl J H, Udseth H R, Smith R D. J Microcolumn. 5: 57 62, Sep Fernandez de la Mora J, Loscertales I. J Fluid Mech. 26: , Tang K, Page, J S, Smith R D. J Am Soc Mass Spectrom. 15: , Schmidt A, Karas M, Dulcks T J. Am Soc Mass Spectrom. 14: 492 5, Alder L. LAPRW. May 8th to May 11th Guilbault G G, Hjelm M. Pure Appl Chem. 61: 1657, Stahnke H, Kittlaus S, Kempe G, Alder L. Anal Chem. 84: , Lehotay S J, Mastovska K, Lightfield A R, Gates R A. JAOAC Int. 93: l, Granby et al. Anal Chimica Acta. 52: , 24. Waters, ACQUITY UPLC, MassLynx, nanoacquity, The Science of What s Possible, UNIFI, UPLC, and Xevo are registered trademarks of Waters Corporation. ikey, IonKey, IonKey/MS, and StepWave are trademarks of Waters Corporation. All other trademarks are the property of their respective owners Waters Corporation. Produced in the U.S.A. January EN AG-PDF Waters Corporation 34 Maple Street Milford, MA 1757 U.S.A. T: F: Exploring the Benefits and Potential of ikey Microfluidic Chromatography and Time-of-Flight Mass Spectrometry for Pesticide Residue Analysis
125 Illustration of the Selectivity of Collision Cross Section Ion Mobility Screening for the Analysis of Pesticide Residues in Food Using ionkey/ms 1 M. McCullagh, 1 D. Douce, 2 V. Hanot, and 2 S. Goscinny 1 Waters Corporation, Wilmslow, UK 2 Wetenschappelijk Instituut Volksgezondheid Institut Scientifique de Santé Publique, Brussels, Belgium APPLICATION BENEFITS Improved selectivity of ion mobility collision cross sections (CCS) measurements in combination with the ikey microflow-lc technology. Enhanced ionization/transmission efficiency, provides higher sensitivity to detect pesticides residues in complex food commodities. Removal of matrix suppression with sample dilution and enhanced spectral quality at MRL s (maximum residue limits). Use CCS data to provide a higher degree of selectivity in combination with accurate mass measurement. Avoid false detections whilst having wider screening windows for retention time, mass accuracy, and filtering with constricted CCS criteria. WATERS SOLUTIONS ionkey/ms System ikey Separation Device ACQUITY UPLC I-Class System ACQUITY UPLC M-Class System Waters Ion Mobility Mass Spectrometry Systems INTRODUCTION Pesticide residue analysis in food has become a more challenging task considering the increasing number of compounds and complex food commodities to be monitored at low concentrations with generic extraction procedures. The direct consequences are complex extracts (presence of matrix compounds), for which multiple injections have to be performed while achieving dwell time and duty cycle balance. Screening methods are a practical alternative and full scan high resolution MS (HRMS) offers high specificity and the ability to detect a large number of analytes simultaneously using generic instrumentation parameters. Although, time-of-flight (Tof) mass spectrometry has benefited from higher sensitivity and resolution, it can still be difficult to rapidly and efficiently identify targeted compounds present in a sample containing a large number of co-extracted matrix components. Full spectra acquisition and accurate mass measurement specificity is well characterized. It is used in combination with time tolerances, isotopic matching, fragment ions/ratios, and response thresholds to help reduce false positive and false negative detections in screening assays. Advances in mass spectrometry have vastly improved sensitivity for full spectral analysis, but further sensitivity enhancements would improve the mass spectral data quality. This is especially important to avoid compromised precursor ion or fragment ion information, and ensure high mass accuracy below the legislated levels. Improvements in sensitivity using the IonKey/MS System have previously been shown. 1 IonKey/MS enables sample dilution to reduce matrix suppression and subsequently increases the overall analyte signal-to-noise values that can be achieved. UNIFI Scientific Information System MassLynx Mass Spectrometry Software KEY WORDS pesticide, CCS, ion mobility, matrix suppression 123
126 In this application note, we explore the use of highly selective collision cross section (CCS) measurements in combination with sensitivity enhancements and reduction of matrix suppression for residue analysis in complex food commodity matrices. Travelling wave ion mobility mass spectrometry (IM-MS) uses a nitrogen buffer gas which enables the measurement of collision cross section, providing some unique advantages for profiling complex mixtures. It is a combination of high resolution mass spectrometry and high efficiency ion mobility based measurements and separations. IM-MS is a rapid orthogonal gas separation phase technique that that allows another dimension of separation to be obtained within an LC timeframe. Compounds can be differentiated based on size, shape, and charge. A collision cross section (CCS) value is a robust and precise physicochemical property of an ion. It is an important distinguishing characteristic, that is related to its chemical structure and three-dimensional conformation. CCS measurements have been entered into a scientific library within the UNIFI Scientific Information System, which allows the expected and determined CCS values to be utilized to screen and confirm the presence of pesticide residues. 2 Here we present CCS values (derived from ion mobility drift times) as a new parameter that can provide added selectivity and more confidence in identifications. This ionkey screening study has shown how CCS can be used to reduce the reliance of screening studies based on retention time. Utilization of CCS measurements enable the application of generic processing parameters to identify targeted compounds, where different chromatographic methodologies have been employed. 124 Illustration of the Selectivity of Collision Cross Section Ion Mobility Screening for the Analysis of Pesticide Residues in Food Using ionkey/ms
127 E X P E R IM E N TA L LC conditions LC system: nanoacquity UPLC Mobile phase: A: 1 Water (.1 Formic acid) B: 1 Acetonitrile (.1 Formic acid) Gradient: Flow rate Flow rate Time (µl/min) (µl/min) (min) UPLC ikey A B Flow rate: UPLC at 45 μl/min ; ikey at 1. μl/min Injection volume: UPLC: 5 μl (full loop); ikey: 2 μl (full loop) UPLC column: ACQUITY UPLC BEH C 18, 1 mm x 2.1 mm, 1.7 μm Column temp.: 3 C ikey column: ikey BEH C18 Separation Device, 13Å, 1.7 μm, 15 µm x 1 mm Column temp: 45 C MS conditions MS system: SYNAPT G2-Si Ionization mode: ESI+ Mass range: 5 to 12 m/z Acquisition rate: 5 spectra/sec Capillary voltage: 1 kv Cone voltage: 2 V Drift gas: N2 Collision energy ramp: 1 to 45 ev IMS wave velocity range: 65 m/s IMS wave height: 4 V IMS gas flow: 9 ml/min IMS duty cycle: 1.8 ms Lockmass: m/z (Leucine enkephalin) Sample description The assay is based on the analysis of solvent standards in addition to matrix samples: mandarin, ginger, leek, and pear extracts, plus matrix matched calibrants. Sample preparation Extraction conditions: 1 g of homogenized sample was extracted with 6 ml of 2-mM ammonium acetate in methanol using an Ultra-Turrax device. The crude extract was then filtered and diluted up to 1 ml with 5-mM ammonium acetate in water prior to injection. An organic mandarin sample was used to produce a matrix matched calibration curve and a previous European ring-test FV-13 sample was analyzed using European Commission proficiency tests for pesticide residues in fruits and vegetables (FV-13 Mandarin Homogenate, 211). Spiking protocol Organic samples were homogenized and 1 g was extracted with 6 ml of 2-mM acetate ammonium in methanol/water (95:5; v/v) solution. Then 5 ml and 3 ml of raw extract were transferred to six volumetric flasks. For the spiking of.1,.5, and.1 mg/kg levels, 5, 25, and 5 µl respectively of a mix solution was prepared containing the targeted pesticides at.1 µg/ml. For the higher levels of.2,.5, and 1 mg/kg, a mix solution of 1, 25, and 5 µl respectively was prepared containing the targeted pesticides at 1 µg/ml. Then the final volumes were adjusted to 5 ml with a 5 mm ammonium acetate in water/methanol (9/1;v/v). Illustration of the Selectivity of Collision Cross Section Ion Mobility Screening for the Analysis of Pesticide Residues in Food Using ionkey/ms 125
128 Chromatographic method Starting mass of crop sample Crop equivalent in the final extract Spiking concentration (mg/kg) Solution concentration (ng/ml) Dilution factor applied during the extraction procedure ACQUITY UPLC 1 g.1 g/ml.1 1 x1 ikey 1 g.1 g/ml.1.1 x1 Table 1. Spiking concentrations, solution concentrations, and dilution factors applied using the Granby extraction method for UPLC and ikey comparison. Matrix comparison Different injection volumes and sample dilution on column loadings have been used in order to generate extrapolated comparative results (Table 2). For the ionkey/ms reduction of matrix suppression studies, samples were diluted using 25 water:75 acetonitrile. Parameter Chromatographic mode and sample loading details ikey UPLC Injection solvent composition 25(H2):75(MeCN) MeOH Dilution factor applied to the final extract X1 X1 Spiking concentration (mg/kg) 1.1 Pesticide solution concentration 1 ng/ml 1 ng/ml in the final extract (ng/ml) Matrix load (ng/ml).1 ng/ml.1 ng/ml Injection volume (μl) 2 μl 5 μl Loop size (μl) and injection mode 2 μl 5 μl On column mass (pg) 2 pg 5 pg Table 2. Parameters used for the direct comparison of the ikey and UPLC chromatographic systems in matrix extraction. An ikey Separation Device, Part No: (Figure 1), incorporates a 1.7 µm, ACQUITY UPLC BEH C18, stationary phase in a 15 μm diameter separation channel. The ikey temperature was set to 45 C and the eluent from the separation channel flows directly to an integrated ESI emitter. All microfluidic, gas, and electrical connections are automatically engaged when the ikey is inserted into the source enclosure and locked into position. PCA ikey Separation Device Analytical Channel IMS calibration T-Wave ion mobility calibration was performed using previously determined CCS values for polyalanine. Ion mobility calibration was performed using polyalanine and a travelling wave nitrogen buffer gas. The polyalanine ( TW CCS) values were previously generated using an He drift tube derived calibrant species for the CCS calibration process, and software conversion from N2 to He values were performed. Therefore the collision cross sections described in this study are TW CCSHe values. 3 At later stages of the project, in order to develop a CCS screening workflow, ΩN2 drift tube derived polyalanine CCS values in positive and negative modes were used for the CCS calibration process, hence TW CCSN2 Post-Column Addition Channel were generated. 4 Figure 1. ionkey/ms source and ikey separation device incorporating fluidic/electronic connections and ionization emitter. 126 Illustration of the Selectivity of Collision Cross Section Ion Mobility Screening for the Analysis of Pesticide Residues in Food Using ionkey/ms

129 RESULTS AND DISCUSSION The study discussed formed part of a project to develop a pesticide CCS screening workflow, where the feasibility of CCS screening was compared across five Waters ACQUITY UPLC I-Class and SYNAPT HDMS systems. The assay is based on the analysis of sample extracts, matrix matched calibrants (pear, ginger, leek and mandarin), and quality control samples generated for an EU-RL (European Union Reference Laboratory) proficiency test using the ionkey/ms system. The system was comprised of a nanoacquity UPLC System, a SYNAPT G2-Si Mass Spectrometer, an ionkey Source, and the ikey Separation Device which were all controlled using MassLynx MS Software. Initially, ion mobility data was acquired using the ionkey/ms Source, for a series of solvent standard mixtures. These were utilized to generate retention time information and CCS measurements for the ikey pesticide library within UNIFI. These measurements were subsequently used to enable the correct identification of the pesticide residues in the matrix matched samples and proficiency samples. The results were compared to those previously obtained, where analysis was performed using conventional UPLC with ion mobility MS. Previous studies have shown the benefits of CCS screening, including spectral cleanup, avoidance of false positives, and discovery of pesticide protomers. 5-7 Using ionkey/ms, when comparing to the previous UPLC-IM-MS study, the results have shown gains in both sensitivity and signalto-noise with excellent linearity correlation coefficients obtained for the majority of matrix matched calibrants (r 2.95). Gains in sensitivity have enabled matrix dilution to be performed, and the detection of 1 pg/μl on column to be obtained, where both precursor ion and ion mobility product ions have been obtained as shown in Figure 2 for tetraconazole. Figure 3 shows example linearity plots and correlation coefficients obtained for pesticides in the mandarin matrix matched samples analyzed using ionkey/ms ion mobility. Figure 2. UNIFI Software Component Summary showing the response obtained for pesticide tetraconazole at 1 pg/μl using ionkey/ms with ion mobility. Retention time and drift time aligned precursor ion and ion mobility product ion spectra are presented, with corresponding extracted mass chromatograms. Observed CCS values and CCS errors are presented along with retention time. Fenhexamid r 2 =.999 Pencycuron r 2 =.997 Tetraconazole r 2 =.993 Thiacloprid r 2 =.999 Figure 3. Correlation coefficients obtained for pesticides in mandarin matrix matched sample analyzed using ionkey/ms with r 2 =.99 (.1 to 1 pg/µl) using ionkey/ms. Illustration of the Selectivity of Collision Cross Section Ion Mobility Screening for the Analysis of Pesticide Residues in Food Using ionkey/ms 127

130 A major point of discovery during this ionkey/ms CCS screening study came from using the added selectivity of CCS measurements obtained during UPLC ion mobility pesticide residue assays. In this study, the previously determined CCS values were used as an identification point to rapidly determine the retention times of the pesticide solvent standards and identify the residues present in a previous proficiency sample. The same chromatographic gradient was employed for the ikey and UPLC chromatography. However the resultant retention times were not the same; hence it was necessary to create an applicable pesticide library in UNIFI containing the ikey retention times. The conventional approach would require initial manual data interrogation to generate the ikey retention time library. In this case the previously developed UPLC CCS values could be utilized, where the selectivity of CCS could be used to identify the analytes of interest, in combination with precursor ion mass. The ionkey/ms ion mobility data was screened using an accurate mass measurement tolerance of 1 ppm and a CCS tolerance of 1 for the target residues. Since the ikey retention times were not known, a 3 minute retention time window was applied, i.e. the same time as the chromatographic run. The results obtained can be seen in Figure 4, where for the EU RL proficiency test sample FV-13, 81 residues have been detected under these screening parameters. Thereafter the processed data was filtered using a 2 CCS measurement tolerance and a response threshold of 15 counts; hence the ionkey/ms retention times for the pesticide solvent standards were rapidly determined, as well as the residues present in the FV-13 proficiency sample. Figure 4. ionkey/ms ion mobility results for EU RL proficiency test FV-13 pesticide residue screen using an accurate mass measurement tolerance of 1 ppm and CCS tolerance of 1 for the target residues. To determine the unknown ikey retention times, a 3 min retention time window was applied, 81 observations made (highlighted in red). 128 Illustration of the Selectivity of Collision Cross Section Ion Mobility Screening for the Analysis of Pesticide Residues in Food Using ionkey/ms

131 In this preliminary study, those compounds where CCS values had not been determined and entered into the UNIFI library were removed using the CCS filter. Using this approach, it was possible to rapidly determine the presence of the expected eight detected pesticide residues in the sample analyzed, as can be seen in Figure 5. The initial 81 analytes observed using wide tolerance parameters of 1 ppm and a 3 min retention time window, was reduced to 9 when a tolerance filter using the selectivity of CCS was applied to the processed data. There was no requirement to reprocess the data. Figure 5. IonKey/MS ion mobility results for EU RL proficiency test FV-13 pesticide residue screen. A data filter comprising 2 CCS error and threshold response was applied with nine observations made (highlighted in red). Using mixtures of solvent standards, it was possible to rapidly determine the retention times using ikey chromatography. Once retention times were determined, it was possible to filter the data using a.2 min retention time tolerance window, a 1 ppm mass accuracy tolerance. and a CCS error tolerance of 2. No false positive or negative detections occurred for the expected eight detected compounds. This clearly shows the benefits and selectivity that can be provided using CCS measurement, where the pesticides have been identified based on their accurate mass and collision cross section. The expected retention times for the observed residues in proficiency sample FV-13 are of the order of 7 minutes different to those observed. For example, different chromatographic retention times compared for imazalil (UPLC 5.8 /ikey mins) and thiabendazole (UPLC 2.34/iKey 8.58 mins) were obtained. The power of CCS selectivity was confirmed from its utilization to determine retention times to be entered into the ikey pesticide screening library in UNIFI. The benefits of ion mobility selectivity are further illustrated in Figures 4 and 5, where imazalil has been selected and the precursor ion and fragmentation spectra are presented. For Figure 4, the retention time aligned fragmentation spectra are presented at minutes, which incorporates a large number of chromatographically coeluting components. However, in Figure 5, where the retention time aligned and ion mobility drift time aligned data is selected (11.29 mins/2.92 ms), it can be seen that resolution provided by ion mobility results in highly selective data. The spectra have effectively been cleaned up, because the components that were chromatographically coeluting with imazalil, are now ion mobility resolved. As a result, it is possible to generate ion mobility specific product ions for all analytes detected in the acquisition. Illustration of the Selectivity of Collision Cross Section Ion Mobility Screening for the Analysis of Pesticide Residues in Food Using ionkey/ms 129


132 Using ionkey/ms in combination with ion mobility it has been possible to obtain precursor ion and mobility product ion spectra for 2 pg on column loadings for pencycuron, as shown in Figure 6. Accurate mass measurement and diagnostic ion mobility product ions provide confidence in identification. However, it can be seen that pencycuron has also been detected at 2 fg on column. Confidence can still be had where only a mono isotopic peak has been observed, because CCS (.51) provides an additional information point to the.86 ppm mass measurement error determined. The improved ionization efficiency, increases in sensitivity, and improved sensitivity achieved on a Q-Tof mass spectrometry platform coupled to ionkey has been shown. 1 Pencycuron 2pg on column Pencycuron 2fg loaded on column Figure 6. Accurate mass measurement (<1 ppm), precursor ions, ion mobility product ions, and collision cross sections (<1) for confidence in identification, for pencyuron detected at 2 pg and 2 fg on column. An example of the increase in S/N (x4) and response (x3) using the ikey/synapt G2-Si System is presented in Figure 7 for indoxacarb, as observed in EU RL proficiency sample FV-13. The response gains take into account the injection volumes and x1 sample dilution performed for the ionkey/ms pesticide residue analysis performed. With its enhanced selectivity and sensitivity, this approach has the potential to be used to review and confirm whether suspected MRL violations may have occurred. ionkey/ms X1 Dilution Inj Vol=2 µl Indoxacarb S/N = 4423 Response = 277 UPLC/MS Undiluted Inj Vol=5 µl Indoxacarb S/N = 155 Response = 224 Figure 7. Comparison of S/N and response for UPLC/MS and ionkey/ms for indoxacarb, where X4 S/N and X3 response improvements have been obtained over UPLC using ionkey/ms. 13 Illustration of the Selectivity of Collision Cross Section Ion Mobility Screening for the Analysis of Pesticide Residues in Food Using ionkey/ms
133 CONCLUSIONS IonKey/MS with ion mobility offers some unique advantages for profiling complex matrices: Spectral cleanup Collision cross section measurements provide unique selectivity and added confidence in identifcation. Ion mobility selectivity has been illustrated, where accurate mass measurement and CCS measurement have been used to successfully detect pesticide residues in previous EU RL proficiency test sample FV-13. Sensitivity gains and improved transmission and ionization efficiency of the ionkey Source have enabled mass measurement of pencycuron with CCS determination providing an additional identification point for monoisotopic peak information at 2 fg on column. Linearity for the pesticides using matrix matched standards, produced correlation coefficients of >r 2 =.95. For the analyst, this advanced ionkey Technology, brings the benefits of microfluidic chromatography to the required routine use platform in combination with routine ion mobility screening. References 1. M McCullagh, S Goscinny, V Hanot, R T Worster, and D Douce. Exploring the Benefits and Potential of ikey Microfluidic Chromatography and Time-of-Flight Mass Spectrometry for Pesticide Residue Analysis. Waters Application Note No en. October, The use of Collision Cross Section (CCS) Measurements in Food and Environmental Analysis. Waters Technical Note No en. April Section2Database/Peptides/polyaminoacid_cs.htm. 4. M F Bush, I D Campuzano, and C V Robinson. Ion Mobility Mass Spectrometry of Peptide Ions: Effects of Drift Gas and Calibration Strategies. Anal Chem. 84: , M McCullagh, G Cleland, V Hanot, J Williams, S Goscinny. Collision Cross Section a New Identification Point for a Catch All Non Targeted Screening Approach. Waters Application Note No en, June, M McCullagh, V Hanot, and S Goscinny. Use of Ion Mobility Spectral Cleanup and Collision Cross Section Values to Increase Confidence and Efficiency in Pesticide Residues Screening Strategies. Waters Application Note No. 7258en. June, M McCullagh, D Eatough, V Hanot, and S Goscinny. Discovery of Pesticide Protomers Using Routine Ion Mobility Screening. Waters Application Note No en, June, 214. Waters, ACQUITY UPLC, UPLC, SYNAPT, UNIFI, MassLynx, HDMS, nanoacquity, and The Science of What s Possible are registered trademarks of Waters Corporation. ikey, ionkey, ionkey/ms, Q-Tof, and T-Wave are trademarks of Waters Corporation. All other trademarks are the property of their respective owners. 215 Waters Corporation. Produced in the U.S.A. June EN AG-PDF Waters Corporation 34 Maple Street Milford, MA 1757 U.S.A. T: F: Illustration of the Selectivity of Collision Cross Section Ion Mobility Screening for the Analysis of Pesticide Residues in Food Using ionkey/ms 131
134 ionkey/ms Ion Mobility: A New Approach to Authentication and Routine Screening of Ginsenoside Isomers in Functional Food Products Michael McCullagh, Ramesh Rao, John Chipperfield, and David Douce Waters Corporation, Wilmslow, UK APPLICATION BENEFITS Novel approach for authentication profiling. Unique, non-targeted screening workflow to determine the presence of ginsenoside markers, including pairs of ginsenoside isomers. Data processing capability of the UNIFI Scientific Information System can routinely be used to enable characteristic assignment for ginsenoside isomers. ionkey/ms ion mobility TW CCSN2 screening has the potential to produce significant cost saving with reduced consumption of solvents and high purity standards. Significant cost savings through reduced consumption of solvents and high purity standards WATERS SOLUTIONS ionkey/ms ACQUITY UPLC M-Class System Post Column Addition (PCA) ikey Separation Device Waters Ion Mobility Mass Spectrometry Systems UNIFI Scientific Information System KEY WORDS microflow, ginsenoside isomers, CCS, ion mobility, spectral clean up, enhanced sensitivity, authenticity, functional food, dietary supplements INTRODUCTION The potential improvements that can be obtained using microflow liquid chromatography and mass spectrometry in a positive ion mode assay to analyze pesticides in food commodities have previously been discussed. 1 The benefits of using the ACQUITY UPLC M-Class System with ion mobility mass spectrometry (IM-MS) to authenticate and routinely screen ginsenoside isomers in functional food products has also been previously reported. 2 The Post Column Addition (PCA) ikey Separation Device can be used to add solvent after chromatographic separation. This enables much more analytical flexibility including the ability to increase sensitivity for negative mode at microflow and flow rates that use gradients containing a high percentage of aqueous solvent. The addition of organic solvent (in this case IPA), via the post column addition flow path improves the sensitivity of the assay. The analysis of ginsenosides in food commodities is a suitable assay to explore the feasibility of analyzing complex samples using the PCA ikey separatiuon Device in negative mode, since the targeted ginsenosides ionize efficiently in negative mode. Simultaneously IM nitrogen-based traveling wave collision cross section ( TW CCSN2) screening reproducibility can be explored in combination with time-of-flight mass spectrometry s full spectral acquisition. Utilizing microflow chromatography for this application area has many potential benefits, since recent legislative focus has prompted new methods for the analysis of active compounds in these products. While the growing global popularity of nutraceutical and functional food products continues to increase, for the European Union, current legislation aims to protect consumers from possible damaging side effects of over-the-counter herbal medicines and functional foods that are intended to deliver therapeutic benefits. EU Directive 24/24/EC, came into full effect on 3 April 211. Ginseng is one of 11 species of slow-growing perennial plants with fleshy roots, that belong to the genus Panax of the family Araliaceae. The most abundant forms of ginseng Panax ginseng (Korean Ginseng), P. Japanoicus, and P. Quinquefolium (American Ginseng) grow in North America. Ginseng is believed to offer different therapeutic benefits. Ligor et. al. discussed CNS stimulant activity, hypogylcemic properties, and the sedative effects of American Ginseng

135 For each species it is believed that the ginsenoside and polysaccharides content are responsible for the biological activity of products produced from the roots and leaves of ginseng species. Figure 1 shows the structures of the ginsenosides screened in this assay, which are part of a diverse group of steroidal saponins. Rb1 OH HO OH HO OH O OH O O OH H O 3 C H OH H HO CH 3 H HO O CH CH 3 H3C 3 CH OH HO O 3 H O O H 3 C CH 3 Rb2 HO HO O O H O OH 3 C H HO H HO CH 3 H HO O CH 3 H3C CH 3 OH HO O H O O H 3 C CH 3 HO OHH OH OH O OH OH CH 3 HO HO OH HO O O Rc2 HO OH OH HO O O O H O OH 3 C HO CH 3 O CH 3 H3C CH 3 O H 3 C CH 3 OH OH OH OH CH 3 Rd HO HO O OH HO O O O H 3 C HO O OH O OH H 3 C OH H H HO CH 3 H CH CH 3 H3C 3 CH 3 H CH 3 HO OH OH HO OH OH HO Re O O OH H 3 C H H HO OH OH Rg2 OH H 3 C OH H CH 3 CH 3 CH 3 H CH 3 CH 3 H CH 3 H3C CH 3 HO H H 3 C CH 3 O O OH O OH HO OH O HO CH 3 OH CH 3 Rf CH 3 CH 3 CH 3 H C OH 3 H OH H H CH 3 CH 3 HO H H 3 C CH 3 O O OH O OH HO OH O OH HO OH Rg HO O OH O H OH 3 C OH HO CH 3 CH CH 3 H3C 3 HO CH 3 H 3 C CH 3 O O OH HO OH OH H CH 3 HO H H 3 C CH 3 O O O HO OH O HO CH 3 OH OH OH Figure 1. Illustration of rotating threedimensional conformation of an ion and average collision cross section (CCS) (shadow). Structures of the ginsenosides profiled using microflow UPLC ion mobility mass spectrometry and CCS screening. PCA ikey Separation Device Analytical Channel Post-Column Addition Channel Figure 2. ionkey/ms source and PCA ikey Separation Device incorporating fluidic/electronic connections and ionization emitter. Ion mobility is a rapid orthogonal gas separation phase technique that allows another dimension of separation to be obtained within an LC timeframe. Compounds can be differentiated based on size, shape, and charge. ionkey/ms IM-MS is a combination of high resolution mass spectrometry and high efficiency ion mobility based measurements with UPLC separations that offers some unique advantages for profiling complex mixtures. In this application note, we investigate the use of IM separation in combination with microflow chromatography to provide a route to specific and unambiguous identification of ginsenosides, where a PCA ikey Separation Device has been used to perform the assays using negative mode ionization. A PCA ikey Separation Device, (p/n ), shown in Figure 2, incorporates a 1.7 µm, ACQUITY UPLC BEH C18, stationary phase in a 15 μm diameter separation channel. The ikey temperature was set to 4 C, and the eluent from the separation channel flows directly to an integrated ESI emitter. All microfluidic, gas, and electrical connections are automatically engaged when the ikey is inserted into the source enclosure, and locked in place. The PCA ikey incorporates an additional channel that enables post column addition of IPA solvent. The makeup solvent was configured to be delivered from channel A of the MS system fluidics for this study. ionkey/ms Ion Mobility: A New Approach to Authentication and Routine Screening of Ginsenoside Isomers in Functional Food Products 133
136 E X P E R IM E N TA L LC conditions LC system: Mobile phase A: Mobile phase B: Gradient: ACQUITY UPLC M-Class Water (.1 formic acid) Acetonitrile (.1 formic acid) Time (min) Flow rate A B Flow rate: Injection volume: Column: ikey column temp.: 4 C MS conditions MS system: Ionization mode: Capillary voltage: Sample cone voltage: Lockmass: ikey at 2. µl/min 1 µl (full loop) ikey, BEH C 18 PCA Separation Device, 13Å, 1.7 µm, 15 µm x 5 mm SYNAPT G2-Si ESI- 2.6 kv 3 V Leucine enkephalin LockCCS: [M-H] - = Acquisition range: Acquisition rate: 5 to 12 m/z 1 spectra/sec Collision energy ramp: 3 to 7 ev Resolution:, FWHM (Res Mode) Sample description Korean ginseng tea (extracted into 2 ml of H2O x 1 dilution), ginkgo biloba+red panax extract (x1 dilution), red panax extract (x1 dilution), and ginsenoside standards (1 pg/μl). RESULTS AND DISCUSSION A PCA ikey Separation Device, coupled with IM-MS was successfully used to profile ginsenosides Rb1, (Rb2, Rc), (Rd, Re), (Rf, Rg1), and Rg2. IPA at 1 μl/min flowed into the PCA channel and a MS ES voltage of 2.6 kv was applied. IM-MS was used to generate TW CCSN2 values, precursor ion accurate mass, accurate mass mobility product ions, and retention times. Using TW CCSN2 measurements can increase targeted screening specificity. A ginsenoside CCS scientific library within UNIFI was previously generated. 2 This allows the expected and previously determined CCS values to be utilized to screen and confirm the presence of isomeric flavonoid markers. Three extracts: gingko biloba+red panax, red panax, and Korean ginseng were screened against the library in order to determine their presence, and unequivocally identify isomeric ginsenosides. CCS values (derived from ion mobility drift times) are used as an identification parameter that can distinguish ginsenoside isomers, as well as to profile unknowns. Default IMS parameters: IMS T-Wave pulse height: IMS gas flow: IMS T-Wave velocity ramp: Start=1 m/s End=3 m/s 4 V 9 ml 134 ionkey/ms Ion Mobility: A New Approach to Authentication and Routine Screening of Ginsenoside Isomers in Functional Food Products

137 In Figure 3, the ionkey/ms IM negative mode base peak ion chromatogram obtained for analysis of 1:1 diluted Korean ginseng tea extract is shown. Figure 3 depicts a conventional view of the complex sample profiled. However, in Figure 4 the ionkey/ms IM negative mode plot of the drift time (ion mobility resolution), versus the retention time for 1:1 diluted Korean ginseng extract is presented. Leveraging the unique software functionality of UNIFI. Figure 4 visually illustrates how an orthogonal separation to the chromatographic separation is achieved with ion mobility, and the increased peak capacity that is possible. The retention time region between 5 and 14 minutes in Figure 4 shows there are a large number of compounds that are now resolved, compared to the same region on the conventional base peak ion extracted mass chromatogram shown im Figure 3. The ion mobility data viewer in UNIFI enables investigative interaction with acquired ion mobility data. UNIFI incorporates many easy-to-use features, such as Zoom to Component and Bookmark, that enable the same investigative interrogation of data to be applied across many acquisitions. It is possible to select any one of these components and generate the drift plot, mass spectrum, and extracted mass chromatogram. Figure 3. ionkey/ms IM negative mode base peak ion chromatogram obtained for analysis of 1:1 diluted Korean ginseng extract. Figure 4. ionkey/ms ion mobility negative mode plot of drift time (ion mobility resolution) versus retention time for 1:1 diluted Korean ginseng extract. ionkey/ms Ion Mobility: A New Approach to Authentication and Routine Screening of Ginsenoside Isomers in Functional Food Products 135
138 The true complexity of the profiled sample is illustrated when both ion mobility and UPLC chromatographic resolution are combined. Ginsenoside isomers Rg1 m/z (green) and Re m/z (brown) in Figure 5 are chromatographically coeluting at 8.58 minutes. Figure 5 shows the combined precursor and fragmentation spectra data of the two coeluting ginsenoside components. Figure 5. Retention time aligned precursor and fragmentation spectra for Rg1 ginsenoside at m/z (in green) coeluting with Re ginsenoside at m/z (in brown). In Figure 6 the single component retention time aligned and drift time aligned ion mobility product ion spectrum for the ginsenoside isomer Rg1 is presented, further illustrating the utility of ion mobility separations. Figure 6. Retention time (8.58 mins) and drift time (7.99 ms) aligned precursor and ion mobility product ion spectrum for Rg1 ginsenoside at m/z (in green). 136 ionkey/ms Ion Mobility: A New Approach to Authentication and Routine Screening of Ginsenoside Isomers in Functional Food Products


139 In Figure 7 the ion mobility separated ginsenoside Re:A and ginsenoside Rg1:B mobility peaks are presented. Here, the single component precursor/ion mobility product ions are obtained, even though they chromatographically coelute with other compounds present in the complex ginseng extract. TW CCSN2 measurements can increase confidence in identification. The results are summarized in the UNIFI Component Summary shown in Figure 8, where the values obtained for the profiling of Korean ginseng are presented. For the marker ginsenoside isomer pairs (Rb2, Rc), TW CCSN2 measurements of Å 2 /344.5 Å 2, (Rd, Re), Å 2 / Å 2, and 31.6 Å 2 /292.3 Å 2 (Rf, Rg1) were obtained. The TW CCSN2 measurement errors were typically <2, when compared to the study performed using UPLC-IM-MS in This further confirms that it is possible to confidently distinguish, the marker isomer pairs of ginsenosides from the extracts of the specified products analyzed, using TW CCSN2 measurements. B A B A Figure 7. Illustration with expanded view of ion mobility separated ginsenoside Re:A and ginsenoside Rg1:B that are chromatographically coeluting. This approach offers unique selectivity for profiling complex mixtures. The results obtained clearly show the benefits of using CCS measurements and the combined peak capacity of ionkey/ms with IM. Coeluting analytes and isomers have been resolved, as well as unequivocally identified in the three extracts profiled. In addition, it is possible to acquire the cleaned up mobility specific product ion spectra, that are mobility resolved from coeluting components. This approach has the potential to change the scope of authentication profiling. The added confidence in making identifications using TW CCSN2 measurements has the potential to reduce the need to use expensive high purity standards, where assay confirmation relies on retention time and accurate mass measurement. The cost of purchasing 1 mg of each standard for the assay performed totalled 2483., a significant cost undertaking. Cost savings across many application areas can be made. Figure 8. UNIFI Component Summary obtained for Korean ginseng extract. CCS measurements have been obtained within 2 of the ginsenoside CCS library created November 213. ionkey/ms Ion Mobility: A New Approach to Authentication and Routine Screening of Ginsenoside Isomers in Functional Food Products 137
140 CONCLUSIONS UPLC and ionkey/ms ion mobility mass spectrometry have been used to screen and determine ginsenoside Rb1, (Rb2, Rc), (Rd, Re), (Rf, Rg1), and Rg2 phytochemical makeup in Korean ginseng, gingko biloba+red panax, and red panax extracts. Isomeric ginsenosides have been differentiated using IM-MS and TW CCSN2 measurements. TW CCSN2 screening can be used to profile sample makeup and uniquely differentiate ginsenoside isomer composition, increasing confidence that ginsenosides are not missed due to chromatographic coelution. TW CCSN2 measurements of <2 have been obtained routinely, when compared to a library produced in October 213. References 1. M McCullagh, S Goscinny, V Hanot, R Tyldesley Worster, and D Douce. Exploring the Benefits and Potential of ikey Microfluidic Chromatography and Time-of-Flight Mass Spectrometry for Pesticide Residue Analysis. Waters Application Note No en, October M McCullagh, R Lewis and D Douce. UPLC Ion Mobility Mass Spectrometry: A new approach to authentication and routine screening of ginsenoside isomers in functional food products. Waters Poster No. PSTR Presented at ASMS Baltimore, June, T Ligor, A Ludwiczuk, T Wolski, B Buszewski. Isolation and determination of ginsenosides in American ginseng leaves and root extracts by LC-MS. Anal Bioanal Chem. 383(7 8):198 15, December 25. ionkey/ms offers a significant improvement in sensitivity, a reduction in matrix effects, and cost savings through the reduced consumption of solvents and high purity standards. Waters, SYNAPT, UNIFI, MassLynx, ACQUITY UPLC, UPLC, and The Science of What s Possible are registered trademarks of Waters Corporation. T-Wave, ionkey/ms, and ikey are trademarks of Waters Corporation. All other trademarks are the property of their respective owners. 215 Waters Corporation. Produced in the U.S.A. June EN AG-PDF Waters Corporation 34 Maple Street Milford, MA 1757 U.S.A. T: F: ionkey/ms Ion Mobility: A New Approach to Authentication and Routine Screening of Ginsenoside Isomers in Functional Food Products
141 Pesticide Screening of Food Samples Using the ionkey/ms System Gregory T. Roman, Jay S. Johnson, Gareth Cleland, Dimple Shah, Lauren Mullin, and Jennifer A. Burgess Waters Corporation, Milford, MA, USA APPLICATION BENEFITS The rugged and easy-to-use ionkey/ms System greatly facilitates the utilization of micro-lc in high-throughput food safety laboratories. At least a 1x reduction in solvent consumption over existing 2.1 mm I.D. chromatography methods. Microliter scale sample and internal standard consumption imparts additional laboratory savings. Improvement of signal-to-noise ratio for pesticides, with an average of an 8x improvement in sensitivity over conventional 2.1 mm I.D. chromatography methods. WATERS SOLUTIONS ionkey/ms System ikey BEH C 18 Separation Device ACQUITY UPLC M-Class System Xevo TQ-S MassLynx Software TargetLynx Application Manager DisQuE QuEChERS Dispersive Solid-Phase Extraction INTRODUCTION Microfluidic technology offers the capability to integrate several fluidic and instrumental components onto a single device. The process of microfluidic integration has several advantages for the micro-lc user. First, the micro-lc fittings either between the column and ESI source, or between the column and injection valve, must be precisely fitted. Even micrometers of difference between the transfer line and the column can equate to several µls of void volume, and at µl/min flow rates can result in large deviations in retention time or peak width due to dispersion. The ability to micromachine and integrate the post-column connections on a planar microfluidic device offers the simplicity of never having to replace or change post-column lines or ESI tips. Secondly, the clamp-on microfluidic fittings make it easy to replace the microfluidic ikey Separation Device in a matter of seconds. This allows for trouble-free system maintenance, but it can also facilitate the process of method development with different column chemistries. In addition, the integrated heating elements, memory, and ESI tips require minimal programming, providing control of LC-gradients and ESI spray in a customized environment. Operating at the micro-lc scale provides a number of advantages for minimizing laboratory solvent consumption. For pesticide screening applications, the ionkey/ms System utilizes a scaled down flow rate of 2.3 µl/min. This substantially lower rate of solvent consumption and consequential reduction of hazardous waste removal can result in significant cost savings to laboratories. In addition to the reduction in solvent consumption, there are also significant improvements in sensitivity for many analytes. In this application note, a mixture of pesticides was spiked into food matrices of varying levels of complexity. Initial work was undertaken to compare the ikey Separation Device with a conventional 2.1 mm I.D. ACQUITY UPLC Column. For the 5 pesticides individually assessed, the sensitivity was improved by an average of 8x over the 2.1 mm format. The ionkey/ms System was further tested for robustness and performance with a range of matrices. KEY WORDS IonKey/MS, pesticide, food safety, microfluidic 139

142 E X P E R IM E N TA L UPLC conditions LC system: ACQUITY UPLC M-Class System Separation device: ikey BEH C 18 Separation Device, 13Å, 1.7 µm, 15 µm x 1 mm (p/n ) ikey temp.: 45 C Injection volume: 5 µl Flow rate: 2.3 µl/min Mobile phase A: Water with 1 mm ammonium acetate, ph 5. Mobile phase B: Methanol with 1 mm ammonium acetate, ph 5. Weak needle wash: Water Strong needle wash: Acetonitrile Seal wash 9:1 Water:acetonitrile Gradient: Time Flow (min) (µl/min) A B Curve initial initial Sample preparation A standard QuEChERS AOAC (27.1) extraction protocol was performed using the DisQuE Quechers, 9 mg MgSO4 & 15 mg PSA, 15 ml Tube (p/n ), first by homogenizing the commodity in a blender, followed by weighing 15 g of the commodity into a vial. Next, 15 ml of extraction buffer consisting of acetonitrile with 1 acetic acid was added to the commodity along with pouch 1 of the DisQuE salt mixture. Vials were shaken for approximately 1 min and centrifuged at 15 rcf for 1 min. The supernatant was removed and filtered through a.2 µm PFTE filter prior to dry down and reconstitution in mobile phase. Standards with 2 pesticides were constituted in extracted food matrix at levels ranging from 1 ppt to 1 ppb with 11 intervals. Matrix blanks from the extracted food matrix were collected along with solvent blanks. These blanks were used to identify the existing presence of pesticides in the commodity. MS conditions MS system: Xevo TQ-S Acquisition mode: MRM Ionization mode: ESI + Capillary voltage: 4. kv Source temp.: 12 C Cone voltage: Variable Dwell time:.3 to.1 s 14 Pesticide Screening of Food Samples Using the ionkey/ms System
143 RESULTS AND DISCUSSION In order to determine the feasibility of the ionkey/ms System for pesticide residue analysis, a method that incorporated 36 MRM transitions was employed, even though not all of the pesticide standards for the method were spiked. This enabled assessment of the data quality that would be obtained with a typical multi-residue pesticide method. Figure 1 illustrates a total ion chromatograms (TIC) containing 99 pesticides in onion matrix separated and detected using the ionkey/ms System. Several matrices were analyzed with this system including infant formula, summer squash, onion, and tomato. Peak widths at half height were similar to the 2.1 mm separations ranging from 3 to 6 s. However, the sensitivity of the ionkey/ms System was on average 8x greater compared to regular analytical columns. The improvement in sensitivity is due to the improved electrospray at low flow and the reduced dilution that occurs within the ikey Separation Device. These two factors help increase the number of ions entering the Xevo TQ-S, resulting in improved sensitivity. The sensitivity enhancement observed in the ionkey/ms System is illustrated in Figure 2 and Figure 3. Figure 2 shows a series of six pesticides in infant formula displaying different improvements in sensitivity over 2.1 mm I.D. chromatography. The differences in ionization efficiency are based on molecular structure, hydrophobicity, and acidbase functionality. Pesticides that have non-polar functionalities are driven towards the surface of the droplet. If pesticides reside at the surface of a droplet for longer periods of time they are more likely to enter the gas phase as an ion. The greatest improvement was observed with fenpropimorph with a 25x improvement seen in infant formula. In Figure 3, MRM chromatograms of four different pesticides are displayed with the ikey peaks Separation Device overlaid with the 2.1 mm I.D. peaks. As can be seen from these chromatograms, the ionkey/ms System offers improved signal-tonoise ratio over the 2.1 mm I.D. chromatography. 1 Time Figure 1. Overlay showing TIC chromatograms of 99 pesticides spiked into an onion extract; concentration of pesticides was 1 µg/l. Pesticide Screening of Food Samples Using the ionkey/ms System 141

144 Sensitivity Improvement over 2.1 mm I.D. chromatography Figure 2. Comparison of signal-to-noise ratio observed between a series of six pesticides in baby formula measured using the ionkey/ms System and 2.1 mm I.D. chromatography. The concentration of pesticides was 1 µg/l. 1 Fenpropimorph 1 Chlortoluron Time Time Buprofezein 1 Metobromuron Time Time Figure 3. Superimposed chromatograms of four pesticides showing a comparison between the ionkey/ms System and 2.1 mm I.D. chromatography. The concentration of pesticides was 1 µg/l. The dynamic range of the ionkey/ms System was also shown to be greater than 3 orders of magnitude for the majority of compounds investigated here. Figures 4A and 4B show the linearity of the calibration curves for dicrotophos and flutolanil, which demonstrated R 2 values >.99. The MRM chromatograms of both the primary and secondary ions for both dicrotophos and flutolanil at their LOQs (2.5 and 12.5 ng/l, respectively) are also shown. The calculated peak-to-peak, signal-to-noise (S/N) for the dicrotophos primary ion was 12 and 35 for flutolanil. 142 Pesticide Screening of Food Samples Using the ionkey/ms System
145 Flutolanil calibration curve 12.5 ppt flutolanil, onion matrix Compound name: Flutolanil Correlation coefficient: r =.99868, r 2 = Calibration curve: * x Response type: External Std, Area Curve type: Linear, Origin: Exclude, Weighting: Null, Axis trans: None 12pt5 ppt 1 Flutolanil F244:MRM of 2 channels,es > e min Response pt5 ppt 1 Flutolanil F244:MRM of 2 channels,es > e Conc min Figure 4A. (Left) Linearity plot of dicrotophos in onion matrix. (Right) MRM transition for the primary ion (peak-to-peak S/N of 12) and the secondary ion at 2.5 ng/l. Dicrotophos calibration curve 2.5 ppt dicrotophos, onion matrix Compound name: Dicrotophos Correlation coefficient: r = , r 2 = Calibration curve: * x Response type: External Std, Area Curve type: Linear, Origin: Exclude, Weighting: Null, Axis trans: None 2pt5 ppt 1 F99:MRM of 2 channels,es+ 238 > 112 Dicrotophos;7.71;139.83; e min Response pt5 ppt 1 F99:MRM of 2 channels,es+ 238 > 193 Dicrotophos 1.75e Conc min Figure 4B. (Left) Linearity plot of flutolanil in onion matrix. (Right) MRM transition for the primary ion (peak-to-peak S/N of 35) and secondary ion at 12.5 ng/l. Pesticide Screening of Food Samples Using the ionkey/ms System 143


146 Peak repeatability and robustness Microfabrication of fluidic connections allows for precise connections with limited to no dead volume, and limited variation from chip to chip. Using TrendPlot we plotted peak area and retention time reproducibility, shown in Figures 5 and 6. We found peak area and retention time reproducibility to be below 13 RSD and 1 RSD, respectively, for boscalid, flutolanil, chlortoluron, and dicrotophos at 1 µg/l in tomato matrix. In addition to investigating peak area and retention time reproducibility, we also investigated ruggedness of use. Number of injections Number of injections Number of injections Number of injections Figure 5. Peak area reproducibility for pesticide tomato matrix standards at 1 µg/l. Number of injections Number of injections Number of injections Number of injections Figure 6. Retention time reproducibility for pesticide tomato matrix standards at 1 µg/l. 144 Pesticide Screening of Food Samples Using the ionkey/ms System
147 After 1, injections of infant formula extract we found negligible increases in pressure and reproducible peak retention times. Figure 7 illustrates peak retention reproducibility of buprofezein and monocrotophos at injections 1, 5, and 1,. Injection #1 Monocrotophos Buprofezin 1 1 CONCLUSIONS The ionkey/ms System is a novel microfluidics-ms platform for rugged and easy-to-use micro-lc analysis of pesticides in food samples. The ikey Separation Device enables highly reproducible LC separations with comparable resolution to analytical scale LC-MS analysis. This was demonstrated in both peak area reproducibility and retention times for pesticides in a variety of matrices An average of 8x improvement in sensitivity over mm high-flow chromatography can help food and Injection #5 beverage laboratories meet the increasing demands of international regulatory agencies Low flow rates of 2.3 µl/min allow for 1x savings 1 1 in solvent consumption and costly hazardous Injection #1 waste disposal charges to improve a laboratory s bottom line Time Figure 7. MRM chromatograms of two pesticides, monocrotophos and buprofezin at 1 µg/l. Injections 1, 5, and 1, are shown (top to bottom). Waters, ACQUITY UPLC, Xevo, MassLynx, and The Science of What s Possible are registered trademarks of Waters Corporation. DisQuE, ionkey/ms, ionkey, ikey, TargetLynx, and TrendPlot are trademarks of Waters Corporation. All other trademarks are the property of their respective owners Waters Corporation. Produced in the U.S.A. January EN AG-PDF Waters Corporation 34 Maple Street Milford, MA 1757 U.S.A. T: F: Pesticide Screening of Food Samples Using the ionkey/ms System 145
148 Using the Routine Separation Dimension and Identification Criteria of ionkey/ms Ion Mobility to Enhance Specificity in Screening Complex Samples 1 M. McCullagh, 3 C. A. M. Pereira, 2 J. H. Yariwake, and 1 D Douce 1 Waters Corporation, Wilmslow, UK 2 Universidade de São Paulo, Instituto de Química de São Carlos, São Carlos, Brazil 3 Centro Universitario Central Paulista (UNICEP), Sao Carlos, Brazil APPLICATION BENEFITS Increased sensitivity produced using ionkey/ms can extend the dynamic range over which the benefits of ToF full spectral acquisition and ion mobility are used. Using ionkey/ms ion mobility in positive and negative ion modes, marker flavonoids have been detected at 1 fg/μl. ionkey/ms ion mobility CCS screening can be used as a viable approach to perform authentication profiling. Collision cross section (CCS) values have been generated to enable the routine characteristic assignment for 6-C/8-C flavonoid glycoside isomers (vitexin/ isovitexin) (orientin/isoorientin), which can be used as an additional identification point. WATERS SOLUTIONS ionkey/ms ACQUITY UPLC M-Class System Waters Ion Mobility Mass Spectrometry Systems UNIFI Scientific Information System ikey Separation Device KEY WORDS flavonoids, glycoside isomers, vitexin, isovitexin, orientin, isoorientin, microflow, ion mobility, authentication, profiling, functional food products, dietary supplements, Passiflora edulis, alata, caerulea, incarnata INTRODUCTION Legislative focus has resulted in the expansion of method development to support the analysis of active compounds in and authenticity of functional food products and dietary supplements. For example the European Union s Directive 24/24/EC came into full effect on 3 April 211. Hundreds of traditional herbal remedies were banned, as the EU directive aims to protect consumers from possible damaging side-effects of over-the-counter herbal medicines. Recent regulations allow only long-established and quality-controlled products to be sold. Manufacturers have to prove that their products are been made to strict standards and contain a consistent and clearly marked dose. ionkey/ms ion mobility mass spectrometry (IM-MS) can provide a route to specific and unambiguous identification at low detection levels. This technique offers some unique advantages for profiling complex mixtures. IM-MS combines high resolution mass spectrometry and high efficiency ion mobility based measurements, with enhanced sensitivity. IM-MS is a rapid orthogonal gas separation phase technique that allows another dimension of separation to be obtained within an LC timeframe. Compounds can be differentiated based on size, shape, and charge. A novel microflow technique using the ACQUITY UPLC M-Class System and IM-MS that leverages both positive and negative ionization has been developed to analyze the extracts of Passiflora edulis, alata, caerulea, and incarnata, shown in Figure 1. The genus Passiflora consists of approximately 45 species, a few of which are commercially exploited in functional food products such as teas and juices. These species contain flavonoids, one of the largest and most widespread classes of compounds which possess diverse pharmacological/biological properties. The target marker flavonoids ionize efficiently in positive and negative modes, enabling a positive/negative mode ionkey/ms comparison to be performed. Collision cross section measurements (CCS) can be used to produce routine unequivocal identification of marker flavonoid isomers in complex samples. 1 The profiles determined from the extracts can be used to confirm food commodity authenticity. 146
149 E X P E R IM E N TA L LC conditions LC system: Mobile phase: ACQUITY UPLC M-Class A: Water (.1 Formic acid) B: Acetonitrile (.1 Formic acid) Gradient: Time (min) Flow rate A B Flow rate: Injection volume: Column: ikey column temp.: 4 C MS conditions MS system: Ionization mode: ikey at 2. µl/min 5 µl (full loop) ikey, BEH C 18 PCA Separation Device, 13 Å, 1.7 µm, 15 µm x 5 mm ikey, BEH C 18 Separation Device, 13Å, 1.7 µm, 15 µm x 1 mm SYNAPT G2-Si ESI+ and ESI- Capillary voltage: 3 kv (+) and 2.6 kv (-) Sample cone voltage: 3 V Lockmass and LockCCS: Leucine enkephalin, [M+H] + = and [M-H] - = Acquisition range: 5 to 12 m/z Acquisition rate: 1 spectra/sec Collision energy ramp: 3 to 7 ev Resolution: 2, FWHM (Res mode) Default IMS parameters: IMS T-Wave velocity ramp: Start: 1 m/s, End: 3 m/s IMS T-Wave pulse height: 4 V IMS gas flow: 9 ml Isoorientin OH HO OH HO O 6 OH HO OH OH Isovitexin O 6 OH HO OH OH 6C glycocides O O O O OH OH OH For positive ion electrospray, an ikey Separation Device, Part No: , was used. The ikey, shown in Figure 2, incorporates a 1.7 µm, ACQUITY UPLC BEH C18, stationary phase in a 15 μm diameter separation channel. The eluent from the separation channel flows directly to an integrated ESI emitter. All microfluidic, gas, and electrical connections are automatically engaged when the ikey is inserted into the source enclosure and locked into place. For negative mode, the ikey Post Column Addition (PCA) Separation Device, Part No , was used. The PCA ikey Separation Device incorporates an additional channel, enabling post column addition of solvent. The make up solvent was configured to be delivered from channel A of the MS system fluidics for this study. HO HO HO HO HO HO OH 8 OH OH OH O O O O O O OH OH 8C glycocides Orientin OH OH Vitexin Figure 1. Structures of marker flavonoids profiled using ionkey/ms for positive and negative ion mobility mass spectrometry CCS screening. 8 PCA ikey Separation Device Figure 2. ionkey source and PCA ikey separation device incorporating fluidic/electronic connections with ionisation emitter. OH Analytical Channel Post-Column Addition Channel Using the Routine Separation Dimension and Identification Criteria of ionkey/ms Ion Mobility 147
150 RESULTS AND DISCUSSION ionkey/ms ion mobility screening was performed in positive and negative modes to analyze the hydromethanolic extracts of P.incarnata, P.edulis, P.caerulea, and P.alata. In a previous study using UPLC and ion mobility, the extracts were diluted 4:1. 2 For the analysis performed it has been possible to dilute the samples further to 4:1. Also separate aqueous high purity standard solutions (.1pg/μL to 1pg/μL) of isovitexin, vitexin, isoorientin, and orientin were used to determine sensitivity and linear response. The ikey gradient employed initial conditions at 99 aqueous. Using a post column addition solvent (IPA), enabled a single voltage of 2.6 kv to be employed throughout the chromatographic gradient, while maintaining stable spray conditions and stable ionization of the analytes exiting the ikey. In Figure 3 the complexity of the samples analyzed is illustrated. The base peak ion chromatogram illustrates the conventional view of the complexity of the sample profiled. A series of flavonoid isomers have been selected to clearly illustrate the chromatographic performance obtained using both ikey designs, as shown in Figure 4. The ionkey/ms positive and negative mode extracted exact mass chromatograms for a series of isomeric flavonoids determined to be present in 4:1 diluted Passiflora edulis extract are presented. The chromatographic profile obtained is shown to be comparable using the ikey and PCA ikey. Figure 3. ionkey/ms ion mobility positive mode base peak ion chromatogram obtained for analysis of 4:1 diluted Passiflora edulis extract. The base peak ion chromatogram illustrates the conventional view of the complexity of the sample profiled. 5cm PCA Tile -ve ionkey +ve ionkey 1cm ionkey Figure 4. ionkey/ms ion mobility positive and negative mode extracted exact mass chromatogram for a series of isomeric flavonoids determined to be present in 4:1 diluted Passiflora edulis extract. The chromatographic profile obtained is shown to be comparable using conventional and PCA microfluidic tiles. 148 Using the Routine Separation Dimension and Identification Criteria of ionkey/ms Ion Mobility
151 Figure 5 shows that the linear response obtained for orientin and vitexin solvent standards (.1 pg/μl to 1 pg/μl) using positive and negative mode ionkey/ms E is equivalent. Excellent correlation coefficients of R 2 >.99 have been acquired over three orders of dynamic range. The data show the potential of using ionkey/ms with benefits of full spectral acquistion attained using time-of-flight mass spectrometry at low detection levels; in this case at 1 fg/µl. Compound name: Vitexin Correlation coefficient: r = , r 2 = Calibration curve: * x Response type: External Std, Area Curve type: Linear, Origin: Include, Weighting: 1/x, Axis trans: None Compound name: orientin Correlation coefficient: r = , r 2 = Calibration curve: * x Response type: External Std, Area Curve type: Linear, Origin: Include, Weighting: 1/x, Axis trans: None ve Vitexin R 2 = ve Orientin R 2 = Response 3 25 Response pg/ul pg/ul Compound name: vitexin Correlation coefficient: r = , r 2 = Calibration curve: * x Response type: External Std, Area Curve type: Linear, Origin: Include, Weighting: 1/x, Axis trans: None Compound name: orientin Correlation coefficient: r = , r 2 = Calibration curve: * x Response type: External Std, Area Curve type: Linear, Origin: Include, Weighting: 1/x, Axis trans: None 45 +ve Vitexin R 2 = ve Orientin R 2 = Response 25 2 Response pg/ul pg/ul Figure 5. Illustration of linearity obtained for orientin and vitexin solvent standards (.1pg/μL to 1 pg/μl) using positive and negative mode ionkey/ms. Correlation coefficients of r 2 >.99 have been obtained. Using the Routine Separation Dimension and Identification Criteria of ionkey/ms Ion Mobility 149
152 Utilizing the extended functionality of the SYNAPT G2-Si, it shown in Figures 6 and 7 that using positive and negative mode ionkey/ms ion mobility IM-MS, E it is also possible to retain sensitivity as illustrated for isovitexin solvent standard over the concentration range.1 pg/μl to 1 pg/μl..1 pg/µl.5 pg/µl 1 pg/µl 5 pg/µl 1 pg/µl Figure 6. Illustration of the sensitivity, peak area response, and chromatographic integrity obtained for isovitexin using positive ion mode ionkey/ms ion mobility (HDMS E DRE)..1 pg/µl.5 pg/µl 1 pg/µl 5 pg/µl 1 pg/µl Figure 7. Illustration of the sensitivity, peak area response and chromatographic integrity obtained for isovitexin using negative ion mode ionkey/ms ion mobility (HDMS E DRE). 15 Using the Routine Separation Dimension and Identification Criteria of ionkey/ms Ion Mobility
 and the 8C glycoside isomers (isovitexin/vitexin), can be separated using ion mobility.")
 that coelute at the same retention time using ion mobility, as shown in Figure")

153 Under the chromatographic conditions used, vitexin and isovitexin coelute. In negative ion mode both the 6C glycoside isomers (isoorientin/orientin) and the 8C glycoside isomers (isovitexin/vitexin), can be separated using ion mobility. They can also be identified from their CCS values obtained using nitrogen based travelling ion wave mobility ( TW CCSN2). Hence it is possible to generate the individual calculated concentrations for two isomeric species (isovitexin/vitexin) that coelute at the same retention time using ion mobility, as shown in Figure 8. For the first time, two coeluting isomeric species have been quantified using precursor ion selection. This has been acheived because the flavonoids are ion mobility separated, which could not be acheived using only the selectivity of mass accuracy. In addition, the UNIFI Software Component Summary is presented where a mass accuracy of <1 ppm has been obtained, as well as CCS measurements within.21 of the expected TW CCSN2 values. VITEXIN ISOVITEXIN Figure 8. UNIFI Component Summary for Passiflora incarnata, illustrating coeluting vitexin and isovitexin linearity, with mass measurement error <2ppm. CCS errors <.5 are presented. The ion mobility trace and ion mobility data viewer 3D plot of drift time versus retention time are also presented. The flavonoid library was created within the UNIFI Scientific Library 17 months before this assay was performed, illustrating the reproducibility and precision that can be obtained using ion mobility. The combination of ionkey/ms and ion mobility offers the potential of high selectivity, specificity, and sensitivity, as well as practical aspects such as reduced solvent and sample consumption. Using TW CCSN2 as an additional identification parameter also has the potential to reduce the reliance on retention time based confirmations and hence the need to purchase expensive high purity standards (1 mg vitexin 98 pure= 144.5, and 1 mg isovitexin 98 pure= 144.5). Using the Routine Separation Dimension and Identification Criteria of ionkey/ms Ion Mobility 151
154 CONCLUSIONS Using positive and negative mode ionkey/ms, comparable linearity and sensitivity has been illustrated for flavonoid solvent standards (.1 pg/μl to 1 pg/μl). Correlation coefficients of r 2 >.99 have been obtained. ionkey/ms has been used to screen and profile flavonoid markers in complex extracts of Passiflora edulis, alata, caerulea, and incarnata. In negative mode the isomeric 6C glycosides (isoorientin/oreintin) and 8C glycosides (isovitexin/vitexin) were distinguished using collision cross section measurements. References 1. The use of collision cross section measurements (CCS) in food and environmental analysis. Waters Technical Note No en, April, M McCullagh, K Neeson, J Goshawk, C A M Pereira, J H Yariwake, C Carver, and D Douce. Using the routine separation dimension and identification criteria of UPLC ion mobility to enhance specificity in profiling complex samples. Poster shown at ASMS Baltimore, Waters Library Number: PSTR June, 214. CCS measurements within.5 have been obtained routinely, when compared to a TW CCSN2 library produced more than a year earlier. For the first time, chromatographically coeluting isobaric flavonoids have been separated using ion mobility mass spectrometry, enabling the individual calibration curves for isovitexin and vitexin to be obtained. ionkey/ms ion mobility offers potential cost savings as an analytical approach, through the reduced consumption of solvents and expensive high purity standards where TW CCSN2 can reduce the reliance on retention time confirmation. Waters, ACQUITY UPLC, UNIFI, SYNAPT, UPLC, and The Science of What s Possible are registered trademarks of Waters Corporation. ionkey/ms, ikey, and T-Wave are trademarks of Waters Corporation. All other trademarks are the property of their respective owners. 215 Waters Corporation. Produced in the U.S.A. July EN AG-PDF Waters Corporation 34 Maple Street Milford, MA 1757 U.S.A. T: F: Using the Routine Separation Dimension and Identification Criteria of ionkey/ms Ion Mobility
155 FORENSIC TOXICOLOGY
156 FEMTOGRAM DETECTION OF 11-NOR-9-CARBOXY-THC IN METHANOLIC SOLUTIONS USING AN INTEGRATED MICROFLUIDICS MS SYSTEM Authors Rob Lee 1, Gregory T. Roman 2, James P. Murphy 2 and Michelle Wood 1 Affiliations 1 Waters Corporation, Wilmslow, UK. 2 Waters Corporation, Milford, USA. OVERVIEW Evaluation of an integrated microfluidics MS system for the detection of 11-nor-9-carboxy-THC (carboxy- THC) at low femtogram amounts and comparison of the sensitivity obtained with a published UPLC-MS/ MS method. 1 The required sensitivity was achieved using the new technology with an approximate 4-fold increase over the published UPLC-MS/MS methodology. INTRODUCTION Cannabis is the most widely used illicit substance in the world, consequently the cannabinoids are one of the most commonly detected class of illegal drugs. Analysis of THC and its metabolites, including 11- nor-9-carboxy-thc, in multiple matrices is of key importance in a number of settings including forensic and roadside drug testing. The presence of carboxy-thc in hair or oral fluid can be used to discriminate between actual consumption of cannabis and passive exposure. Analysis of carboxy-thc can be challenging, particularly in the case of alternative specimens such as hair and oral fluid, owing to the very low concentrations encountered and the limited amount of specimen available. The European Workplace Drug Testing Society cut-off for carboxy-thc in hair is currently.2pg/mg. 2 Greater sensitivity over conventional LC-MS methods have been reported when reducing the amount of solvent flow into the ion source while reducing the column diameter from a traditional 2.1mm diameter to a micro-flow format. 3,4 This is owing to the fact that a mass spectrometer is a mass-flow sensitive, not a concentration dependent detector, where signal response is proportional to the amount of sample reaching the detector per unit time. The increase in ion signal is roughly proportional to the decreases in column diameter and flow rate (Figure 1). Under these conditions sensitivity gains of >2-fold can readily be achieved. 5 Increased sensitivity is also attributed to the improved sampling efficiency of the electrospray plume by the mass spectrometer at low flows. The Integrated microfluidics MS system combines UPLC chromatography on a ceramic tile (ikey ) with micro-volume flow rates to allow for increases in sensitivity over conventional UPLC-MS/MS methods. Chemicals METHODS Carboxy-THC at 1mg/mL and its deuterated (d3) analogue (for use as internal standard; ISTD) at.1mg/ml were purchased from LGC Standards (Teddington, UK). LC-MS grade methanol and HPLC grade acetone were purchased from Sigma-Aldrich (Poole, UK). ULC-MS grade acetonitrile was purchased from Greyhound Chromatography (Wallasey, UK). Preparation of standards Integrated microfluidics MS system Injection standards were prepared in 2 methanol in 18.2MΩ water containing various concentrations of diluted carboxy-thc and 1pg/mL carboxy-thc-d3. UPLC-MS/MS Injection standards were prepared in 7 methanol in 18.2MΩ water containing various concentrations of diluted carboxy-thc and 5pg/mL carboxy-thc-d3. Data management MassLynx v4.1 incorporating the TargetLynx TM Manager. Integrated microfluidics MS application UPLC-MS/MS Precursor ion (m/z) Quantifier ion (m/z) Qualifier ion (m/z) Table 1. Carboxy-THC MRM transitions for the two methods. Retention Time (min) Limit of Detection (LOD) Quantifier ion LOD signal to noise Qualifier ion LOD signal to noise Integrated microfluidics MS UPLC-MS/MS fg on column 375fg on column 21:1 23:1 11:1 11:1 Table 2. Retention time, limit of detection and signal to noise ratios for carboxy-thc for the two methods. TO DOWNLOAD A COPY OF THIS POSTER, VISIT Integrated microfluidics MS conditions Trapping Column: Waters Symmetry C18, 5µm, 3µm x 5mm Sample temp: 1 C Injection volume: 2µL (full loop mode) Trapping time: 2.4 min Flow rate: 25µL/min isocratic at 8 mobile phase A Mobile phase A:.1 formic acid Mobile phase B: acetonitrile / acetone (3/1, v/v) containing.1 formic acid ikey chromatography ikey : Waters BEH C18 ikey,1.7µm 15µm x 5mm ikey temp: 55 C Flow rate: 3µL/min Mobile phase A:.1 formic acid Mobile phase B: acetonitrile / acetone (3/1, v/v) containing.1 formic acid Gradient elution: linear over 3.5 min from 6 to 95 mobile phase B Xevo TQ-S Ionization mode: ESI negative Capillary voltage: 3.25kV Cone gas: 12L/Hr MRM transitions: see Table 1. UPLC-MS/MS conditions Chromatography Column: ACQUITY UPLC BEH C18, 1.7µm, 2.1 x 1 mm Column temp: 3 C Sample temp: 1 C Injection volume: 15µL (Partial loop needle overfill mode) Flow rate:.4ml/min Mobile phase A:.1 formic acid Mobile phase B: 1 acetonitrile Gradient elution: linear over 4 min from 6 to 9 mobile phase B Xevo TQ-S Ionization mode: ESI positive Capillary voltage: 2.5kV Desolvation temperature: 55 C Desolvation gas: 9L/Hr Cone gas: 15L/Hr MRM transitions: see Table 1. Figure 1. Signal enhancement with reducing column diameters and flow rates in comparison to a 2.1mm format for a series of toxicologically relevant molecules. All injections were made at the same concentration and a volume of 1µL. RESULTS Figure 2 shows chromatograms for carboxy-thc using the two methods. The retention time for carboxy-thc in each method is shown in Table 2. Limit of detection (LOD) was defined as the lowest concentration which gave a signal to noise ratio >1:1 for both transitions and is shown in Table 2. Signal to noise (s:n) ratios were calculated using the standard processing algorithm within TargetLynx TM and applying the following parameters: peak to peak using the underlying raw data. The linearity of response of the integrated microfluidics MS system was investigated using standard calibrators at concentrations ranging from zero to 2fg on column (1pg/mL). The ISTD concentration was 2fg on column (1pg/mL). A linear fit was applied and the correlation r 2 value was >.999 with a 1/x weighting. A calibration plot for carboxy-thc using the integrated microfluidics MS system is shown in Figure 3. Carryover following a 1pg/mL injection on the integrated microfluidics MS system was shown to be less than the LOD. Figure 2. Chromatograms showing carboxy-thc at the limit of detection. Left-hand chromatograms are from the integrated microfluidics MS system whilst the right-hand chromatograms are from the conventional UPLC-MS/MS. The top trace is the qualifier ion, the middle trace is the quantifier ion and the bottom trace is the quantifier trace from a blank injection. Compound name: cthc Correlation coefficient: r = , r^2 = Calibration curve: * x Response type: Internal Std ( Ref 2 ), Area * ( IS Conc. / IS Area ) Curve type: Linear, Origin: Exclude, Weighting: 1/x, Axis trans: None Response fg Figure 3. Calibration plot for carboxy-thc using the integrated microfluidics MS system with a 1/x weighting applied. References CONCLUSIONS The need to measure carboxy-thc at very low levels in various complex matrices has highlighted the need for more sensitive methodologies. The combination of micro-flow rates and the 15µm diameter ikey offers this increase in sensitivity. This integrated microfluidics MS system gave an approximately 4-fold increase in sensitivity over the conventional UPLC-MS/MS method. With this increase in sensitivity the cut-off concentration for carboxy-thc in hair is achievable. The ceramic tile ikey offers plug and play ease of use eliminating user-made connections and allowing standardisation. The use of an integrated microfluidics MS system provides a large reduction in solvent usage with the associated eco-benefit and cost savings. 1. Lee R et al. Waters application note en. 2. European Workplace Drug Testing Society Hopfgartner G et al. J Chromatography A. 1993; 647: Karger BL and Vouros P. J Chromatography A. 1985; 323: Murphy J et al. Waters White Paper en.


157 High Sensitivity Analysis of Opioids in Oral Fluid Using ionkey/ms Gregory T. Roman, Robert Lee, James P. Murphy, and Michelle Wood GOAL To separate and quantify opioids at very low levels in oral fluid with superior sensitivity compared to 2.1 mm I.D. chromatography. The ionkey/ms System facilitates high sensitivity and robust analysis of opioids in oral fluid. BACKGROUND Over the past three decades oral fluid has emerged as a highly valuable biological specimen and is commonly used in numerous settings, including therapeutic drug monitoring, and workplace and roadside drug testing. Oral fluid analysis has many advantages compared with other matrices such as blood or urine. These include collection convenience and reduced sample collection overheads. Whilst oral fluid itself is a relatively clean matrix, comprising mostly of water and a small percentage of proteins, the popularity of the specimen has led to the development of a large variety of collection devices, aiming to further simplify and standardize collection. Typically these devices will include additives and preservatives to improve the stability of the collected sample. One of the key analytical challenges with oral fluid analysis is the limited amount of sample available for testing compared with blood or urine, requiring very sensitive instrumentation to reach the low levels of detection and quantification. The ionkey/ms System offers the capability of improving sensitivity in sample-limited situations, making it ideally suited for this application. Figure 1. The ionkey/ms System with the ACQUITY UPLC M-Class System and the Xevo TQ-S Mass Spectrometer. Time (min) Table 1. LC-MS conditions. Flow rate (µl/min) Composition A () Composition B () Curve Initial Mobile phase A: Water,.1 formic acid Mobile phase B: Acetonitrile,.1 formic acid Trapping conditions 1 min
158 Performing analysis of oral fluid samples taken directly from a collection device provides a streamlined method for reducing workflow and increasing throughput. The use of a trapping column prior to analytical separation allows the removal of additives (e.g., surfactants) that can cause suppression in LC-MS and lead to reduced sensitivity. Trapping can also provide improved peak shape for hydrophilic small molecules, and crucially enables enhanced loading for ionkey/ms. Furthermore, the trapping column adds a layer of protection similar to that of a guard column, for precious downstream consumables, making the analytical method more robust. 1: Oxymorphone-3b-D-glucuronide 2: Morphine-3b-D glucuronide 3: Morphine-6b-D-glucuronide 4: Hydromorphone-3b-D-glucuronide 5: Morphine 6: Codeine-6b-D-glucuronide 7: Dihydrocodeine 8: Oxymorphone 9: Hydrocodone 1: Oxycodone 11: 6-Acetylmorphone 12: O-desmethyl Tramadol 13: Codeine 14: Norbuprenorphine-glucuronide 15: Norfentanyl 16: Tramadol 17: Normeperedine 18: Meperidine 19: buprenorphine-glucuronide 2: Norbuprenorphine 21: Fentanyl 22: Buprenorphine 23: EDDP+ 24: Propoxyphene 25: Methadone Time THE SOLUTION Here we demonstrate the separation and high sensitivity detection of opioids in oral fluid with the ionkey/ms System comprised of an ACQUITY UPLC M-Class System in combination with a Xevo TQ-S Mass Spectrometer. Preliminary trapping was achieved using an ACQUITY UPLC M-Class HSS T3, 1Å, 1.8 μm, 3 μm x 5 mm Trap Column (P/N ) in combination with a 5 μl loop (Figure 1 and Table 1). Analytical separation was Figure 2. MRM chromatograms for 25 opioids and metabolites Time Morphine oral fluid matrix calibration curve Compound name: Morphine Correlation coefficient: r = , r^2 = Calibration curve: * x Response type: External Std, Area Curve type: Linear, Origin: Exclude, Weighting: 1/x, Axis trans: None Morphine oral fluid matrix MRM 1 pg/ml 92914_Trapping_ Morphine_Calibration Curve_11 Morphine * F7:MRM of 2 channels,es > 165.1, 286.1> e LOQ: 13 pg/ml R 2 =.99 S/N: 78.2 Peak-peak 35 ignoring zeros Response 3 25 no extra processing Morphine * Conc min Figure 3. Calibration curve and LOQ of morphine spiked into oral fluid. 156 High Sensitivity Analysis of Opioids in Oral Fluid Using ionkey/ms
159 performed using an ikey HSS T3, 1Å, 1.8 µm, 15 µm x 1 mm (P/N ) Separation Device. Trapping-enabled quantitative analysis of 25 early eluting opioids and metabolites in oral fluid is illustrated in Figure 2. Figure 3 shows the calibration curve and LOQ of morphine spiked into oral fluid. The LOQ (based on a signal to noise ratio of 1:1) was calculated to be 13 pg/ml. The peak width of morphine, at 1 peak height, was 3. seconds and is shown in the insert in Figure 2. Figure 4 compares morphine detected using an ionkey/ms System to an ACQUITY UPLC 2.1 mm I.D. Column. The ionkey/ms System shows an improvement of 9X over the analogous 2.1 mm column format. The trapping column and separation device used in these studies were specifically chosen for their increased retentivity for hydrophilic opioids and metabolites. These comparisons were performed with equivalent injection volumes of 5 μl _2pt1 Acquity_ Morphine_Calibration Curve_3 1 S/N:PtP= it C C MRM l t1a M hi lib ti 4 7 f2ch ES 1 ACQUITY UPLC 2.1 mm x 1 cm Column Figure 4. Comparison of morphine detection using an ionkey/ms System to an ACQUITY UPLC 2.1 mm I.D. Column _Trapping_ Morphine_Calibration Curve_7 ~1X greater S/N ionkey/ms S/N:PtP= pg/ml pg/ml 7: MRM of 2 Channels ES+ TIC (Morphine) 5.96e i hi ti C 8 7 MRM f2ch T M C lib l ES : MRM of 2 Channels ES+ TIC (Morphine) 4.22e5 SUMMARY The utilization of the ionkey/ms System enabled a 9X improvement in sensitivity for morphine compared to an ACQUITY UPLC 2.1 mm I.D. Column when injecting the same volume. In addition to morphine, many of the glucuronides were also identified as having improved sensitivity. Specifically, morphine-3b glucuronide was demonstrated to be baseline separated from morphine, with a sensitivity improvement of 11X. Whilst this particular glucuronide may not be relevant for oral fluid, the increased sensitivity presents a clear advantage for analysis in other biological specimens. The assay described here is robust and reproducible using oral fluid matrix injections of over 5 injections. Retention time reproducibilities were <1 RSD, while peak area reproducibility of morphine was 11.1 RSD. Waters, The Science of What s Possible, Xevo, and ACQUITY UPLC are registered trademarks of Waters Corporation. IonKey/MS and ikey are trademarks of Waters Corporation. All other trademarks are the property of their respective owners. 216 Waters Corporation. Produced in the U.S.A. January EN TC-PDF Waters Corporation 34 Maple Street Milford, MA 1757 U.S.A. T: F: High Sensitivity Analysis of Opioids in Oral Fluid Using ionkey/ms 157
160

161 LIPIDOMICS, METABOLOMICS, AND PROTEOMICS
162 High-Throughput LC-MS MRM Disease Protein Marker Verification Using the ionkey/ms System Chris Hughes, Lee Gethings, Hans Vissers, and Jim Langridge Waters Corporation, Manchester, United Kingdom APPLICATION BENEFITS The ionkey/ms System is a robust, novel microfluidics platform that eliminates manual chromatographic connections and enables high throughput and robust validation analysis. INTRODUCTION Biomarker discovery and validation are the first two steps in understanding disease and drug development. Validation is technology-challenged since it requires analyzing a large number of samples with high-throughput, but nevertheless requires high sensitivity, high resolution, large dynamic range and excellent selectivity. Targeted LC-MS based assays afford protein quantification with the reproducibility and throughput required to improve marker acceptance. Multiple reaction monitoring (MRM) using tandem quadrupole mass spectrometers is one of the enabling technologies applied in targeted LC-MS approaches. 1 Overall, MRM-based methods compare favorably with antibody-based techniques, such as ELISAs or protein arrays, in that MRM-based methods are less expensive and can be developed more rapidly. However, one of the major challenges using MRM for candidate marker verification in mammalian body fluids is the required sensitivity for the quantification of low-abundance proteins, especially in the case of sample limited conditions. WATERS SOLUTIONS ionkey/ms System Miniaturized LC systems offer improved mass sensitivity but often lack the required throughput, robustness, and reproducibility. The application of a novel microfluidics platform for the quantification of marker peptides and proteins is presented, considering speed, sensitivity, and selectivity. Xevo TQ-S ikey Separation Device nanoacquity UPLC System* *or ACQUITY UPLC M-Class System MassLynx Software MassPREP E. coli Digest Standard KEY WORDS Biomarkers, verification, validation, proteomics, peptides, microfluidics, MRM 16
163 E X P E R IM E N TA L LC conditions LC system: nanoacquity UPLC System or ACQUITY UPLC M-Class System Sample loop: 5 µl Separation device: ikey BEH C 18 Separation Device, 13Å, 1.7 µm, 15 µm x 1 mm (p/n ) ikey temp.: 4 C Flow rate: 1.2 µl/min Mobile phase A: 98.9:1:.1 v/v water/acetonitrile/ formic acid Mobile phase B: 98.9:1:.1 v/v acetonitrile/water/ formic acid in water Volume injected:.1 to 1. µl Capillary voltage: 3. kv Source temp.: 1 C Software processing MassLynx raw data were analyzed using Skyline 2 and visualized using Spotfire DecisionSite (Tibco Spotfire, Boston, MA). Materials MS Qual/Quant QC Mix was obtained from Sigma-Aldrich (St. Louis, MO, USA). MassPREP E. coli Digest Standard (p/n ) was from Waters Corporation (Milford, MA, USA). The MS Qual/ Quant mixture was spiked into the E. coli background such that loads for a 1 µl injection ranged from 32 amol to 4 fmol peptides in the presence of 1 ng E. coli. The sample was injected three times at four different loadings (.1,.2,.5, and 1 µl). Gradient: Time (min) A B Curve Initial 98 2 Initial MS conditions MS system: Acquisition mode: Xevo TQ-S MRM Quadrupole resolution:.4 Da or.7 Da Ionization mode: ESI positive High-Throughput LC/MS MRM Disease Protein Marker Verification Using the ionkey/ms System 161
164 RESULTS AND DISCUSSION The MS Qual/Quant QC mixture consists of 14 peptide species present as light and heavy labeled analogues and at varying amounts to give an in-sample dynamic range of 1.25e3, Table 1. The peptide mixture was spiked into a complex background matrix of an E. coli tryptic digest to represent a high-throughput validation study and access quantitative precision and accuracy. An MRM method containing 28 functions was programmed to monitor three transitions from each of the light and heavy peptide species, and the sample was analyzed using the ionkey/ms System with the nanoacquity UPLC System and the Xevo TQ-S Mass Spectrometer. Figure 1 shows the extracted MRM chromatograms for each peptide species resulting from a.5 µl injection and exhibits i) peptides that are resolved from the background matrix and ii) the dynamic range present within the sample. The on-column amounts displayed here range from 16 amol for the peptide NLSVEDAA[R] to 2 fmol for the peptide GGPFSDSYR. Protein Peptide sequence* On-column amount (attomoles)** Expected light to heavy ratio*** Carbonic Anhydrase I GGPFSDSY[R] Carbonic Anhydrase I VLDALQAI[K] Carbonic Anhydrase II AVQQPDGLAVLGIFL[K] Carbonic Anhydrase II SADFTNFDP[R] 8 55 NAD(P)H dehydrogenase EGHLSPDIVAEQ[K] 8.92 NAD(P)H dehydrogenase ALIVLAHSE[R] 4.93 C-reactive Protein ESDTSYVSL[K] C-reactive Protein GYSIFSYAT[K] Cyclophilin A FEDENFIL[K] Cyclophilin A VSFELFAD[K] Cyclophilin A TAENF[R] 8.92 Catalase GAGAFGYFEVTHDIT[K] Catalase FSTVAGESGSADTV[R] Catalase NLSVEDAA[R] Table 1. Protein digest and stable isotope labeled (SIL) peptide composition of MS Qual/Quant QC Mix. * Amino acid in [brackets] denotes site of label incorporation for heavy SIL peptides: [K] C 6 N 2, [R] C 6 N 4 ** Heavy labeled on-column amount for.1 µl injection *** Certificate of Analysis 1 Relative abundance Retention time (min) Figure 1. Overlay of extracted MRM chromatograms for each of the light and heavy stable isotope labeled peptides in the mixture for a.5 μl injection in the presence of E. coli background matrix. Red indicates the light and blue the heavy labeled analogue. 162 High-Throughput LC/MS MRM Disease Protein Marker Verification Using the ionkey/ms System
165 MRM transitions were inspected using Skyline, ensuring that a minimum of three peptides per protein and three transitions per peptide were detected and analyzed. Figure 2 represents the technical reproducibility of three transitions for an example light/heavy peptide, i.e. fragment ions y5, y6, and y7 for peptide GGPFSDSYR. Further Skyline interrogation shows that excellent quantitative measurement consistency, even without normalization, between technical replicates is readily achieved, Figure 3. The example illustrates mass chromatograms and ratio measurements for peptide AVQQPDGLAVLGIFLK from Carbonic Anhydrase II, which is present in the mixture at elevated levels for the light analogue. 1. y y y y y y Peak area normalized Peak area normalized _ _ _18 Replicate (a) _ _ _18 Replicate (b) Figure 2. Reproducibility of raw MRM transitions; a) (y5), (y6) and (y7) for light GGPFSDSYR and b) (y5), (y6) and (y7) for heavy GGPFSDSY[R]. High-Throughput LC/MS MRM Disease Protein Marker Verification Using the ionkey/ms System 163
166 6 AVQQPDGLAVLGIFLK AVQQPDGLAVLGIFLK (heavy) AVQQPDGLAVLGIFLK AVQQPDGLAVLGIFLK (heavy) Intensity (1^3) Retention Time Figure 3. Quantitative measurement consistency for peptide AVQQPDGLAVLGIFLK, where brown indicates the light analogue. The expected light/heavy (L/H) ratio equals High-Throughput LC/MS MRM Disease Protein Marker Verification Using the ionkey/ms System
167 In Figure 4, the measured light-to-heavy ratios for every injection, 12 for each quadrupole setting, and every peptide in the mixture, are plotted against the expected ratios from the supplier certificate of analysis at unit and elevated quadrupole resolution settings. The results clearly show that excellent ratio measurements are achieved over the range of expected ratios for both mass spectrometer quadrupole resolution settings. For this application, unit quadrupole resolution afforded sufficient quantitative accuracy. The results presented are the average relative quantification results for four different injection volumes, ranging from.1 to 1 µl. This covers a sample load from 3.2 amol for NLSVEDAA[R] to 4 fmol for GGPFSDSY[R] and VLDALQAIK, spanning four orders of concentration dynamic range. As can be observed by the error measurement values, precision was not noticeably affected by quadrupole resolution. As an indication of the limits of detection that can be achieved, shown in Figure 5 is the chromatogram for the peptide NLSVEDAA[R] from Catalase. This chromatogram was generated from the lowest sample injection amount,.1 µl and so equates to 3.2 amol on-column. unit quadrupole resolution elevated quadrupole resolution y = *x (r 2 =.992) y = *x (r 2 =.991) 1.5 log1 measured L/H ratio log 1 expected L/H ratio log1 measured L/H ratio log1 expected L/H ratio Figure 4. Measured L/H ratio vs. expected L/H ratio for unit and elevated quadrupole resolution. Color annotation by peptide sequence and error represented as the standard deviation of four injections ranging from.1 to 1. μl. 1 Relative abundance peak FWHM = 5 sec Retention time (min) Figure 5. Typical chromatogram representing 3.2 amol on-column of the heavy peptide variant of NLSVEDAA[R] from catalase. High-Throughput LC/MS MRM Disease Protein Marker Verification Using the ionkey/ms System 165
168 CONCLUSIONS This application note has demonstrated the utility of the novel ionkey/ms System for rapid and robust discovery validation experiments. Quantification measurements for light to heavy stable isotope labeled peptides have shown excellent consistency and are in agreement with expected values. The limit of detection has been demonstrated down to at least 3.2 amol on-column. References 1. Addona et al. Multi-site assessment of the precision and reproducibility of multiple reaction monitoring-based measurements of proteins in plasma. Nat Biotechnol. 29 Jul;27(7): MacLean et al. Skyline: an open source document editor for creating and analyzing targeted proteomics experiments. Bioinformatics. 21 Apr 1;26(7): Waters, The Science of What s Possible, Xevo, nanoacquity UPLC, and MassLynx are registered trademarks of Waters Corporation. ionkey/ms, ikey, and MassPREP are trademarks of Waters Corporation. All other trademarks are the property of their respective owners Waters Corporation. Produced in the U.S.A. January EN AG-PDF Waters Corporation 34 Maple Street Milford, MA 1757 U.S.A. T: F: High-Throughput LC/MS MRM Disease Protein Marker Verification Using the ionkey/ms System


![available sample and instrument utilization [1-4]. Due to the complexity of deriving meaningful information from these studies, the development of new analytical technologies is critical [5-6].](/docs-images/93/112889278/images/169-5.jpg "Here we present the utilization of a microfluidic LC coupled with mass spectrometry for both discovery and targeted studies in translational research.")
169 SINGULUS PULPITUM: MICROFLUIDICS COUPLED WITH MASS SPECTROMETRY FOR MULTI-OMICS AND TARGETED ASSAYS IN TRANSLATIONAL RESEARCH Paul D. Rainville 1, Guiseppe Astarita 1, James P. Murphy 1, Ian D. Wilson 2, and James I. Langridge 1 1 Waters Corporation 34 Maple Street Milford, MA 1757 USA 2 Imperial College, Division of Surgery and Cancer, South Kensington, London, SW7 2AZ, United Kingdom INTRODUCTION Translation medicine is an interdisciplinary science that aims at combining the information taken from bench to bedside. In this process molecules are isolated and identified in discovery and then utilized in the clinical setting as biomarkers of health and disease to better develop therapies. It has become recently apparent that proteomics, metabolomics, lipidomics, and glycomics data combined are necessary to address the challenge of translational research which places strain on available sample and instrument utilization [1-4]. Due to the complexity of deriving meaningful information from these studies, the development of new analytical technologies is critical [5-6]. Here we present the utilization of a microfluidic LC coupled with mass spectrometry for both discovery and targeted studies in translational research. Instrumentation: METHODS Waters ACQUITY UPLC M-Class System Waters Xevo TQ S Waters Synapt G2 S Reagents: Oxytocin, ammonium formate, formic acid and were obtained from Sigma Aldrich Chemicals (St Louis, MO, USA). Acetonitrile, chloroform and methanol was purchased from JT Baker Chemicals (Phillipsburg, USA). Distilled water was produced in house using a MilliQ system (Millipore, MA, USA). Human plasma was obtained from Equitech Bio (Kerrville, TX USA) Trypsin was obtained from Promega (Maddison, WI USA. Human Urine was collected from willing volunteers. Metabolomics of human urine and plasma Sample preparation: Human urine samples were prepared by dilution with water (1:4) and centrifuged at 13, RCF for 5 minutes. The supernantant was then removed an injected onto the LC/MS system. Human plasma samples were prepared by protein precipitation with methanol (1:2) and centrifuged at 13, RCF for 5 minutes. The supernantant was then removed, and injected onto the LC/MS system. LC/MS: A 1 µl injection was made onto the LC/MS system. The sample was eluted under gradient conditions with aqueous formic acid and acetonitrile at a flow rate of 3 µl/min. Separation was carried out on an ikey HSS T3, 1 Å, 1.7µm, 15 µm x 1 mm controlled at 4 C. Mass spectrometry was carried out on the Synapt G2 S in full scan mode from m/z 5-12 in ESI + ionization mode. Lipidomics of human plasma Sample Preparation: Human plasma samples were prepared by modified Bligh-Dyer extraction with chloroform : methanol (2:1) with a (4:1) with human plasma. The samples were then centrifuged at 13, RCF for 5 minutes, dried down, reconstituted and injected onto the LC/MS system. LC/MS: A 1 µl injection was made onto the LC/MS system. The sample was eluted under gradient conditions with aqueous formic acid/acetonitrile (4/6) and acetonitrile/isoproapnol (1/9) at a flow rate of 3 µl/min. Separation was carried out on an ikey CSH C18 1 Å, 1.7µm, 15 µm x 1 mm controlled at 6 C. Mass spectrometry was carried out on the Synapt G2 S in full scan mode from m/z 5-12 in ESI + ionization mode. Figure 2. Profiling of biofluids can strain available sample volumes. The profiling of biofluids for the purposes of better understanding the influence of a medicine, disease or health state can require multiple tests. Samples from subjects may require analysis by a number of analytical methodologies including NMR and LC/MS. The result of this can be strain on the available amount of sample and therefore may restrict the amount of meaningful information that could be derived from subjects in a study. This can be especially true during pre-clinical testing of rodent models such as mice. RESULTS AND DISCUSSION Figure 4. BPI of multiple-omics experiments from human urine and plasma run consecutively. The profiling of biofluids was carried out in subsequent repetitive order of: human polar plasma profiling, human plasma lipidomics, and human urine profiling over a period of one week. A targeted analysis of oxytocin was carried out at regular intervals to monitor the robustness of the system. In each of these experiment the optimal method conditions where chosen to best separate and detect analytes from a specific biofluid sample. As can be observed in Figure 1 multiple profiling and targeted analye experiments can be successfully executed with microfluidic LC/MS. References ikey Peptide 1 Peptide 2 Peptide 3 Peptide 4 Peptide AVG RT ST DEV RSD RT Figure 6. Example chromatogram of retention time reproducibility test. Tryptic peptides from an enolase digest are used to test individual microfluidic devices for retention time reproducibility. Table 1. Reproducibility between multiple microfluidc separation devices. The reproducibility of five tryptic peptides from a digest of the protein enolase is shown. As can be observed the retention time RSD over these six devices for peptides 1,2,3,4,5,6 is.4917,.521,.564,.541, CONCLUSION The analysis of multiple preparations from plasma and urine for mult-omics studies was successfully carried out in consecutive repetitive order illustrating the robustness and applicability of microfluidic LC/MS for profiling experiments. Microfluiidc LC/MS has the ability to separate complex samples and produce average peak widths of 4.2 seconds at peak base producing peak capacity of 143 or a 1 minute separation. Separation of tryptic peptides on multiple microfluidic devices illustrated good reproducibility with retention time RSD of below.6 for all devices tested. The robustness, reproducibility and ability to analyze multiple preparations of biofluids for multi-omics experiments indicates that the use of microfluidic LC/ MS may play a future key role in the development of translational and personalized medicine. Figure 1. Schematic of microfluidic LC/MS system utilized in this study. Oxytocin targeted assay Sample preparation: Oxytocin was prepared in the same manner as previous work [7]. Briefly oxytocin was spiked into human plasma prepared by protein precipitation followed by solid-phase extraction (SPE) The eluent from the SPE was then removed an injected onto the LC/MS system. LC/MS: A 1 µl injection was made onto the LC/MS system. The sample was eluted under gradient conditions with aqueous formic acid and acetonitrile at a flow rate of 3 µl/min. Separation was carried out on an PST C18 12 Å, 1.7µm, 15 µm x 1 mm controlled at 6 C. Mass spectrometry was carried out on the Synapt G2 S TOF MRM and in ESI + ionization mode. TO DOWNLOAD A COPY OF THIS POSTER, VISIT Figure 3. Increases in sensitivity for pharmaceutical peptides, biomarker peptides, and tryptic digest peptides. The graph illustrates the average signal -to -noise and area counts (n=6 injections) for various peptides analyzed by microfluidic LC/MS compared with traditional 2.1 mm i.d. UPLC/MS. As can be seen in Figure 3 significant increases in both area count and signal-to-noise were produced by the microfluidic LC/MS. This inherent gain in sensitivity may therefore enable both the use of less sample and better use of limited sample volumes for multiple analysis or increase the ability to detect analytes from limited available sample volumes. Figure 5. Zoomed BPI from human urine profiling experiment shown in Figure 4. The zoomed BPI derived from the separation of human urine illustrates the ability of microfluidic LC/MS to separate highly complex samples with good chromatographic resolution. Average peak widths at base for the peaks in the defined time space is 4.2 seconds measured at peak base. 1. Nie, W., Yan, L., Lee, Y., Guha, C., Kurland, I., Lu, H., Advaced mass spectrometry-based multi-omics technologies for exploring the pathogenesis of heptocellular carcinoma. Mass Spectrom Rev (214). 2. Stuani, L., Lechaplais, C., Salminen, A., Durot, M., Castelli, V., Pinet, A., Labadie, K., Cruveiller, S., Weissenbach, J., de Berardinis, V., Salanoubat, M., Perret, A., Novel metabolic features in Acinetobacter baylyi ADP1 revealed by a multomics approach. Metabolomics 1 (6) (214). 3. Higdon, R., Earl, R.K., Stanberry, L., Hudac, C.M., Montaque, E., Janko, L., Choiniere, J., Broomall, W., Kolker, N., Bernier, R.A., Kolker, E., The promise of multi-omics and clinical data integration to identify and target personalized healthcare approaches in autism spectrum disorders. Omics 19 (4) (215). 4. Goldberg, N., Everett, A., Graham, D., Bernard, T., Nowark-Gotti U., Proteomic and other mass spectrometry based-omics biomarker discovery and validation in pediatric venous thromboembolism and arterial ischemic stroke: current state, unmet needs, and future direction. Proteomics Clin Appl ) (214). 5. Chetwynd, A., Abdul-Sada, A., Hill, E., Solid=Phase Extraction and Nanoflow Liquid Chromatography-Nanoelectrospray ionization mass spectrometry for improved global urine metabolomics. Anal. Chem. 87, (215). 6. Want, E., Wilson. I., Gika, G., Georgios, T., Plumb, R., Shockcor, J., Holmes, E., Nicholson, J., Global metabolic profiling procedures for urine using UPLC-MS. Nat. Protoc. 5 (6), (21). 7. Doneanu C., Rainville P., Ultrasensitive quantification assay for oxytocin in human plasma using ionkey MS system, Waters app note available at: Waters Corporation
170 Targeted Lipidomics Using the ionkey/ms System Giuseppe Astarita, 1 Angela Doneanu, 1 Jay Johnson, 1 Jim Murphy, 1 and James Langridge 2 1 Waters Corporation, Milford, MA, USA 2 Waters Corporation, Manchester, UK APPLICATION BENEFITS The ionkey/ms System allows for fast and robust LC-MS lipidomics analyses with considerable reduction in solvent consumption and increase in sensitivity when compared to 2.1 mm I.D. chromatography. Potential applications include large-scale lipid profiling and low-abundance lipids analyses in biological materials. INTRODUCTION Lipidomics is the comprehensive analysis of hundreds of lipid species in biological samples. Lipids play prominent roles in the physiological regulation of many key biological processes such as inflammation and neurotransmission. Alterations in lipid pathways have been associated with many diseases including cardiovascular diseases, obesity, and neurodegenerative disorders. The ability to measure the wide array of lipid species in biological samples could help our understanding of their roles in health and disease. The need for a fast, comprehensive, and sensitive analysis of the hundreds of lipid species challenges both the chromatographic separation and mass spectrometry. Here we used the novel ionkey/ms System, which utilizes the ikey Separation Device packed with 1.7 µm particles for fast and robust chromatographic separation. By integrating microscale LC components into a single platform design, the device avoids problems associated with capillary connections, including manual variability, leaks, and excessive dead volume. This integrated microfluidic device is suitable for lipidomics analyses with considerable advantages when compared to analytical scale LC-MS analysis. WATERS SOLUTIONS ionkey/ms System ACQUITY UPLC M-Class System ionkey Source Xevo TQ-S ikey Separation Device MassLynx Software TargetLynx KEY WORDS Lipidomics, lipid, microfluidics, metabolomics 167
171 E X P E R IM E N TA L LC conditions LC system: Sample loop: 1 µl Separation device: ikey temp.: 55 C Flow rate: ACQUITY UPLC M-Class System ikey CSH C 18 Separation Device, 1.7 µm, 15 µm x 1 mm (p/n ) 2 µl/min Mobile phase A: Acetonitrile/water (6/4) with 1 mm ammonium formate +.1 formic acid Mobile phase B: Isopropanol/acetonitrile (9/1) with 1 mm ammonium formate +.1 formic acid Volume injected:.2.5 µl Gradient: Time (min) A B Curve Initial Initial MS conditions Mass spectrometer: Xevo TQ-S RESULTS AND DISCUSSION For the analysis of lipids, we used the ionkey/ms System, comprised of the Xevo TQ-S Mass Spectrometer, the ACQUITY UPLC M-Class System, the ionkey Source, and the ikey Separation Device. The ikey Separation Device contains the fluidic connections, electronics, ESI interface, heater, e-cord, and the chemistry, permitting operation at high pressure with sub-2-micron particles, leading to highly efficient LC separations of lipid molecules. By integrating microscale LC components into a single system design, we avoided problems associated with capillary connections, including manual variability, leaks, and excessive dead volume. Lipidomics analyses were conducted using small volumes of lipid standards and lipid extracts from typical biological samples including plasma and brain tissues (.2 µl). We separated lipids at flow rates of 2 µl/min using a ACQUITY UPLC M-Class engineered with 15 µm I.D. x 1 mm ceramic channel packed with CSH C18, 13 Å, 1.7 µm particles size (Fig. 1). The small column diameter (15 μm) of the ikey Separation Device allows low injection volumes (.5 µl) and low flow rates (2 μl/min) increasing up to 1x the sensitivity compared to regular analytical columns (e.g. 2.1 mm I.D.) (Fig.1). Mobile phase consumption was reduced compared to 2.1 mm I.D. chromatography albeit maintaining comparable chromatographic resolution and analysis times (Fig. 2) 1. Acquisition mode: MRM A B Ionization mode: ESI positive Capillary voltage: 3. KV Source temp.: 12 C ikey (15 µm ID) Regular analytical column (2.1 mm ID) Materials Lipid standards were purchased from Avanti Polar Lipids (Alabaster, AL) and Nu-Chek Prep (Elysian, MN). Total lipid extract from bovine brain was purchased from Avanti Polar Lipids. Mouse plasma (1 µl) was extracted with isopropanol (49 µl). The solution was then allowed to stand for 3 minutes in ice, vortexed, and then centrifuged (1, x g, at 4 C for 1 min). The supernatant was collected in a new vial, evaporated to dryness under vacuum, and kept at -8 C until further analysis. Immediately prior to analysis, all lipid extracts were re-suspended in isopropanol/acetonitrile/water (5/25/25, 25 µl). Retention time (arbitrary units) Figure 1. (A) The ionkey/ms System: comprised of the Xevo TQ-S, the ACQUITY UPLC M-Class, the ionkey Source and the ikey Separation Device. (B) Representative analysis of phosphatidylcholine (14:/14:) using the ionkey/ms System (red line) as compared to regular UPLC -MS 1 (green line). 168 Targeted Lipidomics Using the ionkey/ms System
172 Figure 2. Representative extracted ion chromatograms of A) glycerophospholipids (e.g. phosphatidyletahnolamines, PE) extracted from bovine brain and B) sphingolipids (e.g. ceramides, Cer) extracted from mouse plasma. Samples were analyzed using the ionkey/ms System. We conducted targeted lipidomic analyses using Xevo TQ-S in MRM mode and monitored 215 lipid species belonging to various lipid classes including phosphatidylethanolamines (PE), lyso PE, phosphatidylcholines (PC), lyso PC, ceramides (Cer), sphingomyelins, hexosylceramides, lactosylceramides, and cholesteryl esters (Table 1). Targeted lipids were measured over approximately five orders of dynamic range (Fig. 3 and 4). Lipids were separated according to acyl chain length and number of double bonds. Quantification was performed using TargetLynx Application Manager (Fig. 5). Initial reports in peer reviewed journals showed the advantages of using the ionkey/ms System in real world applications dealing with the analysis of low abundance lipids. 2,3 Lipid class No. MRMs Cone voltage Collision energy PE Lyso PE PC Lyso PC Ceramide Sphingomyelin Hexosyl Ceramide Lactosyl Ceramide Cholesteryl Ester Table 1. Overview of the MRM method used. Targeted Lipidomics Using the ionkey/ms System 169
173 1 7 Dynamic range 1 6 Peak Area P C 34: P C 36:6 P C 36:5 P C 36:4 P C 36:3 P C 36:2 P C 36:1 P C 38:7 P C 38:6 P C 38:5 S M d 18:1/16: S M d 18:1/18: S M d 18:1/2: S M d 18:1/24:1 S M d 18:1/26:1 S M d 18:1/26: S M d 18:1/24: S M d 18:1/22: S M d 18:1/22:1 H e x C e r d 18:1/h 24:1 H e x C e r d 18:1/h 24: H e x C e r d 18:1/26:1 H e x C e r d 18:1/26: H e x C e r d 18:1/24:1 H e x C e r d 18:1/24: H e x C e r d 18:1/18: H e x C e r d 18:1/h 18: H e x C e r d 18:1/2: H e x C e r d 18:1/22:1 H e x C e r d 18:1/h 24:1 H e x C e r d 18:1/h 22: C e r d 18:1/16: C e r d 18:1/18: C e r d 18:/18: C e r d 18:1/2: C e r d 18:1/22: C e r d 18:/22: C e r d 18:1/24:1 P E p 4:4 P E 4:5 P E 4:3 P E 4:6 P E 4:7 L P E 18: P E 38:6 P E 38:5 P E 38:4 P E p 38 :4 P E p 38:5 P E p 36:4 P E 36:5 P E 36:4 Figure 3. Intensities of selected lipids extracted from bovine brain. PC (18:/2:4 ) 3 Linearity 2 Peak Area 1 R 2 = Concentration (pmol) Figure 4. Linearity of response for a selected phosphatidylcholine species (PC). Figure 5. Quantification can be performed using TargetLynx. MRM and retention times are automatically extracted and normalized by comparison to selected internal standard. 17 Targeted Lipidomics Using the ionkey/ms System
174 CONCLUSIONS The ionkey/ms System is a novel microfluidics-ms platform that leads to highly efficient LC separation of lipids with comparable resolution to analytical scale LC-MS analysis. 1 The use of the 15 µm ikey Separation Device enables the development of low flow MRM methods, bringing three major advantages over standard flow rate analysis 1 : 1. up to 2x decrease in solvent consumption, making it convenient for the large-scale analysis and screenings of hundreds or thousands samples; 2. up to 1x increase in sensitivity, which could facilitate the detection of low abundance metabolites; 2,3 References 4. Isaac G, McDonald S, Astarita G: Lipid separation using UPLC with Charged Surface Hybrid Technology. Waters App note (211); 72417en. 5. Aqai P, Cevik E, Gerssen A, Haasnoot W, Nielen MW: Highthroughput bioaffinity mass spectrometry for screening and identification of designer anabolic steroids in dietary supplements. Anal Chem (213);85: Broccardo CJ, Schauer KL, Kohrt WM, Schwartz RS, Murphy JP, Prenni JE: Multiplexed analysis of steroid hormones in human serum using novel microflow tile technology and LC-MS/MS. J Chromatogr B Analyt Technol Biomed Life Sci (213);934: low volumes injection (e.g..2 µl), which makes it ideal when sample limited studies or when multiple injections are required. Potential applications include large-scale lipid profiling and low-abundance lipids analyses in biological materials. 2,3 Waters, ACQUITY UPLC, UPLC, Xevo, MassLynx and The Science of What s Possible are registered trademarks of Waters Corporation. TargetLynx, ecord, ionkey/ms, ionkey, and ikey are trademarks of Waters Corporation. All other trademarks are the property of their respective owners Waters Corporation. Produced in the U.S.A. January EN AG-PDF Waters Corporation 34 Maple Street Milford, MA 1757 U.S.A. T: F: Targeted Lipidomics Using the ionkey/ms System 171
175
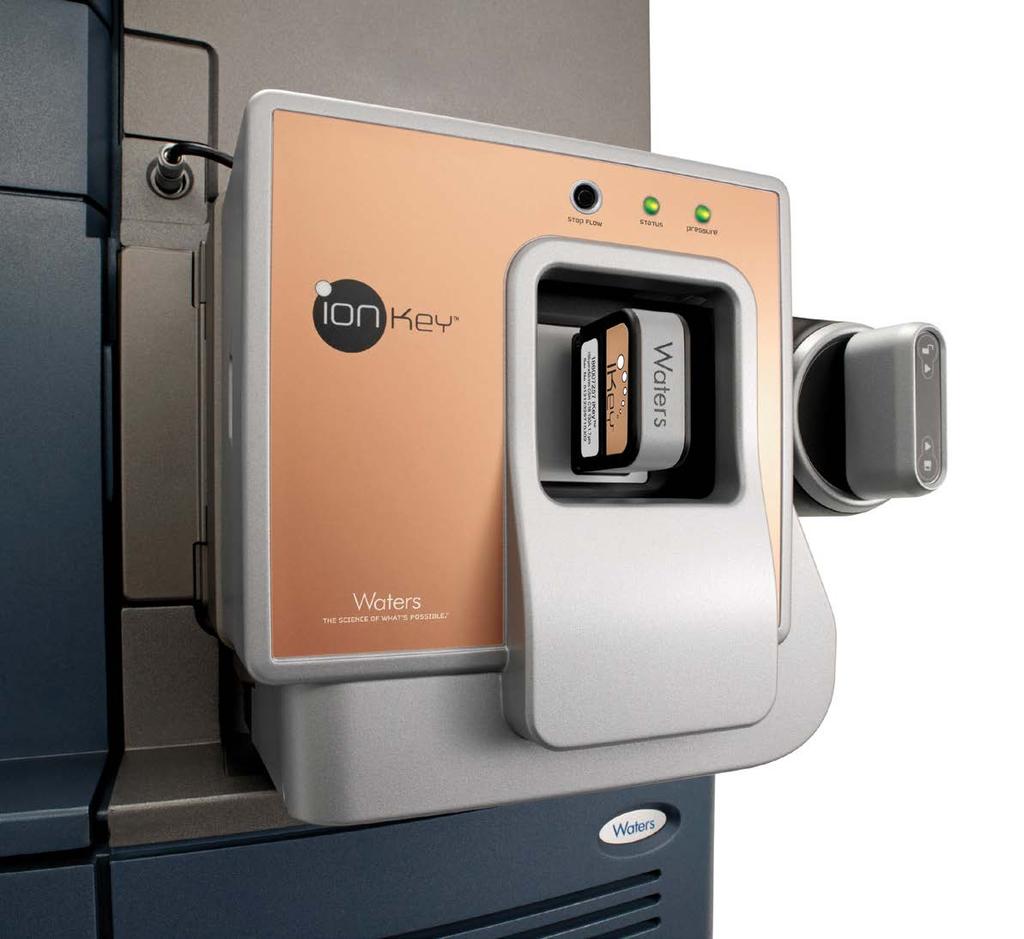
176 GENERAL

, peak width (PW), peak tailing, and area counts are often monitored during system suitability testing before assays can begin on any liquid")


177 Chromatographic reproducibility of the novel ionkey/ms System Paul D. Rainville, Peter Bastek, Jay Johnson, and James P. Murphy GOAL To evaluate chromatographic retention time and system reproducibility of Waters ionkey/ms System. BACKGROUND Chromatographic reproducibility is an essential requirement in any analytical laboratory environment. Parameters such as chromatographic retention time (RT), peak width (PW), peak tailing, and area counts are often monitored during system suitability testing before assays can begin on any liquid chromatography system. A critical component to obtaining highly reproducible LC-MS results is the consist performance of the separations devices utilized. Chromatographic retention time reproducibility is not only dependent on the quality and consistency in the manufacturing of the separations devices, but is also effected by gradient formation, system pressure, flow rate and temperature control. Historically, these later variables, controlled by system hardware, have been shown to be a source of poor performance and reproducibility of results for LC-MS systems that operate in the low nl-µl/min flow rate ranges. ionkey/ms: Enhanced MS with the turn the Key. More sensitivity, more information from the same sample, more robust analysis. All with less solvent usage and less complexity to the user. Figure 1. ionkey/ms System: comprised of the Xevo TQ-S, the ACQUITY UPLC M-Class, the ionkey source and the ikey separation device. THE SOLUTION The ionkey/ms System, shown in Figure 1, integrates the UPLC separation directly into the source of the mass spectrometer. The system combines the ACQUITY UPLC M-Class and the Xevo TQ-S Tandem Quadrupole Mass Spectrometer with the ikey Separation Device. The ikey consists of the ceramic-based separations channel, packed with UPLC grade particles, an integrated emitter, fluidic connections, electronics, ESI interface, heater, and e-cord. Once inserted into the source, all fluidic connections are made through the turn of a handle thereby creating a true plug and play capillary LC-MS instrument. 174
178 1 Table 1. Peptide from P924, Yeast Enolase 6.66 Retention time SD of retention time Average peak width FWHM 6.84 min.1 min 3.1 sec Time Figure 2. Overlay of 15 peptide standard injections utilized in the reproducibility testing of the ionkey/ms System. These 15 injections were interspersed across 5 injections of rat plasma prepared via protein precipitation. Figure 2 illustrates the separation of a peptide standard utilized in the evaluation of the system. As can be observed in Figure 2, the overlay of fifteen different analysis of the peptide standard illustrates the excellent reproducibility of the ionkey system. The data from this evaluation is further displayed in Table 1. The data illustrates average retention times of 6.84 minutes for the peptide standard with.1 RSD. In this evaluation, the peptide standard data was acquired over a course of 5 injections of rat plasma prepared via protein precipitation, utilizing a 15 minute gradient equating to five days of continuous operation. This same peptide standard and methodology was then run on 18 different ikeys, on 5 independent ionkey/ms Systems operated by 5 different scientists. The data from this test is displayed in Table 2. As can be observed in this table, retention time reproducibility values for the 18 ikeys tested had an average retention time of 6.69 minutes with 1.6 RSD. This data clearly illustrates the reproducibility of each of the individual ikey separation devices as well as the reproducible control of system pressure, flow rate, gradient formation and temperature control afforded by the individual ionkey systems utilized in the evaluation. Table 2. Peptide from P924, Yeast Enolase Retention time SD of retention time Average peak width FWHM 6.69 min.11 min 2.72 sec SUMMARY The data shown here demonstrates the excellent chromatographic retention time reproducibility for a peptide standard injected on multiple ikeys during robustness testing of protein precipitated rat plasma. Moreover, the evaluation illustrated the excellent reproducibility between multiple ionkey/ms Systems operated by 5 independent scientists. Waters, The Science of What s Possible, ACQUITY UPLC, UPLC, and Xevo are registered trademarks of Waters Corporation. ionkey /MS, ionkey, and ikey are trademarks of Waters Corporation. All other trademarks are the property of their respective owners. 214 Waters Corporation. Produced in the U.S.A. February EN TC-PDF Waters Corporation 34 Maple Street Milford, MA 1757 U.S.A. T: F: Chromatographic Reproducibility of the Novel ionkey/ms System 175

 has, over the past 2 years, become the analytical technique of choice for bioanalytical studies due to the")
179 ionkey/ms System: Moving Toward Greener, More Sustainable Chemistry Methods by Reducing Mobile-Phase Consumption. Paul D. Rainville and James P. Murphy Waters Corporation, Milford, MA, USA GOAL To highlight the reduction in the cost associated with analyzing typical bioanalytical samples with the ionkey/ms System. BACKGROUND Safety, ability to obtain critical information, and the cost associated with analysis, represent three important aspects in the bioanalytical laboratory. The combination of liquid chromatography and tandem quadrupole mass spectrometry (LC-MS/MS) has, over the past 2 years, become the analytical technique of choice for bioanalytical studies due to the specificity and sensitivity of the technique. 1-3 These analyses are most often accomplished by utilizing narrow-bore LC columns at flow rates of up to 8 µl/min with either acetonitrile, or methanol as the strong mobile phase. 4-5 Recently there has been momentum towards environmentally friendly or green chemistry approaches in the scientific community. One way in which scientists can address this issue is to limit the use of hazardous chemicals in their everyday processes. This very issue was recently highlighted in the June 212 peer-reviewed Bioanalysis Journal. Moreover, reduction in chemical usage further eliminates the need for specialized storage conditions for flammable chemicals such as acetonitrile and methanol. ionkey/ms: Enhanced MS with the turn the Key. Reduce the consumption and storage of mobile phase chemicals when analyzing typical bioanalytical samples. Figure 1. ionkey/ms System: comprised of the Xevo TQ-S, the ACQUITY UPLC M-Class, the ionkey source and the ikey Separation Device. One such approach to reduce the use of chemicals in the bioanalytical laboratory is to, therefore, reduce the amounts of strong mobile phase consumed during LC-MS analysis. This can be accomplished via reduction of the column diameter which results in lower required flow rates and therefore less overall consumption. In this work, we present the reduction in mobile phase consumption and the associated cost savings to perform bioanalytical work by utilizing the ionkey/ms System. 176
180 THE SOLUTION The ionkey/ms System, shown in Figure 1, consists of the ceramic-based separations device with an integrated emitter together in a single ikey Separation Device that is placed directly into the source of the mass spectrometer. With the ionkey/ms System, all fluidic connections are made through the turn of a handle thereby creating a true plug and play capillary scale instrument. As previously stated, most current LC-MS/MS assays employ 2.1 mm I.D. columns run at flow rates up to.8 ml/min. Optimal LC flow rates are dependent on a number of factors including: column diameter, particle size of the packing material contained in the LC column, the size of the analyte, as well as the ability for the mass spectrometer to desolvate the column effluent. One approach in reducing the amount of organic solvent required for a LC-MS/MS analysis is to use a chromatographic column of smaller diameter. Chromatographic theory suggests that as the column diameter is decreased; the flow rate at which the column is run is decreased by the square of the column diameter. For example, reduction from a 2.1 to a.15 mm I.D. column packed with the same chromatographic particle size will realize a (2.1) 2 /(.15) 2 = 196 fold decrease in the amount of solvent consumed. Therefore when analyzing a typical 96-well plate run by standard 2.1 x 5 mm column at.8 ml/min with a 5 minute cycle time, the total mobile phase consumption is 384 ml. The same analysis run on a.15 mm I.D. column at.4 ml/min would only require 2 ml total mobile phase consumption, a reduction of over 99. This greatly reduces the amount of waste that is generated during analysis as well as the amount of space required to store the flammable, organic solvents used in the strong mobile phase preparation. This reduction in mobile phase delivers further benefits in the cost per analysis. The graph in Figure 2 shows a typical gradient profile during one inject to inject cycle used in bioanalytical LC-MS analysis. Gradient Profile 1. Percent organic Minutes Figure 2. Typical, generic, LC gradient profile utilized for analysis of biological samples. Often with the inherent high sensitivity of modern MS instruments, cleaner solvents must be used as a source for the strong, organic mobile phase. These solvents can be quite expensive, costing greater than $1. per liter. The use of the organic mobile phase changes throughout the LC-MS analysis as illustrated in Figure 2, therefore reduces the required consumption of these costly solvents, leading to lower cost-per-analysis. Table 1 illustrates the reduction in the cost-per-analysis of one 96-well plate utilizing a 2.1 mm I.D. column and a.15 mm I.D. column geometrically scaled and based of the cost of 1 L of acetronitrile of $123.. In the example illustrated in Table 1, the cost saving can be substantial when reducing the column I.D. from 2.1 mm to.15 mm. Column I.D./flow rate Organic (ml consumed during cycle steps) Total ml consumed Cost/96-well plate (USD) 2.5 min gradient.5 min wash 2 min condition 2.1 mm.8 ml/min $ mm.4 ml/min $.9 Table 1. Cost associated with organic mobile phase consumption when compared versus column I.D. ionkey/ms System: Moving Toward Greener, More Sustainable Chemistry Methods by Reducing Mobile Phase Consumption 177
181 SUMMARY Safety, the ability to obtain critical information, and cost associated with analysis, represent three aspects that must be balanced in the bioanalytical laboratory. Modifications to current techniques that can address these important business aspects will become even more critical moving forward in today s pharmaceutical environment. Approaches such as the strategy outlined in this work to reduce consumption and associated required storage of hazardous, flammable chemicals for LC-MS analysis, can address some of these concerns. References 1. Hofgartner G, Bourgogne E, Quantitative high-throughput analysis of drugs in biological matricies by mass spectrometry, Mass Spectrom. Rev. 22, (23). 2. Jemal M, Xia YQ, LC-MS Development strategies for quantitative bioanalysis, Curr. Drug Metab. 7, (26). 3. Bielawski J, Pierce JS, Snider J, Rembiesa B, Szulc ZM, Bielawska A, Comprehensive quantitative analysis of bioactive sphingolipids by high-performance liquid chromatography-tandem mass spectrometry, Methods in Mol. Biol. 579, (29). 4. Xu RN, Fan L, Rieser MJ, El-Shourbagy TA, Recent advances in high-throughput quantitative bioanalysis by LC-MS/MS, J Pharm. Biomed. Anal. 44, (27). 5. Liu G, Snapp HM, Ji QC, Arnold M, Strategy of accelerated method development for high-throughput bioanalytical assays using ultra high-performance liquid chromatography coupled with mass spectrometry, Anal. Chem. 81, , (29). Waters, ACQUITY UPLC, Xevo, and The Science of What s Possible are registered trademarks of Waters Corporation. ionkey/ms, ionkey and ikey are trademarks of Waters Corporation. All other trademarks are property of their respective owners. 216 Waters Corporation. Produced in the U.S.A. January EN TC-PDF Waters Corporation 34 Maple Street Milford, MA 1757 U.S.A. T: F: ionkey/ms System: Moving Toward Greener, More Sustainable Chemistry Methods by Reducing Mobile Phase Consumption


182 The ikey Separation Device as a More Efficient, Yet Simple-To-Use, Alternative to Conventional Capillary Columns Moon Chul Jung, Abhijit Tarafder, and Erin Chambers Waters Corporation, Milford, MA, USA GOAL To evaluate the chromatographic performance of ikey Separation Devices in comparison to equivalent ACQUITY UPLC M-Class Columns. BACKGROUND Microflow chromatography, coupled with a high-sensitivity mass spectrometer, offers many benefits over standard-flow chromatography. The reduced flow rate, typically at less than 5 µl/min, increases ionization efficiency and analysis sensitivity while requiring less sample and consuming less mobile phase. These advantages make microflow chromatography the tool of choice in analyzing complex samples with limited availability, such as in biomarker discovery, proteomics, and several other types of -omics research. Taking full advantage of a traditional microflow LC-MS system requires expert attention as, for example, fluidic connections need to be handled with great care. Small leaks or improperly set fittings make the system susceptible to extra column dispersion, a corresponding loss in efficiency and sensitivity, and potentially even carryover issues. Waters introduced the ionkey/ms System and ikey Separation Devices in 214. The system integrates the microflow UPLC separation directly into the MS source through the plug-and-play design of the ikey. This addressed the problems associated with conventional microflow chromatography. The fitting-less device connects the separation ikey Separation Devices outperform conventional 15 µm I.D. microflow columns by providing improved chromatographic performance, spray stability, and usability through the easy-to-use, plug-and-play design. Peptide Sequence Parent (m/z) T6 SIVPSGASTGVHEALEMR T11 NVNDVIAPAFVK T43 VNQIGTLSESIK T43p VNQIGpTLSESIK T38 TAGIQIVADDLTVTNPK Table 1. Monitored proteolytic peptides and their SRM conditions. Daughter (m/z) Cone voltage (V) Collision energy (ev) channel inside the ikey to the system with minimal dispersion and uservariability. This enables the laboratory to utilize highly sensitive microflow LC-MS without worrying about the integrity of fluidic connections and extra-column dispersion. The ikey Separation Devices and the ionkey/ms System transformed microflow chromatography from what was once a hard-to-use system to a simple plug-and-play experience. 179
183 THE SOLUTION The chromatographic performance of ikey Peptide CSH C 18 Separation Device, 1.7 µm, 15 µm x 1 mm (p/n ) and ACQUITY UPLC M-Class Peptide CSH C 18 Column, 13Å, 1.7 µm, 15 µm x 1 mm (p/n ) was investigated using microflow chromatographic separations of proteolytic peptide standards. The MassPREP Enolase Digest with Phosphopeptides Mix (p/n ) was diluted to 1 fmol/µl and directly introduced to an ACQUITY UPLC M-Class System via 5 µl full loop direct injection. The mixture was separated with a 2 µl/min water/acetonitrile gradient, each with.1 formic acid, running from 3 to 4 acetonitrile over 15 minutes. Five peptide SRMs (Table 1) were monitored on a Xevo TQ-S MS equipped with corresponding ion sources: an ionkey Source for ikeys and a NanoFlow ESI Source for ACQUITY UPLC M-Class Columns. Chromatographic performance was assessed using the results of five replicate chromatographic runs on four ikeys and four ACQUITY UPLC M-Class Columns. Figure 1 and Figure 2 show SRM chromatograms representative of each chromatographic device. Table 2 presents the chromatographic data obtained with each set of devices. Notably, retention times on the ikeys are almost identical (within 2) to those on the ACQUITY UPLC M-Class Columns of same dimensions, thus existing methods for 15 µm I.D. columns may be used on ikeys without the need for redeveloping the method from scratch. The retention time variation within four ACQUITY UPLC M-Class Columns was less than 2 RSD and less than 1 RSD for four ikeys over a wide range of analyte retention times. The retention time variation within five replicate injections on a single ikey/column was excellent, at less than.1 RSD. The average peak width measured at 13.4 peak height (4σ peak width) from ikeys was 25 less than that from equivalent ACQUITY UPLC M-Class Columns, which demonstrates that superior chromatographic efficiency can be achieved with ikey Separation Devices (Figure 2, Table 2). The high efficiency of ikeys can also be confirmed from the observed peak capacity values. The ikeys were found to produce a half-height peak capacity of 294, while the ACQUITY UPLC M-Class Column s peak capacity was 26. Accordingly, users can resolve 4 more peaks when using the same gradient run on ikeys compared to the equivalent ACQUITY UPLC M-Class Columns (Figure 1). In addition, the sharper peaks produced by ikeys result in increased peak heights and improvements in assay sensitivity : MRM of 2 Channels ES+ 1 TIC (684 T43p) 3.43e6 T43p 9.71 min : MRM of 2 Channels ES+ 1 TIC (644.9 T43) 1.76e7 T min : MRM of 2 Channels ES+ 1 TIC (643.9 T11) 1.37e7 T min : MRM of 2 Channels ES+ 1 TIC (614 T6) 8.99e6 T min ikey Separation Device Average P C (half-height) = 294 T min 5: MRM of 2 Channels ES+ TIC (878 T38) 4.44e6 Time : MRM of 2 Channels ES+ 1 TIC (684 T43p) 5.58e6 T43p 9.66 min : MRM of 2 Channels ES+ 1 TIC (644.9 T43) 7.87e6 T min : MRM of 2 Channels ES+ 1 TIC (643.9 T11) 6.14e6 T min : MRM of 2 Channels ES+ 1 TIC (614 T6) 5.36e6 T min ACQUITY UPLC M-Class Column Average P C (half-height) = 26 T min 5: MRM of 2 Channels ES+ TIC (878 T38) 1.72e6 Time Figure 1. Typical chromatograms using an ikey Separation Device (left), and an ACQUITY UPLC M-Class Column (right). The reported peak capacity values are averages of half-height peak capacity values for all five peaks. 18 The ikey Separation Device as a More Efficient, Yet Simple-To-Use, Alternative to Conventional Capillary Columns
184 The detector sensitivity is another factor that influences the peak height. On an electrospray MS interface, a stable spray increases MS sensitivity by providing a stable ion signal with a low background noise. It can often be difficult to produce a stable spray when using a typical microflow fused silica capillary emitter. Whether it is a pulled or an etched tip, a fused silica emitter tip is mechanically fragile and easily damaged upon exposure to high voltage. Users must replace emitters to maintain system performance. The stainless steel emitter on ikey Separation Devices, on the other hand, provides stable and consistent spray throughout the lifetime of the device. With the metal emitter being an integral part of each ikey, users do not need to make a post-column fluidic connection to a separate emitter. This simplifies the lab workflow by saving setup time. It also prevents users from compromising analysis sensitivity and the system reproducibility by accidentally damaging the capillary end or creating a void. 1 Figure 2. Comparison of chromatographic peaks from the 15 µm ACQUITY UPLC M-Class Column (blue traces) and the ikey Separation Device (green traces). Retention times were offset for easy comparison. T43 (left) is an early eluter, and T38 (right) is a late eluter. ikey Separation Device (.77 RSD) (.56 RSD) T43 on an ikey T43 on an M-Class Column Time 1 Retention time (minute) Early eluter Late eluter Peak width, 4σ (second) T38 on an ikey T38 on an M-Class Column ACQUITY UPLC M-Class Column, 15 µm (1.63 RSD) (1.12 RSD) Tim 5.54 (3.76 RSD) Early eluter 7.5 (4.36 RSD) SUMMARY ikey Separation Devices outperform equivalent ACQUITY UPLC M-Class Columns by providing more stable spray, 4 greater peak capacity, and corresponding increases in assay sensitivity. The device-to-device retention time reproducibility is excellent for both ikeys and ACQUITY UPLC M-Class Columns at less than 2 RSD. The retention times on the ikey Separation Devices are within 2 of those observed on equivalent ACQUITY UPLC M-Class Columns running the same gradient method. 5.9 (3.35 RSD) Late eluter 7.98 (2.4 RSD) Average peak capacity at half-height Table 2. Chromatographic Performance of 15 µm ACQUITY UPLC M-Class Columns and ikey Separation Devices, averaged over five replicate injections on four columns/ikeys. Values in parentheses are relative standard deviations ( RSD) within the four columns or the four ikeys. ikey Separation Devices offer the unique advantage of easy-to-use, highly sensitive microflow chromatography through an innovative plug-and-play design. That existing ACQUITY UPLC M-Class Column methods can be applied to ikey Separation Devices underscores the accessibility of this new format of microflow chromatography. Waters, The Science of W hat s Possible, UPLC, ACQUITY UPLC, and Xevo are registered trademarks of Waters Corporation. ionkey/ms, ionkey, ikey, MassPREP, and NanoFlow are trademarks of Waters Corporation. All other trademarks are the property of their respective owners. 215 Waters Corporation. Produced in the U.S.A. November EN TC-PDF Waters Corporation 34 Maple Street Milford, MA 1757 U.S.A. T: F: The ikey Separation Device as a More Efficient, Yet Simple-To-Use, Alternative to Conventional Capillary Columns 181
185


186 WHITE PAPERS
187 ENHANCING MASS SPECTROMETRY SENSITIVITY BY REDUCING CHROMATOGRAPHIC FLOW RATES WITH IONKEY/MS James P. Murphy, Jay Johnson, and Paul D. Rainville, Waters Corporation There is consistent pressure for scientists to achieve lower limits of quantitation as many are limited by smaller sample volumes available for analysis or are challenged to detect more potent analytes in biological matrices. This has led scientists to investigate microflow LC as an alternative to standard flow LC (2.1-mm column format) as this technique has shown to increase sensitivity and ionization efficiency as well as reduce ion suppression. This white paper will review the sensitivity benefits that can be expected when operating at a microscale flow rate with the Waters ionkey/ms System in comparison to a 2.1-mm column format, as well as explain why this signal enhancement is possible. 184


188 INTRODUCTION The need for greater sensitivity in an LC/MS analysis has driven development of more efficient ion sources and ion optics in mass spectrometers. Even with such advances, biological assays still may demand greater sensitivity than what may be currently available with a standard LC/MS system. Additional sensitivity gains can be realized by reducing the amount of solvent flow to the ion source while reducing the column diameter from a traditional 2.1-mm diameter to a microflow format. At these reduced flow rates, sensitivity gains of 1X to 2X can readily be achieved. At flow rates greater than 1 µl/min, a significant portion of sensitivity is lost due to poor ionization efficiency and limited sampling efficiency. An electrospray plume generated from conventional LC flow rates can be quite broad and divergent. The inlet to a mass spectrometer only has the ability to sample a portion of the electrospray plume. Most commonly, this is done by positioning the electrospray probe orthogonally to the inlet and sampling on the edges of the plume where fine droplets are present (Figure 1, top). As the solvent flow rate is reduced, the electrospray plume decreases in size and becomes more convergent (Figure 1, bottom). This allows the inlet of the mass spectrometer to become more efficient and capture a greater percentage of the plume. This results in an increase in ion signal. Mass-sensitive detection, not concentration-sensitive The increase in sensitivity or ion signal is roughly proportional to the decrease in column diameter and flow rate. 1 This behavior is similar to a UV detector, which responds to the concentration of the analyte in the mobile phase rather than the absolute amount or mass of the analyte. This has led electrospray to be characterized as a concentration-sensitive technique, even though it has been generally understood that electrospray is a mass-sensitive phenomena. 2 Although concentration and sensitivity appear to follow the same trend, the ion signal at low flow rates does not increase as rapidly as the concentration of an analyte within the mobile phase, showing that the two are not directly coupled. In actuality, a mass spectrometer is a mass-flow-sensitive detector 3 where signal response is proportional to the amount of sample reaching the detector per unit time. To illustrate this, an infusion was performed with a constant concentration of analyte at increasing flow rates (Figure 2). With the solution of analyte (verapamil) maintained at the same concentration, the higher flow rate results in a larger signal as there is a greater amount or mass of the sample entering the mass spectrometer per unit time. Figure 1. The size of the electrospray plume decreases as the flow rate decreases. Top: Standard ESI source operated at 6 µl/min. Bottom: ionkey/ms source operated at 3 µl/min m/z m/z Figure 2. Infusion of an 833 pg/ml solution of verapamil. Top: Flow of 6 µl/min into a standard ESI source. Bottom: Flow of 3 µl/min with an ionkey/ms source. The higher flow exhibits a 27X increase in signal response for infusion. 455 Enhancing Mass Spectrometry Sensitivity by Reducing Chromatographic Flow Rates with ionkey/ms 185
189 Concentration-sensitive behavior is only observed when analytes are eluted as chromatographic peaks where lower flow rates result in increased signal response. Under this condition, the same amount of analyte is eluted from a column per unit time with varying amounts of solvent. The lower solvent flow generates a finer, less-disperse electrospray plume and allows for greater sampling efficiency by the mass spectrometer. Sensitivity enhancement scaling down from 2.1-mm column format To demonstrate the increase in sampling and ionization efficiency, numerous analytes were analyzed at flow rates between.45 and 6 µl/min using a combination of commercially available UPLC columns and prototype microfluidic devices (Table 1). The flow rate for each column dimension was scaled according to the square of the column s internal diameter to maintain the same linear velocity through the column. The signal response are presented in area counts to eliminate possible differences observed in peak height due to varying separation efficiencies and post-column band broadening. The gain in area counts were all compared to the equivalent separation in a 2.1-mm column. Column ID Column Body Flow Rates 2.1 mm ACQUITY UPLC Column 2-6 µl/min 1. mm ACQUITY UPLC Column 15 µl/min 3 µm PEEK-Sil Capillary Column 12 µl/min 15 µm ikey 1-4 µl/min 75 µm nanoacquity UPLC Capillary Column 45 nl/min Table 1. Screened flow rate combinations. Sensitivity gains were achieved for a variety of analytes by comparing equal injection volumes by lowering the mobile phase flow and column diameter from a 2.1-mm I.D. column format (Figure 3). The average enhancement ranged from 2X to as much as 5X for a series of small molecule pharmaceutical analytes, depending on the flow rate (Figure 4). The signal enhancement did not directly match the corresponding increase in peak concentration at lower flow rates for each column I.D. (Table 2). Sensitivity Improvement from 2.1-mm Scale Flow Rate (µl/min) Figure 3. The average signal enhancement with reducing column diameters and flow rates in comparison to a 2.1-mm format for a series of small molecules (lidocaine, propanolol, dextromethorphan, fluconazole, alprazolam, and verapamil). All injections were made with the same concentration solution and a volume of 1 µl. Column Diameter 75-µm I.D. 15-µm I.D. Average Sensitivity Enhancement, Small Molecule/Peptides Table 2. Average sensitivity enhancement. Ratio of Signal Response, Area (ikey/2.1 mm) µm I.D. 1-mm I.D. 2.1-mm I.D. Eluting Peak Concentration 2.1 mm 1X 1X 1. mm 2X / 3X 4.4X 3 µm 3.2X / 6X 49X 15 µm 9X / 16X 196X 75 µm 5X / >1X 784X The amount of signal enhancement varied depending on the chemical properties of each analyte. The sensitivity enhancement observed for a separation on a 15-µm I.D. Waters ikey separation device, for instance, varied from 9X for verapamil, to 83X for alprazolam at 1 µl/min (Figure 4). Lidocaine Propanolol Dextromethorphan Fluconazole Alprazolam Verapamil ikey Flow Rate (µl/min) Figure 4. The signal enhancement with the Waters ikey device in comparison to a 2.1-mm format for a series of small molecules at flow rates from 1 to 4 µl/min (lidocaine, propanolol, dextromethorphan, fluconazole, alprazolam and verapamil). 186 Enhancing Mass Spectrometry Sensitivity by Reducing Chromatographic Flow Rates with ionkey/ms
190 A typical chromatogram comparing the Waters ikey with a 2.1-mm column is shown in Figure µm ikey as compared to a 75-µm I.D. column format. The sharper peaks provide better resolution and sensitivity realizing the true benefit benefits of a UPLC separation mm column Time Peak Width (s) Figure 5. Chromatographic response of a 62.5-pg/mL injection of verapamil on a 15-µm ikey separation device and a 2.1-mm column. The retention times have been adjusted to better show the comparison. It has been suggested that analytes with hydrophobic functional groups of large molecular volume have increased droplet surface affinity. 4 This may account for the improvement in ESI response. Peptides generally exhibited a better response as compared to small molecules (Figure 6). Ratio of Signal Response, Area (ikey/2.1 mm) AEFVEVTK VLGIDGGEGKEELFR LVNELTEFAK NVNDVIAPAFVK VLYPNDNFFEGK ikey Flow Rate (µl/min) Figure 6. The signal enhancement with the Waters ikey device in comparison to a 2.1-mm format for a series of tryptic peptides from an Enolase digest at a flow rates from 1 to 4 µl/min. The 15-µm ikey separation channel dimension appears to be an inflection point where the observed sensitivity gain begins to increase non-linearly with reduced flow rate (Figure 4). At this scale, the flow rate can be altered from 1 to 4 µl/min with minimal impact on chromatographic performance (Figure 7). At nanoflow rates (< 1 µl/min), sensitivity gains may be observed at the expense of instrument throughput. The LC system volume (including sample loop) has a greater impact on nanoflow separations (75-µm I.D.) and it creates a gradient delay and long column equilibration time. The 15-µm ikey separation channel dimension provides enhanced sensitivity while maintaining rapid throughput. Additionally, improved chromatography and narrower peaks are observed at 15-µm I.D Flow Rate (µl/min) Small Molecules Peptides Figure 7. Average peak width for a small molecule separation (5-min gradient, 5 to 95 B) and a peptide separation (1-min gradient, 5 to 45 B). SUMMARY Sensitivity gains were observed for both small molecules and peptides by comparing equal injection volumes with reduced mobile phase flow and column diameter, from 2.1-mm to 15-µm I.D. The signal enhancement realized at microliter/minute flow rates in this study ranged from 2X to 83X and is molecule-dependent. The 15-µm ikey separation channel dimension offers a unique balance between enhanced sensitivity and optimal throughput. Enhancing Mass Spectrometry Sensitivity by Reducing Chromatographic Flow Rates with ionkey/ms 187
191 References 1. G. Hopfgartner, K. Bean, J. Henion, and R Henry, J Chromatogr A, 647 (1993) T. R. Covey et al, R. Cole (Eds) Electrospray and MALDI Mass Spectrometry: Fundamentals Practicalities and Biological Applications, Second Edition, Wiley and Sons Inc., 21, B.L. Karger and P. Vouros, J Chromatogr, 323 (1985) C, G. Enke et al, Anal Chem, 72 (2) 11. Waters, The Science of What s Possible, UPLC, ACQUITY UPLC, and nanoacquity UPLC are registered trademarks of Waters Corporation. ionkey/ms and ikey are trademarks of of Waters Corporation. All other trademarks are the property of their respective owners. 214 Waters Corporation. Produced in the U.S.A. February EN TC-PDF Waters Corporation 34 Maple Street Milford, MA 1757 U.S.A. T: F: Enhancing Mass Spectrometry Sensitivity by Reducing Chromatographic Flow Rates with ionkey/ms
192 TAKING ADVANTAGE OF SIGNIFICANT REDUCTIONS IN ION SUPPRESSION USING IONKEY/MS COMPARED TO STANDARD-FLOW LC/MS Jay S. Johnson, Paul D. Rainville, and James P. Murphy, Waters Corporation This white paper compares ion suppression levels of the Waters ionkey/ms System to those of a standardflow LC/MS system. In both peptide and small molecule applications, it is shown that the ionkey/ms System delivers a significant reduction in ion suppression characteristics due to the lower flow rates utilized during its analysis. 189
193 INTRODUCTION Ion suppression is defined as the loss of signal of an analyte of interest caused by the coelution and ionization of an interfering compound. Often in bioanalytical applications, phospholipids present in the protein-crashed plasma matrix can interfere and cause near-total elimination of the analyte of interest s signal. 1 This unwanted suppression of the signal significantly reduces the performance, precision, and accuracy of a quantitative assay and leads to inconclusive results. Accordingly, the coeluting compound must be mitigated by a gradient, stationary phase, or column length adjustment, and, in extreme cases, a sample preparation adjustment to return the assay to biological relevance. The Waters ionkey/ms System operates in the 1-5 µl/min or microspray flow regime and as such offers considerable sensitivity improvements and ion suppression reductions compared to standard-flow LC/MS systems operating at 1s of µl/min. The sensitivity improvements are attributed to an increase in sampling efficiency by the mass spectrometer at lower flows. 2 The reduction in ion suppression is attributed to the increased surface-to-volume ratio of the smaller initial droplet size that results from the lower flows. 3 Recent scientific literature has shown that nanospray applications with flow rates of less than 1 nl/min offer significant reductions in ion suppression effects 4 and greater tolerance to salt contamination than the ESI sources utilized on standard-flow LC/MS systems. 5 Furthermore, ion suppression was shown to be completely eliminated at flow rates below 2 nl/min. 6 However, nanospray at these extremely low flow rates is not always practical in many workflows due to long delay times and a perceived lack of robustness and stability of the small diameter columns and ESI emitter tips. 7 Microspray, exemplified by the ionkey/ms System, offers a robust, 8 easy to use, and relatively highthroughput platform alternative to nanospray while retaining a beneficial reduction in ion suppression compared to standard ESI. The reduction in ion suppression afforded by the ionkey/ms System is characterized in the following experiment. 19 Taking Advantage of Significant Reductions in Ion Suppression Using ionkey/ms Compared to Standard Flow LC/MS
194 Comparison of ion suppression characteristics To compare the ion suppression characteristics of ionkey/ms to standard-flow LC/MS, the instrument configuration shown in Figure 1 and experimental conditions described in Table 1 were used. Infusion Pump SM Column Tee ionkey or Standard ESI Source Tandem Quadrupole MS LC Figure 1. Instrument configuration. For standard-flow LC/MS the separation channel is a 2.1 mm x 5 mm column. The separation channel used in ionkey/ms is a 15 µm x 5 mm ikey. Standardflow LC/MS ionkey/ms LC system ESI source Total flow rate Analytical flow rate Post-column infusion flow rate ACQUITY UPLC Standard ESI 6 µl/min 577 µl/min 23 µl/min ACQUITY UPLC M-Class ionkey 3 µl/min 2.89 µl/min.11 µl /min Table 1. Experimental conditions. The post-column infusion flow rate is approximately 4 of the total flow rate for both flow rate regimes. The analytes of interest, a mixture of peptides and small molecules, were injected using the LC system and separated chromatographically using the same gradient conditions. Analyte detection was performed using multiple reaction monitoring (MRM) on the Xevo TQ-S System. To generate the control data point, the analytes of interest were exposed to a post- column infusion of 66:33 acetonitrile/water (v/v) supplied by the infusion pump at the flow rates seen in Table 1. The suppressed data point was generated by exposing the analytes of interest to a post-column infusion of a 3:1 protein precipitation of rat plasma using the same infusion solvent and flow rates as the control. The diluted rat plasma was introduced into the infusion flow stream by filling an appropriately sized sample loop offline. Accordingly, the analytes are exposed to all potential suppressors present in the diluted rat plasma, including phospholipids, across the entire gradient thereby avoiding any retention time differences between the scales that could alter suppression characteristics. This instrument configuration does not provide any information on the analytes of interest and their specific coeluting suppressors present in the diluted rat plasma, but instead affords a controlled comparison of the ion suppression compared to the control for each flow regime. Microspray using ionkey/ms offers significant reductions in ion suppression compared to the standardflow LC/MS system for all analytes tested. The signal in height of the model peptide, LVNELTEFAK, seen in Figure 2 is suppressed approximately 6.8 times on the ionkey/ms when exposed to all potential suppressors in the diluted rat plasma compared to the control. In comparison, the signal of the standard-flow LC/MS is suppressed approximately 218 times compared to the control. Therefore ionkey/ms shows a decrease in suppression on the order of 32 times when compared to the standard-flow platform for this model peptide. Taking Advantage of Significant Reductions in Ion Suppression Using ionkey/ms Compared to Standard Flow LC/MS 191
195 For the model small molecule shown in Figure 3, dextromethorphan, ionkey/ms shows suppression on the order of approximately 1.9 times compared to the control, while the standard-flow LC/MS shows suppression on the order of 24.5 times. Accordingly, ionkey/ms also shows a reduction in suppression for this small molecule of about 13 times when compared to its standard-flow counterpart, reinforcing the conclusion that ionkey/ms offers significant reductions in ion suppression x -218x ionkey/ms Time Standard Flow LC/MS Time Figure 2. LVNELTEFAK suppression comparison. The red trace is performed with a 4 post column infusion of the infusion solvent (control). The green trace is performed with a 4 post column infusion of diluted rat plasma (suppressed). Signal loss = signal of neat / signal of suppressed x -24.5x Time Time ionkey/ms Figure 3. Dextromethorphan suppression comparison. Standard Flow LC/MS Effect on quantification The quantitative extent of area suppression is analyte-dependent and the reduction in suppression between the ionkey/ms and the standard-flow LC/MS is not the same for each analyte and class of analyte as seen in Figure 4 and 5. This can be attributed to the fact that the surface activity and timeframe for the analyte to reach the surface of the droplet, as well as the size of the droplet, differ drastically between the two flow regimes, effectively altering ionization efficiency. Moreover, it is interesting to note that although ionkey/ms does suffer ion suppression effects for all analytes, it is far less and not nearly as pervasive as that which is encountered when using standard-flow LC/MS. In fact, the analyte-of-interest s signal on the standard-flow LC/MS is nearly totally eliminated, making quantitative area measurements exceedingly difficult. 192 Taking Advantage of Significant Reductions in Ion Suppression Using ionkey/ms Compared to Standard Flow LC/MS
196 Percentage of Area Signal Lost Due to Ion Suppression IGDYAGIK AEFVEVTK VIFLENYR LVNELTEFAK NVNDVIAPAFVK VNQIGTLSESIK VVGLSTLPEIYEK average Suppression = Area of Neat Area of 3:1 *1 Area of Neat Average Suppression of Average Suppression of ionkey/ms Standard Flow LC/MS Neat (control) Figure 4. Percent area suppression of peptides on ionkey/ms vs. standard-flow LC/MS. Percentage of Area Signal Lost Due to Ion Suppression lidocaine propanolol dextro flucanazole verapamil average Suppression = Area of Neat Area of 3:1 *1 Area of Neat Average Suppression of Average Suppression of ionkey/ms Standard Flow LC/MS Neat (control) Figure 5. Percent area suppression of small molecules on the on ionkey/ms vs standard-flow LC/MS. CONCLUSIONS The beneficial implications of the substantial reduction of ion suppression resulting from matrix interferences when using ionkey/ms in a typical workflow will be numerous. In the familiar case of a coeluting compound causing suppression of your analyte of interest in a standard-flow LC/MS separation, it is highly probable that the reduction in signal suppression afforded by ionkey/ms will allow you to avoid significant extra effort in sample preparation and chromatographic troubleshooting. Furthermore, the LLOQ of a user s assay will be substantially reduced, allowing detection of trace quantities of the analyte of interest. The reduction in LLOQ is a result of the sensitivity gain realized when moving to lower flow rates 9 being a summation of the increased sampling efficiency and the Taking Advantage of Significant Reductions in Ion Suppression Using ionkey/ms Compared to Standard Flow LC/MS 193
197 decrease in ion suppression. ionkey/ms is beneficial and more sensitive than standard-flow LC/MS as it is fundamentally less prone to ion suppression due to the lower flow rates utilized, making it an attractive platform for a variety of applications. References 1. Chambers, E. J. Chromatogr. B. 27, 833(2), Covey, T.R. Mass Spectrometry Reviews. 29, 28, Karas, M. JASMS. 23, 14, Vouros, P. Anal Chem. 21, 73, Karas, M. JASMS. 1999, 1, Karas, M. JASMS. 23, 14, Majors, R. LC/GC. 213, 31(8), Robustness of ionkey/ms System in the Analysis of Pharmaceutical Compounds in Biological Fluids. Waters Corporation, 214; en. 9. Enhancing Mass Spectrometry Sensitivity by Reducing Chromatographic Flow Rates with ionkey/ms. Waters Corporation, 214; en. Waters, The Science of What s Possible, ACQUITY UPLC, and Xevo are registered trademarks of Waters Corporation. ionkey/ms and ikey are trademarks of of Waters Corporation. All other trademarks are the property of their respective owners. 214 Waters Corporation. Produced in the U.S.A. February EN TC-PDF Waters Corporation 34 Maple Street Milford, MA 1757 U.S.A. T: F: Taking Advantage of Significant Reductions in Ion Suppression Using ionkey/ms Compared to Standard Flow LC/MS
198 POST-COLUMN ADDITION AS A TOOL TO ENHANCE PERFORMANCE IN MICROFLOW LC-MS Angela Doneanu, Michael Donegan and Jim Murphy The need for improving electrospray ionization (ESI-MS) sensitivity has been the driving force behind many of the recent technological advances in the mass spectrometry field. A solution that has gained significant interest is microflow LC-MS, where the separation takes place at flow rates lower than 5 µl/min using columns with an internal diameter between.1 and 1. mm. The increased sensitivity observed with microflow LC-MS can be attributed in part to the enhanced ionization processes, but mostly to better sampling efficiencies obtained using lower flow rates. 195
199 With a standard ESI, the high flow and the large diameter of the spray tip produce a relatively broad and divergent plume of rather large droplets. As a result, only a very small fraction of the ions can be sampled by the sampling orifice. With micro and nanospray, smaller droplets are formed requiring fewer fissionable events and the spray tip produces a more convergent plume resulting in more ions being sampled. Analyte molecule Solvent evaporation Spraying Nozzle Charged parent droplet e Taylor cone +ve Coulomb fission Charged droplet at the Rayleigh limit Power Supply ve Naked charge analyte + + Charged progeny droplets + + Figure 1. The electrospray process. Ions present in a solution are transferred to a gas phase, which involves three major steps: (1) production of charged droplets at the ES capillary tip; (2) shrinkage of the charged droplets by solvent evaporation and repeated droplet disintegrations, leading ultimately to very small highly charged droplets capable of producing gas-phase ions, and (3) the actual mechanism by which gas-phase ions are produced from the very small and highly charged droplets. In examining fundamental aspects of the electrospray ionization phenomenon, several solvent properties have proven to be important parameters in determining success of the electrospray process. These properties include: surface tension, conductivity, viscosity, and dielectric constant of the solution. The surface tension of the solvent impacts the required electric field at the capillary tip for producing a stable electrospray. 1 For a given solvent, the required electrospray voltage increases with the square root of the surface tension. Solvents with low surface tension could be used to reduce the required voltage and decrease the likelihood of an electric discharge that could degrade the performance of electrospray ionization. Surface tension also plays a role in droplet shape. The radius of an initially formed charged droplet, as well as its Rayleigh limit, is a function of the surface tension of the liquid. 2,3 Water, having higher surface tension than organic solvents, produces larger initial droplets. In addition, the evaporation of water from the charged droplet is slower than the evaporation of the organic solvent (Figure 1). For these reasons, the disintegration of the charged droplets is less efficient with water than with organic solvents and the number of droplets emitting gas-phase ions is decreased. The surface tension of liquid mixtures has been investigated by several researchers. 4-6 In particular, Hassani 7 examined the surface tension of several alcohol-water mixtures. This study showed there is a nonlinear decrease in surface tension with the addition of alcohols. Among several alcohols investigated, isopropanol-water mixture exhibited the lowest surface tension and thus was selected as the model post-column addition modifier in our study. The ideal solvent composition for ESI analysis is application dependent. Analysis in the positive ion mode requires different solvent characteristics than analysis in the negative ion mode, and the response of a given analyte can be enhanced or suppressed in different solvent systems. 8 However, it may be necessary to deviate from the ideal solvents in order to maintain non-covalent interactions and protein conformation or to interface with liquid chromatography. The optimal conditions for liquid chromatography may not always be compatible with electrospray ionization mass spectrometry. The presence of non-volatile ionic species, such as phosphate and sulfate buffers in the ESI spray is deleterious. Strong acids, such as trifluoroacetic acid (TFA), heptafluorobutyric acid (HFBA), and hydrochloric acid, which are used as ion-pairing agents in LC, also tend to surpress the analyte signal in ESI-MS. Modification of the mobile phase (e.g. addition of buffers, changing the ph and solvent strength) may be required to enhance the compatibility of the mobile phases with the detector. Altering solvent properties by post-column addition of a modifier can be an effective technique to improve sensitivity without affecting the chromatographic separation. 196 Post-column Addition as a Tool to Enhance Performance in Microflow LC-MS

200 Figure 2. Post-column addition (PCA) ikey. The analytical channel is connected to the upper port and the post-column addition channel is connected to the right port. The use of post-column addition is the best means to decouple the LC from the MS. In this way, an optimal ESI MS performance can be achieved by applying the post column addition without interfering with the previously optimized LC condition. The plug-and-play design of the ionkey/ms System allowed the development of a post-column addition device eliminating all user-made fluidic and electronic connections. The post-column addition (PCA) ikey contains two channels, a 15 μm I.D. channel packed with sub-2-μm particles, and an open channel used for post column addition of solvent (Figure 2). The two channels meet after the chromatographic separation completes and prior to the emitter leaving insignificant dead volume. The use of a PCA ikey requires an ACQUITY UPLC M-Class Auxiliary Solvent Manager (ASM) to provide a stable and accurate flow to the post column addition channel. The experiments were performed using the ionkey/ms system composed of the ACQUITY UPLC M-Class, the ionkey source, and Xevo G2-XS QTof or Xevo TQ-S Mass Spectrometer. The modifier was introduced at flow rates ranging from 1 to 1 nl/min. 1. IMPROVEMENTS IN NEGATIVE IONIZATION First, the use of isopropanol to lower the surface tension to enhance the ionization process and sensitivity was evaluated. Metabolite profiling of biological samples, such as urine, is a challenging task due to the chemical and structural diversity of the components. The chromatographic separation of the metabolites of a drug is usually performed using reversed-phase chromatography. Polar metabolites, such as glucuronides, sulfates, and glutathione conjugates, are typically analyzed in the negative-ion mode. Post-column Addition as a Tool to Enhance Performance in Microflow LC-MS 197
201 1 1: TOF MS ES- BPI 1.89e6 1 1: TOF MS ES Da 3.23e min min : TOF MS ES- BPI 1.89e : TOF MS ES Da 3.23e min min Figure 3. Chromatographic separation of human urine. µl/min (top) and 1 µl/min (bottom) IPA was used as a post-column modifier. The chromatograms are scaled to the highest relative intensity among the two chromatograms. Figure 4. Extracted ion chromatograms of the hydroxylated glucuronide metabolites of ibuprofen; top chromatogram in the absence of IPA; bottom chromatogram with IPA. In the negative ion mode ESI-MS, the analyte sensitivity is dependent upon the nature of the analyte, as well as the mobilephase properties, such as organic solvent and electrolyte contents. The analysis of human urine in negative ionization mode using post-column addition of isopropanol showed a significant increase in sensitivity. Pre-dose urine and ibuprofen-metabolitecontaining urine (3 h after the oral administration of 2 mg) samples were collected from a healthy male volunteer. The urine samples were directly injected after a 1:5 dilution in water. The separation was performed by applying a gradient from 5 to 65 ACN in 1 minutes at a flow rate of 3 µl/min. Under standard gradient conditions, in the absence of isopropanol, not all compounds were detected (top chromatogram in Figure 3). Post-column addition of isopropanol enabled the detection of the more hydrophilic compounds, including ibuprofen metabolites. Also, the addition of isopropanol reduced the required capillary voltage for producing a stable electrospray, and therefore, minimized the possibility of electric discharges that can generate undesired background noise. We examined the sample for evidence of ibuprofen metabolites by acquiring the data using the MSe acquisition mode (using combination of low (5 ev) and high (25 ev) collision energies to generate both molecular ion and fragment ion data). The extracted ion chromatograms of m/z , corresponding to the hydroxylated glucuronide metabolites of ibuprofen, are shown in Figure 4. For the most intense peak eluting with a retention time of 3.7 min, the signal increased by over 5 when IPA was used (bottom chromatogram). The advantage of this approach was further applied towards the detection of other urine metabolites. Hippuric acid (m/z=178.54), an endogenous polar biomarker produced an intense signal in the presence of isopropanol, but was completely undetected under standard conditions (Figure 3). 2. ENHANCED SENSITIVITY OF PROTEOMIC EXPERIMENTS BY USING DMSO AS A MOBILE PHASE ADDITIVE Increasing the electrospray responses of peptides by adding a low percentage of dimethylsulfoxide (DMSO) to the LC solvent has been investigated in several studies. 9,1 DMSO is a polar aprotic solvent with an elution strength similar to acetonitrile. Therefore, addition of DMSO to the LC solvents requires adaptation of the elution gradient to avoid the loss of hydrophilic peptides. The post-column addition ikey, with its dual-channel configuration, enables the introduction of DMSO through a side channel without influencing chromatographic performance. 198 Post-column Addition as a Tool to Enhance Performance in Microflow LC-MS
202 : TOF MS ES+ BPI 1.37e min Figure 5. Improved LC-MS/MS performance using DMSO of a four protein digest. Base peak intensity chromatograms of a four protein digest (MassPREP protein digestion standard mixture 1) in the presence (blue) and absence (black) of 5 DMSO. In order to maximize the sensitivity enhancement, it is necessary to optimize the amount of DMSO added to the solvent. The extra channel of the PCA ikey enables the introduction of reagents post LC separation, which simplifies and speeds up the method development process. Alternately, DMSO can be added to the LC solvents directly. However, the addition of DMSO in the mobile phases without gradient adjustment impacts the chromatography as illustrated in Figure 6. The peak shape of the hydrophilic peptides is significantly deteriorated. The change in retention times depends on the amount of DMSO added in the mobile phases, whereas with the post-column addition the retention times are the same regardless of the DMSO concentration. As previously observed, 9 the addition of DMSO may result in lowering the charge states of certain peptides, and therefore, proper identification and updating the MRM transitions while performing targeted analysis is critical for the post column DMSO addition. In the example presented in Figure 7., the dominant species of the peptide TIAQYAR is the doubly charged ion m/z However, with the post-column addition of DMSO, the singly charge ion m/z became the most abundant species. Post-column Addition as a Tool to Enhance Performance in Microflow LC-MS 199
203 : TOF MS ES Da 3.93e min : TOF MS ES Da 2.7e min Figure 6. DMSO effect on chromatography Post-column addition of DMSO (blue) vs. in-solution addition of DMSO (green) [M+H] : TOF MS ES Da 7.83e [M+2H] m/z min [M+2H] : TOF MS ES Da 1.6e [M+H] m/z min Figure 7. Extracted Ion Chromatograms and Mass Spectra of TIAQYAR peptide in the presence (blue) and absence (green) of 5 DMSO. 2 Post-column Addition as a Tool to Enhance Performance in Microflow LC-MS
204 CONCLUSIONS By applying post-column addition, optimization of the ESI MS condition can be achieved without compromising the optimal LC conditions, thus maximizing system performance. There are numerous ways that post-column additions can be employed to improve electrospray sensitivity, as listed below: 1. Post-column addition of solvents, such as isopropanol, facilitates the electrospray process by reducing the surface tension. 2. Post-column addition of DMSO can be used to enhance sensitivity in shotgun proteomics. 3. The mobile phase ph can be adjusted to improve ESI sensitivity. The addition of acetic acid or formic acid can lower the ph to improve positive-ion detection (e.g. LC-MS detection of amines can be improved by post-column acidification of the mobile phase). Similarly, the negative mode ESI sensitivity can be improved by increasing the ph through adding ammonium hydroxide post-column (e.g. bile acids analysis). References 1. Smith, D.P.H. IEEE Trans, Ind. Appl. 1986, 1A 22, Wilm, M.S.; Mann, M. Int. J. Mass Spectrom. Ion Processes 1994, 136, Strutt, J.W.; Baron Rayleigh, In: Phil. Mag. 5, Nr. 14, 1882, s Butler, J.A.V.; Wightman, A. J. Chem. Soc, 21, 1932, Defay, R.; Prigogine, I.; Bellemans, A.; Everett, D.H. Surface tension and adsorption (John Wiley and Sons, Inc.), New York, 1966, Eberhart, J.G. J. Phys. Chem., 1966, 7, Ghahremani, H.; Moradi, A.; Abedini-Torghabeh, J.; Hassani, S.M. Der Chemica Sinica, 211, 2 (6), Enke, C.G.; Cech, N.B. Mass Spectrometry Reviews, 21, 2, Meyer, J.G.; Komives, E.A. J. Am. Soc. Mass Spectrom. 23 (212) Hahne H.et al, Nat Methods 1 (213) Kuhlmann, F.E.; Apffel, A.; Fischer, S.M.; Goldberg, G.; Goodley, P.C. J. Am. Soc. Mass Spectrom. 6 (1995) Derivatization of a sample to improve electrospray sensitivity can be performed post column. 5. Post-column addition can be used to displace an additive (e.g. TFA, HFBA) forming stronger ion pairs with the analytes with an additive forming weaker ion pairs (propionic acid). This methodology is known as the TFA Fix. 11 Waters, The Science of What s Possible, ACQUITY UPLC, and Xevo are registered trademarks of Waters Corporation. IonKey, IonKey/MS, ikey, and MassPREP are trademarks of Waters Corporation. All other trademarks are the property of their respective owners. 216 Waters Corporation. Produced in the U.S.A. January EN KP-PDF Waters Corporation 34 Maple Street Milford, MA 1757 U.S.A. T: F: Post-column Addition as a Tool to Enhance Performance in Microflow LC-MS 21
205 JOURNAL OF APPLIED BIOANALYSIS, October 215, p (ISSN X) Vol. 1, No. 4 APPLICATION NOTE High throughput analysis at microscale: performance of ionkey/ms with Xevo G2-XS QTof under rapid gradient conditions Yun Wang Alelyunas, Gregory T. Roman, Jay Johnson, Catalin Doneanu, Mark D. Wrona Waters Corporation, Milford, MA, USA In this paper, high throughput analysis with 3 minute, rapid gradient conditions is described using the ionkey/ms System with an integrated ACQUITY UPLC M-Class System and the Xevo G2-XS QTof Mass Spectrometer. Extensive testing of representative small molecules and a peptide shows that the system is well-tolerated and exhibits excellent reproducibility and linear response. The ikey HSS T3 Separation Device used is robust, withstanding ~22 injections of prepared human plasma with excellent peak shape and system pressure profile. A 99 solvent savings was realized when compared with an analytical system using a 2.1 mm column with flow rate ranging from.6 ml/min to 1.5 ml/min. These data, coupled with examples from the literature, illustrate that the ionkey/ms System with Xevo G2-XS QTof can be used as a full service platform for high throughput analysis and high sensitivity analysis to support all phases of drug discovery and development. Introduction High throughput LC-MS analysis typically refers to conditions of using a rapid gradient from 1 to 2 minutes followed by column washing, and column (re)equilibration, for a total gradient/cycle time of 2-5 minutes. This high throughput operation is important in drug discovery and bioanalysis settings due to the vast number of compounds that have gone through various in vitro and in vivo tests, where compound concentrations need to be quantified by LC-MS techniques. For these laboratories, short cycle times can be equally important to instrument sensitivity. Although microscale LC-MS is advantageous for high sensitivity analysis and reduced solvent consumption, it has not historically been used for high throughput analysis. This is largely due to previous *Correspondence: 34 Maple Street Milford, MA USA. Phone & ; Fax waters.com 22 limitations of long cycle time and poor reproducibility. These barriers have been overcome with the integrated and user-friendly ionkey/ms System [1]. In addition, the choice of MS platforms for bioanalysis is evolving, with high resolution mass spectrometry (HRMS) technologies gaining momentum, particularly in the area of biotherapeutic quantitation requiring high sensitivity [2]. This changing landscape can be best demonstrated through integration of the microfluidic ikey Separation Device with the Xevo G2-XS HRMS Mass Spectrometer. The signature attributes of this system include high sensitivity, high speed, solvent savings, and ease of use. Sensitivity and throughput of the system can be optimized by adjusting the system flow rate. To date, most applications have been carried out at or near a flow rate of 3 µl/min, with approximately 5-1 minute cycle times. The operating pressure using a 15 μm x 5 mm ikey is generally ~3-34 psi (2-227 bar) which is well under the ikey tolerance of 1

206 ALELYUNAS YW psi. The ACQUITY UPLC M-Class Binary Pump can also deliver consistent flow rates up to 1 μl/min. The full capabilities for pressure and flow rate of the system have not yet been fully exploited. In this study, we investigated the performance of the system at higher flow rates and pressure conditions to perform high throughput analysis. System performance, including autosampler carryover, reproducibility, linear response, and ikey robustness were assessed using buspirone, a relatively polar small molecule drug, clopidogrel, a relatively non-polar compound, and oxytocin, a cyclic peptide hormone with a molecular weight of ~1 Dalton. Experimental Samples description Human plasma was treated via protein precipitation by the addition of acetonitrile (ACN) using a volume ratio of 3:1 (ACN:plasma). The solution was centrifuged at 13 relative centrifugal force (RCF), and the supernatant was transferred to a new vial. The supernatant was then diluted with water containing.1 formic acid to a percentage of ACN that was specific for each of the three compounds. Test compounds: buspirone, buspirone-d8, clopidogrel, clopidogrel-d4, oxytocin, and oxytocin (Ile- 13 C 6, 15 N) (Sigma Aldrich) were spiked into protein-precipitated human plasma. Final buspirone and clopidogrel samples contained 2 ACN, whereas the oxytocin samples contain 5 ACN. Other sample details are explained in the Results and Discussion section. LC-MS Conditions The analytical LC-MS experiments were performed using the ionkey/ms System with the ACQUITY UPLC M-Class System, and the Xevo G2-XS QTof Mass Spectrometer. The ACQUITY UPLC M-Class System was configured with direct injection using an ikey HSS T3 Separation Device, 1Ǻ, 1.8 μm, 15 μm x 5 mm (P/N: ). The ikey temperature was maintained at 65 C. Flow rate was 7 μl/min. Mobile phase A consisted of.1 formic acid in H 2 O. Mobile phase B was 9 ACN/1 MeOH containing.1 formic acid. The injection volume was 1 μl. Sample manager temperature was 1 C. Weak wash solvent was 1 ACN/9 H 2 O. Strong wash solvent was 25 ACN/25 IPA (isopropyl alcohol)/25 MeOH/25 H 2 O. Generic or compund-specific gradient conditions are described in the Results and Discussion section. The total run time was 3 minutes. Data was acquired using sensitivity mode with resolution >3 FWHM under positive electrospray ionization. Acquisition range was 5-12 m/z. Capillary voltage was J. APPL. BIOANAL 3.5 kv. Cone voltage was 6 V for the small molecules and 1 V for the peptide. The source temperature was 12 C, cone gas flow 5 L/hr, and nano gas flow was.1 L/hr. Scan times were either.1 s or.36 s and are detailed further in the Results and Discussion section. Tof MRM transitions for each of the compounds are as follows: buspirone, 386.3> , 394.3> (IS), CE=3; clopidogrel, 322.1> , 326.1> (IS), CE=16; and Oxytocin, 17.4> , 114.4> (IS), CE=6. MassLynx Software was used for data acquisition and TargetLynx Application Manager was used for data processing. Results and discussion Gradient condition and performance of the ikey Generic or compound-specific conditions were used for each compound and are summarized in Table 1. For the generic condition, a ballistic gradient with in- Figure 1. Chromatograms of test compounds in human plasma using generic gradient elution. Top: buspirone, middle: clopidogrel, and bottom: oxytocin High Throughput Analysis at Microscale: Performance of ionkey/ms with Xevo G2-XS QTof Under Rapid Gradient Conditions 23


207 ALELYUNAS YW J. APPL. BIOANAL Table 1. Summary of gradient conditions used Gradient time (min) Flow rate μl/min Generic gradient Buspirone Clopidogrel Oxytocin A B A B A B A B creasing B from 2 to 95 in 1.5 min was used. After holding at 95 B for.5 min, the B was changed back to initial and held for.5 min (Table 1). The total gradient time was 3 minutes. Sample injection time was used to achieve complete ikey equilibration. The total cycle time, including sample injection, was approximately 4 minutes. Chromatograms for each of the three compounds studied are shown in Figure 1. For the compound-specific gradient conditions, a brief method development was carried out where the percent mobile phase was adjusted for the first minute to enable the compound eluting at approximately 1.5 min. The subsequent ramping to 95 B, holding and return back to the initial condition were the same as the generic gradient. Using a 1 μl sample loop, the system s theoretical delay volume was calculated to be 3.65 μl. The increase of flow rate to 7 μl/min corresponds to a theoretical delay time of.52 min. The performance of BEH and HSS T3 ikeys were tested. Both ikeys are packed with C18 for reversed phase applications. The HSS T3 ikey is packed with high strength silica with tri-functional C18 alkyl phase bonding, which enables the column to withstand high pressure and promote polar compound retention and aqueous phase compatibility. The pressure traces shown in Figure 2 show that both ikeys yielded highly reproducible profiles. The pressure for the BEH ikey was found to cycle between 45 and 85 psi (3-567 bar), and the HSS T3 between 34 and 64 psi ( bar). The ikey packed with 1.8 µm HSS T3 particles exhibited a lower maximum system pressure profile vs. the 1.7 µm BEH particles and was used in subsequent studies reported in this application note. Figure 2. A screen capture of the ACQUITY UPLC M-Class Binary Solvent Manager showing system pressure change during sample analysis. On the left is the pressure history using the HSS T3 ikey in a two hour period, and on the right the system pressure using the BEH ikey for four sequential injections. In each graph, the top trace is the system pressure, and the middle and bottom traces are composition changes in channel A or B, respectively. 24 High Throughput Analysis at Microscale: Performance of ionkey/ms with Xevo G2-XS QTof Under Rapid Gradient Conditions

208 ALELYUNAS YW J. APPL. BIOANAL Figure 3. Chromatograms from the carryover study of the three compounds. The top chromatograms for each compound are from sample injection, followed immediately by blank injections reflected in the middle and lower chromatograms. Compound-specific gradient conditions were used. System carryover System carryover was measured by injecting a highly concentrated solution of each compound followed by blank solutions consisting of 5 ACN/5 H 2 O. The high concentration used was 1 ng/ml for buspirone and clopidogrel, and 1 ng/ml for oxytocin. These concentrations are near the saturation level of the Xevo G2-XS QTof for these compounds. Figure 3 shows chromatograms of the sample and the two blanks injected immediately afterwards. Percentage carryover was calculated based on the peak area at the retention time of the sample. The carryover calculated for the blank injection immediately after the sample is.7 for buspirone,.3 for clopidogrel, and.2 for oxytocin. These results suggest that there is minimal or no sample carryover using the ionkey/ms with Xevo G2-XS under these conditions. Reproducibility The reproducibility was tested by injecting the same sample and internal standard solution 1 times using either generic or compound-specific gradient conditions. Figure 4 shows a representative plot of peak area versus injection numbers. Percent RSD was calculated as 4.8 for buspirone, 1.7 for clopidogrel, and 4.6 for oxytocin. The data suggest good reproducibility for the ionkey/ms System under high throughput analysis conditions. Figure 4. Plot of peak area/is ratio versus injection number for 1 injections of corresponding compound in human plasma. High Throughput Analysis at Microscale: Performance of ionkey/ms with Xevo G2-XS QTof Under Rapid Gradient Conditions 25
209 ALELYUNAS YW J. APPL. BIOANAL Linear response The linear response was determined for serial diluted solutions in human plasma ranging from 1 pg/ml to 1 ng/ml for buspirone and clopidogrel, and from 1 pg/ ml to 1 ng/ml for oxytocin. Each compound solution was injected in triplicate and analyzed using both generic and compound-specific conditions. The Tof MRM scan rate was.1 second for the compound-specific gradient, and.36 seconds for the generic gradient. The faster scan time at the generic gradient condition ensured that a minimum of 1 data points across the peak were collected for both the compound and internal standard when they eluted early with narrower peak width in the gradient time window. Figure 5 shows the linear response curve using compound-specific conditions. Figure 6 shows the linear response curve using generic gradient conditions. Results show excellent linear response under all conditions and scan rates, with R 2 >.995 for all three compounds tested. For buspirone and clopidogrel, the linear range extended from 1 pg/ml to 1 ng/ml, and for oxytocin, the range was 1 pg/ml to 1 ng/ml using both generic and compound-specific gradients. The data show that the ionkey/ms System with Xevo G2-XS QTof can be used to perform quantitative analysis under high throughput conditions. Figure 5. Plot of peak area versus concentration for a serially diluted solution of test compounds in human plasma. Each concentration was injected in triplicate and plotted. A compound-specific gradient and scan rate of.1 s were used. Figure 6. Plot of peak area versus concentration for serially diluted solutions of test compounds in human plasma. Each concentration was injected in triplicate and plotted. Generic gradient conditions and a scan rate of.36 s were used for all compounds. 26 High Throughput Analysis at Microscale: Performance of ionkey/ms with Xevo G2-XS QTof Under Rapid Gradient Conditions
 Initial gradient time (min) 7 1. 1.5 2. 2.5 3. 4.2 6 1.17 1.75 2.33 2.92 3.5 4.9 5 1.4 2.1 2.8 3.5 4.2 5.88 4 1.75 2.63 3.5 4.38 5.25 7.35 3 2.33 3.5 4.67 5.83 7. 9.8 2 3.5 5.25 7. 8.")
210 ALELYUNAS YW J. APPL. BIOANAL Table 2. Gradient time tables for scaling flow rate from 7 μl/ min to a lower flow rate; mobile phase composition remains the same at each time point. Flow rate (ul/min) Initial gradient time (min) Effect of flow rate on MS response Available literature suggests that MS response is a function of flow rate in micro flow systems. In general, MS response increases with decreasing flow rate as the result of reduced droplet size and increases in ionization efficiency and MS sampling [3]. This effect is also measured in the present study by collecting data at flow rates from 7 μl/min to 2 μl/min. Table 2 is a summary of the gradient times for each of the flow rates used. The time for each segment of the gradient was scaled based on column volume. Figure 7 is a plot of MS response versus flow rate. Results show that with flow rate decreasing from 7 μl/min to 2 μl/min, there is an exponential increase in MS response for all three compounds used in the present study, which is consistent with the reported literature [3]. This provides a facile path to transition from high throughput analysis to extreme high sensitivity analysis by simply modulating flow rate. Incorporating trap-and-elute ionkey configurations has also been employed to further enhance the overall system sensitivity and has been described elsewhere [4]. ikey robustness The data presented here were collected using a single HSS T3 ikey, and by the end of the study ~22 injections of human plasma had been injected, most of which were collected at the 7 μl/min flow rate. The ikey remained viable beyond these ~22 injections. Figure 8 is a screen capture of the ikey history as monitored and stored by MassLynx Software. The history shows that with the first injections of the ikey, the maximum pressure is approximately psi and is consistent to the end of the study. The peak shape also remains excellent. Figure 7. Plot of MS peak area versus flow rate showing response increase with decreasing flow rate from 7 μl/min to 2 μl/min. Figure 8. Screen capture of the HSS T3 ikey history, showing the number of injections (2197) and maximum operating pressure. High Throughput Analysis at Microscale: Performance of ionkey/ms with Xevo G2-XS QTof Under Rapid Gradient Conditions 27

211 ALELYUNAS YW J. APPL. BIOANAL Figure 9. Comparison of relative solvent consumption of ionkey running at 7 μl/min flow rate vs. analytical scale chromatography running at 1 ml/min flow rate is displayed. The figure shows that consuming 1 L solvent on the ionkey/ms System running continuously at 7 μl/min for 99 days or 35,7 injections at 4 min run time, is equivalent to thirty six 1-gallon bottles using an analytical scale system. Solvent usage Solvent consumption and cost continues to be a concern in DMPK discovery labs. Due to the large amount of solvent used, many labs have also invested in expensive systems that can dispense solvent from larger solvent containers which need to follow strict safety guidelines. The 7 μl/min flow rate used in the present study represents a 98.8 to 99.5 solvent savings, assuming analytical scale chromatography with a flow rate ranging from.6 ml/ min to 1.5 ml/min. To put this into perspective, Figure 9 shows that consuming 1 L of solvent on the ionkey/ MS System at a flow rate of 7 μl/min is equivalent to consuming thirty-six 1-gallon bottles at a flow rate of 1 ml/min. Lower solvent requirements also translates to reduced time and labor required for preparation. The reduced solvent usage and consequential reduced waste disposal is increasingly important in making companies and laboratories more green and environmental friendly. Conclusion The ionkey/ms System with Xevo G2-XS QTof HRMS is a high performance platform that can be used for highly sensitive detection of small molecules and peptides (and other biomolecules). The present application shows that the ionkey/ms can also be operated under high throughput conditions with a 3 minute full gradient and a 7 μl/min flow rate. Using representative small molecules and a peptide, extensive testing of the platform shows that it is well-suited for routine analysis with high reproducibility, excellent linear response and minimal sample carryover. The HSS T3 ikey is also shown to be robust under high throughput conditions, after ~22 injections of human plasma, with minimal impact on the system s maximum pressure or peak shape. In summary, the present data, coupled with the growing body of literature on the utility and robustness of next generation microfluidics, suggests the ionkey/ms with Xevo G2-XS QTof can be used as a full service platform for high throughput and high sensitivity analysis to support all phases of drug discovery and development. Acknowledgement We d like to acknowledge the following from Waters Corp for the review of the manuscript: Kelly Doering, Pete Claise, Nigel Ewing, Larry Hines, and Sylvia Vollering. References 1. Rainville PD, Langridge JI, Wrona MD, Wilson ID, Plumb RS. Integration of microfluidic LC with HRMS for the analysis of analytes in biofluids: past, present and future. Bioanalysis. 7(11), (215). 2. Ramanathan R, Jemal M, Ramagiri, Xia SY, WG Humpreys WG, T Olah, WA Korfmacher. It is time for a paradigm shift in drug discovery bioanalysis: From SRM to HRMS. J Mass spectrom. 46(6), (211). 3. Murphy JP, Johnson J, Rainville PD. Enhancing Mass Spectrometry Sensitivity by Reducing Chromatographic Flow Rates with ionkey/ms, Waters 28 High Throughput Analysis at Microscale: Performance of ionkey/ms with Xevo G2-XS QTof Under Rapid Gradient Conditions
.")
212 ALELYUNAS YW J. APPL. BIOANAL White Paper (214). (P/N EN). 4. Alelyunas YW, Wrona MD, Murphy J, Doneanu A, Roman G, Rainville P. Exploring Extra Sensitivity Using ionkey/ms with the Xevo G2-XS Q-Tof HRMS for Small Molecule Pharmaceutical Analysis in Human Plasma. Waters Application Note (215). (P/N EN) Waters, The Science of What s Possible, Xevo, ACQUITY UPLC, and MassLynx are registered trademarks of Waters Corporation. ikey, ionkey/ms, and TargetLynx are trademarks of Waters Corporation. All other trademarks are the property of their respective owners. Appendix Recommendations for start up and end of run conditions are described below. These practices will help prolong the lifetime of the ikey under high throughput conditions. A. Start up from idle. It is recommended to slowly bring the ikey from idle, which could be mostly an organic mobile phase at no or slow flow rate, to the initial gradient condition of mostly aqueous mobile phase and high flow rate. A gradient method is shown in the table below, where the solvent composition was changed from idle condition, followed B. Idle conditions for ikey post analysis It is recommended to add the following gradient conditions at the end of an LC method. This gradient will ensure the ikey is maintained at low flow and high organic composition when in idle. The high organic mobile phase will help with washing out late eluting components that were not completely eluted during sample analysis. With this portion added to a LC method, after 3 min, if there is no new injection which will reset the time, the flow rate will decrease to 1 μl/min and the mobile phase changes to 95B, and will be maintained at this condition throughout idle. Submit your next manuscript to Journal of Applied Bioanalysis - No figure charges and space constraints - Thorough double-blind peer review - Easy online manuescript submission - No submission fee/page charges - Indexed in Directory of Open Access Journals High Throughput Analysis at Microscale: Performance of ionkey/ms with Xevo G2-XS QTof Under Rapid Gradient Conditions 29
Jonathan P. Danaceau, Erin E. Chambers, and Kenneth J. Fountain Waters Corporation, Milford, MA USA APPLICATION BENEFITS INTRODUCTION WATERS SOLUTIONS
 Rapid and Simultaneous Analysis of Urinary Catecholamines and Metanephrines Using Mixed-Mode SPE and Hydrophilic Interaction Chromatography (HILIC) for Clinical Research Jonathan P. Danaceau, Erin E. Chambers,
A Rapid Approach to the Confirmation of Drug Metabolites in Preclinical and Clinical Bioanalysis Studies
 A Rapid Approach to the Confirmation of Drug Metabolites in Preclinical and Clinical Bioanalysis Studies APPLICATION BENEFITS Regulatory guidelines and recommendations place a greater emphasis on the detection
Yun W. Alelyunas, Mark D. Wrona, Russell J. Mortishire-Smith, Nick Tomczyk, and Paul D. Rainville Waters Corporation, Milford, MA, USA INTRODUCTION
 Quantitation by High Resolution Mass Spectrometry: Using Target Enhancement and Tof-MRM to Achieve Femtogram-level On-column Sensitivity for Quantitation of Drugs in Human Plasma Yun W. Alelyunas, Mark
Improved Extraction of THC and its Metabolites from Oral Fluid Using Oasis PRiME HLB Solid Phase Extraction (SPE) and a UPLC CORTECS C 18
 and a UPLC CORTECS C 18") Using Oasis PRiME HLB Solid Phase Extraction (SPE) and a UPLC CORTECS C 18 Column Xin Zhang, Jonathan P. Danaceau, and Erin E. Chambers Waters Corporation, Milford, MA, USA APPLICATION BENEFITS Semi-validated
Using Oasis PRiME HLB Solid Phase Extraction (SPE) and a UPLC CORTECS C 18 Column Xin Zhang, Jonathan P. Danaceau, and Erin E. Chambers Waters Corporation, Milford, MA, USA APPLICATION BENEFITS Semi-validated
Analysis of Serum 17-Hydroxyprogesterone, Androstenedione, and Cortisol by UPLC-MS/MS for Clinical Research
 Analysis of Serum 17-Hydroxyprogesterone, Androstenedione, and Cortisol by UPLC-MS/MS for Clinical Research Heather A Brown, 1 Claudia Rossi, 2 and Lisa J Calton 1 1 Waters Corporation, Wilmslow, UK 2
Rapid, Reliable Metabolite Ratio Evaluation for MIST Assessments in Drug Discovery and Preclinical Studies
 Rapid, Reliable Metabolite Ratio Evaluation for MIST Assessments in Drug Discovery and Preclinical Studies Jonathan Danaceau, Erin Chambers, and Kenneth J. Fountain Waters Corporation, Milford, MA, USA
Quantitation of High Resolution MS Data Using UNIFI: Acquiring and Processing Full Scan or Tof-MRM (Targeted HRMS) Datasets for Quantitative Assays
 Datasets for Quantitative Assays") : Acquiring and Processing Full Scan or Tof-MRM (Targeted HRMS) Datasets for Quantitative Assays Mark Wrona, Jayne Kirk, and Yun Alelyunas Waters Corporation, Milford, MA, USA APPLICATION BENEFITS Ability
: Acquiring and Processing Full Scan or Tof-MRM (Targeted HRMS) Datasets for Quantitative Assays Mark Wrona, Jayne Kirk, and Yun Alelyunas Waters Corporation, Milford, MA, USA APPLICATION BENEFITS Ability
The Use of the ACQUITY QDa Detector for a Selective, Sensitive, and Robust Quantitative Method for a Potential Genotoxic Impurity
 The Use of the ACQUITY QDa Detector for a Selective, Sensitive, and Robust Quantitative Method for a Potential Genotoxic Impurity Janet Hammond Waters Corporation, Wilmslow, UK APPLICATION BENEFITS High
Routine MS Detection for USP Chromatographic Methods
 Daniel S. Root, Thomas E. Wheat, and Patricia McConville Waters Corporation, Milford, MA, USA APPLICATION BENEFITS This approach enables mass spectral analysis of peaks directly from unmodified USP HPLC
A Workflow Approach for the Identification and Structural Elucidation of Impurities of Quetiapine Hemifumarate Drug Substance
 A Workflow Approach for the Identification and Structural Elucidation of Impurities of Quetiapine Hemifumarate Drug Substance Michael D. Jones, Marian Twohig, Karen Haas, and Robert S. Plumb Waters Corporation,
Strategies for the Analysis of Therapeutic Peptides in Biofluids by LC-MS/MS. Lee Goodwin
 Strategies for the Analysis of Therapeutic Peptides in Biofluids by LC-MS/MS Lee Goodwin Sample Preparation Chromatography Detection General Strategies Examples New Approaches Summary Outline ABUNDANCE
A High Sensitivity Dual Solid Phase Extraction LC-MS/MS Assay for the Determination of the Therapeutic Peptide Desmopressin in Human Plasma
 White Paper A High Sensitivity Dual Solid Phase Extraction LC-MS/MS Assay for the Determination of the Therapeutic Peptide Desmopressin in Human Plasma Lars Neudert, MSc, Senior Scientist Method Development
Identification and Characterization of an Isolated Impurity Fraction: Analysis of an Unknown Degradant Found in Quetiapine Fumarate
 Identification and Characterization of an Isolated Impurity Fraction: Analysis of an Unknown Degradant Found in Quetiapine Fumarate Michael D. Jones, Xiang Jin Song, Robert S. Plumb, Peter J. Lee, and
Extraction of Methylmalonic Acid from Serum Using ISOLUTE. SAX Prior to LC-MS/MS Analysis
 Application Note AN89.V.1 Extraction of Methylmalonic Acid from Serum Using ISOLUTE SAX Page 1 Extraction of Methylmalonic Acid from Serum Using ISOLUTE SAX Prior to LC-MS/MS Analysis Sample Preparation
LC-MS/MS Method for the Determination of Diclofenac in Human Plasma
 LC-MS/MS Method for the Determination of Diclofenac in Human Plasma J. Jones, Thermo Fisher Scientific, Runcorn, Cheshire, UK Application Note 20569 Key Words SPE, SOLA, Accucore RP-MS, diclofenac, Core
UPLC Intact MASS Analysis Application Kit
 (Part Number: 176001519) CONTENTS I. INTACT MASS ANALYSIS APPLICATION KIT COMPONENTS II. INSTALLING THE PRE-COLUMN TUBING INTO MASSPREP MICRO DESALTING COLUMN III. CONNECTING THE COLUMN TO LCT PREMIER
Performing Peptide Bioanalysis Using High Resolution Mass Spectrometry with Target Enhancement MRM Acquisition
 Performing Peptide Bioanalysis Using High Resolution Mass Spectrometry with Target Enhancement MRM Acquisition Yun Wang Alelyunas, Mark D. Wrona, and Nick Tomczyk Waters Corporation, Milford, MA, USA GOAL
Fast and Reliable Method for the Analysis of Methylmalonic Acid from Human Plasma
 Fast and Reliable Method for the Analysis of Methylmalonic Acid from Human Plasma Jon Bardsley 1, James Goldberg 2 1 Thermo Fisher Scientific, Runcorn, UK; 2 Thermo Fisher Scientific, West Palm Beach,
Traditional Herbal Medicine Structural Elucidation using SYNAPT HDMS
 Traditional Herbal Medicine Structural Elucidation using SYNAPT HDMS with Time-Aligned Parallel (TAP) Fragmentation Kate Yu, Jose Castro-Perez, and John Shockcor Waters Corporation, Milford, MA, U.S. INTRODUCTION
A Quality by Design (QbD) Based Method Development for the Determination of Impurities in a Peroxide Degraded Sample of Ziprasidone
 Based Method Development for the Determination of Impurities in a Peroxide Degraded Sample of Ziprasidone") A Quality by Design (QbD) Based Method Development for the Determination of Impurities in a Peroxide Degraded Sample of Ziprasidone Mia Summers and Kenneth J. Fountain Waters Corporation, 34 Maple St.,
A Quality by Design (QbD) Based Method Development for the Determination of Impurities in a Peroxide Degraded Sample of Ziprasidone Mia Summers and Kenneth J. Fountain Waters Corporation, 34 Maple St.,
[ APPLICATION NOTEBOOK ] MASS SPECTROMETRY APPLICATION SOLUTIONS FOR ENDOCRINOLOGY RESEARCH
![[ APPLICATION NOTEBOOK ] MASS SPECTROMETRY APPLICATION SOLUTIONS FOR ENDOCRINOLOGY RESEARCH](/thumbs/75/71845673.jpg "[ APPLICATION NOTEBOOK ] MASS SPECTROMETRY APPLICATION SOLUTIONS FOR ENDOCRINOLOGY RESEARCH") [ APPLICATION NOTEBOOK ] 216 MASS SPECTROMETRY APPLICATION SOLUTIONS FOR ENDOCRINOLOGY RESEARCH [ TABLE OF CONTENTS ] MASS SPECTROMETRY APPLICATION SOLUTIONS FOR ENDOCRINOLOGY RESEARCH* INTRODUCTION...
[ APPLICATION NOTEBOOK ] 216 MASS SPECTROMETRY APPLICATION SOLUTIONS FOR ENDOCRINOLOGY RESEARCH [ TABLE OF CONTENTS ] MASS SPECTROMETRY APPLICATION SOLUTIONS FOR ENDOCRINOLOGY RESEARCH* INTRODUCTION...
APPLICATION BENEFITS INTRODUCTION WATERS SOLUTIONS KEY WORDS. Simultaneous high-throughput screening of melamine (MEL) and cyanuric acid (CYA).
 and cyanuric acid (CYA).") A Rapid and Sensitive Method for the Simultaneous Determination of and Cyanuric Acid in Infant Formulas, Adult utritional Products, and Protein Powders APPLICATIO BEEFITS Simultaneous high-throughput screening
A Rapid and Sensitive Method for the Simultaneous Determination of and Cyanuric Acid in Infant Formulas, Adult utritional Products, and Protein Powders APPLICATIO BEEFITS Simultaneous high-throughput screening
Simplified Approaches to Impurity Identification using Accurate Mass UPLC/MS
 Simplified Approaches to Impurity Identification using Accurate Mass UPLC/MS Marian Twohig, Michael D. Jones, Dominic Moore, Peter Lee, and Robert Plumb Waters Corporation, Milford, MA, USA APPLICATION
Electron Transfer Dissociation of N-linked Glycopeptides from a Recombinant mab Using SYNAPT G2-S HDMS
 Electron Transfer Dissociation of N-linked Glycopeptides from a Recombinant mab Using SYNAPT G2-S HDMS Jonathan P. Williams, Jeffery M. Brown, Stephane Houel, Ying Qing Yu, and Weibin Chen Waters Corporation,
Maximizing Triple Quadrupole Mass Spectrometry Productivity with the Agilent StreamSelect LC/MS System
 Maximizing Triple Quadrupole Mass Spectrometry Productivity with the Agilent StreamSelect LC/MS System Application Note Authors Kevin McCann, Sameer Nene, Doug McIntyre, Edmond Neo, Dennis Nagtalon, and
Sensitive and Repeatable Analysis of Pesticides in QuEChERS Extracts with APGC-MS/MS
 Sensitive and Repeatable Analysis of Pesticides in QuEChERS Extracts with APGC-MS/MS Dominic Roberts, 1 Sara Stead, 1 and Jennifer A. Burgess 2 1 Waters Corporation, Manchester, UK 2 Waters Corporation,
Peptide Isolation Using the Prep 150 LC System
 Jo-Ann M. Jablonski and Andrew J. Aubin Waters Corporation, Milford, MA, USA APPLICATION BENEFITS The Prep 150 LC System, an affordable, highly reliable system for preparative chromatography, is suitable
EVOLUTE WCX Columns for Solid Phase Extraction of Quaternary Amines and Strongly Basic Compounds from Aqueous Samples
 TN143 EVOLUTE WCX Columns for Solid Phase Extraction of Quaternary Amines and Strongly Basic Compounds from Aqueous Samples This Chemistry Data Sheet provides guidelines for the extraction of quaternary
HPLC Winter Webinars Part 2: Sample Preparation for HPLC
 HPLC Winter Webinars Part 2: Sample Preparation for HPLC Jon Bardsley, Application Chemist Thermo Fisher Scientific, Runcorn/UK The world leader in serving science What am I Going to Talk About? What do
POST-COLUMN ADDITION AS A TOOL TO ENHANCE PERFORMANCE IN MICROFLOW LC-MS
 POST-COLUMN ADDITION AS A TOOL TO ENHANCE PERFORMANCE IN MICROFLOW LC-MS Angela Doneanu, Michael Donegan and Jim Murphy The need for improving electrospray ionization (ESI-MS) sensitivity has been the
Rapid Screening and Confirmation of Melamine Residues in Milk and Its Products by Liquid Chromatography Tandem Mass Spectrometry
 Rapid Screening and Confirmation of Melamine Residues in Milk and Its Products by Liquid Chromatography Tandem Mass Spectrometry Application Note Food Authors Jianqiu Mi, Zhengxiang Zhang, Zhixu Zhang,
USP Method Transfer and Routine Use Analysis of Irbesartan Tablets from HPLC to UPLC
 USP Method Transfer and Routine Use Analysis of Tablets from HPLC to UPLC Aparna Chavali, Tanya Jenkins and Patricia McConville Waters Corporation, 34 Maple Street, Milford, MA USA APPLICATION BENEFITS
Ultrafast Analysis of Buprenorphine and Norbuprenorphine in Urine Using the Agilent RapidFire High-Throughput Mass Spectrometry System
 Ultrafast Analysis of Buprenorphine and Norbuprenorphine in Urine Using the Agilent RapidFire High-Throughput Mass Spectrometry System Application Note Authors Mohamed Youssef and Vaughn P. Miller Agilent
Guide to Peptide Quantitation. Agilent clinical research
 Guide to Peptide Quantitation Agilent clinical research Peptide Quantitation for the Clinical Research Laboratory Peptide quantitation is rapidly growing in clinical research as scientists are translating
LC Technical Information
 LC Technical Information Method Transfer to Accucore.6 μm Columns Containing solid core particles, which are engineered to a diameter of.6μm and a very narrow particle size distribution; Accucore HPLC
PosterREPRINT COMPARISON OF PEAK PARKING VERSUS AUTOMATED FRACTION ANALYSIS OF A COMPLEX PROTEIN MIXTURE. Introduction
 Introduction The study of protein expression allows a greater understanding of biological function and can now routinely be performed using mass spectrometry. However, analysis of the post-translational
Definitive EtG/EtS LC-MS/MS Analysis:
 Definitive / LC- Analysis: A Rugged 4-Min Method for High-Throughput Labs By Justin Steimling and Frances Carroll Abstract Methods for monitoring alcohol consumption biomarkers and are generally limited
Analytical determination of testosterone in human serum using an Agilent Ultivo Triple Quadrupole LC/MS
 Application Note Clinical Research Analytical determination of testosterone in human serum using an Agilent Ultivo Triple Quadrupole LC/MS Authors Yanan Yang 1, Victor Mandragon 2, and Peter Stone 1 1
Quantitative Analysis of EtG and EtS in Urine Using FASt ETG and LC-MS/MS
 Quantitative Analysis of EtG and EtS in Urine Using FASt ETG and LC-MS/MS UCT Part Numbers: CSFASETG203 - CLEAN SCREEN FASt ETG, 200mg / 3mL tube SLETG100ID21-3UM - Selectra ETG HPLC column, 100 x 2.1
Basic Principles for Purification Using Supercritical Fluid Chromatography
 Basic Principles for Purification Using Supercritical Fluid Chromatography Jo-Ann M. Jablonski, Christopher J. Hudalla, Kenneth J. Fountain, Steven M. Collier, and Damian Morrison Waters Corporation, Milford,
Successfully Scaling and Transferring HPLC and UPLC Methods
 Successfully Scaling and Transferring HPLC and UPLC Methods Esa Lehtorinne Esa_Lehtorinne@waters.com Tel: +358-9-5659 6288 Fax: +358-9-5659 6282 Waters Finland Kutomotie 16 00380 Helsinki 2013 Waters Corporation
Mixed-Mode, Weak Anion-Exchange, Solid-Phase Extraction Method for the Extraction of Niflumic Acid from Human Plasma
 Mixed-Mode, Weak Anion-Exchange, Solid-Phase Extraction Method for the Extraction of Niflumic Acid from Human Plasma Ken Meadows, Thermo Fisher Scientific, Runcorn, UK Application Note 20789 Key Words
LC and LC/MS Column Selection Flow Chart
 LC and LC/MS Column Selection Flow Chart To use the column selection diagram below, simply follow the path for your analyte and mobile phase. At the far right, follow your final column selection to the
Translational Biomarker Core
 Translational Biomarker Core Instrumentation Thermo Scientific TSQ Quantum Triple Quadrupole Mass Spectrometers. There are two TSQ Quantum Ultra AM instruments available in the TBC. The TSQ Quantum Ultra
Online Reaction Monitoring of In-Process Manufacturing Samples by UPLC
 Online Reaction Monitoring of In- Manufacturing Samples by UPLC Tanya Tollifson Waters Corporation, Milford, MA, USA APPLICATION BENEFITS Better throughput, yield, and process understanding are possible
LC/MS/MS qua ntitation of β-estradiol 17-acetate using an Agilent 6460 Triple Quadrupole LC/MS working in ESI negative ion mode
 LC/MS/MS qua ntitation of β-estradiol 17-acetate using an Agilent 6460 Triple Quadrupole LC/MS working in ESI negative ion mode Application Note Authors Siji Joseph Agilent Technologies India Pvt. Ltd.
Plasma Metanephrines and 3-Methoxytyramine by LC/MS/MS Using Agilent SimpliQ WCX SPE, 1290 Infi nity LC, and 6460 Triple Quadrupole LC/MS
 Plasma Metanephrines and 3-Methoxytyramine by LC/MS/MS Using Agilent SimpliQ WCX SPE, 129 Infi nity LC, and 646 Triple Quadrupole LC/MS Application Note Clinical Research Authors Linda Côté and Christophe
ikey Separation Device
 ikey Separation Device CONTENTS I. INTRODUCTION II. III. IV. ikey SEPARATION DEVICE FEATURES a. Analytical ikey and ikey HT b. PCA ikey c. Accessory ikeys d. ikey Component Description CONNECTING AND REMOVING
A Case of Pesticide Poisoning: The Use of a Broad-Scope Tof Screening Approach in Wildlife Protection
 A Case of Pesticide Poisoning: The Use of a Broad-Scope Tof Screening Approach in Wildlife Protection George Keenan 1, Anna Giela 1, Michael Taylor 1, Jennifer Watson 1, Eleanor Riches 2, James Morphet
Quantitative analysis of small molecules in biological samples. Jeevan Prasain, Ph.D. Department of Pharmacology & Toxicology, UAB.
 Quantitative analysis of small molecules in biological samples 100 Jeevan Prasain, Ph.D. Department of Pharmacology & Toxicology, UAB % 0 300 500 700 900 1100 1300 1500 1700 m/z Class Overview Introduction
ImprovIng ADmE ScrEEnIng productivity In Drug DIScovEry
 Improving ADME Screening Productivity in Drug Discovery INTRODUCTION Improving the quality of the decisions made at the drug discovery stage can profoundly impact the efficiency of the drug discovery and
Identification of Human Hemoglobin Protein Variants Using Electrospray Ionization-Electron Transfer Dissociation Mass Spectrometry
 Identification of Human Hemoglobin Protein Variants Using Electrospray Ionization-Electron Transfer Dissociation Mass Spectrometry Jonathan Williams Waters Corporation, Milford, MA, USA A P P L I C AT
Analysis of Illegal Dyes in Food Matrices using Automated Online Sample Preparation with LC/MS
 Application Note: 56 Analysis of Illegal Dyes in Food Matrices using Automated Online Sample Preparation with LC/MS Yang Shi, Catherine Lafontaine, Matthew Berube, John Fink, François Espourteille Thermo
Assay Transfer from HPLC to UPLC for Higher Analysis Throughput
 MAY 2005 SEPARATION SCIENCE REDEFINED 31 Assay Transfer from HPLC to UPLC for Higher Analysis Throughput A typical HPLC assay was transferred and optimized for a Waters ACQUITY UPLC system to achieve both
A S ENSIT IV E M E T HO D FO R T H E D E T E RM INAT IO N O F ENDO C RIN E- D IS RU P T ING COM P OUNDS IN RIV E R WAT E R BY L C / MS/MS
 [ application note ] A S ENSIT IV E M E T HO D FO R T H E D E T E RM INAT IO N O F ENDO C RIN E- D IS RU P T ING COM P OUNDS IN RIV E R WAT E R BY L C / MS/MS Patricia Revilla-Ruiz 1, Gordon Kearney 2,
Toxicity, Teratogenic and Estrogenic Effects of Bisphenol A and its Alternative. Replacements Bisphenol S, Bisphenol F and Bisphenol AF in Zebrafish.
 1 Supporting Information 2 3 Toxicity, Teratogenic and Estrogenic Effects of Bisphenol A and its Alternative Replacements Bisphenol S, Bisphenol F and Bisphenol AF in Zebrafish. 4 5 John Moreman, Okhyun
Streamlining the Analysis of Oral Contraceptives Using the ACQUITY UPLC H-Class System
 Streamlining the Analysis of Oral Contraceptives Using the ACQUITY UPLC H-Class System Margaret Maziarz, Sean M. McCarthy, Michael D. Jones, and Warren B. Potts Waters Corporation, Milford, MA, USA A P
AB SCIEX SelexION Technology Used to Improve Mass Spectral Library Searching Scores by Removal of Isobaric Interferences
 AB SCIEX SelexION Technology Used to Improve Mass Spectral Library Searching s by Removal of Isobaric Interferences Differential Mobility Used as a Tool to Address Selectivity Challenges Adrian M. Taylor
Determination of Hormones in Drinking Water by LC/MS/MS Using an Agilent InfinityLab Poroshell HPH Column (EPA 539)
") Determination of ormones in Drinking Water by LC/MS/MS Using an Agilent InfinityLab Poroshell P Column (EPA 539) Application Note Environmental Authors Rong-jie Fu and Chen-ao (Andy) Zhai Agilent Technologies
Determination of ormones in Drinking Water by LC/MS/MS Using an Agilent InfinityLab Poroshell P Column (EPA 539) Application Note Environmental Authors Rong-jie Fu and Chen-ao (Andy) Zhai Agilent Technologies
Extraction of Aflatoxins and Ochratoxin from Dried Chili Using ISOLUTE. Myco Prior to LC-MS/MS Analysis
 Application Note AN785 Extraction of Aflatoxins and chratoxin From Dried Chili Using ISLUTE Myco prior to LC-MS/MS Analysis Page Extraction of Aflatoxins and chratoxin from Dried Chili Using ISLUTE Myco
Product Bulletin. ACE LC/MS and Rapid Analysis HPLC Columns. HPLC Columns
 Product Bulletin HPLC Columns ACE LC/MS and Rapid Analysis HPLC Columns 0 mm, 30 mm, 35 mm and 50 mm column lengths.0,., 3.0, 4.0 and 4.6 mm column diameters Configured for High Sample Throughput Specially
Chemistry Instrumental Analysis Lecture 37. Chem 4631
 Chemistry 4631 Instrumental Analysis Lecture 37 Most analytes separated by HPLC are thermally stable and non-volatile (liquids) (unlike in GC) so not ionized easily by EI or CI techniques. MS must be at
OVERVIEW INTRODUCTION. Michael O Leary, Jennifer Gough, Tanya Tollifson Waters Corporation, Milford, MA USA
 Use of High Speed/High Resolution Size-Based Chromatographic Separation of Surfactants and Oligomeric Materials with Single Quadrupole Mass Spectrometry Michael O Leary, Jennifer Gough, Tanya Tollifson
High-Throughput Protein Quantitation Using Multiple Reaction Monitoring
 High-Throughput Protein Quantitation Using Multiple Reaction Monitoring Application Note Authors Ning Tang, Christine Miller, Joe Roark, Norton Kitagawa and Keith Waddell Agilent Technologies, Inc. Santa
Q-TOF PREMIER DYNAMIC RANGE ENHANCEMENT AND ACCURATE MASS MEASUREMENT PERFORMANCE
 Q-TOF PREMIER DYAMIC RAGE EHACEMET AD ACCURATE MASS MEASUREMET PERFORMACE Michael McCullagh, Jose Castro-Perez, and Lisa Calton Waters Corporation, Manchester, UK ITRODUCTIO The use of time-of-flight (TOF)
Agilent s New Weak Anion Exchange (WAX) Solid Phase Extraction Cartridges: SampliQ WAX
 Solid Phase Extraction Cartridges: SampliQ WAX") Agilent s New Weak Anion Exchange (WAX) Solid Phase Extraction Cartridges: SampliQ WAX Technical Note Agilent s SampliQ WAX provides Applications for strongly acidic, acidic and neutral compounds Excellent
Agilent s New Weak Anion Exchange (WAX) Solid Phase Extraction Cartridges: SampliQ WAX Technical Note Agilent s SampliQ WAX provides Applications for strongly acidic, acidic and neutral compounds Excellent
EPA Method 535: Detection of Degradates of Chloroacetanilides and other Acetamide Herbicides in Water by LC/MS/MS
 EPA Method 535: Detection of Degradates of Chloroacetanilides and other Acetamide Herbicides in Water by LC/MS/MS Christopher Borton AB SCIEX Golden, Colorado verview Described here is the analysis of
FORENSIC TOXICOLOGY SCREENING APPLICATION SOLUTION
 FORENSIC TOXICOLOGY SCREENING APPLICATION SOLUTION A purpose-built collection of the best-inclass components for forensic toxicology Whether you re challenged to present reliable and secure forensic sample
Quantitative Analysis of EtG and EtS in Urine Using FASt ETG and LC-MS/MS
 Quantitative Analysis of EtG and EtS in Urine Using FASt ETG and LC-MS/MS UCT Part Numbers: CSFASETG203 - CLEAN SCREEN FASt ETG, 200mg / 3mL tube SLETG100ID21-3UM - Selectra ETG HPLC column, 100 x 2.1
Lirui Qiao, 1 Rob Lewis, 2 Alex Hooper, 2 James Morphet, 2 Xiaojie Tan, 1 Kate Yu 3
 Using Natural Products Application Solution with UNIFI for the Comparison of the Chemical Ingredients of Shuanghuanglian Oral Drink from Two Different Manufacturers Lirui Qiao, 1 Rob Lewis, 2 Alex Hooper,
Implementation of Methods Translation between Liquid Chromatography Instrumentation
 Implementation of Methods Translation between Liquid Chromatography Instrumentation Michael D. Jones, Peter Alden, Kenneth J. Fountain, and Andrew Aubin Waters Corporation, Milford, MA, U.S. APPLICATION
[ Care and Use Manual ]
![[ Care and Use Manual ]](/thumbs/94/118749905.jpg "[ Care and Use Manual ]") Oasis HLB DISKS I. Introduction Oasis HLB is a Hydrophilic-Lipophilic-Balanced, water-wettable, reversed-phase sorbent for all your SPE needs. It is made from a specific ratio of two monomers, the hydrophilic
Oasis HLB DISKS I. Introduction Oasis HLB is a Hydrophilic-Lipophilic-Balanced, water-wettable, reversed-phase sorbent for all your SPE needs. It is made from a specific ratio of two monomers, the hydrophilic
TANDEM MASS SPECTROSCOPY
 TANDEM MASS SPECTROSCOPY 1 MASS SPECTROMETER TYPES OF MASS SPECTROMETER PRINCIPLE TANDEM MASS SPECTROMETER INSTRUMENTATION QUADRAPOLE MASS ANALYZER TRIPLE QUADRAPOLE MASS ANALYZER TIME OF FLIGHT MASS ANALYSER
Multi-residue analysis of pesticides by GC-HRMS
 An Executive Summary Multi-residue analysis of pesticides by GC-HRMS Dr. Hans Mol is senior scientist at RIKILT- Wageningen UR Introduction Regulatory authorities throughout the world set and enforce strict
Technical Procedure for Blood Cannabinoid Liquid-Liquid Extraction (BCLLE) for Analysis by LC-MS/MS
 for Analysis by LC-MS/MS") Technical Procedure for Blood Cannabinoid Liquid-Liquid Extraction (BCLLE) for Analysis by LC-MS/MS 1.0 Purpose - This procedure specifies the required elements for the extraction and quantitation of THC,
Technical Procedure for Blood Cannabinoid Liquid-Liquid Extraction (BCLLE) for Analysis by LC-MS/MS 1.0 Purpose - This procedure specifies the required elements for the extraction and quantitation of THC,
Extraction of Cocaine and Metabolites From Urine Using ISOLUTE SLE+ prior to LC-MS/MS Analysis
 Extraction of Cocaine and Metabolites From Urine Using ISOLUTE SLE+ prior to LC-MS/MS Analysis Application Note AN772 Introduction This application note describes the extraction of cocaine and a full range
High-Throughput LC-MS/MS Quantification of Estrone (E1) and Estradiol (E2) in Human Blood Plasma/Serum for Clinical Research Purposes
 and Estradiol (E2) in Human Blood Plasma/Serum for Clinical Research Purposes") High-Throughput LC-MS/MS Quantification of Estrone (E1) and Estradiol (E2) in Human Blood Plasma/Serum for Clinical Research Purposes Joe DiBussolo, Marta Kozak Thermo Fisher Scientific, San Jose, CA Application
High-Throughput LC-MS/MS Quantification of Estrone (E1) and Estradiol (E2) in Human Blood Plasma/Serum for Clinical Research Purposes Joe DiBussolo, Marta Kozak Thermo Fisher Scientific, San Jose, CA Application
PosterREPRINT AN INTERACTIVE PHYSICOCHEMICAL PROPERTY PROFILING SOFTWARE FOR EARLY CANDIDATE ANALYSIS IN DRUG DISCOVERY INTRODUCTION
 INTRODUCTION Full characterization of the physicochemical properties of new chemical entities (NCE s) typically takes place in pharmaceutical development laboratories. However, in an effort to minimize
LC-MS/MS in the Clinical Laboratory. Jo Adaway
 LC-MS/MS in the Clinical Laboratory Jo Adaway LC-MS/MS in the clinical laboratory LC-MS/MS is mainly used for quantification of analytes used in the diagnosis and monitoring of disease Semi-quantitative
C HA R AC T E RIZ AT IO N O F INK J E T P RINT E R C A RT RIDG E INK S USING A CHEMOMETRIC APPROACH
 C HA R AC T E RIZ AT I N F INK J E T P RINT E R C A RT RIDG E INK S USING A CHEMMETRIC APPRACH Diana Uría and Paul Silcock Waters Corporation, Manchester, UK AIM To evaluate the potential of UPLC -ToF-MS
Live Webinar : How to be more Successful with your ACQUITY QDa Detector?
 Live Webinar : How to be more Successful with your ACQUITY QDa Detector? Q&A Transcript ---------------- Q - How do you generate multiple charges reproductively? A - If you use the same settings on the
Effects of Aqueous Sample Content and Aqueous Co-Solvent Composition on UPC 2 Separation Performance
 Effects of Aqueous Sample Content and Aqueous Co-Solvent Composition on UPC 2 Separation Performance Christopher Knappy, 1 Norman W Smith, 1 Arundhuti Sen, 1 Paul D Rainville, 2 and Robert S Plumb 2 1
New Dynamic MRM Mode Improves Data Quality and Triple Quad Quantification in Complex Analyses
 New Dynamic MRM Mode Improves Data Quality and Triple Quad Quantification in Complex Analyses Technical Overview Authors Abstract Peter Stone, Thomas Glauner, Frank Kuhlmann, Tim Schlabach and Ken Miller
Rapid and Accurate Forensics Analysis using High Resolution All Ions MS/MS
 Rapid and Accurate Forensics Analysis using High Resolution All Ions MS/MS Application Note Forensic Toxicology Authors Martin Josefsson, and Markus Roman National Board of Forensic Medicine Linköping,
Conformational Characterization of Calmodulin by Hydrogen Deuterium Exchange Mass Spectrometry
 Conformational Characterization of Calmodulin by Hydrogen Deuterium Exchange Mass Spectrometry Joomi Ahn, Martha Stapels, Michael Eggertson, Keith Fadgen, and Ying Qing Yu Waters Corporation, Milford,
EPA Method 535: Detection of Degradates of Chloroacetanilides and other Acetamide Herbicides in Water by LC/MS/MS
 Application Note EPA Method 535 EPA Method 535: Detection of Degradates of Chloroacetanilides and other Acetamide Herbicides in Water by LC/MS/MS API 3200 LC/MS/MS System Overview Described here is the
[application note] INTRODUCTION EXPERIMENTAL. Specimens. Extraction
![[application note] INTRODUCTION EXPERIMENTAL. Specimens. Extraction](/thumbs/76/73797995.jpg "[application note] INTRODUCTION EXPERIMENTAL. Specimens. Extraction") Testing for GHB in hair by GC tandem quadrupole MS Marie Bresson, Vincent Cirimele, Pascal Kintz, Marion Villain; Laboratoire Chemtox, Illkirch, France Timothy Jenkins, Waters Corporation, Manchester,
Testing for GHB in hair by GC tandem quadrupole MS Marie Bresson, Vincent Cirimele, Pascal Kintz, Marion Villain; Laboratoire Chemtox, Illkirch, France Timothy Jenkins, Waters Corporation, Manchester,
DEMONSTRATING SUPERIOR LINEARITY: THE ACQUITY UPLC PHOTODIODE ARRAY DETECTOR
 DEMONSTRATING SUPERIOR LINEARITY: THE ACQUITY UPLC PHOTODIODE ARRAY DETECTOR Tanya Jenkins Waters Corporation, Milford, MA, USA INTRODUCTION ACQUITY UPLC PDA LINEARITY There are two characteristics that
Analysis of Synthetic Cannabinoids and Metabolites: Adding New Compounds to an Existing LC-MS/MS Method
 Analysis of Synthetic Cannabinoids and Metabolites: Adding New Compounds to an Existing LC-MS/MS Method By Sharon Lupo and Frances Carroll Abstract The analysis of synthetic cannabinoids and their metabolites
Quantitation of a target protein in crude samples using targeted peptide quantification by Mass Spectrometry
 Quantitation of a target protein in crude samples using targeted peptide quantification by Mass Spectrometry Jon Hao, Rong Ye, and Mason Tao Poochon Scientific, Frederick, Maryland 21701 Abstract Background:
Direct Analysis of Opioids and Metabolites from Whole Blood Using Ostro Sample Preparation Plates Combined with UPLC-MS/MS for Forensic Toxicology
 Usin Ostro Sample Preparation Plates Combined with UPLC-MS/MS for Forensic Toxicoloy Jonathan P. Danaceau, Erin E. Chambers, and Kenneth J. Fountain Waters Corporation, Milford, MA, USA APPLICATION BENEFITS
Analysis of Labeled and Non-Labeled Proteomic Data Using Progenesis QI for Proteomics
 Analysis of Labeled and Non-Labeled Proteomic Data Using Progenesis QI for Proteomics Lee Gethings, Gushinder Atwal, Martin Palmer, Chris Hughes, Hans Vissers, and James Langridge Waters Corporation, Wilmslow,
Draft Guideline on Bioanalytical Method Validation in. Pharmaceutical Development. (15 April 2013, MHLW, Japan)
") Draft Guideline on Bioanalytical Method Validation in Pharmaceutical Development (15 April 2013, MHLW, Japan) Table of Contents 1. Introduction 2. Scope 3. Reference Standard 4. Analytical Method Validation
Draft Guideline on Bioanalytical Method Validation in Pharmaceutical Development (15 April 2013, MHLW, Japan) Table of Contents 1. Introduction 2. Scope 3. Reference Standard 4. Analytical Method Validation
[application note] ACQUITY UPLC/SQD ANALYSIS OF POLYMER ADDITIVES. Peter J. Lee, and Alice J. Di Gioia, Waters Corporation, Milford, MA, U.S.A.
![[application note] ACQUITY UPLC/SQD ANALYSIS OF POLYMER ADDITIVES. Peter J. Lee, and Alice J. Di Gioia, Waters Corporation, Milford, MA, U.S.A.](/thumbs/75/72236763.jpg "[application note] ACQUITY UPLC/SQD ANALYSIS OF POLYMER ADDITIVES. Peter J. Lee, and Alice J. Di Gioia, Waters Corporation, Milford, MA, U.S.A.") ACQUITY UPLC/QD AALYI F PLYMER ADDITIVE Peter J. Lee, and Alice J. Di Gioia, Waters Corporation, Milford, MA, U..A. IT RDUCTI Typical polymer additives include light and heat stabilizers, UV absorbers,
ACQUITY UPLC/QD AALYI F PLYMER ADDITIVE Peter J. Lee, and Alice J. Di Gioia, Waters Corporation, Milford, MA, U..A. IT RDUCTI Typical polymer additives include light and heat stabilizers, UV absorbers,
Confirmation of In Vitro Nefazodone Metabolites using the Superior Fragmentation of the QTRAP 5500 LC/MS/MS System
 Confirmation of In Vitro Nefazodone Metabolites using the Superior Fragmentation of the QTRAP 5500 LC/MS/MS System Claire Bramwell-German, Elliott Jones and Daniel Lebre AB SCIEX, Foster City, California
Use of Ultra-High Performance LC-MS for Challenging Assays. David Browne, Laboratory Manager (LC-MS-MS), Covance Laboratories, Harrogate
, Covance Laboratories, Harrogate") Use of Ultra-High Performance LC-MS for Challenging Assays David Browne, Laboratory Manager (LC-MS-MS), Covance Laboratories, Harrogate Department of Bioanalytical Services Determination of drug substance
Use of Ultra-High Performance LC-MS for Challenging Assays David Browne, Laboratory Manager (LC-MS-MS), Covance Laboratories, Harrogate Department of Bioanalytical Services Determination of drug substance
High-sensitivity, high-throughput quantitation of catecholamine metabolites in urine by LC/MS/MS for clinical research
 PO-CON1655E High-sensitivity, high-throughput quantitation of catecholamine metabolites in urine by LC/MS/MS for clinical research ASMS 2016 MP-079 Atsuhiko TOYAMA 1, Kumie SATOU 2, Yuki NAKAMURA 2, Ichiro
SEAMLESS INTEGRATION OF MASS DETECTION INTO THE UV CHROMATOGRAPHIC WORKFLOW
 SEAMLESS INTEGRATION OF MASS DETECTION INTO THE UV CHROMATOGRAPHIC WORKFLOW Paula Hong, John Van Antwerp, and Patricia McConville Waters Corporation, Milford, MA, USA Historically UV detection has been
Macrolides in Honey Using Agilent Bond Elut Plexa SPE, Poroshell 120, and LC/MS/MS
 Macrolides in Honey Using Agilent Bond Elut Plexa SPE, Poroshell 120, and LC/MS/MS Application Note Food Testing and Agriculture Author Chen-Hao (Andy) Zhai and Rong-jie Fu Agilent Technologies (Shanghai)
ProPac WCX-10 Columns
 ProPac WCX-10 Columns Guidance for column use Tips to maximize column lifetime ProPac WCX-10 Column Tips and Tricks This guide provides essential information and invaluable guidelines for mobile phases,