Comparative Genome Analysis between Agrostis stolonifera and Members of the Pooideae Subfamily Including Brachypodium distachyon
|
|
|
- Noel Cobb
- 6 years ago
- Views:
Transcription

1 University of Massachusetts Amherst Amherst Masters Theses February Comparative Genome Analysis between Agrostis stolonifera and Members of the Pooideae Subfamily Including Brachypodium distachyon Loreto P. Araneda University of Massachusetts Amherst Follow this and additional works at: Part of the Genomics Commons, and the Plant Breeding and Genetics Commons Araneda, Loreto P., "Comparative Genome Analysis between Agrostis stolonifera and Members of the Pooideae Subfamily Including Brachypodium distachyon" (2011). Masters Theses February Retrieved from This thesis is brought to you for free and open access by ScholarWorks@UMass Amherst. It has been accepted for inclusion in Masters Theses February 2014 by an authorized administrator of ScholarWorks@UMass Amherst. For more information, please contact scholarworks@library.umass.edu.
2 COMPARATIVE GENOME ANALYSIS BETWEEN AGROSTIS STOLONIFERA AND MEMBERS OF THE POOIDEAE SUBFAMILY, INCLUDING BRACHYPODIUM DISTACHYON A Thesis Presented by LORETO ARANEDA Submitted to the Graduate School of the University of Massachusetts Amherst in partial fulfillment of the requirements for the degree of MASTER OF SCIENCE September 2011 Plant and Soil Sciences
3 Copyright by Loreto Araneda 2011 All Rights Reserved
4 COMPARATIVE GENOME ANALYSIS BETWEEN AGROSTIS STOLONIFERA AND MEMBERS OF THE POOIDEAE SUBFAMILY, INCLUDING BRACHYPODIUM DISTACHYON A Thesis Presented by LORETO ARANEDA Approved as to style and content by: Geunhwa Jung, Chair Ana Caicedo, Member Samuel Hazen, Member Stephen M. Rich, Department Head Plant, Soil, and Insect Sciences
5 DEDICATION A mi familia. Thanks to God for everything I have experienced. My parents Manuel and Sara..all their love and efforts have made me the person I am now. My brothers and sister, Manolo, Juan Pablo and Paola..my playmates during my childhood and that make me proud. My nieces and nephews, Belen, Florencia, Simon and Matias..they have filled my heart of love. Carlos and Marjorie..for being the happiness of my sister and brother. And my loved husband Roberto the light in my life.
6 ACKNOWLEDGMENTS I am very thankful to my advisor, Dr. Geunhwa Jung, whose encouragements, guidance and support during these years enabled me to develop this study. I offer my regards and blessings to all my lab mates Maiko, Jay, Katie, Chang-Ho, Jiyeon, Emily, Leah, Siman, Jeonghwa, Jon and Sara who always help me in any respect during the completion of my project. Finally, I have to thank you to Dr. Jin-Joo Bae, Dr. Sung-Chur Sim, Dr. Nanda Chakraborty, Dr. Maiko Inoue and Dr. Scott Warnke for the information provided to carry out my investigation. v
7 ABSTRACT COMPARATIVE GENOME ANALYSIS BETWEEN AGROSTIS STOLONIFERA AND MEMBERS OF THE POOIDEAE SUBFAMILY, INCLUDING BRACHYPODIUM DISTACHYON SEPTEMBER 2011 LORETO ARANEDA, B.S. UNIVERSIDAD CATOLICA OF VALPARAISO, CHILE M.S., UNIVERSITY OF MASSACHUSETTS AMHERST Directed by: Professor Geunhwa Jung Understanding of grass genome structure and evolution has been significantly advanced through comparative genomics. The genomes of most cool-season forage and turf grasses, belonging to the Pooideae subfamily of the grasses, remain understudied. Creeping bentgrass (Agrostis stolonifera, allotetraploid 2n=4x=28) is one of the most important cool-season turfgrasses widely used on golf courses due to its low mowing tolerance and aggressive growth habit. Genome analysis of this recently domesticated polyploidy, creeping bentgrass, can add to the understanding of the evolution and domestication of grasses. In this study, an RFLP genetic map of creeping bentgrass using 229 RFLP markers derived from cereal (91) and creeping bentgrass (68) EST-RFLP probes was constructed for a comparative genome analysis. The genetic map of creeping bentgrass (Aveneae tribe) was compared with those of perennial ryegrass (Poeae tribe), oat (Aveneae tribe) and wheat (Triticeae tribe) of the Pooideae subfamily, and rice (Oryzeae tribe) of the Ehrhartoideae subfamily. Large-scale chromosomal rearrangements between the map of creeping bentgrass and the respective maps of the Triticeae, oat, and rice were observed. However, despite their membership in different vi
8 tribes of Pooideae, no evidence of chromosomal rearrangements between the maps of creeping bentgrass and perennial ryegrass was detected, suggesting that these recently domesticated species might be closely related than expected. Further comparative genome analysis of creeping bentgrass was performed with whole genome sequences of Brachypodium distachyon (Brachypodieae tribe, Pooideae subfamily) using sequences of the above-mentioned RFLP mapped markers and 8,470 publicly available A. stolonifera EST (AgEST) sequences. A total of 24 syntenic blocks were identified between the Agrostis linkage groups and the B. distachyon chromosomes. Orthologous loci of six hundred seventy-eight AgESTs were identified in the B. distachyon genome, and these loci can be utilized in further comparative mapping of Pooideae species. Insights from comparative genomics with B. distachyon will be useful for genetic improvement of Agrostis spp. and provide a better understanding of the evolution of the Pooideae species. vii
9 TABLE OF CONTENTS ACKNOWLEDGMENTS...v LIST OF TABLES...x LIST OF FIGURES...xi CHAPTER 1. COMPARATIVE GENOME ANALYSIS BETWEEN AGROSTIS STOLONIFERA AND MEMBERS OF THE POOIDEAE SUBFAMILY, INCLUDING BRACHYPODIUM DISTACHYON...1 Introduction...1 Materials and Methods...4 Plant material...4 RFLP analysis...5 Linkage map construction...6 Comparative genome analysis between creeping bentgrass and Triticeae, oat, perennial ryegrass, rice and B. distachyon...7 Results...9 Linkage map construction...9 Comparative genome relationships between creeping bentgrass and Triticeae, oat, perennial ryegrass, rice and B. distachyon...12 Triticeae...13 Oat...16 Perennial ryegrass...16 Rice...17 B. distachyon...18 Discussion...24 viii
10 Creeping bentgrass EST-RFLP map...24 Two subgenomes of creeping bentgrass...24 Synteny between creeping bentgrass and Triticeae, ryegrass, oat, rice and B. distachyon, and genome level affinity...26 APPENDIX: TABLES...31 BIBLIOGRAPHY...53 ix
11 LIST OF TABLES Table Page 1. Duplicated RFLP loci derived from a common set of heterologous cereal and creeping bentgrass EST-RFLP probes that were mapped in the 549 x 372 mapping population of creeping bentgrass Creeping bentgrass cdna clones mapped on 14 linkage groups of the creeping bentgrass reference population (549 x 372) (Chakraborty et al and 2006). The e-value of the cdna sequence that matches to database (BLASTX) and the map position of the bentgrass ESTs relative to rice (Kikuchi et al. 2003) and wheat (Sorrells et al. 2003; are indicated Genome comparisons of the 549 x 372 map of Agrostis stolonifera with previously published maps of Triticum, Lolium, Avena, and Oryza sativa based on a common set of heterologous cereal and creeping bentgrass EST-RFLP probes B. distachyon chromosome location of sequences of EST-RFLP markers mapped on genetic map of creeping bentgrass Creeping bentgrass EST orthologs to B. distachyon chromosomes Disease resistance and defense response genes identified in creeping bentgrass ESTs and their homologous peptides in B. distachyon...52 x
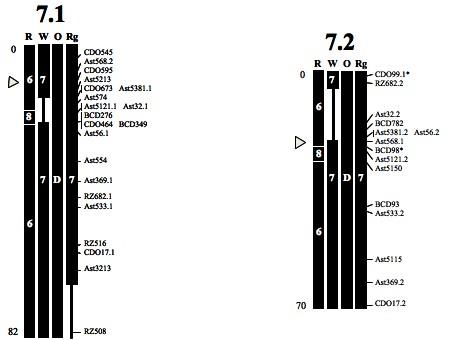
12 LIST OF FIGURES Figure Page 1. EST-RFLP genetic linkage map of creeping bentgrass Comparative genome relationships between creeping bentgrass genetic linkage map and the genetic maps of rice (R), Triticeae (W), oat (O) and ryegrass (Rg), respectively, represented for each of the black columns. The markers indicated on the right correspond to those mapped in the creeping bentgrass linkage map (Fig. 1). The number or letter inside the boxes shows the segments of chromosomes or linkage groups from each of the genomes (R, W, O, Rg) that are syntenic to the bentgrass linkage groups. The arrowheads indicate the deduced location of the centromere in bentgrass from the comparisons with Triticeae chromosomes. The total genetic length (cm) of each linkage group is indicated on bottom left Comparative genome relationship between creeping bentgrass and Brachypodium distachyon Creeping bentgrass ESTs orthologous to Brachypodium distachyon and their location in the physical map of B. distachyon xi
13 CHAPTER 1 COMPARATIVE GENOME ANALYSIS BETWEEN AGROSTIS STOLONIFERA AND MEMBERS OF THE POOIDEAE SUBFAMILY, INCLUDING BRACHYPODIUM DISTACHYON Introduction Eukaryotic genomes differ by gene content on chromosomes as well as the order of these genes, which are known as synteny and collinearity, respectively. Angiosperm genomes vary in size and arrangement, even within closely related species. Despite the frequent whole-genome duplication in angiosperms, the number of chromosomes is less variable than genome size. Analyses of changes in genomic structure, such as specific gene rearrangements, insertions or deletions, provide an informative way to clarify relationships among lineages. In the grass family Poaceae, significant variation in DNA content and chromosome number suggest that the evolution of these genomes is fast and dynamic (Tang et al. 2008). Comparative genomics studies in temperate cereals have been carried out using rice as a model system due to its compact and well-annotated genome sequence. However, the active changes in rice genome sequences, the lack of some biological features, characteristics of a model organism (easy to grow, short plant and life cycle) and the phylogenetic distance from the Pooideae subfamily (that include wheat, barley and temperate forage and turf grasses) lead one to question the utility of this species as a model system. Moreover, rice does not display all the traits that are applicable to study in 1
14 temperate grasses, such as fungal resistance, freezing and heat tolerance, wear and injury tolerance and others (Draper et al. 2001; Pacurar, 2009). A new species, Brachypodium distachyon is proposed as a better model system for temperate grasses than rice. Brachypodium distachyon is an annual wild grass member of the Brachypodieae tribe and the Pooideae subfamily. Besides its small and complete sequenced genome, B. distachyon has additional desirable biological features and a closer phylogenetic relationship to temperate cereals, forage and turf grasses (Draper et al. 2001; Pacurar, 2009; Kumar et al. 2009; Vogel et al. 2010; Garvin et al. 2010). Comparative genome analysis using a common set of RFLP probes in plants has demonstrated shared gene content and collinearity of genes among related Poaceae species, such as maize, wheat, barley, oat and rice. When whole-genome sequences or physical maps are not available, marker-based mapping is the best approach for a better understanding of the whole-genome (Devos et al. 1993; Van Deynze et al. 1995a, 1995b; Gaut, 2002). Species of the genus Agrostis (known as bentgrasses) are perennial, selfincompatible, and C3 cool-season grasses and are native to the temperate and subarctic climates of Western Europe. The four species commonly accepted as turfgrass types are: 1) creeping bentgrass A. stolonifera L. (2n=4x=28, A 2 and A 3 genomes), 2) velvet bentgrass A. canina L. (2n=2x=14, A 1 genome), 3) colonial bentgrass A. capillaris L. (2n=4x=28, A 1 and A 2 genomes), and 4) redtop bentgrass A. gigantea L. (2n=6x=42, A 1, A 2, and A 3 genomes). Creeping bentgrass is the most widely used for golf course because of its fine texture, excellent tolerance to low mowing, strong stoloniferous growth habit 2
15 and cold tolerance. The genus Agrostis is placed in the subfamily Pooideae of the grass family Poaceae that include rice (Oryza sativa L.), wheat (Triticum aestivum L.), barley (Hordeum vulgare L.), maize (Zea mays L.), oat (Avena sativa L.), ryegrass (Lolium spp.), and sorghum (Sorghum bicolor L.). Agrostis is assigned to the tribe Aveneae, which also includes oat (Renvoize and Clayton, 1992; Watson, 1990). Further, the tribes Aveneae and Poeae are closely related (Kellogg, 1998) and in some phylogenies have been combined, but this relationship remains unresolved (Grass Phylogeny Working Group, 2001). A few studies on molecular marker-based genetic mapping and trait mapping have been conducted in Agrostis. The first DNA marker based genetic linkage map of creeping bentgrass (Chakraborty et al. 2005) was developed from a full-sib reference mapping population by crossing two naturalized clones (549 and 372) collected from old golf courses in Wisconsin (Wang et al. 2005). The map covered a distance of 1,110 cm, and contained 14 linkage groups, which were mapped with 424 loci, including expressed sequence tag-restriction fragment length polymorphism (EST-RFLP), randomly amplified polymorphic DNA (RAPD), and amplified fragment length polymorphism (AFLP). Seven pairs of the homoeologous chromosomes were identified based on duplicated RFLP loci and numbered according to syntenous chromosomes of perennial ryegrass and wheat (Chakraborty et al. 2005). In addition, first genetic linkage map of colonial bentgrass using the backcross population of colonial bentgrass x creeping bentgrass (recurrent parent) mapped with AFLP and gene-based markers was published (Rotter et al. 2009). Recently, QTL mapping of field resistance to dollar spot caused by Sclerotinia homoeocarpa was investigated in an enhanced map of the 549 x 372 3
16 population using additional EST-RFLP loci (Chakraborty et al. 2006). Comparative genome relationships between Agrostis and Poacea spp. need to be established so that genome resources from well-studied species can be utilized to understand genome of underrepresented species for improvement. One objective of this study was to investigate comparative genome relationships between the EST-RFLP based genetic map of the creeping bentgrass 549 x 372 population and previously published maps of the Triticeae, perennial ryegrass, oat, and rice. For the first time, the creeping bentgrass map is integrated with those members of Poaceae family. A second objective of this study was to explore the utility of B. distachyon as a model system for members of Pooideae subfamily. Comparative genome analysis of A. stolonifera was performed with whole genome sequences of B. distachyon using publicly available sequences of 8,470 A. stolonifera EST and sequences of the above-mentioned EST-RFLP mapped markers. Materials and Methods Plant material A two-way pseudo-testcross population, which was developed from the cross between two highly heterozygous creeping bentgrass parental clones 549 and 372, was previously used to develop a genetic map (Chakraborty et al. 2005) using AFLP, RAPD, heterologous cereals and creeping bentgrass EST-RFLP markers. The map density was further enhanced for QTL analysis of dollar spot resistance by mapping additional EST- 4
17 RFLP markers (Chakraborty et al. 2006). For comparative genome analysis, an EST- RFLP genetic map was constructed in the current study. In brief, the controlled crosses were performed in a greenhouse by bagging panicles of both parents with a pollination bag after a field vernalization process. Two parental clones, 549 and 372 were chosen due to differences in morphological traits such as leaf color, shoot density, and root depth, and a significant difference in disease responses to snow mold (caused by Typhula spp.) (Wang et al. 2005) and dollar spot (caused by Sclerotinia homoeocarpa) (Chakraborty et al. 2006). Six hundred ninetyseven progeny were obtained from seeds harvested from the female clone 549. Of them, a randomly selected progeny of 90 individuals was used for the linkage map construction and for the comparative genome analysis. RFLP analysis Young leaves from greenhouse grown plants were harvested, immediately lyophilized and finely ground using a homogenizer. Genomic DNA was extracted from 500 mg of ground tissue using a modified CTAB method (Saghai-Maroof et al. 1984). Ten!g of genomic DNA from each plant was digested with five restriction enzymes (BamHI, DraI, EcoRI, EcoRV, and HindIII) (Promega, Madison, WI). Digested DNAs were loaded onto 1% (w/v) agarose gels and the restriction fragments were separated based on size by electrophoresis for 28 hours at 30V. The DNA from the gels was transferred to Hybond-N+ nylon membranes (Amersham, Piscataway, NJ) by capillary transfer overnight and then treated with optimal crosslink in a UV microwave. 5
18 Prehybridization and hybridization were performed in a rotary hybridization chamber (Techne, Inc.) at 65 C. Probes were labeled with 32 P by a random priming method (Feinberg and Vogelstein 1983). The membranes were washed in 0.5X SSC and 0.1% SDS for 1 hour at 65 C. Membranes were exposed to X-ray film with intensifying screening for five days at -80 C. The membranes were re-probed 10 to 15 times by first treating them with 0.2M NaOH for 20 min and then with 0.5M Tris/HCL ph 7.5, 0.1X SSC, 0.1% SDS for 20 min at room temperature. A common set of 152 heterologous anchor probes which contain oat cdna (CDO), barley cdna (BCD), and rice cdna (RZ) from Cornell University, Ithaca, N.Y. (Van Deynze et al. 1998) and additional CDO and BCD probes (the USDA probe depository, Albany, CA) were obtained. Probes with known map locations in the other grass species such as perennial ryegrass, wheat, and oat were initially selected for a further screening step. In addition, 140 creeping bentgrass EST-RFLP probes named Ast obtained from two cdna libraries for each parental clone of the 549 x 372 population (Chakraborty et al. 2005) were first screened against two mapping parents, 549 and 372. Polymorphic probes with a simple and scoreable segregating pattern, showing mostly single or two loci (rarely three or four loci), were selected and tested on the progeny. Linkage map construction An EST-RFLP based genetic map was constructed using JoinMap 3.0TM software (Van Ooijen and Voorrips 2001), which can handle out-crossing species using 6
19 any marker types with various modes of segregation. For example, analyzed RFLP markers were categorized into one of five segregation types: 1) a heterozygous locus in both parents with four alleles, 2) a heterozygous locus in both parents with one common allele, 3) a heterozygous locus in both parents with two common alleles, 4) a heterozygous locus in the maternal parent, and 5) a heterozygous locus in the paternal parent. LOD thresholds ranged from 4.0 to 10.0 were used for grouping of markers. The numbering of each pair of homoeologous linkage groups (LGs) was followed according to Chakraborty et al. (2006) and map distances were calculated using the Kosambi mapping function (Kosambi, 1944). Comparative genome analysis between creeping bentgrass and Triticeae, oat, perennial ryegrass, rice and B. distachyon The bentgrass 549 x 372 EST-RFLP genetic map was compared with the consensus genetic map of three Triticeae species developed among T. aestivum, T. tauschii, and Hordeum spp. available from the GrainGenes website ( (Van Deynze et al. 1995c). Comparative map analysis with perennial ryegrass was conducted by comparison with the previously published ryegrass maps (Jones et al. 2002; Sim et al. 2005) and the updated ryegrass map using 13 bentgrass Ast probes (Sim et al. 2007). Comparative map analysis with oat was performed through comparison with the oat map of Van Deynze et al. (1995b). Comparative map analysis with rice was conducted using maps obtained 7
20 from Gramene website ( and with the rice map of Ahn and Tanksley (1993). For the purpose of the comparative genome analysis in this study, a syntenic block between the two species was defined when a segment containing two syntenic loci was not disrupted by a non-syntenic locus or a segment with more than two syntenic loci was not disrupted by two consecutive non-syntenic loci. Those bentgrass EST-RFLP markers mapped were further analyzed for their putative function by blasting their sequences against protein sequences of known genes at E-value! 1x10⁻⁵ as a cut-off using BLASTX on the NCBI s web server. Map locations of Ast clones were deduced from syntenous chromosome locations in rice using sequence similarity with a Japonica rice cdna clone collection (Kikuchi et al. 2003) and wheat synteny information (Sorrells et al. 2003; Marker locations and order, detected with the common probes in each respective maps of the Triticeae, ryegrass, oat, and rice, were represented according to the published information cited above. Because the EST-RFLP markers found in the creeping bentgrass map do not have genetically mapped information in B. distachyon, the comparative analysis with this species was performed using BLASTN at B. distachyon web site ( and to determine the chromosomal location, selecting the alignments with E-values! 1" Moreover, sequences of 8,470 A. stolonifera EST (AgEST) publicly available (Rotter et al. 2007) were blasted against the B. distachyon genome to find orthologous loci between these two species. Before the BLAST analysis all the redundant AgEST sequences were removed using the CD-HIT-EST program with a sequence identity cut off #90% (Li and Godzik, 2006). The identification of orthologs 8
21 was based on two more stringent parameters CIP (Cumulative Identity Percentage) and CALP (Cumulative Alignment Length Percentage), and values of CIP #60% and CALP #70% were used as thresholds (Salse et al. 2008; Kumar et al. 2009). Results Linkage map construction Two hundred-twenty one heterologous RFLP probes (62 BCD, 121 CDO and 38 RZ) were chosen from a common set of 152 anchor probes (Van Deynze et al. 1998) and from additional CDO and BCD probes (the USDA probe depository, Albany, CA) because of their known positions on perennial ryegrass and Triticeae maps (Jones et al. 2002; Sim et al. 2005; Van Deynze 1995a and c). These probes were screened against bentgrass mapping parents and those with strong hybridization signals were selected to test in the progeny (Chakraborty et al and 2006). Fifty-five and sixty-two percentages of the barley BCD and oat CDO probes tested, respectively detected simple and scoreable band patterns (data not shown). However, most of the rice RZ probes showed weaker signals than those BCD and CDO probes. Some of the probes with the strong signals were not used due to their complex band patterns with more than two segregating loci per parent, which generated many allelic combinations that made them difficult to score. For example, probe CDO344 generated the most complex band patterns, showing 18 different segregation patterns. In total, 115 probes with simple and clear hybridization signals were tested to determine their segregation among progeny. 9
22 Among the tested probes 91 of them were scored and generated 126 markers, which were successfully mapped on 14 LGs (Fig. 1). The other twenty-two probes tested could not be scored because of their faint or smeared bands. In addition, a total of 140 creeping bentgrass EST-RFLP probes (Ast) were tested for first screening between two mapping parents, 549 and 372. Seventy-two of them exhibited a simple and scoreable segregating pattern, showing mostly single or two loci (rarely three or four loci), were selected and tested on the progeny individuals. Sixtyeight probes generated 103 markers, which were successfully mapped on 14 LGs (Fig. 1). Five types of RFLP segregation patterns among progenies were detected (ab x cd, ef x eg, hk x hk, lm x ll and nn x np). One locus, heterozygous in one of the parents (lm x ll or nn x np) was the most dominant among the segregation types. The lm x ll type (66%), heterozygous only in the 372 parent, was much more frequent than the nn x np type. Ninety three percent of the mapped markers segregated 1:1 or 1:1:1:1, with a few that segregated 1:2:1. Deviations from the expected segregation ratios (1:1, 1:1:1:1 or 1:2:1) were calculated for all of the mapped markers based on Chi-square contingency tables. Twenty-six percent of the mapped markers deviated significantly from the expected ratios. Particularly on LG5.2, one half of the mapped markers were significantly distorted at P<

 and highlighted in orange indicated an inversion and translocation between the")
23 Figure 1. EST-RFLP genetic linkage map of creeping bentgrass.the total genetic length (cm) of each linkage group is indicated below it. The creeping bentgrass, oat, barley and rice cdnas used as RFLP markers are indicated as Ast, CDO, BCD and RZ followed by the clone number (clone numbers plus.1,.2,.3 or.4 which show duplicated loci that where linked by a black dotted line). The segment on LGs 6.1 and 6.2, spanning three RFLP markers (CDO1380, CDO1158 and CDO534) and highlighted in orange indicated an inversion and translocation between the two homoeologous LGs. 11
24 The final map utilized in the current study included 229 markers generated from 159 RFLP probes including a 42% of those probes that were duplicated (Table 1). The total number of markers was separated into 14 LGs at LOD thresholds ranging from 4.0 to 10.0 (Fig. 1). The numbers for each of the linkage groups (LG1 to LG7) were assigned according to the common probes mapped in genetic maps of the Triticeae (Van Deynze et al. 1995c) and perennial ryegrass (Jones et al. 2002; Sim et al and 2007). The numbering of each pair of the homoeologous LGs followed Chakraborty et al. (2005 and 2006). A total of 865 cm was covered in the current genetic map and the genome coverage varied from 30 cm to 91 cm for each LG. The number of mapped marker distribution was from 11 to 22 per LG and the average interval between markers was 3.8 cm in size (Fig. 1). Comparative genome relationships between creeping bentgrass and Triticeae, oat, perennial ryegrass, rice and B. distachyon Comparative genome relationships between the map of creeping bentgrass and the respective map of the Triticeae, rice, perennial ryegrass and oat using a common set of heterologous EST-RFLP cereal probes and EST-RFLP creeping bentgrass probes were shown in Figure 2. Overall, comparative mapping showed highly conserved syntenic relationships between creeping bentgrass and the Triticeae, ryegrass, oat and rice. Besides, the sequences of the Ast probes in the current study were BLAST searched, and 39 of them showed similarity to known genes. Moreover 47 and 32 Ast 12
25 probes showed a putative location on rice and wheat chromosomes, respectively (Table 2) Triticeae The 53 EST-RFLP loci with known map locations in the Triticeae were evenly distributed on seven pairs of creeping bentgrass LGs (Fig. 2). These markers covered 98% of the bentgrass map (Table 3). Bentgrass LGs 1, 2, 6, and 7 except for a few nonsyntenic loci, showed almost complete synteny with corresponding homoeologous chromosomes of the Triticeae. We detected a chromosomal rearrangement on bentgrass LG3.2 relative to Triticeae chromosomes 1 and 3. Bentgrass LG3.2 is represented by the insertion of a segment (covered by Ast and Ast5170) of the Triticeae chromosome 1 between two distinct segments of Triticeae chromosome 3. Bentgrass LGs 4.1 and 4.2 contained large-scale chromosomal rearrangements relative to the Triticeae chromosomes 4 and 5. A distal end segment of the Triticeae chromosome 5 flanked by CDO484.1 and CDO504.2 loci on LG4.1 was inserted into the Triticeae chromosome 4. For LG4.2 the same segment flanked by the duplicated loci, CDO484.2 and CDO504.1 was observed. However, due to disruption by a non-syntenic marker (BCD808), a block of synteny could not be established. In addition, bentgrass LG5.1 was represented by segments of Triticeae chromosomes 4 and 5. A segment of Triticeae chromosome 4 flanked by Ast357 and CDO989.1 loci was inserted into Triticeae chromosome 5. In total, we detected three large-scale chromosomal rearrangements in LGs 3, 4, and 5, which can differentiate the bentgrass genome from the Triticeae genome. 13
, Triticeae (W), oat (O) and ryegrass (Rg), respectively,")
 that are syntenic to the bentgrass linkage groups.")
26 Figure 2. Comparative genome relationships between creeping bentgrass genetic linkage map and the genetic maps of rice (R), Triticeae (W), oat (O) and ryegrass (Rg), respectively, represented for each of the black columns. The markers indicated on the right correspond to those mapped in the creeping bentgrass linkage map (Fig. 1). The number or letter inside the boxes shows the segments of chromosomes or linkage groups from each of the genomes (R, W, O, Rg) that are syntenic to the bentgrass linkage groups. The arrowheads indicate the deduced location of the centromere in bentgrass from the comparisons with Triticeae chromosomes. The total genetic length (cm) of each linkage group is indicated on bottom left. 14

27 Figure 2. Continued. 15
28 Oat Relatively small coverage of the bentgrass map (76%) was detected by 42 common loci with oat, which were caused by lack of common probes and resulted in a weak syntenic block on bentgrass LG2 (Table 3). Our comparative map indicated that bentgrass LGs 4 and 5 consisted of rearrangements (reciprocal translocation) of oat chromosomes E and F (Fig. 2). Bentgrass LG4.2 was composed of two segments of oat chromosomes E and F. A segment from the most distal area in oat chromosome F between CDO1395 and CDO20.2 loci was inserted between CDO38 and BCD450 loci in oat chromosome E. Bentgrass LGs 5.1 and 5.2 also included two segments of chromosomes E and F. Therefore bentgrass LGs 4 and 5 were differentiated from oat chromosomes E and F. In addition, we detected a large-scale chromosomal rearrangement on bentgrass LG3.1 relative to oat chromosomes B and C. The LG3.1 is represented by the attachment of a segment (flanked by CDO244.1 and BCD98.2 loci) of the oat chromosome B to the distal end of oat chromosome C. Perennial ryegrass The 104 common loci were assigned to their locations on the ryegrass map, which covered 92% of the bentgrass map (Table 3). Despite the most number of the common loci shared between the two species, except for some non-syntenic loci, all bentgrass LGs have complete syntenic relationships with those of ryegrass (Fig. 2). Even for bentgrass LGs 4 and 5 which are different from ones of Triticeae and oat, no evidence of largescale chromosomal rearrangement at the present map resolution was observed between bentgrass and ryegrass. 16
29 Rice The 83 common loci mapped on rice and bentgrass genetic maps covered 82% of the bentgrass map (Table 3). The genome coverage was higher because map locations of the Ast mapped loci were deduced from sequence similarity of bentgrass ESTs with rice. Twenty-nine segments that are derived from all of the rice chromosomes, except for rice chromosome 11, explain all the bentgrass linkage groups (Fig. 2). However, BCD808 on LG4.2 represents rice chromosome 11 and the three duplicated loci generated from Ast563 probe, which were mapped on LGs 5.1, 5.2, and 3.2 represent rice chromosome 11. With the exception of a few non-syntenic loci, both homoeologous pairs of LGs 3 and 6 showed the most conserved syntenic relationships with the homologous chromosomes 1 and 2 of rice, respectively. On the other hands, the other five bentgrass LGs (1, 2, 4, 5, and 7) showed large-scale chromosomal rearrangements relative to rice. Bentgrass LG1.2 was comprised of two syntenic segments from rice chromosomes 5 and 10. A segment containing BCD921 and CDO94 from rice chromosome 10 was inserted into two segments of rice chromosome 5. Only CDO98 on LG1.1 represents rice chromosome 10. Bentgrass LGs 2.1 and 2.2 are represented by segments of rice chromosomes 4 and 7. Bentgrass LG4.2 is represented by the insertion of rice chromosome 7 between two distinct segments of rice chromosome 3. Bentgrass LGs 5.1 and 5.2 are represented by two segments of rice chromosomes 9 and 12. Lastly, LGs 7.1 and 7.2 are represented by the insertion of rice chromosome 8 between two distinct segments of rice chromosome 6. 17
30 B. distachyon Chromosomal location of the EST-RFLP loci mapped in the bentgrass genetic map was deduced by similarity between sequences of the EST-RFLP markers and the B. distachyon chromosome sequences (Table 4). One hundred fourteen out of the 160 EST- RFLP markers with significant alignments (E!1x10⁻¹⁰ ) to B. distachyon genome were used for analysis of comparative relationship between these two species. Twenty-four segments derived from all the five B. distachyon chromosomes were distributed in the 14 bentgrass LGs (Fig. 3). However at the current resolution, only two markers CDO684 and Ast5162 duplicated on LGs 2.1 and 2.2 established a block of synteny with chromosome 5 of B. distachyon. Markers CDO1328 on LG2.1, Ast567 on LG2.2, CDO244.1 on LG3.1 and CDO244.2 on LG3.2 also represent chromosome 5 of B. distachyon. The most conserved syntenic relationships were found between LG1.1 and chromosome 2, LGs and chromosome 2, LGs and chromosome 1, LG5.2 and chromosome 4, and LGs and chromosome 3 of B. distachyon. Out of them, the largest inferred region showing 14 syntenic loci was detected between bentgrass LG4.2 and B. distachyon chromosome 1. However, on LGs 3.1 and 3.2 still remain large regions with unknown syntenic relationship to sections of B. distachyon chromosomes. The rest of the bentgrass LGs showed large-scale chromosomal rearrangements (LGs 1.2, 2.1, 2.2, 5.1, 7.1 and 7.2). Bentgrass LG1.2 presents synteny with two segments of B. distachyon chromosomes 2 and 3; linkage group 2.1 has two blocks of synteny with chromosomes 1 and 5. 18
31 Figure 3. Comparative genome relationship between creeping bentgrass and Brachypodium distachyon. Each of the bars represents the bentgrass linkage groups (total length in cm, below the bar) as showed in Fig.1. The boxes correspond to the conserved synteny to a segment of Brachypodium chromosome (number inside). The position of nonsyntenic markers within a block of synteny is showed in parenthesis next to the marker name. Markers in bold, within a block of synteny, were additionally located in a different chromosome (indicated in parenthesis next to the marker). The collinearity is represented by the color lines that link the markers with the highly similar sequences located in B. distachyon chromosomes (Bd) 19
32 Figure 3. Continued. 20
33 Figure 3. Continued. 21
34 Figure 3. Continued. Linkage group 5.1 is represented by the insertion of a segment of chromosome 3 between two segments of chromosome 4, a similar rearrangement in LGs 7.1 and 7.2 but in these cases the insertion of chromosome 3 is between two segments of B. distachyon chromosome 1. Linkage group 2.2 did not show chromosomal rearrangement but only showed four loci in a block syntenic to B. distachyon chromosome 1 (Fig. 3). However the rest of the loci (6) were found either in chromosomes 1, 4 or 5 and this could represent a possibility of additional insertions of one or all these B. distachyon chromosomes. The orthology analysis between 8,470 A. stolonifera ESTs (AgEST) and B. distachyon genome showed 678 non-redundant AgEST orthologs to B. distachyon [196 AgEST in Ch1 (29%), 136 AgEST in Ch2 (20%), 151 AgEST in Ch3 (22%), 104 AgEST 22
35 in Ch4 (15%) and 91 AgEST in Ch5 (14%)] in Figure 4. Ninety five percent of these orthologous loci corresponded to unique loci and the rest were found duplicated among and within B. distachyon chromosomes (Table 5). Figure 4. Creeping bentgrass ESTs orthologous to Brachypodium distachyon and their location in the physical map of B. distachyon (in base pairs). Bd1, Bd2, Bd3, Bd4 and Bd5 represent the B. distachyon chromosomes (1 to 5) and horizontal lines for the position of the 678 orthologs. The segments of different colors indicate the creeping bentgrass linkage groups that have synteny with a specific region of B. distachyon chromosomes. The arrowheads indicate the centromeric region. 23
36 Discussion Creeping bentgrass EST-RFLP map The total RFLP-based map size is 865 cm, which is shorter than a previously published creeping bentgrass genetic map (1,110 cm in Chakraborty et al and 2006). This difference may be due to the number and type of markers mapped (229). Other marker systems such as AFLP may make the linkage map length longer due to double crossing-overs. For example, AFLP maps in perennial ryegrass have the longest length (Bert et al. 1999). Genotyping errors should also be considered. In this study, sixty-eight Ast probes generated 103 RFLP markers, which were mapped on 14 LGs (Fig. 1). The sequences of those Ast probes showed similarity to known genes and a putative location on rice and wheat chromosomes (Table 3). These results reflect that Ast probes have the high potential for use in genomic analysis not only for creeping bentgrass but also other for bentgrass spp. Two subgenomes of creeping bentgrass Agrostis species are suggested to have some of the most complex genome structures among other genera within the grass family (Bonos et al. 2002). Early cytological studies performed by Jones (1956a, b, and c), studies of disomic inheritance of polymorphic isozymes, the published RFLP based linkage map with duplicated markers likely originated from the two subgenomes (A 2 and A 3 ) and the ratio of coupling 24
37 vs. repulsion linkages between markers, suggest that creeping bentgrass is a strict allotetraploid comprised of two A 2 A 2 and A 3 A 3 subgenomes (Warnke et al. 1998; Chakraborty et al and 2006). At the current map resolution, a high percentage (42%) of the mapped RFLP markers were duplicated and evenly distributed on the seven pairs of homoeologous LGs (Fig. 1) which further confirmed an allotetraploid origin suggested by Jones (1956a, b, and c), Warnke et al. (1998), and Chakraborty et al. (2005). Duplication of markers within and among LGs in Figure 1 were detected in following probes: Ast5244, Ast39, Ast5343, Ast552, Ast563, BCD98 and CDO99. Evidence of inversion and translocation between distal end segments of two homoeologous LGs 6.1 and 6.2 indicated that two subgenomes of creeping bentgrass could have gone through major chromosomal rearrangements. However, more research is required to confirm whether duplications of markers are within homologous chromosomes before homoeologous chromosomes are differentiated. Unfortunately, diploid bentgrass species with either A 2 or A 3 genome are presently unknown. Colonial and velvet bentgrasses have been proposed to have genome compositions A 1 A 1 A 2 A 2 and A 1 A 1 based on cytological evidence, respectively, where the A 1 A 1 genome is common. Recent DNA sequences based phylogenic analysis suggested that genome designation for velvet bentgrass should be A 2 genome (Rotter et al. 2010). Comparison of these two species maps mapped with the same set of RFLP probes uniquely present in each genome should reveal the chromosomes of the A 2 genome common in creeping and colonial bentgrasses. 25
38 Synteny between creeping bentgrass and Triticeae, ryegrass, oat, rice and B. distachyon, and genome level affinity A high level of conserved synteny between creeping bentgrass and other grass species such as Triticeae, ryegrass, oat and rice were observed in the current study. Comparative mapping studies within Poaceae species also revealed evidence of unique chromosomal rearrangements. Kellogg (1998) studied genome structure within the grass family using comparative mapping and suggested that all species belonging to the Pooideae subfamily have two unique chromosomal rearrangements ( and 6-8-6) relative to rice. As a member of the Pooideae subfamily, creeping bentgrass in the current study clearly shows the and the rice rearrangements on creeping bentgrass LGs 1 and 7, respectively as observed in ryegrass (Sim et al. 2005). The bentgrass LGs fell in the 12 groups of orthology between rice and wheat defined by Salse et al. (2008), however LGs 4 and 5 show differences due to lack of synteny with chromosome 11 of rice. When we compare creeping bentgrass with rice at this level of map resolution, only four markers (CDO365, CDO520, BCD808 and Ast563) represent this rice chromosome in six different bentgrass LGs (2.2, 3.2, 4.1, 4.2, 5.1, and 5.2). The poor synteny with this rice chromosome may be attributable to the high fraction of repetitive sequences described in rice chromosomes 11 and 12 (29.5% and 31.6%, respectively) producing a disruption of the synteny (The Rice Chromosomes 11 and 12 Sequencing Consortia, 2005). Based on comparisons of morphological characters, bentgrass and oat belong to the same Aveneae tribe, while ryegrass belongs to the Poeae tribe (Renvoize and Clayton, 26
39 1992). Results of our comparative genome analyses show strong syntenic relationship between bentgrass and ryegrass, with only four non-syntenic markers. On the other hand, events of large-scale chromosomal rearrangements relative to oat were detected on bentgrass LGs 3, 4 and 5. Results suggest that bentgrass is more closely related to ryegrass than to oat in terms of genome structure, despite a closer taxonomic affinity between bentgrass and oat. These results combined with previous results in the recently domesticated species ryegrass provide strong evidence to dispute the currently accepted taxonomic relationship among species within Pooideae subfamily, which Jones et al. (2002) and Sim et al. (2005) first brought into question. Additionally, Rotter et al. (2007) carried out the first and only phylogenetic analysis that included two members of Agrostis genus (A. stolonifera creeping bentgrass and A. capillaris colonial bentgrass ) based on sequences of conserved ortholog sets (COS). This study clustered creeping and colonial bentgrasses more closely to tall fescue (tribe Poeae) than to oat (tribe Aveneae). Therefore, these recently domesticated species, bentgrass and ryegrass, might be closely related and wild grass species of the Poaceae family. Based on the common sets of markers, when creeping bentgrass is compared to rice, the number of chromosomal rearrangements is eight, on the LG1.2, , 4.2, and The same types of rearrangements were previously reported in ryegrass when it is compared to rice (Sim et al., 2005). However when creeping bentgrass is compared to B. distachyon, this number is reduced to six because LGs 4.1 and 4.2 do not show any evidence of chromosomal rearrangements. Nevertheless we observed many changes in the order of markers within blocks of synteny across the different LGs (Fig.3), a situation that could indicate that gene movements within chromosome have taken place 27
40 with a relatively high frequency (de la Rota, 2004). Despite all the B. distachyon chromosomes are represented across the 14 LGs of creeping bentgrass, chromosome 5 of B. distachyon is significantly underrepresented (only two syntenic blocks defined by two markers, Fig. 3). According to Vogel et al. (2010) the high LTR retrotransposon density found in this B. distachyon chromosome could increase syntenic disruptions. We believe that one way to establish a more accurate syntenic relationship with B. distachyon chromosomes is to develop molecular markers from the creeping bentgrass EST orthologous to the B. distachyon genome identified in this study, which could serve as a roadmap in order to enhance the Agrostis linkage map. As a preliminary attempt we have designed intron-spanning primers (data not shown) based on B. distachyon genome sequences and creeping bentgrass EST orthologs (Feltus et al. 2006). These primers were screened in nine species from the Aveneae, Poeae and Brachypodieae tribes and around 70% of them amplified strong polymorphic bands in all the species. Future linkage studies could be performed using intron-spanning markers, considering the close proximity of introns to exons and the conserved position of introns. A previous study detected the most robust QTL for dollar spot resistance on LG7.1 of the creeping bentgrass linkage map (Chakraborty et al. 2006). The same authors mention that QTL for SHB-TRS (sheath blight resistance caused by Rhizoctonia solani) could be detected close to the dollar spot resistance QTL, since both fungi may have similar pathogenicity. Based on our comparative mapping, there is a highly similar genome structure between creeping and ryegrass. Previous studies have located QTL for crown rust and powdery mildew resistance in linkage group 7 of ryegrass genetic map (Sim et al and Schejbel et al. 2008). With this limited information we could suggest 28
41 that LG7.1 of creeping bentgrass may has a more important role in disease resistance than the rest of the linkage groups. When we compare creeping bentgrass with rice for syntenic QTL information, we found that the QTL for SHB-TRS resistance is located on chromosome 11 of rice (Channamallikarjuna et al. 2010) and several genes of agronomic importance (blast, bacterial, virus, insect resistance and others) have been mapped in rice chromosomes 11 and 12, moreover the resistance and defense response genes [leucinerich repeat (LRR), protein kinase and NB-ARC domains] are enriched on these two chromosomes relative to the whole genome of rice (The Rice Chromosomes 11 and 12 Sequencing Consortia, 2005). However due to lack of synteny with this rice chromosome, it is not possible to establish a link between the genetic information of rice and the QTL information of creeping bentgrass at an equivalent level of resolution. In addition to this, when we examined the putative function of the complete data set of creeping bentgrass EST used in this study we found 13 of them showed similarity to genes associated with defense or disease resistance. The bentgrass ESTs with hits from the B. distachyon proteome and homologous genes were localized mainly to B. distachyon chromosomes 1, 2 and 3 (Table 6). As shown in Figure 3, chromosomes 1 and 3 of B. distachyon show synteny with bentgrass LG7.1 where the major QTL for field resistance to dollar spot was found. Additionally, Chakraborty et al. (2006) detected QTL with smaller effect in LGs 7.2, 2.1, 3.2, 4.1, 4.2 and 6.2 that present synteny with B. distachyon chromosomes 1, 2 and 3. A recent study indicated a higher level of synteny and conservation of resistance gene positions between B. distachyon and barley, as compared with rice and barley (Drader and Kleinhofs, 2010). Although rice has been extensively used as a model system for grasses, genome information of B. distachyon 29
42 could be easily transferable for comparative studies, at least in Pooideae spp. due to evolutionary closeness. Future studies should explore the relationship between QTL of traits of interest in the bentgrass linkage map and genes located in syntenic areas of B. distachyon. In conclusion, the current genetic map of allotetraploid creeping bentgrass was, for the first time, used for comparative genome analysis with cereals based on a common set of cereal and creeping bentgrass EST-RFLP probes. This comparative map establishes a first look in elucidating genome organization among bentgrass species as well as understanding the genome relationships of bentgrass with Triticeae, ryegrass, oat, and rice. Evidence of large-scale chromosomal rearrangements, which differentiate the bentgrass genome from genomes of Triticeae, oat, and rice, were observed based on syntenic markers, and need further validation. However, no evidence of large-scale chromosomal rearrangement was detected between two recently domesticated species, bentgrass and ryegrass suggesting that these two species might be more closely related than expected. Our future goal is to utilize genetic information from well-studied model species like rice and now B. distachyon through comparative mapping, to locate ortholog genes of traits of interest in bentgrass and eventually to develop improved creeping bentgrass cultivars using classical and molecular breeding approaches. Currently, this map has served to detect a QTL for field resistance to dollar spot (Chakraborty et al. 2006) and will be utilized for mapping QTLs and functional markers for important traits of interest in the golf industry such as drought, cold, heat, salt and disease tolerance, as well as leaf color, aggressiveness, and shoot density. 30
43 APPENDIX TABLES Table 1. Duplicated RFLP loci derived from a common set of heterologous cereal and creeping bentgrass EST-RFLP probes that were mapped in the 549 x 372 mapping population of creeping bentgrass. No. of probes generating multiple loci Source of probe a 1 locus 2 loci 3 loci 4 loci Total Ast BCD CDO RZ Total a Ast, BCD, CDO, and RZ probes derived from creeping bentgrass, barley, oat, and rice cdnas, respectively. 31
44 Table 2. Creeping bentgrass cdna clones mapped on 14 linkage groups of the creeping bentgrass reference population (549 x 372) (Chakraborty et al and 2006). The e-value of the cdna sequence that matches to database (BLASTX) and the map position of the bentgrass ESTs relative to rice (Kikuchi et al. 2003) and wheat (Sorrells et al. 2003; are indicated. Putative location on Bentgrass Bentgrass chromosomes cdna clone Putative function e-value LG Wheat Rice Ast5151 putative U2 snrnp auxiliary factor [Oryza sativa] 7e Ast54 No significant similarity found Ast355 phosphoglycerate kinase, putative [Arabidopsis thaliana] 6e Ast3151 unknown protein [A. thaliana] 1e Ast5208 glycine cleavage system H protein, mitochondrial, putative [A. thaliana] 2e Ast39 chitinase (EC ) precursor [Beta vulgaris] 2e Ast348 No strong matches Ast3102 Mg-chelatase subunit XANTHA-F [Hordeum vulgare] 2e Ast540 homeobox-leucine zipper protein homolog [Glycine max] 2e Ast5145 ribosomal protein L12.1 precursor, chloroplast [Secale cereale] 2e Ast580 No hit Ast567 thylakoid lumen 15.0 kda protein [A. thaliana] 2e Ast5162 chlorophyll A-B binding protein, chloroplast (LHCB6) [A. thaliana] 1e Ast33 No hit Ast3277 putative histidine kinase [O. sativa] 1e Ast555 oxygen-evolving enhancer protein 3-1, chloroplast precursor (16 kda subunit photosystem II) [O. sativa] 1e Ast564 No hit Ast571 oat victorin binding protein [Avena sativa] 5e Ast5166 metallothionein-like protein type 3 [H. vulgare] 6e
Identification and Characterization of Shared Duplications between Rice and Wheat Provide New Insight into Grass Genome Evolution W
 The Plant Cell, Vol. 20: 11 24, January 2008, www.plantcell.org ª 2008 American Society of Plant Biologists RESEARCH ARTICLES Identification and Characterization of Shared Duplications between Rice and
Developing and implementing molecular markers in perennial ryegrass breeding
 Developing and implementing molecular markers in perennial ryegrass breeding K.F. Smith 1,3, J.W. Forster 2,3, T.A. Ciavarella 1,3, J.L. Dumsday 2, M.P. Dupal 2,3, E.S. Jones 2,3, B.D. Kirkwood 1,3, A.
The Phylogenetic Reconstruction of the Grass Family (Poaceae) Using matk Gene Sequences
 Using matk Gene Sequences") The Phylogenetic Reconstruction of the Grass Family (Poaceae) Using matk Gene Sequences by Hongping Liang Dissertation submitted to the Faculty of the Virginia Polytechnic Institute and State University
The Phylogenetic Reconstruction of the Grass Family (Poaceae) Using matk Gene Sequences by Hongping Liang Dissertation submitted to the Faculty of the Virginia Polytechnic Institute and State University
Principles of QTL Mapping. M.Imtiaz
 Principles of QTL Mapping M.Imtiaz Introduction Definitions of terminology Reasons for QTL mapping Principles of QTL mapping Requirements For QTL Mapping Demonstration with experimental data Merit of QTL
Investigations into biomass yield in perennial ryegrass (Lolium perenne L.)
") Investigations into biomass yield in perennial ryegrass (Lolium perenne L.) Ulrike Anhalt 1,2, Pat Heslop-Harrison 2, Céline Tomaszewski 1,2, Hans-Peter Piepho 3, Oliver Fiehn 4 and Susanne Barth 1 1 2
Investigations into biomass yield in perennial ryegrass (Lolium perenne L.) Ulrike Anhalt 1,2, Pat Heslop-Harrison 2, Céline Tomaszewski 1,2, Hans-Peter Piepho 3, Oliver Fiehn 4 and Susanne Barth 1 1 2
PLNT2530 (2018) Unit 5 Genomes: Organization and Comparisons
 Unit 5 Genomes: Organization and Comparisons") PLNT2530 (2018) Unit 5 Genomes: Organization and Comparisons Unless otherwise cited or referenced, all content of this presenataion is licensed under the Creative Commons License Attribution Share-Alike
PLNT2530 (2018) Unit 5 Genomes: Organization and Comparisons Unless otherwise cited or referenced, all content of this presenataion is licensed under the Creative Commons License Attribution Share-Alike
Supporting Information
 SI Material and Methods Nucleic acid sequence alignments. Supporting Information Three new parameters were recently defined in Salse et al. (1) to increase the stringency and significance of BLAST sequence
Tansley review no. 132 Tansley review no. 132
 Review Blackwell Science Ltd Evolutionary dynamics of grass genomes Author for correspondence: Brandon S. Gaut Tel: +1 (949) 824 2564 Fax: +1 (949) 824 2181 Email: bgaut@uci.edu Brandon S. Gaut Department
Developing summerdormant tall fescue for the southern Great Plains
 Developing summerdormant tall fescue for the southern Great Plains Persistence is the major constraint of growing tall fescue in south-central USA 40-60% stand loss in a year Improve persistence Drought
RFLP facilitated analysis of tiller and leaf angles in rice (Oryza sativa L.)
") Euphytica 109: 79 84, 1999. 1999 Kluwer Academic Publishers. Printed in the Netherlands. 79 RFLP facilitated analysis of tiller and leaf angles in rice (Oryza sativa L.) Zhikang Li 1,2,3, Andrew H. Paterson
Euphytica 109: 79 84, 1999. 1999 Kluwer Academic Publishers. Printed in the Netherlands. 79 RFLP facilitated analysis of tiller and leaf angles in rice (Oryza sativa L.) Zhikang Li 1,2,3, Andrew H. Paterson
Genetic diversity and population structure in rice. S. Kresovich 1,2 and T. Tai 3,5. Plant Breeding Dept, Cornell University, Ithaca, NY
 Genetic diversity and population structure in rice S. McCouch 1, A. Garris 1,2, J. Edwards 1, H. Lu 1,3 M Redus 4, J. Coburn 1, N. Rutger 4, S. Kresovich 1,2 and T. Tai 3,5 1 Plant Breeding Dept, Cornell
MOLECULAR MAPS AND MARKERS FOR DIPLOID ROSES
 MOLECULAR MAPS AND MARKERS FOR DIPLOID ROSES Patricia E Klein, Mandy Yan, Ellen Young, Jeekin Lau, Stella Kang, Natalie Patterson, Natalie Anderson and David Byrne Department of Horticultural Sciences,
Essential Questions. Meiosis. Copyright McGraw-Hill Education
 Essential Questions How does the reduction in chromosome number occur during meiosis? What are the stages of meiosis? What is the importance of meiosis in providing genetic variation? Meiosis Vocabulary
Classical Selection, Balancing Selection, and Neutral Mutations
 Classical Selection, Balancing Selection, and Neutral Mutations Classical Selection Perspective of the Fate of Mutations All mutations are EITHER beneficial or deleterious o Beneficial mutations are selected
J. MITCHELL MCGRATH, LESLIE G. HICKOK, and ERAN PICHERSKY
 P1. Syst. Evol. 189:203-210 (1994) --Plant Systematics and Evolution Springer-Verlag 1994 Printed in Austria Assessment of gene copy number in the homosporous ferns Ceratopteris thalictroides and C. richardii
Exam 1 PBG430/
 1 Exam 1 PBG430/530 2014 1. You read that the genome size of maize is 2,300 Mb and that in this species 2n = 20. This means that there are 2,300 Mb of DNA in a cell that is a. n (e.g. gamete) b. 2n (e.g.
Physiology of Cold Acclimation and Deacclimation of Cool-Season Grasses
 Physiology of Cold Acclimation and Deacclimation of Cool-Season Grasses Michelle DaCosta Stockbridge School of Agriculture University of Massachusetts Photo by A. Maddocks Winter 2013-2014 Photo provided
Processes of Evolution
 15 Processes of Evolution Forces of Evolution Concept 15.4 Selection Can Be Stabilizing, Directional, or Disruptive Natural selection can act on quantitative traits in three ways: Stabilizing selection
Comparative Genomics of Fagaceae
 Fagaceae Images.google.com Linkage Map www.quia.com TM www.clipartlord.com Selection of mapping parents SM2 SM1 Predominant pollinator? Progeny Exclusion for Full Sib Linkage Mapping Year Acorns genotyped
Regulatory Change in YABBY-like Transcription Factor Led to Evolution of Extreme Fruit Size during Tomato Domestication
 SUPPORTING ONLINE MATERIALS Regulatory Change in YABBY-like Transcription Factor Led to Evolution of Extreme Fruit Size during Tomato Domestication Bin Cong, Luz Barrero, & Steven Tanksley 1 SUPPORTING
CHAPTER 23 THE EVOLUTIONS OF POPULATIONS. Section C: Genetic Variation, the Substrate for Natural Selection
 CHAPTER 23 THE EVOLUTIONS OF POPULATIONS Section C: Genetic Variation, the Substrate for Natural Selection 1. Genetic variation occurs within and between populations 2. Mutation and sexual recombination
Managing segregating populations
 Managing segregating populations Aim of the module At the end of the module, we should be able to: Apply the general principles of managing segregating populations generated from parental crossing; Describe
Review of Plant Cytogenetics
 Review of Plant Cytogenetics Updated 2/13/06 Reading: Richards, A.J. and R.K. Dawe. 1998. Plant centromeres: structure and control. Current Op. Plant Biol. 1: 130-135. R.K. Dawe. 2005. Centromere renewal
Supplemental Data. Chen and Thelen (2010). Plant Cell /tpc
. Plant Cell /tpc") Supplemental Data. Chen and Thelen (2010). Plant Cell 10.1105/tpc.109.071837 1 C Total 5 kg 20 kg 100 kg Transmission Image 100 kg soluble pdtpi-gfp Plastid (PDH-alpha) Mito (PDH-alpha) GFP Image vector
Supplemental Data. Chen and Thelen (2010). Plant Cell 10.1105/tpc.109.071837 1 C Total 5 kg 20 kg 100 kg Transmission Image 100 kg soluble pdtpi-gfp Plastid (PDH-alpha) Mito (PDH-alpha) GFP Image vector
Genome Rearrangements In Man and Mouse. Abhinav Tiwari Department of Bioengineering
 Genome Rearrangements In Man and Mouse Abhinav Tiwari Department of Bioengineering Genome Rearrangement Scrambling of the order of the genome during evolution Operations on chromosomes Reversal Translocation
Non-host resistance to wheat stem rust in Brachypodium species
 Non-host resistance to wheat stem rust in Brachypodium species Dr. Melania Figueroa Assistant Professor Department of Plant Pathology and Stakman-Borlaug Center for Sustainable Plant Health University
A fuzzy weighted least squares approach to construct phylogenetic network among subfamilies of grass species
 Journal of Applied Mathematics & Bioinformatics, vol.3, no.2, 2013, 137-158 ISSN: 1792-6602 (print), 1792-6939 (online) Scienpress Ltd, 2013 A fuzzy weighted least squares approach to construct phylogenetic
Genetics 275 Notes Week 7
 Cytoplasmic Inheritance Genetics 275 Notes Week 7 Criteriafor recognition of cytoplasmic inheritance: 1. Reciprocal crosses give different results -mainly due to the fact that the female parent contributes
DNA Structure and Function
 DNA Structure and Function Nucleotide Structure 1. 5-C sugar RNA ribose DNA deoxyribose 2. Nitrogenous Base N attaches to 1 C of sugar Double or single ring Four Bases Adenine, Guanine, Thymine, Cytosine
Wheat Genetics and Molecular Genetics: Past and Future. Graham Moore
 Wheat Genetics and Molecular Genetics: Past and Future Graham Moore 1960s onwards Wheat traits genetically dissected Chromosome pairing and exchange (Ph1) Height (Rht) Vernalisation (Vrn1) Photoperiodism
MAPPING QUANTITATIVE TRAIT LOCI (QTLS) FOR SALT TOLERANCE IN RICE (ORYZA SATIVA) USING RFLPS
 FOR SALT TOLERANCE IN RICE (ORYZA SATIVA) USING RFLPS") Pak. J. Bot., 36(4): 825-834, 4. MAPPING QUANTITATIVE TRAIT LOCI (QTLS) FOR SALT TOLERANCE IN RICE (ORYZA SATIVA) USING RFLPS M. SHAHID MASOOD, YANAGIHARA SEIJI *, ZABTA K. SHINWARI AND RASHID ANWAR Plant
Pak. J. Bot., 36(4): 825-834, 4. MAPPING QUANTITATIVE TRAIT LOCI (QTLS) FOR SALT TOLERANCE IN RICE (ORYZA SATIVA) USING RFLPS M. SHAHID MASOOD, YANAGIHARA SEIJI *, ZABTA K. SHINWARI AND RASHID ANWAR Plant
Model plants and their Role in genetic manipulation. Mitesh Shrestha
 Model plants and their Role in genetic manipulation Mitesh Shrestha Definition of Model Organism Specific species or organism Extensively studied in research laboratories Advance our understanding of Cellular
Fei Lu. Post doctoral Associate Cornell University
 Fei Lu Post doctoral Associate Cornell University http://www.maizegenetics.net Genotyping by sequencing (GBS) is simple and cost effective 1. Digest DNA 2. Ligate adapters with barcodes 3. Pool DNAs 4.
BIO Lab 5: Paired Chromosomes
 Paired Chromosomes Of clean animals and of animals that are not clean.two and two, male and female, went into the ark with Noah as God had commanded Noah. Genesis 7:8-9 Introduction A chromosome is a DNA
Potato Genome Analysis
 Potato Genome Analysis Xin Liu Deputy director BGI research 2016.1.21 WCRTC 2016 @ Nanning Reference genome construction???????????????????????????????????????? Sequencing HELL RIEND WELCOME BGI ZHEN LLOFRI
4/26/18. Domesticated plants vs. their wild relatives. Lettuce leaf size/shape, fewer secondary compounds
 The final exam: Tuesday, May 8 at 4:05-6:05pm in Ruttan Hall B35. 75 multiple choice questions for 150 points 50 questions from Lecture 20 27 25 questions directly from the first two exams. Key for exam
You are encouraged to answer/comment on other people s questions. Domestication conversion of plants or animals to domestic uses
 The final exam: Tuesday, May 8 at 4:05-6:05pm in Ruttan Hall B35. 75 multiple choice questions for 150 points 50 questions from Lecture 20 27 25 questions directly from the first two exams. Key for exam
Report of the Research Coordination Meeting Genetics of Root-Knot Nematode Resistance in Cotton Dallas, Texas, October 24, 2007
 Report of the Research Coordination Meeting Genetics of Root-Knot Nematode Resistance in Cotton Dallas, Texas, October 24, 2007 Participants: Frank Callahan, Peng Chee, Richard Davis, Mamadou Diop, Osman
Cell Division. OpenStax College. 1 Genomic DNA
 OpenStax-CNX module: m44459 1 Cell Division OpenStax College This work is produced by OpenStax-CNX and licensed under the Creative Commons Attribution License 3.0 By the end of this section, you will be
Ch 11.Introduction to Genetics.Biology.Landis
 Nom Section 11 1 The Work of Gregor Mendel (pages 263 266) This section describes how Gregor Mendel studied the inheritance of traits in garden peas and what his conclusions were. Introduction (page 263)
Genetic and physiological approach to elucidation of Cd absorption mechanism by rice plants
 Genetic and physiological approach to elucidation of Cd absorption mechanism by rice plants Satoru Ishikawa National Institute for Agro-Environmental Sciences, 3-1-3, Kannondai, Tsukuba, Ibaraki, 305-8604,
Assessment of Genetic Diversity of Pawpaw Cultivars with Inter-Simple Sequence Repeat Markers
 Assessment of Genetic Diversity of Pawpaw Cultivars with Inter-Simple Sequence Repeat Markers Kirk W. Pomper*, Sheri B. Crabtree, and Snake C. Jones Kentucky State University What is Pawpaw? Asimina triloba
GENOME SIZE and base chromosome number vary
 Published November, 2011 ORIGINAL RESEARCH Reference Genome-Directed Resolution of Homologous and Homeologous Relationships within and between Different Oat Linkage Maps Juan J. Gutierrez-Gonzalez and
Roadmap. Sexual Selection. Evolution of Multi-Gene Families Gene Duplication Divergence Concerted Evolution Survey of Gene Families
 1 Roadmap Sexual Selection Evolution of Multi-Gene Families Gene Duplication Divergence Concerted Evolution Survey of Gene Families 2 One minute responses Q: How do aphids start producing males in the
PHYLOGENY AND SYSTEMATICS
 AP BIOLOGY EVOLUTION/HEREDITY UNIT Unit 1 Part 11 Chapter 26 Activity #15 NAME DATE PERIOD PHYLOGENY AND SYSTEMATICS PHYLOGENY Evolutionary history of species or group of related species SYSTEMATICS Study
Segregation distortion in F 2 and doubled haploid populations of temperate japonica rice
 c Indian Academy of Sciences RESEARCH NOTE Segregation distortion in F 2 and doubled haploid populations of temperate japonica rice MASUMI YAMAGISHI 1,2,6, YOSHINOBU TAKEUCHI 3,7, ISAO TANAKA 4, IZUMI
2 Numbers in parentheses refer to literature cited.
 A Genetic Study of Monogerm and Multigerm Characters in Beets V. F. SAVITSKY 1 Introduction Monogerm beets were found in the variety Michigan Hybrid 18 in Oregon in 1948. Two of these monogerm plants,
Transferring Powdery Mildew Resistance Genes from Wild Helianthus into Cultivated Sunflower. Pilar Rojas-Barros, Chao-Chien Jan, and Thomas J.
 Transferring Powdery Mildew Resistance Genes from Wild Helianthus into Cultivated Sunflower Pilar Rojas-Barros, Chao-Chien Jan, and Thomas J. Gulya USDA-ARS, Northern Crop Science Laboratory, Fargo, ND
Chapter 10 Sexual Reproduction and Genetics
 Sexual Reproduction and Genetics Section 1: Meiosis Section 2: Mendelian Genetics Section 3: Gene Linkage and Polyploidy Click on a lesson name to select. Chromosomes and Chromosome Number! Human body
Time allowed: 2 hours Answer ALL questions in Section A, ALL PARTS of the question in Section B and ONE question from Section C.
 UNIVERSITY OF EAST ANGLIA School of Biological Sciences Main Series UG Examination 2017-2018 GENETICS BIO-5009A Time allowed: 2 hours Answer ALL questions in Section A, ALL PARTS of the question in Section
Eiji Yamamoto 1,2, Hiroyoshi Iwata 3, Takanari Tanabata 4, Ritsuko Mizobuchi 1, Jun-ichi Yonemaru 1,ToshioYamamoto 1* and Masahiro Yano 5,6
 Yamamoto et al. BMC Genetics 2014, 15:50 METHODOLOGY ARTICLE Open Access Effect of advanced intercrossing on genome structure and on the power to detect linked quantitative trait loci in a multi-parent
Reinforcement Unit 3 Resource Book. Meiosis and Mendel KEY CONCEPT Gametes have half the number of chromosomes that body cells have.
 6.1 CHROMOSOMES AND MEIOSIS KEY CONCEPT Gametes have half the number of chromosomes that body cells have. Your body is made of two basic cell types. One basic type are somatic cells, also called body cells,
Molecular Markers, Natural History, and Evolution
 Molecular Markers, Natural History, and Evolution Second Edition JOHN C. AVISE University of Georgia Sinauer Associates, Inc. Publishers Sunderland, Massachusetts Contents PART I Background CHAPTER 1:
GSBHSRSBRSRRk IZTI/^Q. LlML. I Iv^O IV I I I FROM GENES TO GENOMES ^^^H*" ^^^^J*^ ill! BQPIP. illt. goidbkc. itip31. li4»twlil FIFTH EDITION
 FIFTH EDITION IV I ^HHk ^ttm IZTI/^Q i I II MPHBBMWBBIHB '-llwmpbi^hbwm^^pfc ' GSBHSRSBRSRRk LlML I I \l 1MB ^HP'^^MMMP" jflp^^^^^^^^st I Iv^O FROM GENES TO GENOMES %^MiM^PM^^MWi99Mi$9i0^^ ^^^^^^^^^^^^^V^^^fii^^t^i^^^^^
Ch. 13 Meiosis & Sexual Life Cycles
 Introduction Ch. 13 Meiosis & Sexual Life Cycles 2004-05 Living organisms are distinguished by their ability to reproduce their own kind. -Offspring resemble their parents more than they do less closely
Part I. Origin and Evolution of Wheat
 Part I Origin and Evolution of Wheat Chapter 1 Domestication of Wheats 1.1 Introduction Wheats are the universal cereals of Old World agriculture (Harlan 1992; Zohary and Hopf 1988, 1993) and the world
Chapter 26: Phylogeny and the Tree of Life Phylogenies Show Evolutionary Relationships
 Chapter 26: Phylogeny and the Tree of Life You Must Know The taxonomic categories and how they indicate relatedness. How systematics is used to develop phylogenetic trees. How to construct a phylogenetic
Selection Methods in Plant Breeding
 Selection Methods in Plant Breeding Selection Methods in Plant Breeding 2nd Edition by Izak Bos University of Wageningen, The Netherlands and Peter Caligari University of Talca, Chile A C.I.P. Catalogue
Picture from "Mendel's experiments: Figure 3," by Robert Bear et al
 Plant Genetics Learning Objectives: Understand the basics o genetics Understand how genetics is used in Plant Science today Learn the basics o extracting DNA Learn how to make crosses between plants and
Ladies and Gentlemen.. The King of Rock and Roll
 Ladies and Gentlemen.. The King of Rock and Roll Learning Objectives: The student is able to construct an explanation, using visual representations or narratives, as to how DNA in chromosomes is transmitted
Name Class Date. KEY CONCEPT Gametes have half the number of chromosomes that body cells have.
 Section 1: Chromosomes and Meiosis KEY CONCEPT Gametes have half the number of chromosomes that body cells have. VOCABULARY somatic cell autosome fertilization gamete sex chromosome diploid homologous
Partitioning of General and Specific Combining Ability Effects for Estimating Maternal and Reciprocal Effects
 Partitioning of General and Specific Combining Ability Effects for Estimating Maternal and Reciprocal Effects Galal M. A. Mahgoub Maize Research Department, Field Crops Research Institute. Agricultural
allosteric cis-acting DNA element coding strand dominant constitutive mutation coordinate regulation of genes denatured
 A B C D E F G H I J K L M N O P Q R S T U V W X Y Z AA BB CC DD EE FF GG HH II JJ KK LL MM NN OO PP QQ RR SS TT UU VV allosteric cis-acting DNA element coding strand codominant constitutive mutation coordinate
USDA-DOE Plant Feedstock Genomics for Bioenergy
 USDA-DOE Plant Feedstock Genomics for Bioenergy BERAC Thursday, June 7, 2012 Cathy Ronning, DOE-BER Ed Kaleikau, USDA-NIFA Plant Feedstock Genomics for Bioenergy Joint competitive grants program initiated
Nature Genetics: doi: /ng Supplementary Figure 1. The phenotypes of PI , BR121, and Harosoy under short-day conditions.
 Supplementary Figure 1 The phenotypes of PI 159925, BR121, and Harosoy under short-day conditions. (a) Plant height. (b) Number of branches. (c) Average internode length. (d) Number of nodes. (e) Pods
Intracolonial nepotism during colony fissioning in honey bees?
 Intracolonial nepotism during colony fissioning in honey bees? Juliana Rangel Co-authors: Heather Mattila, Thomas Seeley Department of Neurobiology and Behavior Cornell University Apimondia Conference,
Browsing Genomic Information with Ensembl Plants
 Browsing Genomic Information with Ensembl Plants Etienne de Villiers, PhD (Adapted from slides by Bert Overduin EMBL-EBI) Outline of workshop Brief introduction to Ensembl Plants History Content Tutorial
Quiz Section 4 Molecular analysis of inheritance: An amphibian puzzle
 Genome 371, Autumn 2018 Quiz Section 4 Molecular analysis of inheritance: An amphibian puzzle Goals: To illustrate how molecular tools can be used to track inheritance. In this particular example, we will
Meiosis and Sexual Life Cycles
 Chapter 13 Meiosis and Sexual Life Cycles Lecture Outline Overview: Variations on a Theme Living organisms are distinguished by their ability to reproduce their own kind. Offspring resemble their parents
Situation of corn in Myanmar
 Situation of corn in Myanmar Phyu Phwe New Plant Variety Protection Unit Department of Agricultural Research(DAR) (2. 8.2016) Introduction Maize - second mandate cereal in Myanmar after rice Mainly utilized
Introduction to Molecular and Cell Biology
 Introduction to Molecular and Cell Biology Molecular biology seeks to understand the physical and chemical basis of life. and helps us answer the following? What is the molecular basis of disease? What
Untitled Document. A. antibiotics B. cell structure C. DNA structure D. sterile procedures
 Name: Date: 1. The discovery of which of the following has most directly led to advances in the identification of suspects in criminal investigations and in the identification of genetic diseases? A. antibiotics
Jay Moore,, Graham King, James Lynn. Data integration for Brassica comparative genomics
 Jay Moore,, Graham King, James Lynn Data integration for Brassica comparative genomics How best to bring together diverse data about Brassica genome organisation? How best to make data accessible and useful
Chapter 11 INTRODUCTION TO GENETICS
 Chapter 11 INTRODUCTION TO GENETICS 11-1 The Work of Gregor Mendel I. Gregor Mendel A. Studied pea plants 1. Reproduce sexually (have two sex cells = gametes) 2. Uniting of male and female gametes = Fertilization
THE WORK OF GREGOR MENDEL
 GENETICS NOTES THE WORK OF GREGOR MENDEL Genetics-. - Austrian monk- the father of genetics- carried out his work on. Pea flowers are naturally, which means that sperm cells fertilize the egg cells in
BREEDING AND GENETICS
 The Journal of Cotton Science 6:97-103 (2002) http://journal.cotton.org, The Cotton Foundation 2002 97 BREEDING AND GENETICS Assessment of Day-Neutral Backcross Populations of Cotton Using AFLP Markers
2012 Univ Aguilera Lecture. Introduction to Molecular and Cell Biology
 2012 Univ. 1301 Aguilera Lecture Introduction to Molecular and Cell Biology Molecular biology seeks to understand the physical and chemical basis of life. and helps us answer the following? What is the
Designer Genes C Test
 Northern Regional: January 19 th, 2019 Designer Genes C Test Name(s): Team Name: School Name: Team Number: Rank: Score: Directions: You will have 50 minutes to complete the test. You may not write on the
The Origin of Species
 The Origin of Species Introduction A species can be defined as a group of organisms whose members can breed and produce fertile offspring, but who do not produce fertile offspring with members of other
SUPPLEMENTARY INFORMATION
 Figure S1. Haploid plant produced by centromere-mediated genome elimination Chromosomes containing altered CENH3 in their centromeres (green dots) are eliminated after fertilization in a cross to wild
Research Notes: G. B. Pant University of Agriculture and Technology
 Volume 1 Article 6 4-1-1974 Research Notes: G. B. Pant University of Agriculture and Technology G. B. Pant University of Agriculture and Technology G. B. Pant University of Agriculture and Technology G.
Taxonomy. Content. How to determine & classify a species. Phylogeny and evolution
 Taxonomy Content Why Taxonomy? How to determine & classify a species Domains versus Kingdoms Phylogeny and evolution Why Taxonomy? Classification Arrangement in groups or taxa (taxon = group) Nomenclature
Bioinformatics: Investigating Molecular/Biochemical Evidence for Evolution
 Bioinformatics: Investigating Molecular/Biochemical Evidence for Evolution Background How does an evolutionary biologist decide how closely related two different species are? The simplest way is to compare
Doubled haploid ramets via embryogenesis of haploid tissue cultures
 Doubled haploid ramets via embryogenesis of haploid tissue cultures Harry E. Iswandar 1, J. M. Dunwell 2, Brian P. Forster 3, Stephen P. C. Nelson 1,4 and Peter D. S. Caligari,3,4,5 ABSTRACT Tissue culture
Supplementary Information for: The genome of the extremophile crucifer Thellungiella parvula
 Supplementary Information for: The genome of the extremophile crucifer Thellungiella parvula Maheshi Dassanayake 1,9, Dong-Ha Oh 1,9, Jeffrey S. Haas 1,2, Alvaro Hernandez 3, Hyewon Hong 1,4, Shahjahan
The history of Life on Earth reflects an unbroken chain of genetic continuity and transmission of genetic information:
 9/26/05 Biology 321 Answers to optional challenge probability questions posed in 9/23/05lecture notes are included at the end of these lecture notes The history of Life on Earth reflects an unbroken chain
Legend: S spotted Genotypes: P1 SS & ss F1 Ss ss plain F2 (with ratio) 1SS :2 WSs: 1ss. Legend W white White bull 1 Ww red cows ww ww red
 1SS :2 WSs: 1ss. Legend W white White bull 1 Ww red cows ww ww red") On my honor, this is my work GENETICS 310 EXAM 1 June 8, 2018 I. Following are 3 sets of data collected from crosses: 1. Spotted by Plain gave all spotted in the F1 and 9 spotted and 3 plain in the F2.
On my honor, this is my work GENETICS 310 EXAM 1 June 8, 2018 I. Following are 3 sets of data collected from crosses: 1. Spotted by Plain gave all spotted in the F1 and 9 spotted and 3 plain in the F2.
Stage 1: Karyotype Stage 2: Gene content & order Step 3
 Supplementary Figure Method used for ancestral genome reconstruction. MRCA (Most Recent Common Ancestor), AMK (Ancestral Monocot Karyotype), AEK (Ancestral Eudicot Karyotype), AGK (Ancestral Grass Karyotype)
Section 11 1 The Work of Gregor Mendel
 Chapter 11 Introduction to Genetics Section 11 1 The Work of Gregor Mendel (pages 263 266) What is the principle of dominance? What happens during segregation? Gregor Mendel s Peas (pages 263 264) 1. The
Genomes and Their Evolution
 Chapter 21 Genomes and Their Evolution PowerPoint Lecture Presentations for Biology Eighth Edition Neil Campbell and Jane Reece Lectures by Chris Romero, updated by Erin Barley with contributions from
BREEDING, GENETICS, AND PHYSIOLOGY. Phenotypic Analysis of the 2006 MY2 Mapping Population in Arkansas
 BREEDING, GENETICS, AND PHYSIOLOGY Phenotypic Analysis of the 2006 MY2 Mapping Population in Arkansas E.J. Boza, K.A.K. Moldenhauer, R.D. Cartwright, S. Linscombe, J.H. Oard, and M.M. Blocker ABSTRACT
Breeding Apomictic Forage Grasses: Molecular Strategies INTRODUCTION BREEDING HISTORY
 Breeding Apomictic Forage Grasses: Molecular Strategies R.W. Jessup 1, B.L. Burson 2, A.H. Paterson 3, and M.A. Hussey 1 1 Texas A&M University, 2 USDA-ARS, and 3 University of Georgia INTRODUCTION The
METHODS FOR DETERMINING PHYLOGENY. In Chapter 11, we discovered that classifying organisms into groups was, and still is, a difficult task.
 Chapter 12 (Strikberger) Molecular Phylogenies and Evolution METHODS FOR DETERMINING PHYLOGENY In Chapter 11, we discovered that classifying organisms into groups was, and still is, a difficult task. Modern
Evolution of phenotypic traits
 Quantitative genetics Evolution of phenotypic traits Very few phenotypic traits are controlled by one locus, as in our previous discussion of genetics and evolution Quantitative genetics considers characters
Systematic Analysis and Comparison of Nucleotide-Binding Site Disease Resistance Genes in a Diploid Cotton Gossypium raimondii
 Systematic Analysis and Comparison of Nucleotide-Binding Site Disease Resistance Genes in a Diploid Cotton Gossypium raimondii Hengling Wei 1,2, Wei Li 1, Xiwei Sun 1, Shuijin Zhu 1 *, Jun Zhu 1 * 1 Key
STUDY UNIT 1 MITOSIS AND MEIOSIS. Klug, Cummings & Spencer Chapter 2. Morphology of eukaryotic metaphase chromosomes. Chromatids
 STUDY UNIT 1 MITOSIS AND MEIOSIS Klug, Cummings & Spencer Chapter 2 Life depends on cell division and reproduction of organisms. Process involves transfer of genetic material. New somatic (body) cells
CHROMOSOMAL BASIS OF INHERITANCE
 CHROMOSOMAL BASIS OF INHERITANCE The fruit fly (Drosophila melanogaster) has been widely used for the study of eukaryote genetics because of several features: short generation time (two weeks) prolific
PREDICTING COMPLEX PHENOTYPE- GENOTYPE RELATIONSHIPS IN GRASSES: A SYSTEMS GENETICS APPROACH
 Clemson University TigerPrints All Dissertations Dissertations 5-2013 PREDICTING COMPLEX PHENOTYPE- GENOTYPE RELATIONSHIPS IN GRASSES: A SYSTEMS GENETICS APPROACH Stephen Ficklin Clemson University, spficklin@gmail.com
Guided Notes Unit 6: Classical Genetics
 Name: Date: Block: Chapter 6: Meiosis and Mendel I. Concept 6.1: Chromosomes and Meiosis Guided Notes Unit 6: Classical Genetics a. Meiosis: i. (In animals, meiosis occurs in the sex organs the testes
MARKER ASSISTED SELECTION (MAS) FOR DROUGHT TOLERANCE IN WHEAT USING MARKERS ASSOCIATED WITH MEMBRANE STABILITY
 FOR DROUGHT TOLERANCE IN WHEAT USING MARKERS ASSOCIATED WITH MEMBRANE STABILITY") AN. I.N.C.D.A. FUNDULEA, VOL. LXXVII, 2009 GENETICA ŞI AMELIORAREA PLANTELOR MARKER ASSISTED SELECTION (MAS) FOR DROUGHT TOLERANCE IN WHEAT USING MARKERS ASSOCIATED WITH MEMBRANE STABILITY SELECŢIA ASISTATĂ
AN. I.N.C.D.A. FUNDULEA, VOL. LXXVII, 2009 GENETICA ŞI AMELIORAREA PLANTELOR MARKER ASSISTED SELECTION (MAS) FOR DROUGHT TOLERANCE IN WHEAT USING MARKERS ASSOCIATED WITH MEMBRANE STABILITY SELECŢIA ASISTATĂ