PREDICTION OF PETROLEUM FRACTION ENTHALPIES FROM THE SECOND (ALPHA) MODIFICATION OF THE VAN DER WAALS EQUATION. Part 4. I. Review/Introduction
|
|
|
- Matthew Rogers
- 5 years ago
- Views:
Transcription
1 PREDICTION OF PETROLEUM FRACTION ENTHALPIES FROM THE SECOND (ALPHA) MODIFICATION OF THE VAN DER WAALS EQUATION Part 4 I. Review/Introduction In the first two papers (1,2) of this series, we developed and tested a 3-parameter modification of the van der Waals equation of state that greatly enhances its ability to accurately predict saturated and compressed liquid specific volumes for pure component hydrocarbons and several nonhydrocarbons, including water. The principle feature of this modification is to make the b parameter temperature-dependent by introducing a new parameter such that, b( T) bc where b c is the original VDW b parameter which accounts for the volume occupied by the molecules themselves. A successful correlation of the parameter as a function of the reduced temperature T r and the Pitzer acentric factor was achieved. In the third paper (3) we proposed a second 3-parameter modification which provides an improvement for the prediction of pure component vapor pressures and VLE for mixtures. For this modification we followed a similar approach as did G. Soave (4) in his modification of the Redlich-Kwong equation. We proceeded to make the VDW a parameter a general function of temperature by incorporating a temperature-dependent function such that, a ( T) ac where a c is the original VDW a parameter which accounts for the effect of intermolecular forces. Just as for the parameter we achieved a successful correlation for the parameter as a function of T r and. For the VLE mixture calculations we employed mixing rules for the vapor and liquid phases that were quite similar to those used by Chueh and Prausnitz (5) when they applied the Redlich-Kwong equation for calculating fugacity coefficients for components present in saturated vapor mixtures. In this fourth and final paper, we apply the alpha-modification of the VDW equation, developed in Part 3, to the prediction of petroleum fraction enthalpies. The prime objective here was to propose an alternative procedure to that published by Grayson- Johnson (6) and Lee-Kesler (7) for generating H-T diagrams for specified petroleum cuts.
2 Before developing this alternative method, we will first briefly discuss the following review and background topics: Conventional characterization parameters employed for petroleum fractions. 2. Previous petroleum fraction enthalpy charts developed and published by Johnson-Grayson and Lee-Kesler for K w (Watson characterization factors) values of 10.0, 11.0, 11.8 and The advantage of using a cubic (in volume) equation of state for calculating isothermal enthalpy departures for petroleum fractions. II. Petroleum Fraction Characterization Nature of Petroleum Fractions In reality petroleum fraction cuts consist of a mixture of hydrocarbons having a specified boiling range, average boiling point and average molecular weight. The specific identity of the hydrocarbons that constitute a petroleum cut are generally unknown. As a result, it is difficult to rigorously define specific properties such as enthalpy for these complex mixtures. The petroleum industry has adopted the use of "pseudo" compounds to characterize petroleum fractions. If the boiling range of the petroleum fraction is not to large (say 100 deg. F), then the "pseudo" concept assumes that the mixture will, within limits, behave as a pure compound characterized by an average or mean boiling point, specific gravity (60F/60F), molecular weight, etc. Generally speaking, the specification of any two such properties sets the value of all the other properties. Characterization Parameters The Watson (UOP) characterization factor, K w, is a very satisfactory parameter for correlating the physical and thermodynamic properties of straight-run petroleum fractions. It is defined as the cube root of the absolute boiling point in deg. R divided by the liquid specific gravity at 60 deg. F/ 60 deg. F or: K w 1 o T, 3 b R SG (1) Paraffinic and olefinic hydrocarbons typically have K w values that average around 12.5 to 13 whereas aromatics assume values around 10 or greater. Naphthenes have K w values that lie typically in the mid range such as Here is a short list of Watson factors for several hydrocarbons that fall into the various classes described above:
3 -3- Hydrocarbon Type K w n-pentane paraffinic n-octane paraffinic ,3 dimethyl hexane paraffinic butene olefinic pentene olefinic cyclopentane naphthenic n-propyl cyclo C 5 naphthenic benzene aromatic 9.73 toluene aromatic n-propyl benzene aromatic Five different boiling point definitions have proven useful as correlating parameters: Volume Average Boiling Point, VABP: VABP x T vi bi x vi = volume fraction of species i (2) Molal Average Boiling Point, MABP: MABP x T i x i = mole fraction of species i bi (3) Weight Average Boiling Point, WABP: WABP x T wi bi x wi = weight fraction of species i (4) Cubic Average Boiling Point, CABP: CABP x T vi 1/3 bi 3 (5)
4 -4- Mean Average Boiling Point, MeABP: MeABP MABP CABP 2 (6) Either deg. F or deg. R units may be used for each individual boiling point in order to compute VABP, MABP or WABP. However, deg. R units must be used for CABP. To compute MeABP, the MABP and CABP must be expressed in the same units. Petroleum fraction cuts are generally undefined mixtures, and the volume, mole and weight fractions are not known. However, ASTM D86 distillations for petroleum cuts are usually readily available or can easily be measured. The VABP is precisely defined as the weighted average of the ASTM D86 distillation temperatures after 10,30,50,70 and 90 percent by volume have been distilled, i.e. VABP t10 t30 t50 t70 t90 (7) 5 In the absence of the 90 percent temperature, an alternative expression can be used, namely, VABP t 2t t (8) The American Petroleum Institute (API) has developed a graphical correlation that relates all of the average boiling points to the VABP via a parameter called the ASTM D slope, S, defined by, S t t t t or (9) This correlation exists in graphical form and is not presented here. Knowing the value of S and the VABP, one can read off a correction factor t to be added to the VABP to give any one of the other boiling points for the petroleum fraction of interest.
5 -5- The volumetric average boiling point (VABP) appears to be the logical candidate as an input characterization parameter for correlating thermodynamic properties of petroleum cuts. It lies approximately on the 50 vol. % distillation point of the ASTM D86 curve. For example, consider the following measured ASTM D86 distillation curve for an Alaska naphtha: Vol. % t, deg. F Vol. % t, deg. F IBP EP From Eqn. 7, we calculate, VABP 283 deg. F 5 which is only 1 deg. F higher than the reported midpoint D86 temperature of 282 deg. F. The final characterization parameter of great utility is the liquid specific gravity at 60 deg. F relative to water at 60 deg. F, namely SG 60/60. This is easily measured and is related to another gravity parameter commonly used in the petroleum industry called the API gravity via the expression, API SG (10) or SG API (11) For example, if SG = , then, API gravity
6 It is quite apparent from these expressions that API decreases as the value of SG increases. -6- III. Enthalpy Charts - Previous Work Johnson and Grayson In their 1961 publication (6) in the Petroleum Refiner, Johnson and Grayson improved upon the enthalpy chart published by Bauer and Middleton (8). The chart developed by the latter authors correlates the enthalpy of vapor and liquid petroleum fractions as a function of temperature, and density in degrees API. Separate graphs for Watson characterization factor and pressure corrections were provided on the same chart. Although this correlation provides reliable enthalpy values for most applications, the authors point out that the reliability decreases markedly in the region of the critical, which was not indicated on their chart. In their work, Johnson and Grayson used the same correlations as did Bauer and Middleton for the heats of vaporization and heat capacities of liquids and low pressure vapors. The major improvements introduced by Johnson and Grayson were in the following areas: 1. Introduction of saturation envelopes for more convenient estimation of latent heats and for visual display of phase conditions in relation to the pseudocritical properties of the petroleum cut. 2. Development of four separate charts for different K w values, namely 10, 11, 11.8 and Improved representation of pressure effects on enthalpy. Included on each chart are small run-around charts which provide corrections for the effect of pressure on vapor enthalpies as a function of total pressure, temperature, API gravity and the Watson factor K w. 4. A change of basis, defining the zero enthalpy as that of the saturated liquid at deg. F rather than 0 deg. F. Kesler and Lee Over 15 years later, Kesler and Lee (7) improved the accuracy of the Johnson-Grayson charts, particularly for high pressure conditions and near the critical region, by: 1. Using improved correlations of specific heats at zero pressure and for saturated liquids (9). 2. By improving the representation of the saturation envelopes.
7 -7-3. By introducing new charts for more accurate representation of the effect of pressure on vapor and liquid enthalpies. Lee/Kesler performed steps 2 and 3 above using a generalized thermodynamic correlation (10) which they published in the previous year (1975). They used a modified Benedict- Webb-Rubin (BWR) equation of state to improve the three parameter corresponding states correlation of Pitzer for the prediction of volumetric and thermodynamic properties of vapor and liquid pure components and mixtures. The range of reduced parameters covered by this new correlation are T r = 0.3 to 4 and P r = 0 to 10. The isothermal effect of pressure on enthalpy is represented by Equation 12, o (0) (1) o o H H H H H H RTc RTc RTc (12) New values for the first and second order terms above were established by Lee and Kesler and published in both graphical and tabular form. The third parameter,, is the well-known Pitzer acentric factor defined precisely by, Log 10 Pvp Pc Tr (13) where P vp is the vapor pressure at T r = 0.7. Use of Equation 12 requires values for the critical pressure P c, critical temperature T c, acentric factor and molecular weight M. These authors used correlations presented in the API Technical Data Book to estimate these parameters. In their paper (7) they graphically represent each parameter as a function of K w and API gravity. In addition the authors present these correlations in analytical form as follows: T, deg. R SG ( SG) T c 5 ( SG)10 / Tb (14) b Ln( P, psia) / SG ( / SG c SG T SG / )10 b ( / / SG )10 T b ( / SG )10 Tb (15)
8 -8- M SG ( SG) T SG SG T T 2 7 ( )( / b)10 / ( SG SG )( / Tb)10 / Tb (16) b b Acentric factor for petroleum fractions is basically computed from the equation developed by W. C. Edmister (11), Log 7 T T P 1.0 c c b 1.0 (17) In Equations 14 through 17, T b is the normal boiling point in deg. R and SG is the liquid specific gravity at 60/60. In their 1975 publication, Lee and Kesler (10) also presented a useful equation for estimating the vapor pressure of pure hydrocarbons and narrow-boiling petroleum fractions. If the critical properties and the acentric factor are known or can be estimated, the following equations in three-parameter format are recommended: o VP VP ( ) VP (1) r r r Ln P Ln P Ln P (18) ( o) VP where Ln P / T LnT r r r (1) Tr (19) VP Ln P / T LnT r r r Tr (20) Lee and Kesler point out that Eqns. 18 through 20 satisfy the following constraints: 1. The exact definition of the acentric factor as given by Eqn The Riedel condition d / d T r = 0 at T r = 1 ; = the Riedel parameter 3. The critical point requirement that P VP r = 1.0 at T r = 1.0.
9 -9- IV. Use of the Alpha-Modification of the van der Waals Equation Equation of State Review Before applying it to the calculation of petroleum fraction enthalpies, we first review the gist of the alpha-modification of the van der Waals equation developed in Part 3 of this series (3). The original form of the van der Waals equation of state is written as, RT a P ; v molar volume (21) 2 v b v For a given component, the constants a and b are treated as true constants independent of temperature. So-called generalized expressions for these constants are readily derived using the criteria that, at the critical point, the first and second derivatives of the pressure with respect to the volume are both zero. When these criteria are applied to Equation 21, the following expressions result, 27 R T RT a a ; bb ; Z (22 a, b, c) 2 2 c c c c c 64 Pc 8Pc Equation 21 can readily be converted to the compressibility form by direct substitution of the following identities, 2 2 AR T B RT Z RT a ; b ; v (23 a, b, c) P P P The final result after substitution and rearrangement becomes, 3 2 Z B Z AZ AB ( 1) 0 (24) Following the same (original) premise as did Soave (4), at temperatures other than at the critical for a pure component, we define a temperature-dependent alpha () function such that, a( T) a ( T) (25) c (T) is a dimensionless parameter which becomes unity in the limit as T T c. The original a term in Equation 21 is now replaced by Equation 25.
10 -10- At this point we employed the same functional relationship as did Soave for relating to the reduced temperature T r, namely, m 1 T 0.5 r (26) This equation readily satisfied the requirement that for all pure components, the alpha function becomes unity at the critical point, 1 as T r 1 (27) Using vapor pressure data for 18 hydrocarbons and 5 nonhydrocarbons, including water and hydrogen, we performed a regression analysis of the above expressions (Eqns ) and arrived at a generalized correlation for m as a function of the acentric factor. This turned out to be a simple linear function given by, m (28) Pressure Effect on Enthalpy The rigorous thermodynamic expression for the isothermal effect of pressure on enthalpy can be written as, T v o P H H Pv RT T P d v v (29) The pressure derivative can be evaluated directly from the basic equation of state, Eqn. 21, P R da / d T 2 T v b v v This expression can now be substituted directly into Eqn. 29, and then the appropriate expression for the enthalpy departure derived, v o RT RT a H H Pv RT dt d v 2 2 v b v v b v T da
11 -11- d v v o d a H H Pv RT a T d T v 2 da1 Pv RT a T d T v v o H H Pv RT a da T dt v (30) The derivative term (da/dt) in Eqn. 30 is readily derived from Eqns. 25 and 26 with the result being, 0.5 da d m a ac dt d T TT c c (31) The total stream enthalpy can then be directly calculated from Eqn. 32, o o H H ( H H ) (32) H o is simply the ideal gas enthalpy evaluated at the same temperature as the actual liquid or vapor phase in question. Ideal Gas Enthalpy/Datum For the enthalpy datum we define H o = 1000 Btu/Lb for the ideal gas state at 0 deg. R. The original datum used by Lee-Kesler was H = 0 for the saturated liquid at deg. F. For each K w (chart) separate ideal curves resulted for each API gravity parameter. For each K w of interest we converted the Lee-Kesler ideal gas curves to the 1000 Btu/Lb ideal gas datum. When this process was completed, all of the ideal gas curves came together (coincided) regardless of the value for the API gravity. For each K w (individual chart) we proceeded to fit the ideal gas curves to power series functions of temperature over the temperature range deg. F to 1200 deg. F. These curves can be represented by the following equations and are in quite a convenient format for programming purposes.
12 -12- For K w o T T 10.0 H T x (33) 100 T 2 For K w o T T 11.0 H T x (34) 100 T 2 For K w o T T 11.8 H T x (35) T 2 For K w o T T 12.5 H T (36) 100 T 2 In these equations the units are T in degrees R and H o in Btu/Lb. For intermediate values of K w, H o is determined by simple linear interpolation.
13 -13- Vapor Pressure In order to generate the saturation V-L locus for a specified petroleum fraction, we need to have some reliable values for the vapor pressure. We could simply use the VP correlation of Lee-Kesler (Eqns ) shown on Page 8. However, it would be more appropriate and consistent if we use the modified VDW equation proposed here to calculate vapor pressures. For a pure component single phase vapor or liquid, the general volume-explicit form of the fugacity coefficient equation is written as, 1/ v f 1 Ln Z 1 Ln Z Z 1 v d (37) P v 0 If we next substitute Eqn. 21 and the identities Eqns. 23 a,b,c into Eqn. 37, and after rearrangement and simplification, we arrive at, f A Ln Z 1 LnZ B (38) P Z For a pure component at a specified temperature and at the vapor pressure, the fugacities in the vapor and liquid phases are equal, i.e. f L f V (39) By trial and error the pressure is varied, and values of f are calculated via Eqn. 38 for both the liquid and vapor phases. When Eqn. 39 is finally satisfied, the selected pressure is the "true" vapor pressure. Appendix I lists a BASIC program called MODVDWVP.BAS, which employs the alphamodification of the van der Waals equation to calculate petroleum fraction vapor pressures. In Line 5, values for the normal boiling point (TBF) and API gravity are inputted. Then the specific gravity and Watson characterization factor are immediately calculated via Lines Lines are devoted to the calculation of molecular weight, critical pressure, critical temperature and acentric factor from the Lee-Kesler correlations, Eqns In Line 175, the temperature is inputted along with a sound estimate of the vapor pressure. Characteristic EOS parameters are computed in Lines Lines are devoted to the calculation of the liquid compressibility factor and fugacity coefficient, and Lines to the calculation of the same quantities for the vapor. A subroutine starting at Line 760 is used to calculate all of the compressibility factors.
14 -14- Lines employ a Newton-Raphson iterative procedure to calculate a (vapor) pressure such that the equality of Eqn. 39 is eventually satisfied. The final vapor pressure value at convergence is printed by Line 370. Line 375 directs the program back to L175 and allows it to input (read in) another set of values for T and P est. A sample output is provided at the end of Appendix I for a petroleum fraction having a normal boiling point of deg. F and API gravity of 70. The specified temperature is 50 deg. F whereby a vapor pressure of psia is calculated and printed out. A simple comparison was made between the vapor pressures predicted by Program MODVDWVP.BAS and the Lee-Kesler method (Eqns ) for the same petroleum cut defined above (TBP = deg. F and API = 70). The results are summarized below: Temp. F Modif. VDW VP, Psia LK VP, Psia Enthalpy Program Appendix II features a BASIC program called MVDWPFH.BAS which computes single phase vapor or liquid enthalpies using our proposed alphamodification of the VDW equation. Lines perform the same basic operations as the vapor pressure program (Appendix I). Here the API gravity and NBP are inputted, and S, K w, molecular weight, critical constants and acentric factor are calculated and printed out. In Line 130 the operating temperature (deg. F), pressure (psia) and phase condition (F = 1 liquid; F = 2 vapor) are all specified. The ideal gas enthalpy is computed in Lines using Eqns and a simple linear interpolation routine for intermediate values of K w. Next the characteristic equation of state parameters are computed in Lines In Line 280 subroutine 760 is called upon to calculate the phase compressibility factor. And finally, the enthalpy departure and total stream enthalpy are computed via Lines and then printed from Line 325 along with the operating T and P.
15 -15- The program is then directed back to L130 to read in another T, P and F if available from DATA lines 1200 and higher or is simply terminated indicating that the program is "OUT OF DATA". Attached to the program listing in Appendix II is a sample output for a petroleum fraction with API gravity = 70 and NBP = deg. F. The two points run here are for a saturated liquid and vapor at 50 deg. F with VP = psia as computed and extracted from Program MODVDWVP.BAS (Appendix I). Test of Prediction Accuracy In the early seventies, Lenoir and Hipkin (12,13) completed extensive measurements of both liquid and vapor enthalpies for a host of petroleum fractions. In their first publication (12), they reported enthalpy data for a single light naphtha. The second publication (13) covered eight separate petroleum cuts - 5 naphthas and 3 gas oils. All of the data were reported in the format of the enthalpy difference H between the liquid state at 75 deg. F and some higher temperature (vapor or liquid state) all at fixed system pressure. The temperature range of the measurements was from 75 to 650 deg. F for pressures up to 1400 psia. These data are indeed rare. In fact, they are believed to be the only petroleum fraction enthalpy data currently available. We selected two representative petroleum cuts from the Lenoir-Hipkin data bank in order to perform a brief accuracy check on the proposed alpha-modified VDW equation. These were an Alaska naphtha and a gas oil. The reported VABP and API gravity were inputted into Program MVDWPFH.BAS and enthalpies were calculated at the precise experimental pressures and temperatures reported by the authors. Table 1 provides a detailed comparison for the Alaska naphtha. Table 2 gives a similar type comparison for the gas oil. The table below provides an overall summary of the comparisons: No. of Pts. Trend Abs Avg Dev Petrol. Cut VABP,F API Grav. Tested Btu/Lb Btu/Lb Alaska Naphtha Gas Oil The trends and average deviations reported are quite acceptable. The accuracy of isobaric flow calorimeters generally ranges between 1-2 Btu/Lb.
16 -16- Sample H-T Diagram We are now in a position to perform the necessary calculations for generating an H-T diagram for a specified petroleum fraction or cut. The illustration shown here will be for a petroleum cut for which: Kw = 11.8 and API gravity = 70 From Equations 1 and 11 we can readily calculate the liquid specific gravity and the value for the normal boiling point SG API TBP Kw SG 568.9deg. R109.2 deg. F In order to generate the saturated V/L H-T locus, we need to first generate vapor pressures for a host of temperatures that are below the critical temperature. For the petroleum cut under consideration here, Eqn. 14 predicts a critical temperature of deg. F. Next Program MODVDWVP.BAS was used to calculate vapor pressures over the temperature range of 0 to 400 deg. F. These data are basically listed in the middle of Page 14. In the strictest sense, a petroleum cut, no matter how close boiling it may be, is comprised of a mixture of hydrocarbons. In actuality, we would get a separate bubble point and dew point temperature for a given pressure. However, these temperatures are generally very close to one another. As discussed previously, petroleum fractions are conventionally treated as hypothetical pure components with a single or unique value of the vapor pressure corresponding to each T T c. The temperature/vapor pressure data generated above along with the TBP and API gravity were subsequently inputted into program MVDWPFH.BAS, and the corresponding liquid and vapor enthalpies calculated up to the critical temperature. In addition the ideal gas enthalpy data were also generated based on the datum of H o = 1000 Btu/Lb at 0 deg. R. All of the results were then plotted as an H-T diagram which is displayed here as Figure 1. Although some extrapolation for the liquid saturation curve was done, we show a complete temperature range of 200 to 500 deg. F.
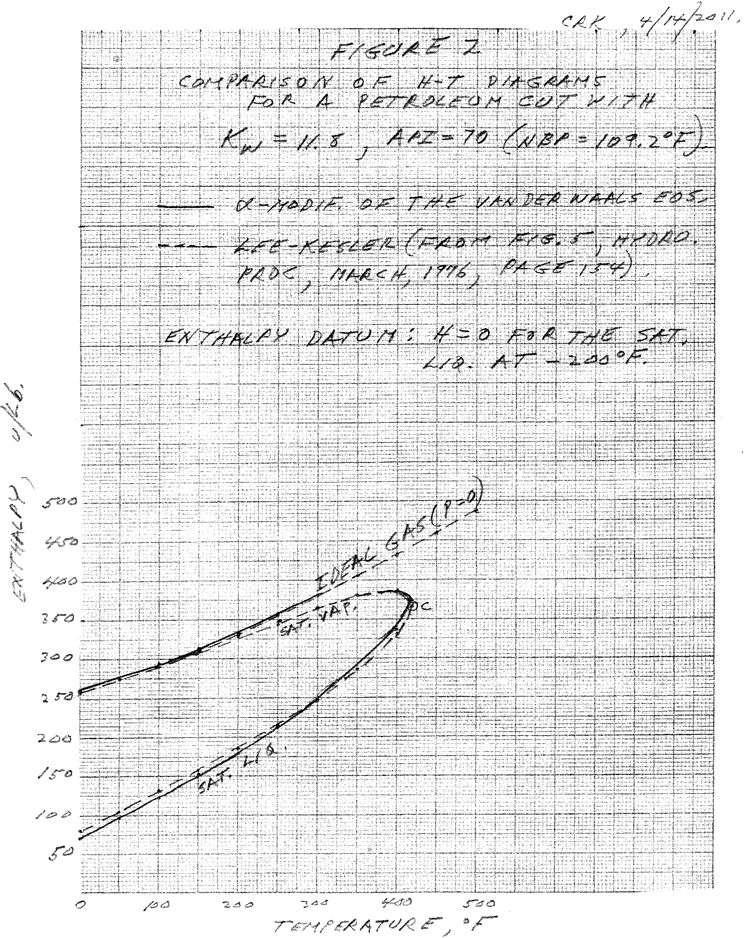
17 -17- Figure 5, Page 154, of the Lee-Kesler paper (7) gives the H-T diagram for the same petroleum cut as shown on Figure 1 (K w = 11.8, API = 70). For the sake of comparison, we superimposed the H-T plot from our work here (modif. VDW eqn.) with that of Lee and Kesler. This comparison is shown graphically on Figure 2. The enthalpy datum for both sets of curves here is the same as employed by Lee and Kesler, namely H = 0 for the saturated liquid state at 200 deg. F. The ideal gas and saturated vapor curves agree quite well with one another. The saturated liquid curves intersect at around 300 deg. F. Below 300 deg. F the Lee-Kesler liquid curve is as much as 9 Btu/Lb higher than the modified VDW curve. Above 300 deg. F the Lee-Kesler liquid curve lies as much as 8 Btu/Lb below the corresponding liquid curve generated from the modified VDW equation. In addition, we used program MVDWPFH.BAS to generate H-T charts for K w = 11.8 at API liquid gravity values of 50 and 30 respectively. These charts appear as the attached Figures 3 and 4 and are based on the 1000 Btu/Lb ideal gas datum. Original VDW Eqn. Before concluding this discussion, it is imperative that we show the improvement that is achieved by using the alpha-modif. of the VDW equation as opposed to using the original equation of state for the prediction of petroleum fraction enthalpies. In Table 3 we show a brief comparison of both sets of predicted enthalpy traverses against the data of Lenoir and Hipkin (13) for the Alaska naphtha at a single pressure of 30 psia. The overall average trends and absolute average deviations are summarized below for a total of 18 points tested: Equation Overall Trend, % Overall Abs. Avg. Dev., % Alpha-Modif. VDW EOS Original VDW EOS For this brief comparison, the improvement in prediction accuracy is rather obvious. Similar results would be expected for any of the other petroleum fraction cuts.
18 -18- Assessment of Critical Constants In the BASIC programs (Appendices I and II) used to calculate petroleum fraction vapor pressures and enthalpies we used the Lee-Kesler (7) correlations (Eqns ) for calculating the required critical constants, molecular weight and acentric factor. Lenoir and Hipkin (13) report critical properties and molecular weights for five naphthas and three gas oils. The critical properties of the Alaska naphtha were measured by Prof. W. B. Kay at the Ohio State University. The critical constants for the jet naphtha and low-boiling naphtha were established from the enthalpy measurements. The other tabulated critical properties represented estimates by using the procedures in the Data Book of the American Petroleum Institute (API). For the sake of completeness of our study here, we compared critical properties and molecular weights predicted by the Lee-Kesler correlations against the corresponding values reported by Lenoir and Hipkin for the eight hydrocarbon fractions. The results of this comparison are shown in Table 4. The overall trends in the predictions are briefly summarized below: Mol. Wt. Crit. Temp. Crit. Press. No. of Pts Overall Trend, % Although the prediction accuracy for the critical pressure is rather marginal, the impact on the prediction accuracy for the vapor pressure and liquid/vapor enthalpies did not appear to be significant. In Conclusion The principle advantage of using an equation of state such as our proposed alpha-modif. VDW equation is that it can be conveniently used to generate an H-T plot for any petroleum fraction characterized by a given K w and API gravity (or NBP) with accuracy that is reasonably commensurate with the Lee-Kesler charts.
19 -19- List of References 1. Koppany, C. R., Prediction of Saturated Liquid Volumes from a Modified van der Waals Equation, Part 1 (2010). 2. Koppany, C.R., Prediction of Saturated Liquid Volumes from a Modified van der Waals Equation, Part 2 (2020). 3. Koppany, C.R., Prediction of Vapor Pressures and Mixture VLE from a Modification of the van der Waals Equation, Part 3 ( ). 4. Soave, G., Chem. Engr. Sci., Vol. 27, No. 6-A (1972) Page Prausnitz, J.M. and Chueh, P.L., Computer Calculations for High-Pressure Vapor-Liquid Equilibria, Prentice-Hall, Inc. (1968). 6. Johnson, R.L. and Grayson, H.G., Petroleum Refiner, Vol. 40, No. 2, (Feb. 1961) Page Kesler, M.G. and Lee, B.I., Hydrocarbon Processing, Vol. 55, No. 3, (March 1976) Page Bauer, C.R. and Middleton, J.F., Petroleum Refiner, Vol. 32, No. 1, (1953) Page Watson, K.M. and Nelson, E.F., Ind. Engr. Chem.. Vol. 25 (1933), Page Kesler. M.G. and Lee, B.I., AIChE Journ., Vol. 21, No. 3, (May, 1975), Page Edmister, W.C., Applied Hydrocarbon Thermo., Petrol. Refiner, Vol. 37 No. 4 (April, 1958). 12. Lenoir, J.M. and Hipkin, H.G., Hydrocarbon Processing (May, 1971) Page Lenoir, J.M. and Hipkin, H.G., Journal of Chem. and Engr. Data, Vol. 18 No. 2 (1973) Page 195.
20 TABLE 1 This spreadsheet compares experimental petroleum fraction enthalpy traverses against the corrersponding predictions from the alpha-modification of the van der Waals EOS *** Exper. Modif. VDW Abs. Petroleum Temp. Press. Delta-H* Delta-H* Dev** Dev Cut F Psia Phase Btu/Lb Btu/Lb Btu/Lb Btu/Lb Alaska L Naphtha L L VABP BP 30 L F DP 30 V V V Deg API V V V V V V V V V V V L L L BP 100 L DP 100 V V V V V V V V V V V L L L BP 400 L DP 400 V V V Continued on next page
21 TABLE 1 (continued) L L L L L L L L L L L L L L L L L L L L L L L L L L L L L L L N = 71 Overall Trend = -0.5 Abs. Avg. Dev. = 2.8 * Delta-H from 75 F (liquid) to specified temperature T, all at fixed system pressure, Btu/Lb. ** Dev. = Delta-H (Modif. VDW) - Delta-H Exper. In Btu/Lb. *** Experimental data from Lenoir and Hipkin, Jr. Chem. Engr. Data,
22 TABLE 2 This spreadsheet compares experimental petroleum fraction enthalpy traverses against the corrersponding predictions from the alpha-modification of the van der Waals EOS *** Exper. Modif. VDW Abs. Petroleum Temp. Press. Delta-H* Delta-H* Dev** Dev Cut F Psia Phase Btu/Lb Btu/Lb Btu/Lb Btu/Lb Gas Oil L L VABP L F L L L Deg API L L L L L L L L L L L L L L L L L L L L L L L L L L L L L L L L L L L L L L L L Continued on next page
23 TABLE 2 (continued) L L L L L L L L L L L L L L L L L L L L L L L L N = 70 Overall Trend = -3.1 Abs. Avg. Dev. = 3.1 *Delta-H from 75 F (liquid) to the specified temperature T, all at fixed system pressure, Btu/Lb. ** Dev. = Delta-H (Modif. VDW) - Delta-H Exper., Btu/Lb. *** Experimental data from Lenoir and Hipkin, Jr. Chem. Engr. Data, Vol. 18, No. 2, 1973 (Page 195)
24 TABLE 3 This spreadsheet compares experimental petroleum fraction enthalpy traverses against the corrersponding predictions from the alpha-modification of the van der Waals EOS Sheet 1(3) File: MODVWPFH.XLS *** Exper. Modif. VDW Abs. Orig, VDW Abs. Petroleum Temp. Press. Delta-H* Delta-H* Dev** Dev Delta-H* Dev Dev Cut F Psia Phase Btu/Lb Btu/Lb Btu/Lb Btu/Lb Btu/Lb Btu/Lb Btu/Lb Alaska L Naphtha L L VABP BP 30 L F DP 30 V V V Deg API V V V V V V V V V V V N=18 Overall Trend, % Abs Avg Dev, % * Delta-H from 75 F (liquid) to specified temperature T, all at fixed system pressure, Btu/Lb. ** Dev. = Delta-H (Modif. VDW) - Delta-H Exper. In Btu/Lb. *** Experimental data from Lenoir and Hipkin, Jr. Chem. Engr. Data, Vol. 18, No. 2, 1973 (Page 195)
25 TABLE 4 Comparison of Molecular Weights and Critical Properties Predicted from the Lee-Kesler Correlations Against the Data of Lenoir and Hipkin (12,13) Ref: Two publications by J. M. Lenoir and H. G. Hipkin, "Light Naphtha Enthalpy Measured", Hydrocarbon Processing, May 1971, Page 95; "Measured Enthalpies Of Eight Hydrocarbon Fractions"; Journal of Chemical and Engineering Data, Vol. 18, No. 2, 1973, Page 195. Petroleum * * * Fraction VABP API Watson Molecular Weight Critical Temp. F Critical Press, Psia Description Deg F Gravity Factor Meas. Pred. % Dev Meas. Pred. % Dev Meas. Pred. % Dev Light Naphtha Alaska Naphtha Jet Naphtha Aromatic Naphtha Low-boiling Naphtha High-boiling Naphtha Kerosine Fuel Oil Gas Oil Trend= * Predicted molecular weight and critical properties from the correlations of Lee and Kesler (7). See Equations of the text (Pages 7-8).

26
27

28

29
30
31
32
33
34
35
PREDICTION OF SATURATED LIQUID VOLUMES FROM A MODIFIED VAN DER WAALS EQUATION. By Charles R. Koppany
 PREDICTION OF SATURATED LIQUID VOLUMES FROM A MODIFIED VAN DER WAALS EQUATION Part 1 By Charles R. Koppany Introduction Over the past 40 years or so, closed cubic (in volume) equations of state have been
PREDICTION OF VAPOR PRESSURES AND MIXTURE VLE FROM A SECOND MODIFICATION OF THE VAN DER WAALS EQUATION. Part 3
 PREDICTION OF VAPOR PRESSURES AND MIXTURE VLE FROM A SECOND MODIFICATION OF THE VAN DER WAALS EQUATION Part 3 Review In the first two papers (1,2) in this series, we developed and tested a 3-parameter
Characterization & properties estimation of crude oil and petroleum products
 Chapter 4 Characterization & properties estimation of crude oil and petroleum products Introduction There is no analytical technique available to determine (either quantitatively or quantitatively) all
P1: IML/FFX P2: IML/FFX QC: IML/FFX T1: IML AT029-FM AT029-Manual AT029-Manual-v8.cls December 11, :59. Contents
 Contents Foreword Preface xvii xix Chapter 1 Introduction 1 Nomenclature 1 1.1 Nature of Petroleum Fluids 1 1.1.1 Hydrocarbons 3 1.1.2 Reservoir Fluids and Crude Oil 5 1.1.3 Petroleum Fractions and Products
ISENTHALPIC THROTTLING (FREE EXPANSION) AND THE JOULE-THOMSON COEFFICIENT
 AND THE JOULE-THOMSON COEFFICIENT") ISENTHALPIC THROTTLING (FREE EXPANSION) AND THE JOULE-THOMSON COEFFICIENT Charles R. Koppany, PhD, Chem. Eng. January, 014 ISENTHALPIC THROTTLING (FREE EXPANSION) AND THE JOULE-THOMSON COEFFICIENT This
ISENTHALPIC THROTTLING (FREE EXPANSION) AND THE JOULE-THOMSON COEFFICIENT Charles R. Koppany, PhD, Chem. Eng. January, 014 ISENTHALPIC THROTTLING (FREE EXPANSION) AND THE JOULE-THOMSON COEFFICIENT This
Equations of State. Equations of State (EoS)
") Equations of State (EoS) Equations of State From molecular considerations, identify which intermolecular interactions are significant (including estimating relative strengths of dipole moments, polarizability,
Equations of State (EoS) Equations of State From molecular considerations, identify which intermolecular interactions are significant (including estimating relative strengths of dipole moments, polarizability,
Predict Isothermal Bulk Modulus Values For Liquid Hydrocarbons With More Certainty. Background Of the Paper
 Predict Isothermal Bulk Modulus Values For Liquid Hydrocarbons With More Certainty Background Of the Paper All fluids are compressible under the application of pressure. The degree or extent of compressibility
PETE 310 Lectures # 36 to 37
 PETE 310 Lectures # 36 to 37 Cubic Equations of State Last Lectures Instructional Objectives Know the data needed in the EOS to evaluate fluid properties Know how to use the EOS for single and for multicomponent
"Energy Applications: Impact of Data and Models"
 "Energy Applications: Impact of Data and Models" Energy Applications refers in this particular case to the wide application of equations of state upstream in the Production of Oil and Gas. The petroleum
CALCULATION OF THE COMPRESSIBILITY FACTOR AND FUGACITY IN OIL-GAS SYSTEMS USING CUBIC EQUATIONS OF STATE
 CALCULATION OF THE COMPRESSIBILITY FACTOR AND FUGACITY IN OIL-GAS SYSTEMS USING CUBIC EQUATIONS OF STATE V. P. de MATOS MARTINS 1, A. M. BARBOSA NETO 1, A. C. BANNWART 1 1 University of Campinas, Mechanical
A Generalized Correlation for Pool Boiling Heat Transfer Coefficient Based on Corresponding State Rule for Pure Compounds and Binary Mixtures
 A Generalized Correlation for Pool Boiling Heat Transfer Coefficient Based on Corresponding State Rule for Pure Compounds and Binary Mixtures HASAN QABAZARD and MAHMOOD MOSHFEGHIAN 1 Petroleum Research
Select the Right Hydrocarbon Molecular Weight Correlation
 Select the Right Hydrocarbon Molecular Weight Correlation By Donald F. Schneider, P.E. Chemical Engineer Stratus Engineering, Inc. PMB 339 2951 Marina Bay Drive #130 League City, Texas 77573 (281) 335-7138
Hydrocarbon Components and Physical Properties Core COPYRIGHT. Basic Terminology
 3/7/2017 Learning Objectives Hydrocarbon Components and Physical Properties Core Basic Terminology By the end of this lesson, you you will will be be able able to: to: Describe the concept of atomic mass,
Chapter 10. Vapor/Liquid Equilibrium: Introduction
 Chapter 10 Vapor/Liquid Equilibrium: Introduction Preceding chapters have dealt largely with pure substances or with constant-composition mixtures. e.g., air. However, composition changes are the desired
New correlation for hydrogen-natural gas mixture compressibility factor
 New correlation for hydrogen-natural gas mixture compressibility factor Zahreddine Hafsi 1, Sami Elaoud 2, Mohsen Akrout, Ezzeddine Hadj Taïeb Laboratory of Applied Fluids Mechanics Process and Environment
Chapter 3 PROPERTIES OF PURE SUBSTANCES
 Thermodynamics: An Engineering Approach Seventh Edition in SI Units Yunus A. Cengel, Michael A. Boles McGraw-Hill, 2011 Chapter 3 PROPERTIES OF PURE SUBSTANCES Copyright The McGraw-Hill Companies, Inc.
Reservoir Eng FOB :18 Page i Second Edition
 Second Edition C H A P T E R 1 FUNDAMENTALS OF RESERVOIR FLUID BEHAVIOR Naturally occurring hydrocarbon systems found in petroleum reservoirs are mixtures of organic compounds which exhibit multiphase
PVTpetro: A COMPUTATIONAL TOOL FOR ISOTHERM TWO- PHASE PT-FLASH CALCULATION IN OIL-GAS SYSTEMS
 PVTpetro: A COMPUTATIONAL TOOL FOR ISOTHERM TWO- PHASE PT-FLASH CALCULATION IN OIL-GAS SYSTEMS A. M. BARBOSA NETO 1, A. C. BANNWART 1 1 University of Campinas, Mechanical Engineering Faculty, Energy Department
Chapter 3 PROPERTIES OF PURE SUBSTANCES
 Thermodynamics: An Engineering Approach Seventh Edition Yunus A. Cengel, Michael A. Boles McGraw-Hill, 2011 Chapter 3 PROPERTIES OF PURE SUBSTANCES Copyright The McGraw-Hill Companies, Inc. Permission
All rights reserved. Armando B. Corripio, PhD, PE Flash Distillation Flash Drum Variables and Specifications... 2
 Flash Distillation All rights reserved. Armando B. Corripio, PhD, PE. 2013 Contents Flash Distillation... 1 1 Flash Drum Variables and Specifications... 2 2 Flash Drum Balances and Equations... 4 2.1 Equilibrium
SIMULIS THERMODYNAMICS
 2007 AIChE Annual Meeting Salt Lake City, Utah #459e CAPE-OPEN Thermodynamic & Physical Properties Interface (TD002) SIMULIS THERMODYNAMICS A CAPE-OPEN COMPLIANT FRAMEWORK FOR USERS AND DEVELOPERS Olivier
PROPERTIES OF PURE SUBSTANCES. Chapter 3. Mehmet Kanoglu. Thermodynamics: An Engineering Approach, 6 th Edition. Yunus A. Cengel, Michael A.
 Thermodynamics: An Engineering Approach, 6 th Edition Yunus A. Cengel, Michael A. Boles McGraw-Hill, 2008 Chapter 3 PROPERTIES OF PURE SUBSTANCES Mehmet Kanoglu Copyright The McGraw-Hill Companies, Inc.
A User-Friendly Software for Computations of Vapor Compression Cycles with Pure Fluids and Zeotropic Mixtures
 Purdue University Purdue e-pubs International Refrigeration and Air Conditioning Conference School of Mechanical Engineering 1996 A User-Friendly Software for Computations of Vapor Compression Cycles with
On the Boyle temperature
 Indian Journal of Chemical Technology Vol. 1, September 1994, pp. 261-265 On the Boyle temperature Jaime Wisniak Department of Chemical Engineering, Ben-Gurion University of the Negev. Beer-Sheva. Israel
ChBE BIBLE. Robert A. Pinnick. 28 April 2006
 ChBE BIBLE Robert A. Pinnick 28 April 2006 Contents 1 Thermodynamics 2 1.1 Equations of State....................................... 2 1.1.1 Ideal Gas Law..................................... 3 1.1.2 Cubic
Chapter 3 PROPERTIES OF PURE SUBSTANCES SUMMARY
 Chapter 3 PROPERTIES OF PURE SUBSTANCES SUMMARY PURE SUBSTANCE Pure substance: A substance that has a fixed chemical composition throughout. Compressed liquid (sub-cooled liquid): A substance that it is
Thermophysical Properties of Ethane from Cubic Equations of State
 Thermophysical Properties of Ethane from Cubic Equations of State MIHAELA NOUR, DANIELA DUNA, MIRELA IONITA, VIOREL FEROIU *, DAN GEANA Politehnica University Bucharest, Department of Inorganic Chemistry,
Thermodynamics I. Properties of Pure Substances
 Thermodynamics I Properties of Pure Substances Dr.-Eng. Zayed Al-Hamamre 1 Content Pure substance Phases of a pure substance Phase-change processes of pure substances o Compressed liquid, Saturated liquid,
THERMODYNAMIC BEHAVIOR OF HYDROGEN/NATURAL GAS MIXTURES
 THERMODYNAMIC BEHAVIOR OF HYDROGEN/NATURAL GAS MIXTURES by R. R. Agahi, B. Ershaghi, M. C. Lin and G. A. Mansoori (*) PROCEEDINGS OF THE ANNUAL CONVENTION GAS PROCESSORS ASSOCIATION 1995, ISSUE 74, pages
FUNDAMENTALS OF THERMODYNAMICS
 FUNDAMENTALS OF THERMODYNAMICS SEVENTH EDITION CLAUS BORGNAKKE RICHARD E. SONNTAG University of Michigan John Wiley & Sons, Inc. Chemical Reactions 15 Many thermodynamic problems involve chemical reactions.
Chapter 3 PROPERTIES OF PURE SUBSTANCES
 Chapter 3 PROPERTIES OF PURE SUBSTANCES PURE SUBSTANCE Pure substance: A substance that has a fixed chemical composition throughout. Air is a mixture of several gases, but it is considered to be a pure
We are IntechOpen, the world s leading publisher of Open Access books Built by scientists, for scientists. International authors and editors
 We are IntechOpen, the world s leading publisher of Open Access books Built by scientists, for scientists 4,100 116,000 120M Open access books available International authors and editors Downloads Our
Equation of state. Contents. Overview. Historical. Boyle's law (1662)
") Equation of state From Wikipedia, the free encyclopedia For the use of this concept in cosmology, see Equation of state (cosmology) In physics and thermodynamics, an equation of state is a relation between
Equation of state From Wikipedia, the free encyclopedia For the use of this concept in cosmology, see Equation of state (cosmology) In physics and thermodynamics, an equation of state is a relation between
Overall: 75 ECTS: 7.0
 Course: Chemical Engineering Thermodynamics Language: English Lecturer: Prof. dr. sc. Marko Rogošić TEACHING WEEKLY SEMESTER Lectures 3 45 Laboratory 1 15 Seminar 1 15 Overall: 75 ECTS: 7.0 PURPOSE: Within
Basic Thermodynamics Module 1
 Basic Thermodynamics Module 1 Lecture 9: Thermodynamic Properties of Fluids Thermodynamic Properties of fluids Most useful properties: Properties like pressure, volume and temperature which can be measured
A generalized set of correlations for plus fraction characterization
 370 Pet.Sci.(01)9:370-378 DOI 10.1007/s118-01-01-x A generalized set of correlations for plus fraction characterization JAMIALAHMADI Mohamad 1, ZANGENEH Hossein and HOSSEINI Seyed Sajad 1 Petroleum Engineering
USE OF EQUATIONS OF STATE (EOS) SOFTWARE. Donald P. Mayeaux. President A+ Corporation, LLC Black Bayou Rd. Gonzales, LA USA
 SOFTWARE. Donald P. Mayeaux. President A+ Corporation, LLC Black Bayou Rd. Gonzales, LA USA") USE OF EQUATIONS OF STATE (EOS) SOFTWARE Donald P. Mayeaux President A+ Corporation, LLC 41041 Black Bayou Rd. Gonzales, LA USA Introduction Proper sample conditioning is essential to providing a representative
USE OF EQUATIONS OF STATE (EOS) SOFTWARE Donald P. Mayeaux President A+ Corporation, LLC 41041 Black Bayou Rd. Gonzales, LA USA Introduction Proper sample conditioning is essential to providing a representative
Course Name: Thermodynamics for Chemical Engineers
 Instructor Information CM3230 Thermodynamics for Chemical Engineers College of Engineering Fall 2011 Instructor: Dr. Tom Co, Associate Professor Office Location: 202G ChemSci Building Telephone: Office
Bexp. The temperature validity range of this second equation is relatively small. () 8
 8") Chapter 3 From Components to Models 121 Another classic formulation for the second virial coefficient is given by (Ambrose [44, 45]): C BT ( ) = A+ Bexp (3.35) T The temperature validity range of this
Chapter 3 From Components to Models 121 Another classic formulation for the second virial coefficient is given by (Ambrose [44, 45]): C BT ( ) = A+ Bexp (3.35) T The temperature validity range of this
Thermodynamic Properties of Refrigerant R116 from Cubic Equations of State
 Thermodynamic Properties of Refrigerant R116 from Cubic Equations of State DANIELA DUNA, MIRELA IONITA, VIOREL FEROIU *, DAN GEANA Politehnica University Bucharest, Department of Applied Physical Chemistry
Thermodynamic Properties
 Thermodynamic Properties (TP) Thermodynamic Properties Define and articulate some of the critical language and concepts of Thermodynamics Distinguish between the universe, system, surroundings, and boundary
EXTENDED SMOKER S EQUATION FOR CALCULATING NUMBER OF STAGES IN DISTILLATION
 EXTENDED SMOKER S EQUATION FOR CALCULATING NUMBER OF STAGES IN DISTILLATION Santanu Bandyopadhyay Energy Systems Engineering and Department of Mechanical Engineering, Indian Institute of Technology, Bombay,
For an incompressible β and k = 0, Equations (6.28) and (6.29) become:
 and (6.29) become:") Internal Energy and Entropy as Functions of T and V These are general equations relating the internal energy and entropy of homogeneous fluids of constant composition to temperature and volume. Equation
Internal Energy and Entropy as Functions of T and V These are general equations relating the internal energy and entropy of homogeneous fluids of constant composition to temperature and volume. Equation
ADSORPTION IN MICROPOROUS MATERIALS: ANALYTICAL EQUATIONS FOR TYPE I ISOTHERMS AT HIGH PRESSURE
 ADSORPTION IN MICROPOROUS MATERIALS: ANALYTICAL EQUATIONS FOR TYPE I ISOTHERMS AT HIGH PRESSURE A. L. MYERS Department of Chemical and Biomolecular Engineering University of Pennsylvania, Philadelphia
Name: Discussion Section:
 CBE 141: Chemical Engineering Thermodynamics, Spring 2017, UC Berkeley Midterm 2 FORM A March 23, 2017 Time: 80 minutes, closed-book and closed-notes, one-sided 8 ½ x 11 equation sheet allowed Please show
CHAPTER. Properties of Pure Substances
 CHAPTER 2 Properties of Pure Substances A Pure Substance Is a substance that is chemically homogenous and fixed in chemical composition.(e.g. water, nitrogen, air & etc.) mixture of oil and water is not
Status and results of group contribution methods
 Pure & Appl. Cbem., Vol. 65, No. 5, pp. 919926, 1993. Printed in Great Britain. @ 1993 IUPAC Status and results of group contribution methods J. Gmehling, K. Fischer, J. Li, M. Schiller Universitat Oldenburg,
A New Two-Constant Equation of State
 Palmer, H. J., Berg, J. C., J. FIuidMech., 51, 385 (1972). Palmer, H. J.. Berg, J. C., A./.Ch.. J., 19, 1082 (1973). Plevan, R. E., Quinn, J. A,. A./.Ch.. J., 12, 894 (1966). Rhodes, F. H.. Bridges, C.
A Corresponding States Model for Generalized Engineering Equations of State
 International Journal of Thermophysics, Vol. 26, No. 3, May 2005 ( 2005) DOI: 10.1007/s10765-005-5573-7 A Corresponding States Model for Generalized Engineering Equations of State L. Sun 1,2 and J. F.
Use of the GERG-2008 Equation of State for Hydrocarbon Dew Point Calculation
 Use of the GERG-2008 Equation of State for Hydrocarbon Dew Point Calculation Andrew Laughton, DNV GL (Oil & Gas), Loughborough UK andrew.laughton@dnvgl.com American Gas Association Operations Conference,
Thermodynamics I Chapter 2 Properties of Pure Substances
 Thermodynamics I Chapter 2 Properties of Pure Substances Mohsin Mohd Sies Fakulti Kejuruteraan Mekanikal, Universiti Teknologi Malaysia Properties of Pure Substances (Motivation) To quantify the changes
P(N,V,T) = NRT V. = P(N,V,T) dv
 = NRT V. = P(N,V,T) dv") CHEM-443, Fall 2016, Section 010 Student Name Quiz 1 09/09/2016 Directions: Please answer each question to the best of your ability. Make sure your response is legible, precise, includes relevant dimensional
CHEM-443, Fall 2016, Section 010 Student Name Quiz 1 09/09/2016 Directions: Please answer each question to the best of your ability. Make sure your response is legible, precise, includes relevant dimensional
THERMODYNAMIC CONSISTENCY TESTS FOR PHASE EQUILIBRIUM IN LIQUID SOLUTE+SUPERCRITICAL SOLVENT MIXTURES
 THERMODYNAMIC CONSISTENCY TESTS FOR PHASE EQUILIBRIUM IN LIQUID SOLUTE+SUPERCRITICAL SOLVENT MIXTURES José O. Valderrama 1, and Víctor H. Alvarez 1 Fac. de Ingeniería, Depto. Ing. Mecánica, Univ. de la
Accuracy of vapour ^ liquid critical points computed from cubic equations of state
 High Temperatures ^ High Pressures 2000 volume 32 pages 449 ^ 459 15 ECTP Proceedings pages 433 ^ 443 DOI:10.1068/htwu303 Accuracy of vapour ^ liquid critical points computed from cubic equations of state
Name: Discussion Section:
 CBE 141: Chemical Engineering Thermodynamics, Spring 2017, UC Berkeley Midterm 2 FORM B March 23, 2017 Time: 80 minutes, closed-book and closed-notes, one-sided 8 ½ x 11 equation sheet allowed lease show
Optimization of the Sulfolane Extraction Plant Based on Modeling and Simulation
 Korean J. Chem. Eng., 17(6), 712-718 (2000) Optimization of the Sulfolane Extraction Plant Based on Modeling and Simulation Yu-Jung Choi, Tae-In Kwon and Yeong-Koo Yeo Department of Chemical Engineering,
Index to Tables in SI Units
 Index to Tables in SI Units Table A-1 Atomic or Molecular Weights and Critical Properties of Selected Elements and Compounds 926 Table A-2 Properties of Saturated Water (Liquid Vapor): Temperature Table
Review of differential and integral calculus and introduction to multivariate differential calculus.
 Chemistry 2301 Introduction: Review of terminology used in thermodynamics Review of differential and integral calculus and introduction to multivariate differential calculus. The properties of real gases:
Mathematical Method for Evaluating Heat Capacity Ratio and Joule-Thompson Coefficient for Real Gases
 Mathematical Method for Evaluating Heat Capacity Ratio and Joule-Thompson Coefficient for Real Gases Wordu, A. A, Ojong, O. E Department of Chemical/Petrochemical Engineering University of Science and
Peng-Robinson Equation of State Predictions for Gas Condensate Before and After Lumping
 Advances in Petroleum Exploration and Development Vol. 2, No. 2, 2011, pp. 41-46 DOI:10.3968/ j.aped.1925543820110202.105 ISSN 1925-542X[Print] ISSN 1925-5438[Online] www.cscanada.net www.cscanada.org
Chemistry 11. Unit 11 Ideal Gas Law (Special Topic)
") Chemistry 11 Unit 11 Ideal Gas Law (Special Topic) 2 1. States of substances It has been studied in Unit 3 that there exist 3 states of matter in nature: gas, liquid and solid. (Technically there is the
Chemistry 11 Unit 11 Ideal Gas Law (Special Topic) 2 1. States of substances It has been studied in Unit 3 that there exist 3 states of matter in nature: gas, liquid and solid. (Technically there is the
MODELING OF PHASE EQUILIBRIA FOR BINARY AND TERNARY MIXTURES OF CARBON DIOXIDE, HYDROGEN AND METHANOL
 MODELING OF PHASE EQUILIBRIA FOR BINARY AND TERNARY MIXTURES OF CARBON DIOXIDE, HYDROGEN AND METHANOL Neil R. Foster *, Keivan Bezanehtak, Fariba Dehghani School of Chemical Engineering and Industrial
Vapor liquid equilibria of carbon dioxide with diethyl oxalate, ethyl laurate, and dibutyl phthalate binary mixtures at elevated pressures
 Fluid Phase Equilibria 181 (2001) 1 16 Vapor liquid equilibria of carbon dioxide with diethyl oxalate, ethyl laurate, and dibutyl phthalate binary mixtures at elevated pressures Kong-Wei Cheng, Muoi Tang
12. Petroleum Calculations
 12. Petroleum Calculations Overview Calculations with the OLI Software can be used to characterize crude oils. Here is a quote from the OLI Tricks of the Trade manual (AQSim) Crude oils are complex groups
A Method of Estimating the Refractive Index of Hydrocarbons in Coal Derived liquids by a Group Contribution Method
 [Regular Paper] A Method of Estimating the Refractive Index of Hydrocarbons in Coal Derived liquids by a Group Contribution Method Masaaki SATOU*, Hiroki YAMAGUCHI, Toshimitsu MURAI, Susumu YOKOYAMA, and
ChemSep Tutorial: Distillation with Hypothetical Components
 ChemSep Tutorial: Distillation with Hypothetical Components Harry Kooijman and Ross Taylor Here we use ChemSep to solve a complex multicomponent distillation problem presented in a paper entitled Multistage
Preliminary Evaluation of the SPUNG Equation of State for Modelling the Thermodynamic Properties of CO 2 Water Mixtures
 Available online at www.sciencedirect.com Energy Procedia 26 (2012 ) 90 97 2 nd Trondheim Gas Technology Conference Preliminary Evaluation of the SPUNG Equation of State for Modelling the Thermodynamic
Thermodynamic ProperDes for Fluids
 SKF2213: CHEMICAL ENGINEERING THERMODYNAMICS Thermodynamic roperdes for Fluids Mohammad Fadil Abdul Wahab ObjecDves To develop fundamental property relations (FR) of U,H,S,G,A,V,,T from 1st and 2nd Law
THE PROPERTIES OF GASES AND LIQUIDS
 THE PROPERTIES OF GASES AND LIQUIDS Bruce E. Poling University of Toledo John M. Prausnitz University of California at Berkeley John P. O'Connell University of Virginia Fifth Edition McGRAW-HILL New York
is more suitable for a quantitative description of the deviation from ideal gas behaviour.
 Real and ideal gases (1) Gases which obey gas laws or ideal gas equation ( PV nrt ) at all temperatures and pressures are called ideal or perfect gases. Almost all gases deviate from the ideal behaviour
Predictive Equation of State
 Predictive Equation of State Vapor-liquid Equilibria, Gas Solubilities, Excess Enthalpies and Phase Flash Calculations PSRK Predictive Soave-Redlich-Kwong VTPR Volume-Translated Peng-Robinson DDBSP Dortmund
Modelling the Solubility of Solid Aromatic Compounds in Supercritical Fluids
 Modelling the Solubility of Solid Aromatic Compounds in Supercritical Fluids VIOREL FEROIU*, OCTAVIAN PARTENIE, DAN GEANA Politehnica University of Bucharest, Department of Applied Physical Chemistry and
LECTURE 4 Variation of enthalpy with temperature
 LECTURE 4 Variation of enthalpy with temperature So far, we can only work at 25 C. Like c v we define a constant pressure heat capacity, c p, as the amount of heat energy needed to raise the temperature
Yutaek Seo. Subsea Engineering
 Yutaek Seo Subsea Engineering Fluid characterization Fluid characterization Bottom hole sampling DST Separator analysis Constituents of reservoir fluids Defined components TBP fractions TBP residue Defined
Chapter 2: The Physical Properties of Pure Compounds
 Chapter 2: The Physical Properties of Pure Compounds 2-10. The boiler is an important unit operation in the Rankine cycle. This problem further explores the phenomenon of boiling. A. When you are heating
Adam G. Hawley Darin L. George. Southwest Research Institute 6220 Culebra Road San Antonio, TX 78238
 USE OF EQUATIONS OF STATE AND EQUATION OF STATE SOFTWARE PACKAGES Adam G. Hawley Darin L. George Southwest Research Institute 6220 Culebra Road San Antonio, TX 78238 Introduction Determination of fluid
Aggregate Models based on Improved Group Methods for Simulation and Optimization of Distillation Systems
 Aggregate Models based on Improved Group Methods for Simulation and Optimization of Distillation Systems Ravindra S. Kamath 1, Ignacio E. Grossmann 1,*, and Lorenz T. Biegler 1 1 Chemical Engineering Department,
EQUATION OF STATE DEVELOPMENT
 EQUATION OF STATE DEVELOPMENT I. Nieuwoudt* & M du Rand Institute for Thermal Separation Technology, Department of Chemical Engineering, University of Stellenbosch, Private bag X1, Matieland, 760, South
Analyzing solubility of acid gas and light alkanes in triethylene glycol
 From the SelectedWorks of ali ali 208 Analyzing solubility of acid gas and light alkanes in triethylene glycol ali ali Available at: https://works.bepress.com/bahadori/8/ Journal of Natural Gas Chemistry
A Simple Continuous Mixture Droplet Evaporation Model with Multiple Distribution Functions
 Introduction A Simple Continuous Mixture Droplet Evaporation Model with Multiple Distribution Functions William Hallett and Claire Grimwood Dept. of Mechanical Engineering, University of Ottawa, Ottawa,
Chemical Engineering Thermodynamics Spring 2002
 10.213 Chemical Engineering Thermodynamics Spring 2002 Test 2 Solution Problem 1 (35 points) High pressure steam (stream 1) at a rate of 1000 kg/h initially at 3.5 MPa and 350 ºC is expanded in a turbine
Introduction: Introduction. material is transferred from one phase (gas, liquid, or solid) into another.
 into another.") Introduction: Virtually all commercial chemical processes involve operations in which material is transferred from one phase (gas, liquid, or solid) into another. rewing a cup of Coffee (Leaching) Removal
Introduction: Virtually all commercial chemical processes involve operations in which material is transferred from one phase (gas, liquid, or solid) into another. rewing a cup of Coffee (Leaching) Removal
Introduction to Chemical Engineering Thermodynamics. Chapter 4. KFUPM Housam Binous CHE 303
 Introduction to Chemical Engineering Thermodynamics Chapter 4 1 Sensible heat effects are characterized by temperature changes Experimental measurements provide heat effects of chemical reactions, phase
Prediction of the Liquid Molar Volume and the Latent Heat of Vaporization. for Aliphatic Hydrocarbons by the Group Contribution Method
 Prediction of the Liquid Molar Volume and the Latent Heat of Vaporization for Aliphatic Hydrocarbons by the Group Contribution Method Daisuke HOSHINO* Kunio NAGAHAMA* and Mitsuho HIRATA* vaporization of
CHAPTER SIX THERMODYNAMICS Vapor-Liquid Equilibrium in a Binary System 6.2. Investigation of the Thermodynamic Properties of Pure Water
 CHAPTER SIX THERMODYNAMICS 6.1. Vapor-Liquid Equilibrium in a Binary System 6.2. Investigation of the Thermodynamic Properties of Pure Water 2 6.1. VAPOR-LIQUID EQUILIBRIUM IN A BINARY SYSTEM Keywords:
DEPARTMENT OF CHEMICAL ENGINEERING FACULTY OF ENGINEERING AND TECHNOLOGY SRM UNIVERSITY COURSE PLAN
 DEPARTMENT OF CHEMICAL ENGINEERING FACULTY OF ENGINEERING AND TECHNOLOGY SRM UNIVERSITY COURSE PLAN Course code : CH0217 Course Title : Stoichiometry and Engineering Thermodynamics Semester : III Course
Vapor liquid equilibrium of carbon dioxide with ethyl caproate, ethyl caprylate and ethyl caprate at elevated pressures
 J. of Supercritical Fluids 28 (2004) 1 9 Vapor liquid equilibrium of carbon dioxide with ethyl caproate, ethyl caprylate and ethyl caprate at elevated pressures Weng-Hong Hwu, Jaw-Shin Cheng, Kong-Wei
Vapor-liquid equilibrium
 Vapor-liquid equilibrium From Wikipedia, the free encyclopedia Vapor-liquid equilibrium, abbreviated as VLE by some, is a condition where a liquid and its vapor (gas phase) are in equilibrium with each
Sensible Heat and Enthalpy Calculations
 * Sensible Heat and Enthalpy Calculations Sensible Heat - The amount of heat that must be added when a substance undergoes a change in temperature from 298 K to an elevated temperature without a change
An augmented hard core equation of state generalized in terms of T,, P, and o
 Pure&App/. Chern., Vol. 61, No. 8, pp. 1413-1418, 1989. Printed in Great Britain. 0 1989 IUPAC An augmented hard core equation of state generalized in terms of T,, P, and o 1 2 Hasan Orbey and Juan H.
SPE A Pseudo-Black-Oil Method for Simulating Gas Condensate Reservoirs S.-W. Wang, SPE, and I. Harmawan, SPE, Unocal Indonesia Co.
 SPE 92828 A Pseudo-Black-Oil Method for Simulating Gas Condensate Reservoirs S.-W. Wang, SPE, and I. Harmawan, SPE, Unocal Indonesia Co. Copyright 2005, Society of Petroleum Engineers Inc. This paper was
A NEW COMPUTERIZED APPROACH TO Z-FACTOR DETERMINATION
 August 01 edition vol., No.7 A NEW COMPUTERIZED APPROACH TO Z-FACTOR DETERMINATION Kingdom K. Dune, Engr. Oriji, Bright N, Engr. Dept. of Petroleum Engineering, Rivers State University of Science & Tech.,
Pure Substance. Properties of Pure Substances & Equations of State. Vapour-Liquid-Solid Phase Equilibrium
 Pure Substance Properties of Pure Substances & Equations of State Dr. d. Zahurul Haq Professor Department of echanical Engineering Bangladesh University of Engineering & Technology (BUET) Dhaka-1000, Bangladesh
Sensible Heat and Enthalpy Calculations
 Sensible Heat and Enthalpy Calculations Sensible Heat - The amount of heat that must be added when a substance undergoes a change in temperature from 298 K to an elevated temperature without a change in
The Liquid Vapor Interface
 Howard University Digital Howard @ Howard University Faculty Reprints 4-1-1932 The Liquid Vapor Interface Leon J. Shereshefsky Follow this and additional works at: http://dh.howard.edu/reprints Part of
Name: Discussion Section:
 CBE 141: Chemical Engineering Thermodynamics, Spring 2018, UC Berkeley Midterm 2 March 22, 2018 Time: 80 minutes, closed-book and closed-notes, one-sided 8 ½ x 11 equation sheet allowed Please show all
Phase Separation Degree of Freedom Analysis. Binary Vapor-Liquid Systems. Azeotropic Systems. - Gibbs phase rule F C P 2 -General analysis
 Lecture 5. Single Equilibrium Stages (1) Phase Separation [Ch. 4] Degree of Freedom Analysis - Gibbs phase rule F CP2 -General analysis Binary Vapor-Liquid Systems - Examples of binary system - Phase equilibrium
All Rights Reserved. Armando B. Corripio, PhD, P.E., Multicomponent Distillation Column Specifications... 2
 Multicomponent Distillation All Rights Reserved. Armando B. Corripio, PhD, P.E., 2013 Contents Multicomponent Distillation... 1 1 Column Specifications... 2 1.1 Key Components and Sequencing Columns...
1. (25 points) C 6 H O 2 6CO 2 + 7H 2 O C 6 H O 2 6CO + 7H 2 O
 C 6 H O 2 6CO 2 + 7H 2 O C 6 H O 2 6CO + 7H 2 O") MEEBAL Exam 2 November 2013 Show all work in your blue book. Points will be deducted if steps leading to answers are not shown. No work outside blue books (such as writing on the flow sheets) will be considered.
MEEBAL Exam 2 November 2013 Show all work in your blue book. Points will be deducted if steps leading to answers are not shown. No work outside blue books (such as writing on the flow sheets) will be considered.
PETE 203: Properties of oil
 PETE 203: Properties of oil Prepared by: Mr. Brosk Frya Ali Koya University, Faculty of Engineering, Petroleum Engineering Department 2013 2014 Lecture no. (2): Crude oil chemistry and composition 5. Crude