STAT 215 Confidence and Prediction Intervals in Regression
|
|
|
- Verity Gaines
- 5 years ago
- Views:
Transcription
1 STAT 215 Confidence and Prediction Intervals in Regression Colin Reimer Dawson Oberlin College 24 October 2016
2 Outline Regression Slope Inference Partitioning Variability Prediction Intervals
3 Reminder: Sampling Distributions Sampling Distribution The sampling distribution of a sample statistic (e.g., ˆβ 1 ) for β 1, or Ȳ for µ Y ) is the distribution that statistic has across all possible samples from the population.
4 Sample vs Population Best-Fit Line For a sample: choose intercept and slope to minimize sum of squared errors. But this does not yield the correct (or even best ) model for the population, due to sampling error Wife's Age Husband's Age Population Sample 1 Sample 2 Sample 3 Sample 4
5 Two Methods for Estimating Sampling Distribution of ˆβ 1 1. t-distribution: assumes Normal residuals (along with other regression conditions) 2. Bootstrap distribution: no Normal assumption needed
6 t-distribution model (assumes Normal residuals) If ε N (0, σ ε ), then ˆβ i β i SE ˆβi t n Density ^ (β 1 β1 ) SE ^ β1
7 t-based Confidence Interval where t (1 α/2) n 2 distribution. CI 1 α : ˆβ i ± t (1 α/2) n 2 SE βi (1) represents the 1 α/2 quantile of the t n 2
8 sample.model <- lm(husband ~ Wife, data = sample1) summary(sample.model) Call: lm(formula = Husband ~ Wife, data = sample1) Residuals: Min 1Q Median 3Q Max Coefficients: Estimate Std. Error t value Pr(> t ) (Intercept) Wife e-05 *** --- Signif. codes: 0 '***' '**' 0.01 '*' 0.05 '.' 0.1 ' ' 1 Residual standard error: on 8 degrees of freedom Multiple R-squared: ,Adjusted R-squared: F-statistic: on 1 and 8 DF, p-value: 5.304e-05 MoE.95 <- qt(0.975, df = 8) * (CI.95 <- c( MoE.95, MoE.95)) [1]
9 confint(sample.model, level = 0.95) 2.5 % 97.5 % (Intercept) Wife
10 t-based Hypothesis Test t obs = ˆβ 1 0 SE ˆβ1 (2) where t (1 α/2) n 2 distribution. represents the 1 α/2 quantile of the t n 2
11 Correlation Test and Interval Can also estimate dist. for correlation r using t n 2, where SE r = 1 r 2 n 2 (3) CI 1 α : r ± t (1 α/2) n 2 SE r (4) t obs = r 0 SE r (5)
12 Interpretation of Tests and Intervals 100(1 α)% CI: We are 100(1 α) confident that the population parameter (such as β 1 or ρ) lies in the interval. (Our interval will miss on 100α% of datasets) P -value: The likelihood of a sample (slope / correlation) with a magnitude this large if the population value is zero is P. P small would be too surprising to get such a large value by chance alone Reject H 0
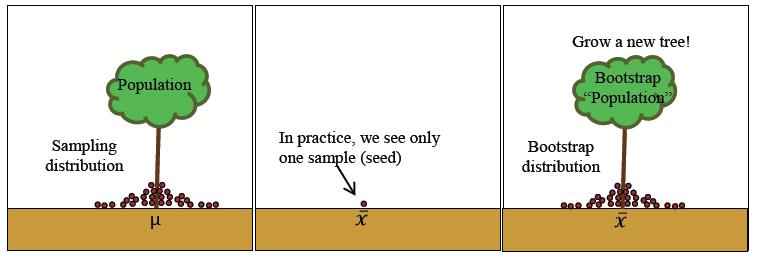
13 Bootstrap Distribution
14 Bootstrap Distribution Figure: Our actual sample Figure: Our simulated population
15 Permutation Test: Slope (or correlation) To test H 0 : β 1 = 0 (or H 0 : ρ = 0), we want probability that a random ˆβ 1 (random r) is as large or larger than observed ˆβ 1 (observed r), assuming H 0 true: β 1 = 0 (ρ = 0). Permutation Test: Slope (Correlation) 1. Simulate H 0 by randomly pairing X and Y values, and computing ˆβ 1 (or r) for each pseudodataset. 2. Repeat many times 3. Calculate proportion of random ˆβ 1 (or r) that exceed actual ˆβ1 (or r). This is the P -value of the test. 4. If P < α for predetermined α, reject H 0.
16 Interpretation of Tests and Intervals Exactly the same as before.
17 ANOVA for Regression DATA = PATTERN + IDIOSYNCRACIES Y = f(x) + ε Total Variation = Explained + Unexplained Y Ȳ = Ŷ Ȳ + Y Ŷ i (Y i Ȳ )2 = i (Ŷi Ȳ )2 +0+ (Y i Ŷi) 2 SST otal = SSM odel + SSError
18 Omnibus F -test for a Regression Model F = SSModel/df Model SSError/df Error = MS Model MS Error This statistic has an F distribution with corresponding df if the null model is correct (i.e., Y = β 0 + ε) brain.model <- lm(log(brain.weight.grams) ~ log(body.weight.kilograms), data = BrainBodyWeight) anova(brain.model) Analysis of Variance Table Response: log(brain.weight.grams) Df Sum Sq Mean Sq F value Pr(>F) log(body.weight.kilograms) < 2.2e-16 *** Residuals Signif. codes: 0 '***' '**' 0.01 '*' 0.05 '.' 0.1 ' ' 1
19 Proportion of Variability Explained The Coefficient of Determination (R 2 ) The coefficient of determination, or R 2 value, associated with a linear model, is the percent reduction in prediction uncertainty achieved by the regression model compared to the null model I.e., what proportion of the variation (variance) in y is explained : R 2 = SSModel (6) SST otal Turns out to just be the square of the correlation! (Show this algebraically)
20 Example: Restaurant Tips library("lock5data"); library("mosaic") data("restauranttips") null.tip.model <- lm(tip ~ 1, data = RestaurantTips) tip.model.using.bill <- lm(tip ~ Bill, data = RestaurantTips) Total Bill ($) Tip ($) null.tip.model tip.model.using.bill
21 Example: Restaurant Tips Tip ($) 0 15 σ^ 2 ε = Residual Tip (Null Model) Frequency 0 30 σ^ 2 ε = Residual Tip (Bill Model)
22 Regression Summary R.squared < / 5.861; R.squared [1] summary(tip.model.using.bill) Call: lm(formula = Tip ~ Bill, data = RestaurantTips) Residuals: Min 1Q Median 3Q Max Coefficients: Estimate Std. Error t value Pr(> t ) (Intercept) Bill <2e-16 *** --- Signif. codes: 0 '***' '**' 0.01 '*' 0.05 '.' 0.1 ' ' 1 Residual standard error: on 155 degrees of freedom Multiple R-squared: ,Adjusted R-squared: F-statistic: on 1 and 155 DF, p-value: < 2.2e-16
23 Intervals at a particular X A confidence interval for the slope is useful, but if our goal is a predictive model, we want to be able to make statements about Y values at particular X values. I should be able to estimate 1. What the mean Y value is at that X in the population 2. Where the particular Y is likely to be for this one new observation Note: These are different things, in the same way that a 95% confidence interval does not tell us where 95% of the individual cases are.
24 Confidence and Prediction Intervals for a Linear Model (Population) linear model: Y = β 0 + β 1 X + ε = f(x) + ε 1. A confidence interval (for a particular X) is an estimate (with a margin of error) of f(x). 2. A prediction interval (for a particular X) is an estimate about Y
25 Confidence vs. Prediction Intervals Which is wider? The prediction interval is wider, b/c it has uncertainty about ε plus the uncertainty about f(x)
26 A Subtlety Re: Prediction Intervals Interpreting Prediction Intervals A coverage level of 95% for a prediction interval does not mean that, having fit a model from a particular sample, we will make successful predictions 95% of the time going forward. The worse our line, the lower the %. What we can say is that the average success rate across all possible samples is 95%
27 Confidence and Prediction Bands Intervals for all x in the range are called confidence / prediction bands. Bill PctTip Why the hourglass shape? More leverage at extreme X : bigger change in line from one sample to the next
28 Calculating Confidence and Prediction Intervals Both types of intervals are of the form (1 α) interval = Point Estimate ± t (1 α/2) n 2 Confidence Interval: ˆf(X ) ± t (1 α/2) n 2 ˆσ 2ˆf(X ) SE where ˆσ 2ˆf(X ) = ˆσ2 εh(x ) and h(x ) = 1 n + (x x)2 (xi x) 2 leverage at X. Prediction Interval: Ŷ ± t (1 α/2) n 2 ˆσ 2ˆf(X ) + ˆσ2 ε is the
29 R code for a confidence/prediction bands plot: library("mosaic"); library("lock5data") data("restauranttips") xyplot(pcttip ~ Bill, data = RestaurantTips, panel = panel.lmbands, # Note, no quotes level = 0.90, # The confidence level ## OPTIONAL: band.lty= what kind of lines to use ## format: c(conf.linetype, pred.linetype), where ## 1 = solid, 2 = dashed, 3 = dotted band.lty = c(1,2), ## OPTIONAL: band.col: what color lines to use ## format: c(conf.color, pred.color) band.col = c("royalblue", "blueviolet") ) PctTip Bill
30 We can get intervals for specific X values as follows: tip.model.using.bill <- lm(pcttip ~ Bill, data = RestaurantTips) ## Creates a new function with the given name f.hat <- makefun(tip.model.using.bill) ## Use it like a regular function ## First arg name: name of predictor variable ## (= the desired x value to get the interval for) ## interval="confidence" or interval="prediction" ## controls which interval type to return ## (or leave this out to just get the pt estimate) ## level=confidence.level controls the confidence level f.hat(bill = 40, interval = "confidence", level = 0.90) fit lwr upr f.hat(bill = 40, interval = "prediction", level = 0.90) fit lwr upr
Inference for Regression
 Inference for Regression Section 9.4 Cathy Poliak, Ph.D. cathy@math.uh.edu Office in Fleming 11c Department of Mathematics University of Houston Lecture 13b - 3339 Cathy Poliak, Ph.D. cathy@math.uh.edu
Ch 2: Simple Linear Regression
 Ch 2: Simple Linear Regression 1. Simple Linear Regression Model A simple regression model with a single regressor x is y = β 0 + β 1 x + ɛ, where we assume that the error ɛ is independent random component
STAT 213 Interactions in Two-Way ANOVA
 STAT 213 Interactions in Two-Way ANOVA Colin Reimer Dawson Oberlin College 14 April 2016 Outline Last Time: Two-Way ANOVA Interaction Terms Reading Quiz (Multiple Choice) If there is no interaction present,
Figure 1: The fitted line using the shipment route-number of ampules data. STAT5044: Regression and ANOVA The Solution of Homework #2 Inyoung Kim
 0.0 1.0 1.5 2.0 2.5 3.0 8 10 12 14 16 18 20 22 y x Figure 1: The fitted line using the shipment route-number of ampules data STAT5044: Regression and ANOVA The Solution of Homework #2 Inyoung Kim Problem#
Nature vs. nurture? Lecture 18 - Regression: Inference, Outliers, and Intervals. Regression Output. Conditions for inference.
 Understanding regression output from software Nature vs. nurture? Lecture 18 - Regression: Inference, Outliers, and Intervals In 1966 Cyril Burt published a paper called The genetic determination of differences
Inference for Regression Simple Linear Regression
 Inference for Regression Simple Linear Regression IPS Chapter 10.1 2009 W.H. Freeman and Company Objectives (IPS Chapter 10.1) Simple linear regression p Statistical model for linear regression p Estimating
ST430 Exam 1 with Answers
 ST430 Exam 1 with Answers Date: October 5, 2015 Name: Guideline: You may use one-page (front and back of a standard A4 paper) of notes. No laptop or textook are permitted but you may use a calculator.
Statistics for Engineers Lecture 9 Linear Regression
 Statistics for Engineers Lecture 9 Linear Regression Chong Ma Department of Statistics University of South Carolina chongm@email.sc.edu April 17, 2017 Chong Ma (Statistics, USC) STAT 509 Spring 2017 April
Simple Linear Regression
 Simple Linear Regression In simple linear regression we are concerned about the relationship between two variables, X and Y. There are two components to such a relationship. 1. The strength of the relationship.
1-Way ANOVA MATH 143. Spring Department of Mathematics and Statistics Calvin College
 1-Way ANOVA MATH 143 Department of Mathematics and Statistics Calvin College Spring 2010 The basic ANOVA situation Two variables: 1 Categorical, 1 Quantitative Main Question: Do the (means of) the quantitative
1 Multiple Regression
 1 Multiple Regression In this section, we extend the linear model to the case of several quantitative explanatory variables. There are many issues involved in this problem and this section serves only
Chapter 8: Correlation & Regression
 Chapter 8: Correlation & Regression We can think of ANOVA and the two-sample t-test as applicable to situations where there is a response variable which is quantitative, and another variable that indicates
Stat 412/512 REVIEW OF SIMPLE LINEAR REGRESSION. Jan Charlotte Wickham. stat512.cwick.co.nz
 Stat 412/512 REVIEW OF SIMPLE LINEAR REGRESSION Jan 7 2015 Charlotte Wickham stat512.cwick.co.nz Announcements TA's Katie 2pm lab Ben 5pm lab Joe noon & 1pm lab TA office hours Kidder M111 Katie Tues 2-3pm
Lecture 18: Simple Linear Regression
 Lecture 18: Simple Linear Regression BIOS 553 Department of Biostatistics University of Michigan Fall 2004 The Correlation Coefficient: r The correlation coefficient (r) is a number that measures the strength
STAT420 Midterm Exam. University of Illinois Urbana-Champaign October 19 (Friday), :00 4:15p. SOLUTIONS (Yellow)
, :00 4:15p. SOLUTIONS (Yellow)") STAT40 Midterm Exam University of Illinois Urbana-Champaign October 19 (Friday), 018 3:00 4:15p SOLUTIONS (Yellow) Question 1 (15 points) (10 points) 3 (50 points) extra ( points) Total (77 points) Points
STAT40 Midterm Exam University of Illinois Urbana-Champaign October 19 (Friday), 018 3:00 4:15p SOLUTIONS (Yellow) Question 1 (15 points) (10 points) 3 (50 points) extra ( points) Total (77 points) Points
Section 4.6 Simple Linear Regression
 Section 4.6 Simple Linear Regression Objectives ˆ Basic philosophy of SLR and the regression assumptions ˆ Point & interval estimation of the model parameters, and how to make predictions ˆ Point and interval
UNIVERSITY OF MASSACHUSETTS. Department of Mathematics and Statistics. Basic Exam - Applied Statistics. Tuesday, January 17, 2017
 UNIVERSITY OF MASSACHUSETTS Department of Mathematics and Statistics Basic Exam - Applied Statistics Tuesday, January 17, 2017 Work all problems 60 points are needed to pass at the Masters Level and 75
Stat 401B Exam 2 Fall 2015
 Stat 401B Exam Fall 015 I have neither given nor received unauthorized assistance on this exam. Name Signed Date Name Printed ATTENTION! Incorrect numerical answers unaccompanied by supporting reasoning
R 2 and F -Tests and ANOVA
 R 2 and F -Tests and ANOVA December 6, 2018 1 Partition of Sums of Squares The distance from any point y i in a collection of data, to the mean of the data ȳ, is the deviation, written as y i ȳ. Definition.
Biostatistics 380 Multiple Regression 1. Multiple Regression
 Biostatistics 0 Multiple Regression ORIGIN 0 Multiple Regression Multiple Regression is an extension of the technique of linear regression to describe the relationship between a single dependent (response)
Homework 2: Simple Linear Regression
 STAT 4385 Applied Regression Analysis Homework : Simple Linear Regression (Simple Linear Regression) Thirty (n = 30) College graduates who have recently entered the job market. For each student, the CGPA
Regression on Faithful with Section 9.3 content
 Regression on Faithful with Section 9.3 content The faithful data frame contains 272 obervational units with variables waiting and eruptions measuring, in minutes, the amount of wait time between eruptions,
Variance Decomposition and Goodness of Fit
 Variance Decomposition and Goodness of Fit 1. Example: Monthly Earnings and Years of Education In this tutorial, we will focus on an example that explores the relationship between total monthly earnings
13 Simple Linear Regression
 B.Sc./Cert./M.Sc. Qualif. - Statistics: Theory and Practice 3 Simple Linear Regression 3. An industrial example A study was undertaken to determine the effect of stirring rate on the amount of impurity
Biostatistics for physicists fall Correlation Linear regression Analysis of variance
 Biostatistics for physicists fall 2015 Correlation Linear regression Analysis of variance Correlation Example: Antibody level on 38 newborns and their mothers There is a positive correlation in antibody
MS&E 226: Small Data
 MS&E 226: Small Data Lecture 15: Examples of hypothesis tests (v5) Ramesh Johari ramesh.johari@stanford.edu 1 / 32 The recipe 2 / 32 The hypothesis testing recipe In this lecture we repeatedly apply the
Stat 5102 Final Exam May 14, 2015
 Stat 5102 Final Exam May 14, 2015 Name Student ID The exam is closed book and closed notes. You may use three 8 1 11 2 sheets of paper with formulas, etc. You may also use the handouts on brand name distributions
Handout 4: Simple Linear Regression
 Handout 4: Simple Linear Regression By: Brandon Berman The following problem comes from Kokoska s Introductory Statistics: A Problem-Solving Approach. The data can be read in to R using the following code:
Homework 9 Sample Solution
 Homework 9 Sample Solution # 1 (Ex 9.12, Ex 9.23) Ex 9.12 (a) Let p vitamin denote the probability of having cold when a person had taken vitamin C, and p placebo denote the probability of having cold
Ch 3: Multiple Linear Regression
 Ch 3: Multiple Linear Regression 1. Multiple Linear Regression Model Multiple regression model has more than one regressor. For example, we have one response variable and two regressor variables: 1. delivery
UNIVERSITY OF TORONTO SCARBOROUGH Department of Computer and Mathematical Sciences Midterm Test, October 2013
 UNIVERSITY OF TORONTO SCARBOROUGH Department of Computer and Mathematical Sciences Midterm Test, October 2013 STAC67H3 Regression Analysis Duration: One hour and fifty minutes Last Name: First Name: Student
(ii) Scan your answer sheets INTO ONE FILE only, and submit it in the drop-box.
 Scan your answer sheets INTO ONE FILE only, and submit it in the drop-box.") FINAL EXAM ** Two different ways to submit your answer sheet (i) Use MS-Word and place it in a drop-box. (ii) Scan your answer sheets INTO ONE FILE only, and submit it in the drop-box. Deadline: December
FINAL EXAM ** Two different ways to submit your answer sheet (i) Use MS-Word and place it in a drop-box. (ii) Scan your answer sheets INTO ONE FILE only, and submit it in the drop-box. Deadline: December
Interpretation, Prediction and Confidence Intervals
 Interpretation, Prediction and Confidence Intervals Merlise Clyde September 15, 2017 Last Class Model for log brain weight as a function of log body weight Nested Model Comparison using ANOVA led to model
AMS 315/576 Lecture Notes. Chapter 11. Simple Linear Regression
 AMS 315/576 Lecture Notes Chapter 11. Simple Linear Regression 11.1 Motivation A restaurant opening on a reservations-only basis would like to use the number of advance reservations x to predict the number
Correlation Analysis
 Simple Regression Correlation Analysis Correlation analysis is used to measure strength of the association (linear relationship) between two variables Correlation is only concerned with strength of the
STAT 213 Two-Way ANOVA II
 STAT 213 Two-Way ANOVA II Colin Reimer Dawson Oberlin College May 2, 2018 1 / 21 Outline Two-Way ANOVA: Additive Model FIT: Estimating Parameters ASSESS: Variance Decomposition Pairwise Comparisons 2 /
Regression. Marc H. Mehlman University of New Haven
 Regression Marc H. Mehlman marcmehlman@yahoo.com University of New Haven the statistician knows that in nature there never was a normal distribution, there never was a straight line, yet with normal and
Regression. Bret Hanlon and Bret Larget. December 8 15, Department of Statistics University of Wisconsin Madison.
 Regression Bret Hanlon and Bret Larget Department of Statistics University of Wisconsin Madison December 8 15, 2011 Regression 1 / 55 Example Case Study The proportion of blackness in a male lion s nose
Linear Regression Model. Badr Missaoui
 Linear Regression Model Badr Missaoui Introduction What is this course about? It is a course on applied statistics. It comprises 2 hours lectures each week and 1 hour lab sessions/tutorials. We will focus
Linear Modelling: Simple Regression
 Linear Modelling: Simple Regression 10 th of Ma 2018 R. Nicholls / D.-L. Couturier / M. Fernandes Introduction: ANOVA Used for testing hpotheses regarding differences between groups Considers the variation
Inference for Regression Inference about the Regression Model and Using the Regression Line
 Inference for Regression Inference about the Regression Model and Using the Regression Line PBS Chapter 10.1 and 10.2 2009 W.H. Freeman and Company Objectives (PBS Chapter 10.1 and 10.2) Inference about
Stat 411/511 ESTIMATING THE SLOPE AND INTERCEPT. Charlotte Wickham. stat511.cwick.co.nz. Nov
 Stat 411/511 ESTIMATING THE SLOPE AND INTERCEPT Nov 20 2015 Charlotte Wickham stat511.cwick.co.nz Quiz #4 This weekend, don t forget. Usual format Assumptions Display 7.5 p. 180 The ideal normal, simple
Foundations of Correlation and Regression
 BWH - Biostatistics Intermediate Biostatistics for Medical Researchers Robert Goldman Professor of Statistics Simmons College Foundations of Correlation and Regression Tuesday, March 7, 2017 March 7 Foundations
Chapter 16: Understanding Relationships Numerical Data
 Chapter 16: Understanding Relationships Numerical Data These notes reflect material from our text, Statistics, Learning from Data, First Edition, by Roxy Peck, published by CENGAGE Learning, 2015. Linear
Lecture 6 Multiple Linear Regression, cont.
 Lecture 6 Multiple Linear Regression, cont. BIOST 515 January 22, 2004 BIOST 515, Lecture 6 Testing general linear hypotheses Suppose we are interested in testing linear combinations of the regression
Workshop 7.4a: Single factor ANOVA
 -1- Workshop 7.4a: Single factor ANOVA Murray Logan November 23, 2016 Table of contents 1 Revision 1 2 Anova Parameterization 2 3 Partitioning of variance (ANOVA) 10 4 Worked Examples 13 1. Revision 1.1.
Variance Decomposition in Regression James M. Murray, Ph.D. University of Wisconsin - La Crosse Updated: October 04, 2017
 Variance Decomposition in Regression James M. Murray, Ph.D. University of Wisconsin - La Crosse Updated: October 04, 2017 PDF file location: http://www.murraylax.org/rtutorials/regression_anovatable.pdf
Density Temp vs Ratio. temp
 Temp Ratio Density 0.00 0.02 0.04 0.06 0.08 0.10 0.12 Density 0.0 0.2 0.4 0.6 0.8 1.0 1. (a) 170 175 180 185 temp 1.0 1.5 2.0 2.5 3.0 ratio The histogram shows that the temperature measures have two peaks,
Basic Business Statistics 6 th Edition
 Basic Business Statistics 6 th Edition Chapter 12 Simple Linear Regression Learning Objectives In this chapter, you learn: How to use regression analysis to predict the value of a dependent variable based
ANOVA Situation The F Statistic Multiple Comparisons. 1-Way ANOVA MATH 143. Department of Mathematics and Statistics Calvin College
 1-Way ANOVA MATH 143 Department of Mathematics and Statistics Calvin College An example ANOVA situation Example (Treating Blisters) Subjects: 25 patients with blisters Treatments: Treatment A, Treatment
Simple Linear Regression
 Simple Linear Regression ST 430/514 Recall: A regression model describes how a dependent variable (or response) Y is affected, on average, by one or more independent variables (or factors, or covariates)
LECTURE 6. Introduction to Econometrics. Hypothesis testing & Goodness of fit
 LECTURE 6 Introduction to Econometrics Hypothesis testing & Goodness of fit October 25, 2016 1 / 23 ON TODAY S LECTURE We will explain how multiple hypotheses are tested in a regression model We will define
ST430 Exam 2 Solutions
 ST430 Exam 2 Solutions Date: November 9, 2015 Name: Guideline: You may use one-page (front and back of a standard A4 paper) of notes. No laptop or textbook are permitted but you may use a calculator. Giving
Statistiek II. John Nerbonne. March 17, Dept of Information Science incl. important reworkings by Harmut Fitz
 Dept of Information Science j.nerbonne@rug.nl incl. important reworkings by Harmut Fitz March 17, 2015 Review: regression compares result on two distinct tests, e.g., geographic and phonetic distance of
STAT 3022 Spring 2007
 Simple Linear Regression Example These commands reproduce what we did in class. You should enter these in R and see what they do. Start by typing > set.seed(42) to reset the random number generator so
Business Statistics. Lecture 10: Course Review
 Business Statistics Lecture 10: Course Review 1 Descriptive Statistics for Continuous Data Numerical Summaries Location: mean, median Spread or variability: variance, standard deviation, range, percentiles,
Simple and Multiple Linear Regression
 Sta. 113 Chapter 12 and 13 of Devore March 12, 2010 Table of contents 1 Simple Linear Regression 2 Model Simple Linear Regression A simple linear regression model is given by Y = β 0 + β 1 x + ɛ where
Inferences for Regression
 Inferences for Regression An Example: Body Fat and Waist Size Looking at the relationship between % body fat and waist size (in inches). Here is a scatterplot of our data set: Remembering Regression In
2. Outliers and inference for regression
 Unit6: Introductiontolinearregression 2. Outliers and inference for regression Sta 101 - Spring 2016 Duke University, Department of Statistical Science Dr. Çetinkaya-Rundel Slides posted at http://bit.ly/sta101_s16
STAT 350: Summer Semester Midterm 1: Solutions
 Name: Student Number: STAT 350: Summer Semester 2008 Midterm 1: Solutions 9 June 2008 Instructor: Richard Lockhart Instructions: This is an open book test. You may use notes, text, other books and a calculator.
Multiple Linear Regression
 Multiple Linear Regression Simple linear regression tries to fit a simple line between two variables Y and X. If X is linearly related to Y this explains some of the variability in Y. In most cases, there
Lectures on Simple Linear Regression Stat 431, Summer 2012
 Lectures on Simple Linear Regression Stat 43, Summer 0 Hyunseung Kang July 6-8, 0 Last Updated: July 8, 0 :59PM Introduction Previously, we have been investigating various properties of the population
Coefficient of Determination
 Coefficient of Determination ST 430/514 The coefficient of determination, R 2, is defined as before: R 2 = 1 SS E (yi ŷ i ) = 1 2 SS yy (yi ȳ) 2 The interpretation of R 2 is still the fraction of variance
Lecture 1: Linear Models and Applications
 Lecture 1: Linear Models and Applications Claudia Czado TU München c (Claudia Czado, TU Munich) ZFS/IMS Göttingen 2004 0 Overview Introduction to linear models Exploratory data analysis (EDA) Estimation
Multiple Linear Regression
 Multiple Linear Regression ST 430/514 Recall: a regression model describes how a dependent variable (or response) Y is affected, on average, by one or more independent variables (or factors, or covariates).
Linear models and their mathematical foundations: Simple linear regression
 Linear models and their mathematical foundations: Simple linear regression Steffen Unkel Department of Medical Statistics University Medical Center Göttingen, Germany Winter term 2018/19 1/21 Introduction
Simple Linear Regression
 Simple Linear Regression MATH 282A Introduction to Computational Statistics University of California, San Diego Instructor: Ery Arias-Castro http://math.ucsd.edu/ eariasca/math282a.html MATH 282A University
Applied Regression Analysis
 Applied Regression Analysis Chapter 3 Multiple Linear Regression Hongcheng Li April, 6, 2013 Recall simple linear regression 1 Recall simple linear regression 2 Parameter Estimation 3 Interpretations of
SCHOOL OF MATHEMATICS AND STATISTICS
 RESTRICTED OPEN BOOK EXAMINATION (Not to be removed from the examination hall) Data provided: Statistics Tables by H.R. Neave MAS5052 SCHOOL OF MATHEMATICS AND STATISTICS Basic Statistics Spring Semester
IES 612/STA 4-573/STA Winter 2008 Week 1--IES 612-STA STA doc
 IES 612/STA 4-573/STA 4-576 Winter 2008 Week 1--IES 612-STA 4-573-STA 4-576.doc Review Notes: [OL] = Ott & Longnecker Statistical Methods and Data Analysis, 5 th edition. [Handouts based on notes prepared
MODULE 4 SIMPLE LINEAR REGRESSION
 MODULE 4 SIMPLE LINEAR REGRESSION Module Objectives: 1. Describe the equation of a line including the meanings of the two parameters. 2. Describe how the best-fit line to a set of bivariate data is derived.
Multiple Linear Regression. Chapter 12
 13 Multiple Linear Regression Chapter 12 Multiple Regression Analysis Definition The multiple regression model equation is Y = b 0 + b 1 x 1 + b 2 x 2 +... + b p x p + ε where E(ε) = 0 and Var(ε) = s 2.
Statistics for Managers using Microsoft Excel 6 th Edition
 Statistics for Managers using Microsoft Excel 6 th Edition Chapter 13 Simple Linear Regression 13-1 Learning Objectives In this chapter, you learn: How to use regression analysis to predict the value of
STAT763: Applied Regression Analysis. Multiple linear regression. 4.4 Hypothesis testing
 STAT763: Applied Regression Analysis Multiple linear regression 4.4 Hypothesis testing Chunsheng Ma E-mail: cma@math.wichita.edu 4.4.1 Significance of regression Null hypothesis (Test whether all β j =
Categorical Predictor Variables
 Categorical Predictor Variables We often wish to use categorical (or qualitative) variables as covariates in a regression model. For binary variables (taking on only 2 values, e.g. sex), it is relatively
" M A #M B. Standard deviation of the population (Greek lowercase letter sigma) σ 2
 σ 2") Notation and Equations for Final Exam Symbol Definition X The variable we measure in a scientific study n The size of the sample N The size of the population M The mean of the sample µ The mean of the
Notation and Equations for Final Exam Symbol Definition X The variable we measure in a scientific study n The size of the sample N The size of the population M The mean of the sample µ The mean of the
Measuring the fit of the model - SSR
 Measuring the fit of the model - SSR Once we ve determined our estimated regression line, we d like to know how well the model fits. How far/close are the observations to the fitted line? One way to do
MODELS WITHOUT AN INTERCEPT
 Consider the balanced two factor design MODELS WITHOUT AN INTERCEPT Factor A 3 levels, indexed j 0, 1, 2; Factor B 5 levels, indexed l 0, 1, 2, 3, 4; n jl 4 replicate observations for each factor level
Correlation and Regression
 Correlation and Regression October 25, 2017 STAT 151 Class 9 Slide 1 Outline of Topics 1 Associations 2 Scatter plot 3 Correlation 4 Regression 5 Testing and estimation 6 Goodness-of-fit STAT 151 Class
22s:152 Applied Linear Regression. Chapter 8: 1-Way Analysis of Variance (ANOVA) 2-Way Analysis of Variance (ANOVA)
 2-Way Analysis of Variance (ANOVA)") 22s:152 Applied Linear Regression Chapter 8: 1-Way Analysis of Variance (ANOVA) 2-Way Analysis of Variance (ANOVA) We now consider an analysis with only categorical predictors (i.e. all predictors are
22s:152 Applied Linear Regression Chapter 8: 1-Way Analysis of Variance (ANOVA) 2-Way Analysis of Variance (ANOVA) We now consider an analysis with only categorical predictors (i.e. all predictors are
A discussion on multiple regression models
 A discussion on multiple regression models In our previous discussion of simple linear regression, we focused on a model in which one independent or explanatory variable X was used to predict the value
STAT 4385 Topic 03: Simple Linear Regression
 STAT 4385 Topic 03: Simple Linear Regression Xiaogang Su, Ph.D. Department of Mathematical Science University of Texas at El Paso xsu@utep.edu Spring, 2017 Outline The Set-Up Exploratory Data Analysis
14 Multiple Linear Regression
 B.Sc./Cert./M.Sc. Qualif. - Statistics: Theory and Practice 14 Multiple Linear Regression 14.1 The multiple linear regression model In simple linear regression, the response variable y is expressed in
Inference for the Regression Coefficient
 Inference for the Regression Coefficient Recall, b 0 and b 1 are the estimates of the slope β 1 and intercept β 0 of population regression line. We can shows that b 0 and b 1 are the unbiased estimates
No other aids are allowed. For example you are not allowed to have any other textbook or past exams.
 UNIVERSITY OF TORONTO SCARBOROUGH Department of Computer and Mathematical Sciences Sample Exam Note: This is one of our past exams, In fact the only past exam with R. Before that we were using SAS. In
Comparing Nested Models
 Comparing Nested Models ST 370 Two regression models are called nested if one contains all the predictors of the other, and some additional predictors. For example, the first-order model in two independent
Regression and the 2-Sample t
 Regression and the 2-Sample t James H. Steiger Department of Psychology and Human Development Vanderbilt University James H. Steiger (Vanderbilt University) Regression and the 2-Sample t 1 / 44 Regression
Lecture 15. Hypothesis testing in the linear model
 14. Lecture 15. Hypothesis testing in the linear model Lecture 15. Hypothesis testing in the linear model 1 (1 1) Preliminary lemma 15. Hypothesis testing in the linear model 15.1. Preliminary lemma Lemma
22s:152 Applied Linear Regression. Take random samples from each of m populations.
 22s:152 Applied Linear Regression Chapter 8: ANOVA NOTE: We will meet in the lab on Monday October 10. One-way ANOVA Focuses on testing for differences among group means. Take random samples from each
Inference. ME104: Linear Regression Analysis Kenneth Benoit. August 15, August 15, 2012 Lecture 3 Multiple linear regression 1 1 / 58
 Inference ME104: Linear Regression Analysis Kenneth Benoit August 15, 2012 August 15, 2012 Lecture 3 Multiple linear regression 1 1 / 58 Stata output resvisited. reg votes1st spend_total incumb minister
ANOVA: Analysis of Variation
 ANOVA: Analysis of Variation The basic ANOVA situation Two variables: 1 Categorical, 1 Quantitative Main Question: Do the (means of) the quantitative variables depend on which group (given by categorical
MATH 644: Regression Analysis Methods
 MATH 644: Regression Analysis Methods FINAL EXAM Fall, 2012 INSTRUCTIONS TO STUDENTS: 1. This test contains SIX questions. It comprises ELEVEN printed pages. 2. Answer ALL questions for a total of 100
Swarthmore Honors Exam 2012: Statistics
 Swarthmore Honors Exam 2012: Statistics 1 Swarthmore Honors Exam 2012: Statistics John W. Emerson, Yale University NAME: Instructions: This is a closed-book three-hour exam having six questions. You may
STAT 3A03 Applied Regression With SAS Fall 2017
 STAT 3A03 Applied Regression With SAS Fall 2017 Assignment 2 Solution Set Q. 1 I will add subscripts relating to the question part to the parameters and their estimates as well as the errors and residuals.
Chapte The McGraw-Hill Companies, Inc. All rights reserved.
 12er12 Chapte Bivariate i Regression (Part 1) Bivariate Regression Visual Displays Begin the analysis of bivariate data (i.e., two variables) with a scatter plot. A scatter plot - displays each observed
22s:152 Applied Linear Regression. There are a couple commonly used models for a one-way ANOVA with m groups. Chapter 8: ANOVA
 22s:152 Applied Linear Regression Chapter 8: ANOVA NOTE: We will meet in the lab on Monday October 10. One-way ANOVA Focuses on testing for differences among group means. Take random samples from each
22s:152 Applied Linear Regression. 1-way ANOVA visual:
 22s:152 Applied Linear Regression 1-way ANOVA visual: Chapter 8: 1-Way Analysis of Variance (ANOVA) 2-Way Analysis of Variance (ANOVA) 0.00 0.05 0.10 0.15 0.20 0.25 0.30 0.35 Y We now consider an analysis
Estimated Simple Regression Equation
 Simple Linear Regression A simple linear regression model that describes the relationship between two variables x and y can be expressed by the following equation. The numbers α and β are called parameters,
Lecture 3: Inference in SLR
 Lecture 3: Inference in SLR STAT 51 Spring 011 Background Reading KNNL:.1.6 3-1 Topic Overview This topic will cover: Review of hypothesis testing Inference about 1 Inference about 0 Confidence Intervals
Multiple Linear Regression (solutions to exercises)
") Chapter 6 1 Chapter 6 Multiple Linear Regression (solutions to exercises) Chapter 6 CONTENTS 2 Contents 6 Multiple Linear Regression (solutions to exercises) 1 6.1 Nitrate concentration..........................
Chapter 6 1 Chapter 6 Multiple Linear Regression (solutions to exercises) Chapter 6 CONTENTS 2 Contents 6 Multiple Linear Regression (solutions to exercises) 1 6.1 Nitrate concentration..........................