Stat 412/512 REVIEW OF SIMPLE LINEAR REGRESSION. Jan Charlotte Wickham. stat512.cwick.co.nz
|
|
|
- Sophie Lawrence
- 5 years ago
- Views:
Transcription
1 Stat 412/512 REVIEW OF SIMPLE LINEAR REGRESSION Jan Charlotte Wickham stat512.cwick.co.nz
2 Announcements TA's Katie 2pm lab Ben 5pm lab Joe noon & 1pm lab TA office hours Kidder M111 Katie Tues 2-3pm Ben Thur noon-1pm Joe Mon 3-4pm & Thur 9-10am Reminder my ST512 office hours : Tuesday 3-5pm Cordley 3003 Friday 11-noon Kidder 76 First homework posted!
3 Review Simple linear regression: model for the mean interpreting intercept and slope assumptions and residuals R output Types of statistical inference
4 The response variable is the measurement we are interested in Y explaining or predicting. The explanatory variable is the measurement we want to use to X explain or predict the response.
5 The simple linear regression model Parameters μ{y X} = β0 + β1 X Intercept Slope The mean response as a function of the explanatory variable is a straight line. Describes the relationship between the response and explanatory variable with two parameters.
6 Intercept and Slope The intercept gives the mean response at an explanatory value of zero. The slope gives the change in the mean response for a 1 unit change in the explanatory variable.
7 Your turn A simple linear regression of stopping distance (ft) on speed (mph) : μ{dist speed} = β0 + β1speed from 50 cars, gave the following estimates: Parameter Estimate 95% confidence interval Intercept, β , -4.0 Slope, β , 4.8 On your own, write down a two sentence summary interpreting the slope estimate.
8
9 Your turn It is estimated that for every one mile an hour increase in speed the mean stopping distance increases by 3.9 feet (95% CI 3.1 to 4.8). With 95% confidence, for every one mile an hour increase in speed the mean stopping distance increases by between 3.1 and 4.8 feet
10 Assumptions 1. The means of the subpopulations fall on a straight line function of the explanatory variable. μ { Y X } = β0 + β1 X 2. The subpopulations have the same standard deviation, σ. Var { Y X } = σ 2 3. At each value of the explanatory, the response has a Normal distribution. 4. Observations are independent. There are no assumptions on the explanatory variable!
11 An alternative view of the assumptions Assumptions If the linear effect of the explanatory variable is removed from the response, then what's left should be: 1. Normally distributed 2. Have mean zero. 3. Have standard deviation, σ. 4. Be independent. I.e. ( Y - ( β0 + β1 X ) ) are independent Normal with mean zero and standard deviation σ
12 Your turn Someone suggests that we should have done the regression of log(dist) against log(speed) (because the relationship probably isn t additive, e.g. the difference in stopping distance is probably bigger between 60 and 70 mph than it is between 10 and 20 mph) How would you decide whether their suggestion is a good one?

")


13 dist ~ speed Your turn log(dist) ~ log(speed)
14 Inference in simple linear regression by least squares t-ratios of the estimates of the slope, intercept, mean response, and predicted response all have a Student's t-distribution with n - 2 degrees of freedom. Competing (nested) models can be compared using an extra Sum of Squares F-test.
15 Your turn > summary(fit2) Call: lm(formula = log(dist) ~ log(speed), data = cars) Residuals: Min 1Q Median 3Q Max Coefficients: Estimate Std. Error t value Pr(> t ) (Intercept) log(speed) e-15 *** 2. How --- is this t-statistic calculated? Signif. codes: 0 *** ** 0.01 * What test is this p-value for? Residual standard error: on 48 degrees of freedom Multiple R-squared: , Adjusted R-squared: F-statistic: on 1 and 48 DF, p-value: 2.259e What test is this p-value for?
16
? Which dataset has the largest sx (explanatory sd)?")
17 Which dataset has the largest σ (subpopulation response sd)? Which dataset has the largest sx (explanatory sd)?
18 A larger sample (larger n) does not decrease σ, we simply get a more precise estimate. A larger sample (larger n) does decrease the standard error on the slope and intercept estimates. σ is often outside the control of the researcher, but sometimes it can be decreased by improving the measurement of the response. Eg. using a digital thermometer, rather than one of those color change magnets to measure temperature. The standard error of the slope and intercept also depend on how you choose X (if you can). Normally it's a balance between low standard error, and the ability to check assumptions and will depend on your questions of interest.
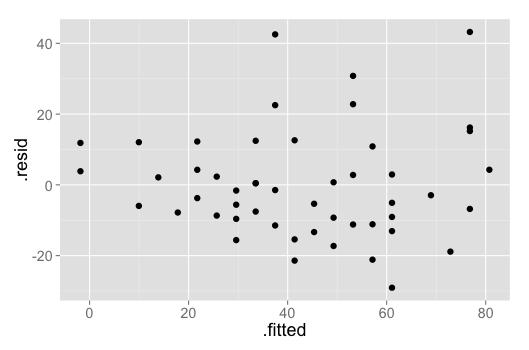
19 The fitted value describes the estimated mean for an observation. For the i th observation the fitted value is, fittedi = μ {Yi Xi} = β 0 + β 1Xi The residual is the difference between the observed response and it's fitted value residuali = Yi - fittedi = Yi - ( β 0 + β 1Xi ) The appropriateness of the linear regression model is checked by looking at plots of the residuals Review in lab and homework
20 Population and Causal Inference Experimental unit: the object to which the treatment is applied. Sampling unit: the object that is selected from a population. Observational unit: the object that measurements are taken on. Population inference (statistical inference beyond the units in the study to a wider population) is justified if the sampling units in the study are a random sample from the population. Causal inference (statistical inference that the treatment caused the differences observed in the study) is justified if the experimental units in the study were randomly assigned to treatments.
21 In simple (and multiple) linear regression In regression, the treatments are specific values of the explanatory variables. Experimental units must be randomly assigned to the values of the explanatory variables for causal inference to be valid. To infer a cause-effect relationship the researcher must decide the levels of the explanatory variable they are going to measure, and then randomly assign their subjects to those levels. If the subjects are not randomly assigned to predetermined levels, or the explanatory variables are not under the control of the researcher (i.e. they simply observe it) causal inference is not justified. We can still talk about a relationship or association between the variables but we must avoid causal language, (e.g. avoid saying X increases Y )
22 ... all models are wrong, but some are useful. George E. P. Box Regression models, like all models, are never going to be a perfect description of reality. We will always keep two things in mind: * we want our models to be good approximate descriptions of reality (i.e. not too wrong) * we want our models to be useful in answering our scientific questions of interest
23 General approach for hypothesis testing and estimation 1. Fit a regression model that is designed to answer your questions. 2. Check the validity of the model If it's OK, proceed. If it isn't OK, refine the model. 3. Answer your questions of interest using the model and make appropriate inferences.
24
Stat 411/511 ESTIMATING THE SLOPE AND INTERCEPT. Charlotte Wickham. stat511.cwick.co.nz. Nov
 Stat 411/511 ESTIMATING THE SLOPE AND INTERCEPT Nov 20 2015 Charlotte Wickham stat511.cwick.co.nz Quiz #4 This weekend, don t forget. Usual format Assumptions Display 7.5 p. 180 The ideal normal, simple
Lecture 18: Simple Linear Regression
 Lecture 18: Simple Linear Regression BIOS 553 Department of Biostatistics University of Michigan Fall 2004 The Correlation Coefficient: r The correlation coefficient (r) is a number that measures the strength
STAT 215 Confidence and Prediction Intervals in Regression
 STAT 215 Confidence and Prediction Intervals in Regression Colin Reimer Dawson Oberlin College 24 October 2016 Outline Regression Slope Inference Partitioning Variability Prediction Intervals Reminder:
Math 2311 Written Homework 6 (Sections )
") Math 2311 Written Homework 6 (Sections 5.4 5.6) Name: PeopleSoft ID: Instructions: Homework will NOT be accepted through email or in person. Homework must be submitted through CourseWare BEFORE the deadline.
Math 2311 Written Homework 6 (Sections 5.4 5.6) Name: PeopleSoft ID: Instructions: Homework will NOT be accepted through email or in person. Homework must be submitted through CourseWare BEFORE the deadline.
III. Inferential Tools
 III. Inferential Tools A. Introduction to Bat Echolocation Data (10.1.1) 1. Q: Do echolocating bats expend more enery than non-echolocating bats and birds, after accounting for mass? 2. Strategy: (i) Explore
Warm-up Using the given data Create a scatterplot Find the regression line
 Time at the lunch table Caloric intake 21.4 472 30.8 498 37.7 335 32.8 423 39.5 437 22.8 508 34.1 431 33.9 479 43.8 454 42.4 450 43.1 410 29.2 504 31.3 437 28.6 489 32.9 436 30.6 480 35.1 439 33.0 444
Linear Modelling: Simple Regression
 Linear Modelling: Simple Regression 10 th of Ma 2018 R. Nicholls / D.-L. Couturier / M. Fernandes Introduction: ANOVA Used for testing hpotheses regarding differences between groups Considers the variation
appstats27.notebook April 06, 2017
 Chapter 27 Objective Students will conduct inference on regression and analyze data to write a conclusion. Inferences for Regression An Example: Body Fat and Waist Size pg 634 Our chapter example revolves
Regression Models - Introduction
 Regression Models - Introduction In regression models there are two types of variables that are studied: A dependent variable, Y, also called response variable. It is modeled as random. An independent
ST430 Exam 1 with Answers
 ST430 Exam 1 with Answers Date: October 5, 2015 Name: Guideline: You may use one-page (front and back of a standard A4 paper) of notes. No laptop or textook are permitted but you may use a calculator.
Math 3339 Homework 2 (Chapter 2, 9.1 & 9.2)
") Math 3339 Homework 2 (Chapter 2, 9.1 & 9.2) Name: PeopleSoft ID: Instructions: Homework will NOT be accepted through email or in person. Homework must be submitted through CourseWare BEFORE the deadline.
Math 3339 Homework 2 (Chapter 2, 9.1 & 9.2) Name: PeopleSoft ID: Instructions: Homework will NOT be accepted through email or in person. Homework must be submitted through CourseWare BEFORE the deadline.
Unit 6 - Simple linear regression
 Sta 101: Data Analysis and Statistical Inference Dr. Çetinkaya-Rundel Unit 6 - Simple linear regression LO 1. Define the explanatory variable as the independent variable (predictor), and the response variable
Objectives Simple linear regression. Statistical model for linear regression. Estimating the regression parameters
 Objectives 10.1 Simple linear regression Statistical model for linear regression Estimating the regression parameters Confidence interval for regression parameters Significance test for the slope Confidence
Stat 412/512 TWO WAY ANOVA. Charlotte Wickham. stat512.cwick.co.nz. Feb
 Stat 42/52 TWO WAY ANOVA Feb 6 25 Charlotte Wickham stat52.cwick.co.nz Roadmap DONE: Understand what a multiple regression model is. Know how to do inference on single and multiple parameters. Some extra
MATH 644: Regression Analysis Methods
 MATH 644: Regression Analysis Methods FINAL EXAM Fall, 2012 INSTRUCTIONS TO STUDENTS: 1. This test contains SIX questions. It comprises ELEVEN printed pages. 2. Answer ALL questions for a total of 100
Announcements: You can turn in homework until 6pm, slot on wall across from 2202 Bren. Make sure you use the correct slot! (Stats 8, closest to wall)
") Announcements: You can turn in homework until 6pm, slot on wall across from 2202 Bren. Make sure you use the correct slot! (Stats 8, closest to wall) We will cover Chs. 5 and 6 first, then 3 and 4. Mon,
Announcements: You can turn in homework until 6pm, slot on wall across from 2202 Bren. Make sure you use the correct slot! (Stats 8, closest to wall) We will cover Chs. 5 and 6 first, then 3 and 4. Mon,
Inferences for Regression
 Inferences for Regression An Example: Body Fat and Waist Size Looking at the relationship between % body fat and waist size (in inches). Here is a scatterplot of our data set: Remembering Regression In
Business Statistics. Lecture 10: Course Review
 Business Statistics Lecture 10: Course Review 1 Descriptive Statistics for Continuous Data Numerical Summaries Location: mean, median Spread or variability: variance, standard deviation, range, percentiles,
Figure 1: The fitted line using the shipment route-number of ampules data. STAT5044: Regression and ANOVA The Solution of Homework #2 Inyoung Kim
 0.0 1.0 1.5 2.0 2.5 3.0 8 10 12 14 16 18 20 22 y x Figure 1: The fitted line using the shipment route-number of ampules data STAT5044: Regression and ANOVA The Solution of Homework #2 Inyoung Kim Problem#
Regression. Marc H. Mehlman University of New Haven
 Regression Marc H. Mehlman marcmehlman@yahoo.com University of New Haven the statistician knows that in nature there never was a normal distribution, there never was a straight line, yet with normal and
L21: Chapter 12: Linear regression
 L21: Chapter 12: Linear regression Department of Statistics, University of South Carolina Stat 205: Elementary Statistics for the Biological and Life Sciences 1 / 37 So far... 12.1 Introduction One sample
Inference for Regression
 Inference for Regression Section 9.4 Cathy Poliak, Ph.D. cathy@math.uh.edu Office in Fleming 11c Department of Mathematics University of Houston Lecture 13b - 3339 Cathy Poliak, Ph.D. cathy@math.uh.edu
1 The Classic Bivariate Least Squares Model
 Review of Bivariate Linear Regression Contents 1 The Classic Bivariate Least Squares Model 1 1.1 The Setup............................... 1 1.2 An Example Predicting Kids IQ................. 1 2 Evaluating
STAT 350: Summer Semester Midterm 1: Solutions
 Name: Student Number: STAT 350: Summer Semester 2008 Midterm 1: Solutions 9 June 2008 Instructor: Richard Lockhart Instructions: This is an open book test. You may use notes, text, other books and a calculator.
Two-Sample Inference for Proportions and Inference for Linear Regression
 Two-Sample Inference for Proportions and Inference for Linear Regression Kwonsang Lee University of Pennsylvania kwonlee@wharton.upenn.edu April 24, 2015 Kwonsang Lee STAT111 April 24, 2015 1 / 13 Announcement:
Chapter 27 Summary Inferences for Regression
 Chapter 7 Summary Inferences for Regression What have we learned? We have now applied inference to regression models. Like in all inference situations, there are conditions that we must check. We can test
Unit 6 - Introduction to linear regression
 Unit 6 - Introduction to linear regression Suggested reading: OpenIntro Statistics, Chapter 7 Suggested exercises: Part 1 - Relationship between two numerical variables: 7.7, 7.9, 7.11, 7.13, 7.15, 7.25,
Statistics for Engineers Lecture 9 Linear Regression
 Statistics for Engineers Lecture 9 Linear Regression Chong Ma Department of Statistics University of South Carolina chongm@email.sc.edu April 17, 2017 Chong Ma (Statistics, USC) STAT 509 Spring 2017 April
UNIVERSITY OF MASSACHUSETTS. Department of Mathematics and Statistics. Basic Exam - Applied Statistics. Tuesday, January 17, 2017
 UNIVERSITY OF MASSACHUSETTS Department of Mathematics and Statistics Basic Exam - Applied Statistics Tuesday, January 17, 2017 Work all problems 60 points are needed to pass at the Masters Level and 75
SCHOOL OF MATHEMATICS AND STATISTICS
 SHOOL OF MATHEMATIS AND STATISTIS Linear Models Autumn Semester 2015 16 2 hours Marks will be awarded for your best three answers. RESTRITED OPEN BOOK EXAMINATION andidates may bring to the examination
Linear Probability Model
 Linear Probability Model Note on required packages: The following code requires the packages sandwich and lmtest to estimate regression error variance that may change with the explanatory variables. If
Multiple Linear Regression. Chapter 12
 13 Multiple Linear Regression Chapter 12 Multiple Regression Analysis Definition The multiple regression model equation is Y = b 0 + b 1 x 1 + b 2 x 2 +... + b p x p + ε where E(ε) = 0 and Var(ε) = s 2.
Lecture 19: Inference for SLR & Transformations
 Lecture 19: Inference for SLR & Transformations Statistics 101 Mine Çetinkaya-Rundel April 3, 2012 Announcements Announcements HW 7 due Thursday. Correlation guessing game - ends on April 12 at noon. Winner
Data Analysis and Statistical Methods Statistics 651
 y 1 2 3 4 5 6 7 x Data Analysis and Statistical Methods Statistics 651 http://www.stat.tamu.edu/~suhasini/teaching.html Lecture 32 Suhasini Subba Rao Previous lecture We are interested in whether a dependent
Comparing Nested Models
 Comparing Nested Models ST 370 Two regression models are called nested if one contains all the predictors of the other, and some additional predictors. For example, the first-order model in two independent
Inference for Regression Inference about the Regression Model and Using the Regression Line
 Inference for Regression Inference about the Regression Model and Using the Regression Line PBS Chapter 10.1 and 10.2 2009 W.H. Freeman and Company Objectives (PBS Chapter 10.1 and 10.2) Inference about
CHAPTER EIGHT Linear Regression
 7 CHAPTER EIGHT Linear Regression 8. Scatter Diagram Example 8. A chemical engineer is investigating the effect of process operating temperature ( x ) on product yield ( y ). The study results in the following
Chapter 12: Linear regression II
 Chapter 12: Linear regression II Timothy Hanson Department of Statistics, University of South Carolina Stat 205: Elementary Statistics for the Biological and Life Sciences 1 / 14 12.4 The regression model
1 Multiple Regression
 1 Multiple Regression In this section, we extend the linear model to the case of several quantitative explanatory variables. There are many issues involved in this problem and this section serves only
Introduction and Single Predictor Regression. Correlation
 Introduction and Single Predictor Regression Dr. J. Kyle Roberts Southern Methodist University Simmons School of Education and Human Development Department of Teaching and Learning Correlation A correlation
Lecture 1 Intro to Spatial and Temporal Data
 Lecture 1 Intro to Spatial and Temporal Data Dennis Sun Stanford University Stats 253 June 22, 2015 1 What is Spatial and Temporal Data? 2 Trend Modeling 3 Omitted Variables 4 Overview of this Class 1
Additional Notes: Investigating a Random Slope. When we have fixed level-1 predictors at level 2 we show them like this:
 Ron Heck, Summer 01 Seminars 1 Multilevel Regression Models and Their Applications Seminar Additional Notes: Investigating a Random Slope We can begin with Model 3 and add a Random slope parameter. If
Variance. Standard deviation VAR = = value. Unbiased SD = SD = 10/23/2011. Functional Connectivity Correlation and Regression.
 10/3/011 Functional Connectivity Correlation and Regression Variance VAR = Standard deviation Standard deviation SD = Unbiased SD = 1 10/3/011 Standard error Confidence interval SE = CI = = t value for
Chapter 23. Inference About Means
 Chapter 23 Inference About Means 1 /57 Homework p554 2, 4, 9, 10, 13, 15, 17, 33, 34 2 /57 Objective Students test null and alternate hypotheses about a population mean. 3 /57 Here We Go Again Now that
MODELS WITHOUT AN INTERCEPT
 Consider the balanced two factor design MODELS WITHOUT AN INTERCEPT Factor A 3 levels, indexed j 0, 1, 2; Factor B 5 levels, indexed l 0, 1, 2, 3, 4; n jl 4 replicate observations for each factor level
Stat 401B Exam 2 Fall 2015
 Stat 401B Exam Fall 015 I have neither given nor received unauthorized assistance on this exam. Name Signed Date Name Printed ATTENTION! Incorrect numerical answers unaccompanied by supporting reasoning
Example: Data from the Child Health and Development Study
 Example: Data from the Child Health and Development Study Can we use linear regression to examine how well length of gesta:onal period predicts birth weight? First look at the sca@erplot: Does a linear
Regression, Part I. - In correlation, it would be irrelevant if we changed the axes on our graph.
 Regression, Part I I. Difference from correlation. II. Basic idea: A) Correlation describes the relationship between two variables, where neither is independent or a predictor. - In correlation, it would
Correlation Analysis
 Simple Regression Correlation Analysis Correlation analysis is used to measure strength of the association (linear relationship) between two variables Correlation is only concerned with strength of the
Stat 5102 Final Exam May 14, 2015
 Stat 5102 Final Exam May 14, 2015 Name Student ID The exam is closed book and closed notes. You may use three 8 1 11 2 sheets of paper with formulas, etc. You may also use the handouts on brand name distributions
STAT 3022 Spring 2007
 Simple Linear Regression Example These commands reproduce what we did in class. You should enter these in R and see what they do. Start by typing > set.seed(42) to reset the random number generator so
STA 101 Final Review
 STA 101 Final Review Statistics 101 Thomas Leininger June 24, 2013 Announcements All work (besides projects) should be returned to you and should be entered on Sakai. Office Hour: 2 3pm today (Old Chem
1.) Fit the full model, i.e., allow for separate regression lines (different slopes and intercepts) for each species
 Fit the full model, i.e., allow for separate regression lines (different slopes and intercepts) for each species") Lecture notes 2/22/2000 Dummy variables and extra SS F-test Page 1 Crab claw size and closing force. Problem 7.25, 10.9, and 10.10 Regression for all species at once, i.e., include dummy variables for
Lecture notes 2/22/2000 Dummy variables and extra SS F-test Page 1 Crab claw size and closing force. Problem 7.25, 10.9, and 10.10 Regression for all species at once, i.e., include dummy variables for
Linear Regression Model. Badr Missaoui
 Linear Regression Model Badr Missaoui Introduction What is this course about? It is a course on applied statistics. It comprises 2 hours lectures each week and 1 hour lab sessions/tutorials. We will focus
Chapter 16. Simple Linear Regression and dcorrelation
 Chapter 16 Simple Linear Regression and dcorrelation 16.1 Regression Analysis Our problem objective is to analyze the relationship between interval variables; regression analysis is the first tool we will
Econometrics. 4) Statistical inference
 Statistical inference") 30C00200 Econometrics 4) Statistical inference Timo Kuosmanen Professor, Ph.D. http://nomepre.net/index.php/timokuosmanen Today s topics Confidence intervals of parameter estimates Student s t-distribution
30C00200 Econometrics 4) Statistical inference Timo Kuosmanen Professor, Ph.D. http://nomepre.net/index.php/timokuosmanen Today s topics Confidence intervals of parameter estimates Student s t-distribution
Stat 500 Midterm 2 8 November 2007 page 0 of 4
 Stat 500 Midterm 2 8 November 2007 page 0 of 4 Please put your name on the back of your answer book. Do NOT put it on the front. Thanks. DO NOT START until I tell you to. You are welcome to read this front
9. Linear Regression and Correlation
 9. Linear Regression and Correlation Data: y a quantitative response variable x a quantitative explanatory variable (Chap. 8: Recall that both variables were categorical) For example, y = annual income,
Regression and Models with Multiple Factors. Ch. 17, 18
 Regression and Models with Multiple Factors Ch. 17, 18 Mass 15 20 25 Scatter Plot 70 75 80 Snout-Vent Length Mass 15 20 25 Linear Regression 70 75 80 Snout-Vent Length Least-squares The method of least
Multiple Regression Analysis. Part III. Multiple Regression Analysis
 Part III Multiple Regression Analysis As of Sep 26, 2017 1 Multiple Regression Analysis Estimation Matrix form Goodness-of-Fit R-square Adjusted R-square Expected values of the OLS estimators Irrelevant
STAT Chapter 11: Regression
 STAT 515 -- Chapter 11: Regression Mostly we have studied the behavior of a single random variable. Often, however, we gather data on two random variables. We wish to determine: Is there a relationship
Announcements. Unit 7: Multiple linear regression Lecture 3: Confidence and prediction intervals + Transformations. Uncertainty of predictions
 Housekeeping Announcements Unit 7: Multiple linear regression Lecture 3: Confidence and prediction intervals + Statistics 101 Mine Çetinkaya-Rundel November 25, 2014 Poster presentation location: Section
Math 3339 Homework 2 (Chapter 2, 9.1 & 9.2)
") Math 3339 Homework 2 (Chapter 2, 9.1 & 9.2) Name: PeopleSoft ID: Instructions: Homework will NOT be accepted through email or in person. Homework must be submitted through CourseWare BEFORE the deadline.
Math 3339 Homework 2 (Chapter 2, 9.1 & 9.2) Name: PeopleSoft ID: Instructions: Homework will NOT be accepted through email or in person. Homework must be submitted through CourseWare BEFORE the deadline.
Nature vs. nurture? Lecture 18 - Regression: Inference, Outliers, and Intervals. Regression Output. Conditions for inference.
 Understanding regression output from software Nature vs. nurture? Lecture 18 - Regression: Inference, Outliers, and Intervals In 1966 Cyril Burt published a paper called The genetic determination of differences
Unit5: Inferenceforcategoricaldata. 4. MT2 Review. Sta Fall Duke University, Department of Statistical Science
 Unit5: Inferenceforcategoricaldata 4. MT2 Review Sta 101 - Fall 2015 Duke University, Department of Statistical Science Dr. Çetinkaya-Rundel Slides posted at http://bit.ly/sta101_f15 Outline 1. Housekeeping
Big Data Analysis with Apache Spark UC#BERKELEY
 Big Data Analysis with Apache Spark UC#BERKELEY This Lecture: Relation between Variables An association A trend» Positive association or Negative association A pattern» Could be any discernible shape»
Multiple Linear Regression
 Multiple Linear Regression ST 430/514 Recall: a regression model describes how a dependent variable (or response) Y is affected, on average, by one or more independent variables (or factors, or covariates).
Chapter 5 Friday, May 21st
 Chapter 5 Friday, May 21 st Overview In this Chapter we will see three different methods we can use to describe a relationship between two quantitative variables. These methods are: Scatterplot Correlation
Biostatistics for physicists fall Correlation Linear regression Analysis of variance
 Biostatistics for physicists fall 2015 Correlation Linear regression Analysis of variance Correlation Example: Antibody level on 38 newborns and their mothers There is a positive correlation in antibody
Business Statistics. Lecture 5: Confidence Intervals
 Business Statistics Lecture 5: Confidence Intervals Goals for this Lecture Confidence intervals The t distribution 2 Welcome to Interval Estimation! Moments Mean 815.0340 Std Dev 0.8923 Std Error Mean
Model Specification and Data Problems. Part VIII
 Part VIII Model Specification and Data Problems As of Oct 24, 2017 1 Model Specification and Data Problems RESET test Non-nested alternatives Outliers A functional form misspecification generally means
Variance Decomposition and Goodness of Fit
 Variance Decomposition and Goodness of Fit 1. Example: Monthly Earnings and Years of Education In this tutorial, we will focus on an example that explores the relationship between total monthly earnings
Section Least Squares Regression
 Section 2.3 - Least Squares Regression Statistics 104 Autumn 2004 Copyright c 2004 by Mark E. Irwin Regression Correlation gives us a strength of a linear relationship is, but it doesn t tell us what it
AMS-207: Bayesian Statistics
 Linear Regression How does a quantity y, vary as a function of another quantity, or vector of quantities x? We are interested in p(y θ, x) under a model in which n observations (x i, y i ) are exchangeable.
SLR output RLS. Refer to slr (code) on the Lecture Page of the class website.
 on the Lecture Page of the class website.") SLR output RLS Refer to slr (code) on the Lecture Page of the class website. Old Faithful at Yellowstone National Park, WY: Simple Linear Regression (SLR) Analysis SLR analysis explores the linear association
SLR output RLS Refer to slr (code) on the Lecture Page of the class website. Old Faithful at Yellowstone National Park, WY: Simple Linear Regression (SLR) Analysis SLR analysis explores the linear association
Topic 10 - Linear Regression
 Topic 10 - Linear Regression Least squares principle Hypothesis tests/confidence intervals/prediction intervals for regression 1 Linear Regression How much should you pay for a house? Would you consider
TMA 4275 Lifetime Analysis June 2004 Solution
 TMA 4275 Lifetime Analysis June 2004 Solution Problem 1 a) Observation of the outcome is censored, if the time of the outcome is not known exactly and only the last time when it was observed being intact,
Statistiek II. John Nerbonne. March 17, Dept of Information Science incl. important reworkings by Harmut Fitz
 Dept of Information Science j.nerbonne@rug.nl incl. important reworkings by Harmut Fitz March 17, 2015 Review: regression compares result on two distinct tests, e.g., geographic and phonetic distance of
Applied Regression Modeling: A Business Approach Chapter 2: Simple Linear Regression Sections
 Applied Regression Modeling: A Business Approach Chapter 2: Simple Linear Regression Sections 2.1 2.3 by Iain Pardoe 2.1 Probability model for and 2 Simple linear regression model for and....................................
Estimating σ 2. We can do simple prediction of Y and estimation of the mean of Y at any value of X.
 Estimating σ 2 We can do simple prediction of Y and estimation of the mean of Y at any value of X. To perform inferences about our regression line, we must estimate σ 2, the variance of the error term.
Chapter 16. Simple Linear Regression and Correlation
 Chapter 16 Simple Linear Regression and Correlation 16.1 Regression Analysis Our problem objective is to analyze the relationship between interval variables; regression analysis is the first tool we will
Chapter 24. Comparing Means
 Chapter 4 Comparing Means!1 /34 Homework p579, 5, 7, 8, 10, 11, 17, 31, 3! /34 !3 /34 Objective Students test null and alternate hypothesis about two!4 /34 Plot the Data The intuitive display for comparing
Final Exam - Solutions
 Ecn 102 - Analysis of Economic Data University of California - Davis March 19, 2010 Instructor: John Parman Final Exam - Solutions You have until 5:30pm to complete this exam. Please remember to put your
Lecture 2. The Simple Linear Regression Model: Matrix Approach
 Lecture 2 The Simple Linear Regression Model: Matrix Approach Matrix algebra Matrix representation of simple linear regression model 1 Vectors and Matrices Where it is necessary to consider a distribution
SCHOOL OF MATHEMATICS AND STATISTICS. Linear and Generalised Linear Models
 SCHOOL OF MATHEMATICS AND STATISTICS Linear and Generalised Linear Models Autumn Semester 2017 18 2 hours Attempt all the questions. The allocation of marks is shown in brackets. RESTRICTED OPEN BOOK EXAMINATION
Section 9.4. Notation. Requirements. Definition. Inferences About Two Means (Matched Pairs) Examples
 Examples") Objective Section 9.4 Inferences About Two Means (Matched Pairs) Compare of two matched-paired means using two samples from each population. Hypothesis Tests and Confidence Intervals of two dependent means
Objective Section 9.4 Inferences About Two Means (Matched Pairs) Compare of two matched-paired means using two samples from each population. Hypothesis Tests and Confidence Intervals of two dependent means
Lecture 11: Simple Linear Regression
 Lecture 11: Simple Linear Regression Readings: Sections 3.1-3.3, 11.1-11.3 Apr 17, 2009 In linear regression, we examine the association between two quantitative variables. Number of beers that you drink
STAT420 Midterm Exam. University of Illinois Urbana-Champaign October 19 (Friday), :00 4:15p. SOLUTIONS (Yellow)
, :00 4:15p. SOLUTIONS (Yellow)") STAT40 Midterm Exam University of Illinois Urbana-Champaign October 19 (Friday), 018 3:00 4:15p SOLUTIONS (Yellow) Question 1 (15 points) (10 points) 3 (50 points) extra ( points) Total (77 points) Points
STAT40 Midterm Exam University of Illinois Urbana-Champaign October 19 (Friday), 018 3:00 4:15p SOLUTIONS (Yellow) Question 1 (15 points) (10 points) 3 (50 points) extra ( points) Total (77 points) Points
Interactions. Interactions. Lectures 1 & 2. Linear Relationships. y = a + bx. Slope. Intercept
 Interactions Lectures 1 & Regression Sometimes two variables appear related: > smoking and lung cancers > height and weight > years of education and income > engine size and gas mileage > GMAT scores and
Recall, Positive/Negative Association:
 ANNOUNCEMENTS: Remember that discussion today is not for credit. Go over R Commander. Go to 192 ICS, except at 4pm, go to 192 or 174 ICS. TODAY: Sections 5.3 to 5.5. Note this is a change made in the daily
Math Section MW 1-2:30pm SR 117. Bekki George 206 PGH
 Math 3339 Section 21155 MW 1-2:30pm SR 117 Bekki George bekki@math.uh.edu 206 PGH Office Hours: M 11-12:30pm & T,TH 10:00 11:00 am and by appointment Linear Regression (again) Consider the relationship
Multiple Regression Part I STAT315, 19-20/3/2014
 Multiple Regression Part I STAT315, 19-20/3/2014 Regression problem Predictors/independent variables/features Or: Error which can never be eliminated. Our task is to estimate the regression function f.
10.1 Simple Linear Regression
 10.1 Simple Linear Regression Ulrich Hoensch Tuesday, December 1, 2009 The Simple Linear Regression Model We have two quantitative random variables X (the explanatory variable) and Y (the response variable).
Lecture 2 Simple Linear Regression STAT 512 Spring 2011 Background Reading KNNL: Chapter 1
 Lecture Simple Linear Regression STAT 51 Spring 011 Background Reading KNNL: Chapter 1-1 Topic Overview This topic we will cover: Regression Terminology Simple Linear Regression with a single predictor
Introduction to Linear Regression
 Introduction to Linear Regression James H. Steiger Department of Psychology and Human Development Vanderbilt University James H. Steiger (Vanderbilt University) Introduction to Linear Regression 1 / 46
Business Statistics 41000: Homework # 5
 Business Statistics 41000: Homework # 5 Drew Creal Due date: Beginning of class in week # 10 Remarks: These questions cover Lectures #7, 8, and 9. Question # 1. Condence intervals and plug-in predictive
a. The least squares estimators of intercept and slope are (from JMP output): b 0 = 6.25 b 1 =
: b 0 = 6.25 b 1 =") Stat 28 Fall 2004 Key to Homework Exercise.10 a. There is evidence of a linear trend: winning times appear to decrease with year. A straight-line model for predicting winning times based on year is: Winning
Stat 28 Fall 2004 Key to Homework Exercise.10 a. There is evidence of a linear trend: winning times appear to decrease with year. A straight-line model for predicting winning times based on year is: Winning
Applied Regression Analysis
 Applied Regression Analysis Chapter 3 Multiple Linear Regression Hongcheng Li April, 6, 2013 Recall simple linear regression 1 Recall simple linear regression 2 Parameter Estimation 3 Interpretations of
Module 11: Linear Regression. Rebecca C. Steorts
 Module 11: Linear Regression Rebecca C. Steorts Announcements Today is the last class Homework 7 has been extended to Thursday, April 20, 11 PM. There will be no lab tomorrow. There will be office hours
χ L = χ R =
 Chapter 7 3C: Examples of Constructing a Confidence Interval for the true value of the Population Standard Deviation σ for a Normal Population. Example 1 Construct a 95% confidence interval for the true