Data Analysis and Machine Learning Lecture 12: Multicollinearity, Bias-Variance Trade-off, Cross-validation and Shrinkage Methods.
|
|
|
- Peter Turner
- 5 years ago
- Views:
Transcription


1 TheThalesians Itiseasyforphilosopherstoberichiftheychoose Data Analysis and Machine Learning Lecture 12: Multicollinearity, Bias-Variance Trade-off, Cross-validation and Shrinkage Methods Ivan Zhdankin Guest Speaker, Imperial College London
2 Multicollinearity Reminder from previous lectures: Linear regression model with y-intercept in matrix form For n N, p N, i [1,..., n], or, in matrix form, y i = β 0 + β 1 x i β p x ip + ɛ i, y = X β + ɛ, where y 1 1 x 1 1 x 11 x 12 x 1p β 0 ɛ 1 y 2 1 x y =, X = 2 1 x 21 x 22 x 2p β 1 ɛ 2 =......, β =, ɛ = y n 1 x n 1 x n1 x n2 x np β p ɛ n ˆβ = (X X) 1 X y [ ] Var ˆβ = σ 2 (X X) 1
3 Multicollinearity Now, suppose we have correlated regressors: Perfect collinearity - a situation when there are two regressors X k, X l (or more) that are perfectly collinear: 0, 1 such that X l = X k In this case ˆβ = (X X) 1 X y can not be calculated as X X is not invertible (Why?) Collinearity - a situation when there are two regressors X k, X l that have high degree of correlation with each other, but X k, X l are not perfectly collinear Multicollinearity - a situation when two or more regressors have high degree of correlation, but not perfect [ ] As Var ˆβ = σ 2 (X X) 1, multicollinearity means large amount of uncertainty around coefficient which means that estimator is not precise large confidence intervals and less accurate hypothesis testing
4 Multicollinearity Multicollinearity leads to large variance of estimators (i): Let us show that for j [1,..., p] [ ] σ Var ˆβj = 2 SST j (1 Rj 2 ) where SST j = n i=1(x ij x j ) 2 is a total sample variation in x j, and Rj 2 is r-squared from regressing x j on all other regressors including intercept From OLS minimization problem we know that: for all j [1,..., p] n n û i = i=1 i=1 n n x ij û i = i=1 i=1 (y i βˆ 0 βˆ 1 x i1... βˆ p x ip ) = 0 x ij (y i ˆ β 0 ˆ β 1 x i1... ˆ β p x ip ) = 0 Let us prove the equality for β 1 : write x i1 in terms of its fitted value and residual from the regression of x 1 on x 2, x 3,..., x p : x i1 = ˆx i1 + ˆr i1 Plug in and get n i=1 (ˆx i1 + ˆr i1 )(y i βˆ 0 βˆ 1 x i1... βˆ p x ip ) = 0 Since ˆx i1 is just a linear function of the explanatory variables n i=1 ˆx i1û i = 0. Thus we get: n i=1 ˆr i1 (y i ˆ β 0 ˆ β 1 x i1... ˆ β p x ip ) = 0
5 Multicollinearity Multicollinearity leads to large variance of estimators (ii): As ˆr i1 are the residuals n i=1 ˆr i1x ij = 0 for j [2,..., p]. And we have Substituting y i and rearranging: n i=1 ˆr i1 (y i ˆ β 1 x i1 ) = 0 ˆβ 1 = β 1 + n i=1 ˆr i1u i n i=1 ˆr2 i1 Given random sample u i are independent, ˆr i1 are non random conditional on X: Var [ ˆβ 1 X ] = n i=1 ˆr2 i1 Var [u i X] ( n = σ2 i=1 ˆr2 i1 )2 n i=1 ˆr2 i1 = σ 2 SST 1 (1 R 2 1 )
6 Multicollinearity Consequences of multicollinearity: Good news: Multicollinearity has no much impact on overall predictability of the model and overall R 2 Bad news: Some variables may be dropped from the model although, they are important in the population High variance of coefficients may reduce the precision of its estimation Multicollinearity can result in coefficients appearing to have the wrong sign Estimates of coefficients may be sensitive to particular sets of sample data Overfitting issues
7 Bias-Variance Trade-off Overfitting vs Underfitting When we deal with supervised machine learning it is important to understand the errors of predictions, which can be decomposed into the two main components: Error due to Bias : The error due to bias is taken as the difference between the expected (or average) prediction of our model and the correct value which we are trying to predict. Bias measures how far off in general these models predictions are from the correct value. High bias can cause an algorithm to miss the relevant relations between features and target outputs Underfitting issues Error due to Variance : The error from sensitivity to small fluctuations in the training set. High variance can cause an algorithm to model the random noise in the training data, rather than the intended outputs Overfitting issues Consider general case: assume we want to predict Y using X. Assume there is relationship: Y = f(x) + ɛ, where ɛ (0, σ 2 ɛ ) We may estimate our model f(x) as ˆf(X) and want to understand how well ˆf( ) fits some future random observation: (x 0, y 0 )? If ˆf(X) is a good model, then ˆf(x0 ) should be close to y 0 - this is a notion of prediction error Prediction error is estimated as PE(x 0 ) = E[(Y ˆf(x0 )) 2 ]
8 Bias-Variance Trade-off Bias-Variance trade-off: derivation Let us prove the Bias-Variance trade-off: PE(x 0 ) = E[(Y ˆf(x0 )) 2 ] = E[Y 2 + ˆf(x0 ) 2 2Yˆf(x0 )] = E[Y 2 ] + E[ˆf(x0 ) 2 ] E[2Yˆf(x0 )] = Var [Y] + (E[Y]) 2 + Var [ˆf(x0 ) ] + (E[ˆf(x0 )]) 2 2f(x 0 )E[ˆf(x0 )] = Var [Y] + Var [ˆf(x0 ) ] + (f(x o ) E[ˆf(x0 )]) 2 = σ 2 ɛ + Variance + Bias 2 σɛ 2 - the irreducible error, the noise term that cannot fundamentally be reduced by any model Given the true model and infinite data to calibrate it, we should be able to reduce both the bias and variance terms to 0. However, in a world with imperfect models and finite data, there is a tradeoff between minimizing the bias and minimizing the variance As model becomes more complex (more terms included), local structure/curvature can be picked up But coefficient estimates suffer from high variance as more terms are included in the model
9 Cross-Validation Cross-Validation In Statistics, method that splits the data into training and validation sets is defined as cross-validation Typical split for cross-validation could be 70% / 30% or 80% / 20% When working with data, given we have enough of it, we can split the data into three sets: Training sample - is used to estimate or fit (relatively small) set of models. For example, we can use set of linear model with different number of features and estimate ˆβ OLS Validation sample - is used to pick which model that is best based on how it predicting the Y-values for validation data, to determine the right level of complexity (number of regressors in linear model) or the structure (linear vs non-linear) Test sample - once the model is selected from previous two samples one can use the training sample and validation sample to re-fit the data and do final check in test sample There are several ways to do cross-validation: Leave-N-out cross-validation - involves using N observations as the validation set and the remaining observations as the training set. This is repeated on all ways to cut the original sample on a validation set of N observations and a training set (How many?) K-fold cross-validation - the original sample is randomly partitioned into K equal sized subsamples. Of the K subsamples, a single subsample is retained as the validation data for testing the model, and the remaining K 1 subsamples are used as training data. The cross-validation process is then repeated K times (the folds), with each of the K subsamples used exactly once as the validation data. The K results from the folds can then be averaged to produce a single measure of fit Measure of fit for cross-validation could be: MSE - mean squared error: 1 n n i=1(ŷ i Y i ) 2 1 RMSE - root of mean squared error: n n i=1(ŷ i Y i ) 2 MAD - median absolute deviation: median Ŷ i Y i
10 Cross-Validation Training and Validation Samples On the training sample, the MSE always goes down as the model ˆf(X) becomes more complex as has more parameters The more flexibility you have in fitting the model, the closer you should be able to come to a perfect fit - extreme case when n = p for least squares estimation On the validation sample, the MSE goes down up to some point as the model complexity increases After that point the MSE starts to increase because of overfitting the training sample when the model complexity is high Overfitting - when a model is fit to a dataset and that has sufficient complexity to start fitting random features in the data. The bias of the model will typically go down, but the variance will have increased because the model is fitting the noise in the data Very important idea: MSE will decrease but then increase on the validation sample while it will continue to decrease on the training data
11 Cross-Validation Bias-Variance: Example (i)

12 Cross-Validation Bias-Variance: Example (ii)

13 Cross-Validation Bias-Variance: Example (iii) MSE for training and validation sets: Coefficients have higher variance as complexity increases:
 1 p For regularization it is importance to have the data normalized - as we do not")
14 Ridge Regression Ridge regression - L 2 regularization Regularization is a method for solving problems of overfitting or problems with large variance The method involves introducing additional penalty in the form of shrinkage of the coefficient estimates Generally, L p regularization is used: L p = ( β i p ) 1 p For regularization it is importance to have the data normalized - as we do not want to punish the coefficient just because the corresponding regressors are large in magnitude For Ridge regression L 2 norm is used: n minimize (y i β T x i ) 2 i=1 s.t. p β 2 j j=1 t minimize[(y X β) T (Y X β) + β T β]
15 Ridge Regression Derivation of Ridge-estimator Theorem ˆβ Ridge = (X X + I p ) 1 X y Proof. ( RSS = y X β Ridge = y y 2y X β Ridge ) ( y X β Ridge ) + β Ridge X X β Ridge + β Ridge Ridge β + β Ridge Ridge β RSS = β Ridge 2X y + 2X X β Ridge + 2I p β Ridge = 0 ˆβ Ridge = (X X + I p ) 1 X y Several observations on - a shrinkage parameter: control the size of coefficients control amount of regularization As 0 we get ˆβ Ridge = ˆβ OLS As we get ˆβ Ridge = 0
16 Ridge Regression Statistical properties of Ridge-estimator Ridge estimator is biased: Let A = X X, then ˆβ Ridge = (X X + I p ) 1 X y = (A + I p ) 1 A ( A 1 X y ) = [A ( I p + A 1) ] 1 A[(X X) 1 X y] = ( I p + A 1) 1 A 1 A ˆβ OLS = ( Ip + A 1) 1 ˆβ OLS Now, let us find the variance of ˆβ Ridge : Let W = ( I p + A 1) 1, then Var [ ˆβ Ridge E[ ˆβ Ridge ] = ( I p + A 1) 1 β ] = Var [ W ˆβ OLS ] = W Var [ ˆβ OLS ] W = σ 2 W (X X) 1 W = σ 2 [X X + I p ] 1 X X ( [X X + I p ] 1) T Recall the Bias-Variance formula for MSE of estimators: MSE = E[( ˆΘ Θ) 2 ] = E[(( ˆΘ E[ ˆΘ]) (Θ E[ ˆΘ])) 2 ] = E[ ˆΘ E[ ˆΘ]] 2 + E[(Θ E[ ˆΘ]) 2 ] 2E[( ˆΘ E[ ˆΘ])(Θ E[ ˆΘ])] = Var[ ˆΘ] + [Bias( ˆΘ)] 2 It appears that : MSE[ ˆβ Ridge ] < MSE[ ˆβ OLS ] [Theobald, 1974] - this is the reason why the Ridge regression is usefull
17 Ridge Regression Geometric interpretation(i) Assume centered inputs around its principal components: so X = UD, where U and D come from SVD - singular-value decomposition: X = UDV. We can assume that Consider: X = ( X 1,..., X p ) = (Xv 1,..., Xv p ) ( ) ŷ = X ˆβ Ridge = X X 1 ( ) p X + Ip X y = UD D I p DU dj y = 2 u j j=1 dj 2 + u j y where u j are principal components of X and d j - its singular values (How they relate to eigenvalues?) Ridge regression shrinks the coordinates with respect to the orthogonal basis formed by the principal components From above we have: ˆβ Ridge j = d2 j dj 2 + u j y Var [ ˆβ OLS ] = σ2 d 2 j d j 2 Shrinkage factor: d j 2 + Coordinates with respect to principal components with smaller variance shrinks more (What does it mean with respect to multicollinearity?)
18 Ridge Regression Geometric interpretation(ii)
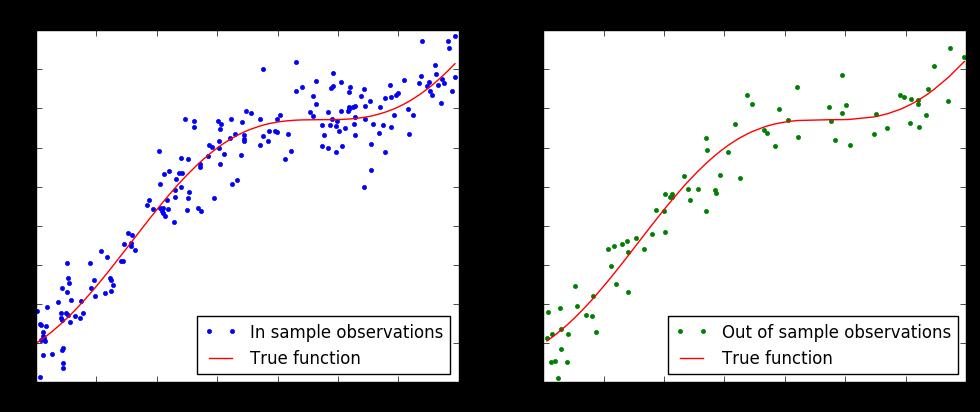
19 Ridge Regression Ridge regression: Example(i) Suppose we want to understand the curve in the tail of losses for the purpose to calculate Expected Shortfall. We have the following observations in-sample and want to fit them as good as possible out-of-sample:
20 Ridge Regression Ridge regression: Example(ii) We can fit the curve by polynomial regression with some number of powers, in this case 25
21 Ridge Regression Ridge regression: Example(iii) Apply R-packages glmnet to perform Ridge regression and cv.glmnet to perform 10-fold cross-validation:
22 Ridge Regression Ridge regression: Example(iiii) Ridge regression improves out-of-sample MSE by 30% as compared to OLS regression:
 2 i=1 s.t.")
23 Lasso Regression Lasso regression - L 1 regularization For Lasso regression L 1 norm is used: n minimize (y i β T x i ) 2 i=1 s.t. p j=1 β j t minimize[(y X β) T (Y X β) + p j=1 β j ] Large enough will set some of the coefficients exactly to 0 So the Lasso performs model selection - it is said to produce sparse solutions for us Difficult to solve analytically as cost function contains absolute values
24 Lasso Regression Lasso regression: Example(i) Lasso regression equal some coefficients to zero for large enough whereas Ridge just shrinks them:
25 Lasso Regression Lasso regression: Example(ii) Overall out-of-sample performance of Lasso regression is comparable to Ridge regression:
26 Conclusion Take it from the lecture Multicollinearity increases the variance of coefficients leading to misunderstanding of them but does not impact overall predictability of the model - total R 2 There is Bias-Variance trade-off: the model can underfit leading to high Bias when it is too simple, but when it is too complex it can overfit leading to high Variance of prediction errors With in crease in complexity prediction errors on training set always decrease, but on validation set it decreases up to some point after which prediction errors increase In Machine Learning one needs to use the cross validation techniques as the model is crap if we only can predict the past Ridge regression penalises the coefficients with large variance by L 2 norm shrinking them, that leads to the Bias in coefficient s estimators however decreases the Variance of them There is optimal that allows Ridge to outperform Least Squares in terms of MSE of the estimator Lasso regression penalises the coefficients by L 1 norm shrinking them and equating some of them to zero that allows to perform feature selection
Linear Methods for Regression. Lijun Zhang
 Linear Methods for Regression Lijun Zhang zlj@nju.edu.cn http://cs.nju.edu.cn/zlj Outline Introduction Linear Regression Models and Least Squares Subset Selection Shrinkage Methods Methods Using Derived
Data Mining Stat 588
 Data Mining Stat 588 Lecture 02: Linear Methods for Regression Department of Statistics & Biostatistics Rutgers University September 13 2011 Regression Problem Quantitative generic output variable Y. Generic
Machine Learning. Lecture 9: Learning Theory. Feng Li.
 Machine Learning Lecture 9: Learning Theory Feng Li fli@sdu.edu.cn https://funglee.github.io School of Computer Science and Technology Shandong University Fall 2018 Why Learning Theory How can we tell
ISyE 691 Data mining and analytics
 ISyE 691 Data mining and analytics Regression Instructor: Prof. Kaibo Liu Department of Industrial and Systems Engineering UW-Madison Email: kliu8@wisc.edu Office: Room 3017 (Mechanical Engineering Building)
Prediction & Feature Selection in GLM
 Tarigan Statistical Consulting & Coaching statistical-coaching.ch Doctoral Program in Computer Science of the Universities of Fribourg, Geneva, Lausanne, Neuchâtel, Bern and the EPFL Hands-on Data Analysis
Machine Learning for OR & FE
 Machine Learning for OR & FE Supervised Learning: Regression I Martin Haugh Department of Industrial Engineering and Operations Research Columbia University Email: martin.b.haugh@gmail.com Some of the
Lecture 14: Shrinkage
 Lecture 14: Shrinkage Reading: Section 6.2 STATS 202: Data mining and analysis October 27, 2017 1 / 19 Shrinkage methods The idea is to perform a linear regression, while regularizing or shrinking the
The prediction of house price
 000 001 002 003 004 005 006 007 008 009 010 011 012 013 014 015 016 017 018 019 020 021 022 023 024 025 026 027 028 029 030 031 032 033 034 035 036 037 038 039 040 041 042 043 044 045 046 047 048 049 050
Linear Regression Linear Regression with Shrinkage
 Linear Regression Linear Regression ith Shrinkage Introduction Regression means predicting a continuous (usually scalar) output y from a vector of continuous inputs (features) x. Example: Predicting vehicle
Linear Model Selection and Regularization
 Linear Model Selection and Regularization Recall the linear model Y = β 0 + β 1 X 1 + + β p X p + ɛ. In the lectures that follow, we consider some approaches for extending the linear model framework. In
Machine Learning for OR & FE
 Machine Learning for OR & FE Regression II: Regularization and Shrinkage Methods Martin Haugh Department of Industrial Engineering and Operations Research Columbia University Email: martin.b.haugh@gmail.com
9. Model Selection. statistical models. overview of model selection. information criteria. goodness-of-fit measures
 FE661 - Statistical Methods for Financial Engineering 9. Model Selection Jitkomut Songsiri statistical models overview of model selection information criteria goodness-of-fit measures 9-1 Statistical models
Dimension Reduction Methods
 Dimension Reduction Methods And Bayesian Machine Learning Marek Petrik 2/28 Previously in Machine Learning How to choose the right features if we have (too) many options Methods: 1. Subset selection 2.
GI07/COMPM012: Mathematical Programming and Research Methods (Part 2) 2. Least Squares and Principal Components Analysis. Massimiliano Pontil
 2. Least Squares and Principal Components Analysis. Massimiliano Pontil") GI07/COMPM012: Mathematical Programming and Research Methods (Part 2) 2. Least Squares and Principal Components Analysis Massimiliano Pontil 1 Today s plan SVD and principal component analysis (PCA) Connection
GI07/COMPM012: Mathematical Programming and Research Methods (Part 2) 2. Least Squares and Principal Components Analysis Massimiliano Pontil 1 Today s plan SVD and principal component analysis (PCA) Connection
Day 4: Shrinkage Estimators
 Day 4: Shrinkage Estimators Kenneth Benoit Data Mining and Statistical Learning March 9, 2015 n versus p (aka k) Classical regression framework: n > p. Without this inequality, the OLS coefficients have
Linear model selection and regularization
 Linear model selection and regularization Problems with linear regression with least square 1. Prediction Accuracy: linear regression has low bias but suffer from high variance, especially when n p. It
Introduction to Machine Learning Fall 2017 Note 5. 1 Overview. 2 Metric
 CS 189 Introduction to Machine Learning Fall 2017 Note 5 1 Overview Recall from our previous note that for a fixed input x, our measurement Y is a noisy measurement of the true underlying response f x):
Linear Regression Models. Based on Chapter 3 of Hastie, Tibshirani and Friedman
 Linear Regression Models Based on Chapter 3 of Hastie, ibshirani and Friedman Linear Regression Models Here the X s might be: p f ( X = " + " 0 j= 1 X j Raw predictor variables (continuous or coded-categorical
Regularization: Ridge Regression and the LASSO
 Agenda Wednesday, November 29, 2006 Agenda Agenda 1 The Bias-Variance Tradeoff 2 Ridge Regression Solution to the l 2 problem Data Augmentation Approach Bayesian Interpretation The SVD and Ridge Regression
Linear Model Selection and Regularization
 Linear Model Selection and Regularization Chapter 6 October 18, 2016 Chapter 6 October 18, 2016 1 / 80 1 Subset selection 2 Shrinkage methods 3 Dimension reduction methods (using derived inputs) 4 High
A Short Introduction to the Lasso Methodology
 A Short Introduction to the Lasso Methodology Michael Gutmann sites.google.com/site/michaelgutmann University of Helsinki Aalto University Helsinki Institute for Information Technology March 9, 2016 Michael
Linear Regression Linear Regression with Shrinkage
 Linear Regression Linear Regression ith Shrinkage Introduction Regression means predicting a continuous (usually scalar) output y from a vector of continuous inputs (features) x. Example: Predicting vehicle
Final Overview. Introduction to ML. Marek Petrik 4/25/2017
 Final Overview Introduction to ML Marek Petrik 4/25/2017 This Course: Introduction to Machine Learning Build a foundation for practice and research in ML Basic machine learning concepts: max likelihood,
Applied Machine Learning Annalisa Marsico
 Applied Machine Learning Annalisa Marsico OWL RNA Bionformatics group Max Planck Institute for Molecular Genetics Free University of Berlin 22 April, SoSe 2015 Goals Feature Selection rather than Feature
A Modern Look at Classical Multivariate Techniques
 A Modern Look at Classical Multivariate Techniques Yoonkyung Lee Department of Statistics The Ohio State University March 16-20, 2015 The 13th School of Probability and Statistics CIMAT, Guanajuato, Mexico
Machine Learning Linear Regression. Prof. Matteo Matteucci
 Machine Learning Linear Regression Prof. Matteo Matteucci Outline 2 o Simple Linear Regression Model Least Squares Fit Measures of Fit Inference in Regression o Multi Variate Regession Model Least Squares
MA 575 Linear Models: Cedric E. Ginestet, Boston University Regularization: Ridge Regression and Lasso Week 14, Lecture 2
 MA 575 Linear Models: Cedric E. Ginestet, Boston University Regularization: Ridge Regression and Lasso Week 14, Lecture 2 1 Ridge Regression Ridge regression and the Lasso are two forms of regularized
LINEAR REGRESSION, RIDGE, LASSO, SVR
 LINEAR REGRESSION, RIDGE, LASSO, SVR Supervised Learning Katerina Tzompanaki Linear regression one feature* Price (y) What is the estimated price of a new house of area 30 m 2? 30 Area (x) *Also called
Proteomics and Variable Selection
 Proteomics and Variable Selection p. 1/55 Proteomics and Variable Selection Alex Lewin With thanks to Paul Kirk for some graphs Department of Epidemiology and Biostatistics, School of Public Health, Imperial
Lecture 6: Methods for high-dimensional problems
 Lecture 6: Methods for high-dimensional problems Hector Corrada Bravo and Rafael A. Irizarry March, 2010 In this Section we will discuss methods where data lies on high-dimensional spaces. In particular,
Multiple (non) linear regression. Department of Computer Science, Czech Technical University in Prague
 linear regression. Department of Computer Science, Czech Technical University in Prague") Multiple (non) linear regression Jiří Kléma Department of Computer Science, Czech Technical University in Prague Lecture based on ISLR book and its accompanying slides http://cw.felk.cvut.cz/wiki/courses/b4m36san/start
Multiple (non) linear regression Jiří Kléma Department of Computer Science, Czech Technical University in Prague Lecture based on ISLR book and its accompanying slides http://cw.felk.cvut.cz/wiki/courses/b4m36san/start
Rirdge Regression. Szymon Bobek. Institute of Applied Computer science AGH University of Science and Technology
 Rirdge Regression Szymon Bobek Institute of Applied Computer science AGH University of Science and Technology Based on Carlos Guestrin adn Emily Fox slides from Coursera Specialization on Machine Learnign
COMP 551 Applied Machine Learning Lecture 3: Linear regression (cont d)
") COMP 551 Applied Machine Learning Lecture 3: Linear regression (cont d) Instructor: Herke van Hoof (herke.vanhoof@mail.mcgill.ca) Slides mostly by: Class web page: www.cs.mcgill.ca/~hvanho2/comp551 Unless
COMP 551 Applied Machine Learning Lecture 3: Linear regression (cont d) Instructor: Herke van Hoof (herke.vanhoof@mail.mcgill.ca) Slides mostly by: Class web page: www.cs.mcgill.ca/~hvanho2/comp551 Unless
Assignment 2 (Sol.) Introduction to Machine Learning Prof. B. Ravindran
 Introduction to Machine Learning Prof. B. Ravindran") Assignment 2 (Sol.) Introduction to Machine Learning Prof. B. Ravindran 1. Let A m n be a matrix of real numbers. The matrix AA T has an eigenvector x with eigenvalue b. Then the eigenvector y of A T A
Assignment 2 (Sol.) Introduction to Machine Learning Prof. B. Ravindran 1. Let A m n be a matrix of real numbers. The matrix AA T has an eigenvector x with eigenvalue b. Then the eigenvector y of A T A
Homoskedasticity. Var (u X) = σ 2. (23)
 = σ 2. (23)") Homoskedasticity How big is the difference between the OLS estimator and the true parameter? To answer this question, we make an additional assumption called homoskedasticity: Var (u X) = σ 2. (23) This
Homoskedasticity How big is the difference between the OLS estimator and the true parameter? To answer this question, we make an additional assumption called homoskedasticity: Var (u X) = σ 2. (23) This
Linear Regression. September 27, Chapter 3. Chapter 3 September 27, / 77
 Linear Regression Chapter 3 September 27, 2016 Chapter 3 September 27, 2016 1 / 77 1 3.1. Simple linear regression 2 3.2 Multiple linear regression 3 3.3. The least squares estimation 4 3.4. The statistical
MS&E 226. In-Class Midterm Examination Solutions Small Data October 20, 2015
 MS&E 226 In-Class Midterm Examination Solutions Small Data October 20, 2015 PROBLEM 1. Alice uses ordinary least squares to fit a linear regression model on a dataset containing outcome data Y and covariates
Regression Shrinkage and Selection via the Lasso
 Regression Shrinkage and Selection via the Lasso ROBERT TIBSHIRANI, 1996 Presenter: Guiyun Feng April 27 () 1 / 20 Motivation Estimation in Linear Models: y = β T x + ɛ. data (x i, y i ), i = 1, 2,...,
MS-C1620 Statistical inference
 MS-C1620 Statistical inference 10 Linear regression III Joni Virta Department of Mathematics and Systems Analysis School of Science Aalto University Academic year 2018 2019 Period III - IV 1 / 32 Contents
Introduction to Machine Learning and Cross-Validation
 Introduction to Machine Learning and Cross-Validation Jonathan Hersh 1 February 27, 2019 J.Hersh (Chapman ) Intro & CV February 27, 2019 1 / 29 Plan 1 Introduction 2 Preliminary Terminology 3 Bias-Variance
COMS 4771 Regression. Nakul Verma
 COMS 4771 Regression Nakul Verma Last time Support Vector Machines Maximum Margin formulation Constrained Optimization Lagrange Duality Theory Convex Optimization SVM dual and Interpretation How get the
Making sense of Econometrics: Basics
 Making sense of Econometrics: Basics Lecture 7: Multicollinearity Egypt Scholars Economic Society November 22, 2014 Assignment & feedback Multicollinearity enter classroom at room name c28efb78 http://b.socrative.com/login/student/
Econometrics I KS. Module 2: Multivariate Linear Regression. Alexander Ahammer. This version: April 16, 2018
 Econometrics I KS Module 2: Multivariate Linear Regression Alexander Ahammer Department of Economics Johannes Kepler University of Linz This version: April 16, 2018 Alexander Ahammer (JKU) Module 2: Multivariate
Lecture Data Science
 Web Science & Technologies University of Koblenz Landau, Germany Lecture Data Science Regression Analysis JProf. Dr. Last Time How to find parameter of a regression model Normal Equation Gradient Decent
Machine Learning - MT & 5. Basis Expansion, Regularization, Validation
 Machine Learning - MT 2016 4 & 5. Basis Expansion, Regularization, Validation Varun Kanade University of Oxford October 19 & 24, 2016 Outline Basis function expansion to capture non-linear relationships
Review of Econometrics
 Review of Econometrics Zheng Tian June 5th, 2017 1 The Essence of the OLS Estimation Multiple regression model involves the models as follows Y i = β 0 + β 1 X 1i + β 2 X 2i + + β k X ki + u i, i = 1,...,
Business Statistics. Tommaso Proietti. Model Evaluation and Selection. DEF - Università di Roma 'Tor Vergata'
 Business Statistics Tommaso Proietti DEF - Università di Roma 'Tor Vergata' Model Evaluation and Selection Predictive Ability of a Model: Denition and Estimation We aim at achieving a balance between parsimony
Bindel, Fall 2016 Matrix Computations (CS 6210) Notes for
 Notes for") 1 A cautionary tale Notes for 2016-10-05 You have been dropped on a desert island with a laptop with a magic battery of infinite life, a MATLAB license, and a complete lack of knowledge of basic geometry.
1 A cautionary tale Notes for 2016-10-05 You have been dropped on a desert island with a laptop with a magic battery of infinite life, a MATLAB license, and a complete lack of knowledge of basic geometry.
Business Statistics. Tommaso Proietti. Linear Regression. DEF - Università di Roma 'Tor Vergata'
 Business Statistics Tommaso Proietti DEF - Università di Roma 'Tor Vergata' Linear Regression Specication Let Y be a univariate quantitative response variable. We model Y as follows: Y = f(x) + ε where
Linear models and their mathematical foundations: Simple linear regression
 Linear models and their mathematical foundations: Simple linear regression Steffen Unkel Department of Medical Statistics University Medical Center Göttingen, Germany Winter term 2018/19 1/21 Introduction
An Introduction to Statistical Machine Learning - Theoretical Aspects -
 An Introduction to Statistical Machine Learning - Theoretical Aspects - Samy Bengio bengio@idiap.ch Dalle Molle Institute for Perceptual Artificial Intelligence (IDIAP) CP 592, rue du Simplon 4 1920 Martigny,
MS&E 226: Small Data
 MS&E 226: Small Data Lecture 6: Bias and variance (v5) Ramesh Johari ramesh.johari@stanford.edu 1 / 49 Our plan today We saw in last lecture that model scoring methods seem to be trading off two different
Regression, Ridge Regression, Lasso
 Regression, Ridge Regression, Lasso Fabio G. Cozman - fgcozman@usp.br October 2, 2018 A general definition Regression studies the relationship between a response variable Y and covariates X 1,..., X n.
Shrinkage Methods: Ridge and Lasso
 Shrinkage Methods: Ridge and Lasso Jonathan Hersh 1 Chapman University, Argyros School of Business hersh@chapman.edu February 27, 2019 J.Hersh (Chapman) Ridge & Lasso February 27, 2019 1 / 43 1 Intro and
IEOR 165 Lecture 7 1 Bias-Variance Tradeoff
 IEOR 165 Lecture 7 Bias-Variance Tradeoff 1 Bias-Variance Tradeoff Consider the case of parametric regression with β R, and suppose we would like to analyze the error of the estimate ˆβ in comparison to
Lecture 3: More on regularization. Bayesian vs maximum likelihood learning
 Lecture 3: More on regularization. Bayesian vs maximum likelihood learning L2 and L1 regularization for linear estimators A Bayesian interpretation of regularization Bayesian vs maximum likelihood fitting
Lecture 3: Statistical Decision Theory (Part II)
") Lecture 3: Statistical Decision Theory (Part II) Hao Helen Zhang Hao Helen Zhang Lecture 3: Statistical Decision Theory (Part II) 1 / 27 Outline of This Note Part I: Statistics Decision Theory (Classical
Lecture 3: Statistical Decision Theory (Part II) Hao Helen Zhang Hao Helen Zhang Lecture 3: Statistical Decision Theory (Part II) 1 / 27 Outline of This Note Part I: Statistics Decision Theory (Classical
MS&E 226: Small Data
 MS&E 226: Small Data Lecture 6: Model complexity scores (v3) Ramesh Johari ramesh.johari@stanford.edu Fall 2015 1 / 34 Estimating prediction error 2 / 34 Estimating prediction error We saw how we can estimate
COS513: FOUNDATIONS OF PROBABILISTIC MODELS LECTURE 10
 COS53: FOUNDATIONS OF PROBABILISTIC MODELS LECTURE 0 MELISSA CARROLL, LINJIE LUO. BIAS-VARIANCE TRADE-OFF (CONTINUED FROM LAST LECTURE) If V = (X n, Y n )} are observed data, the linear regression problem
Machine Learning CSE546 Carlos Guestrin University of Washington. September 30, 2013
 Bayesian Methods Machine Learning CSE546 Carlos Guestrin University of Washington September 30, 2013 1 What about prior n Billionaire says: Wait, I know that the thumbtack is close to 50-50. What can you
Sparse Linear Models (10/7/13)
") STA56: Probabilistic machine learning Sparse Linear Models (0/7/) Lecturer: Barbara Engelhardt Scribes: Jiaji Huang, Xin Jiang, Albert Oh Sparsity Sparsity has been a hot topic in statistics and machine
STA56: Probabilistic machine learning Sparse Linear Models (0/7/) Lecturer: Barbara Engelhardt Scribes: Jiaji Huang, Xin Jiang, Albert Oh Sparsity Sparsity has been a hot topic in statistics and machine
Modeling Data with Linear Combinations of Basis Functions. Read Chapter 3 in the text by Bishop
 Modeling Data with Linear Combinations of Basis Functions Read Chapter 3 in the text by Bishop A Type of Supervised Learning Problem We want to model data (x 1, t 1 ),..., (x N, t N ), where x i is a vector
Linear Regression. In this problem sheet, we consider the problem of linear regression with p predictors and one intercept,
 Linear Regression In this problem sheet, we consider the problem of linear regression with p predictors and one intercept, y = Xβ + ɛ, where y t = (y 1,..., y n ) is the column vector of target values,
cxx ab.ec Warm up OH 2 ax 16 0 axtb Fix any a, b, c > What is the x 2 R that minimizes ax 2 + bx + c
 Warm up D cai.yo.ie p IExrL9CxsYD Sglx.Ddl f E Luo fhlexi.si dbll Fix any a, b, c > 0. 1. What is the x 2 R that minimizes ax 2 + bx + c x a b Ta OH 2 ax 16 0 x 1 Za fhkxiiso3ii draulx.h dp.d 2. What is
STK-IN4300 Statistical Learning Methods in Data Science
 Outline of the lecture STK-I4300 Statistical Learning Methods in Data Science Riccardo De Bin debin@math.uio.no Model Assessment and Selection Cross-Validation Bootstrap Methods Methods using Derived Input
Applied Statistics and Econometrics
 Applied Statistics and Econometrics Lecture 6 Saul Lach September 2017 Saul Lach () Applied Statistics and Econometrics September 2017 1 / 53 Outline of Lecture 6 1 Omitted variable bias (SW 6.1) 2 Multiple
Reminders. Thought questions should be submitted on eclass. Please list the section related to the thought question
 Linear regression Reminders Thought questions should be submitted on eclass Please list the section related to the thought question If it is a more general, open-ended question not exactly related to a
Homework 1: Solutions
 Homework 1: Solutions Statistics 413 Fall 2017 Data Analysis: Note: All data analysis results are provided by Michael Rodgers 1. Baseball Data: (a) What are the most important features for predicting players
Statistical Methods for Data Mining
 Statistical Methods for Data Mining Kuangnan Fang Xiamen University Email: xmufkn@xmu.edu.cn Support Vector Machines Here we approach the two-class classification problem in a direct way: We try and find
A simulation study of model fitting to high dimensional data using penalized logistic regression
 A simulation study of model fitting to high dimensional data using penalized logistic regression Ellinor Krona Kandidatuppsats i matematisk statistik Bachelor Thesis in Mathematical Statistics Kandidatuppsats
12 Statistical Justifications; the Bias-Variance Decomposition
 Statistical Justifications; the Bias-Variance Decomposition 65 12 Statistical Justifications; the Bias-Variance Decomposition STATISTICAL JUSTIFICATIONS FOR REGRESSION [So far, I ve talked about regression
ECE521 week 3: 23/26 January 2017
 ECE521 week 3: 23/26 January 2017 Outline Probabilistic interpretation of linear regression - Maximum likelihood estimation (MLE) - Maximum a posteriori (MAP) estimation Bias-variance trade-off Linear
Ridge Regression 1. to which some random noise is added. So that the training labels can be represented as:
 CS 1: Machine Learning Spring 15 College of Computer and Information Science Northeastern University Lecture 3 February, 3 Instructor: Bilal Ahmed Scribe: Bilal Ahmed & Virgil Pavlu 1 Introduction Ridge
Linear Regression (9/11/13)
") STA561: Probabilistic machine learning Linear Regression (9/11/13) Lecturer: Barbara Engelhardt Scribes: Zachary Abzug, Mike Gloudemans, Zhuosheng Gu, Zhao Song 1 Why use linear regression? Figure 1: Scatter
STA561: Probabilistic machine learning Linear Regression (9/11/13) Lecturer: Barbara Engelhardt Scribes: Zachary Abzug, Mike Gloudemans, Zhuosheng Gu, Zhao Song 1 Why use linear regression? Figure 1: Scatter
9. Least squares data fitting
 L. Vandenberghe EE133A (Spring 2017) 9. Least squares data fitting model fitting regression linear-in-parameters models time series examples validation least squares classification statistics interpretation
9/26/17. Ridge regression. What our model needs to do. Ridge Regression: L2 penalty. Ridge coefficients. Ridge coefficients
 What our model needs to do regression Usually, we are not just trying to explain observed data We want to uncover meaningful trends And predict future observations Our questions then are Is β" a good estimate
Lecture 6: Linear Regression (continued)
") Lecture 6: Linear Regression (continued) Reading: Sections 3.1-3.3 STATS 202: Data mining and analysis October 6, 2017 1 / 23 Multiple linear regression Y = β 0 + β 1 X 1 + + β p X p + ε Y ε N (0, σ) i.i.d.
Lecture 6: Linear Regression (continued) Reading: Sections 3.1-3.3 STATS 202: Data mining and analysis October 6, 2017 1 / 23 Multiple linear regression Y = β 0 + β 1 X 1 + + β p X p + ε Y ε N (0, σ) i.i.d.
Polynomial Regression and Regularization
 Polynomial Regression and Regularization Administrivia o If you still haven t enrolled in Moodle yet Enrollment key on Piazza If joined course recently, email me to get added to Piazza o Homework 1 posted
Sparse regression. Optimization-Based Data Analysis. Carlos Fernandez-Granda
 Sparse regression Optimization-Based Data Analysis http://www.cims.nyu.edu/~cfgranda/pages/obda_spring16 Carlos Fernandez-Granda 3/28/2016 Regression Least-squares regression Example: Global warming Logistic
Understanding Generalization Error: Bounds and Decompositions
 CIS 520: Machine Learning Spring 2018: Lecture 11 Understanding Generalization Error: Bounds and Decompositions Lecturer: Shivani Agarwal Disclaimer: These notes are designed to be a supplement to the
STAT 462-Computational Data Analysis
 STAT 462-Computational Data Analysis Chapter 5- Part 2 Nasser Sadeghkhani a.sadeghkhani@queensu.ca October 2017 1 / 27 Outline Shrinkage Methods 1. Ridge Regression 2. Lasso Dimension Reduction Methods
CSE446: Linear Regression Regulariza5on Bias / Variance Tradeoff Winter 2015
 CSE446: Linear Regression Regulariza5on Bias / Variance Tradeoff Winter 2015 Luke ZeElemoyer Slides adapted from Carlos Guestrin Predic5on of con5nuous variables Billionaire says: Wait, that s not what
Regression I: Mean Squared Error and Measuring Quality of Fit
 Regression I: Mean Squared Error and Measuring Quality of Fit -Applied Multivariate Analysis- Lecturer: Darren Homrighausen, PhD 1 The Setup Suppose there is a scientific problem we are interested in solving
CMSC858P Supervised Learning Methods
 CMSC858P Supervised Learning Methods Hector Corrada Bravo March, 2010 Introduction Today we discuss the classification setting in detail. Our setting is that we observe for each subject i a set of p predictors
High-Dimensional Statistical Learning: Introduction
 Classical Statistics Biological Big Data Supervised and Unsupervised Learning High-Dimensional Statistical Learning: Introduction Ali Shojaie University of Washington http://faculty.washington.edu/ashojaie/
Introduction to Machine Learning
 Introduction to Machine Learning Linear Regression Varun Chandola Computer Science & Engineering State University of New York at Buffalo Buffalo, NY, USA chandola@buffalo.edu Chandola@UB CSE 474/574 1
Ridge and Lasso Regression
 enote 8 1 enote 8 Ridge and Lasso Regression enote 8 INDHOLD 2 Indhold 8 Ridge and Lasso Regression 1 8.1 Reading material................................. 2 8.2 Presentation material...............................
Hypothesis testing Goodness of fit Multicollinearity Prediction. Applied Statistics. Lecturer: Serena Arima
 Applied Statistics Lecturer: Serena Arima Hypothesis testing for the linear model Under the Gauss-Markov assumptions and the normality of the error terms, we saw that β N(β, σ 2 (X X ) 1 ) and hence s
Bias-Variance Tradeoff. David Dalpiaz STAT 430, Fall 2017
 Bias-Variance Tradeoff David Dalpiaz STAT 430, Fall 2017 1 Announcements Homework 03 released Regrade policy Style policy? 2 Statistical Learning Supervised Learning Regression Parametric Non-Parametric
L7: Multicollinearity
 L7: Multicollinearity Feng Li feng.li@cufe.edu.cn School of Statistics and Mathematics Central University of Finance and Economics Introduction ï Example Whats wrong with it? Assume we have this data Y
CSC2515 Winter 2015 Introduction to Machine Learning. Lecture 2: Linear regression
 CSC2515 Winter 2015 Introduction to Machine Learning Lecture 2: Linear regression All lecture slides will be available as.pdf on the course website: http://www.cs.toronto.edu/~urtasun/courses/csc2515/csc2515_winter15.html
Ch 2: Simple Linear Regression
 Ch 2: Simple Linear Regression 1. Simple Linear Regression Model A simple regression model with a single regressor x is y = β 0 + β 1 x + ɛ, where we assume that the error ɛ is independent random component
Machine Learning CSE546 Carlos Guestrin University of Washington. September 30, What about continuous variables?
 Linear Regression Machine Learning CSE546 Carlos Guestrin University of Washington September 30, 2014 1 What about continuous variables? n Billionaire says: If I am measuring a continuous variable, what
LECTURE 6. Introduction to Econometrics. Hypothesis testing & Goodness of fit
 LECTURE 6 Introduction to Econometrics Hypothesis testing & Goodness of fit October 25, 2016 1 / 23 ON TODAY S LECTURE We will explain how multiple hypotheses are tested in a regression model We will define
Linear Regression. Machine Learning CSE546 Kevin Jamieson University of Washington. Oct 5, Kevin Jamieson 1
 Linear Regression Machine Learning CSE546 Kevin Jamieson University of Washington Oct 5, 2017 1 The regression problem Given past sales data on zillow.com, predict: y = House sale price from x = {# sq.
CPSC 340: Machine Learning and Data Mining. Regularization Fall 2017
 CPSC 340: Machine Learning and Data Mining Regularization Fall 2017 Assignment 2 Admin 2 late days to hand in tonight, answers posted tomorrow morning. Extra office hours Thursday at 4pm (ICICS 246). Midterm
Machine Learning Basics: Estimators, Bias and Variance
 Machine Learning Basics: Estiators, Bias and Variance Sargur N. srihari@cedar.buffalo.edu This is part of lecture slides on Deep Learning: http://www.cedar.buffalo.edu/~srihari/cse676 1 Topics in Basics
Ridge Regression and Ill-Conditioning
 Journal of Modern Applied Statistical Methods Volume 3 Issue Article 8-04 Ridge Regression and Ill-Conditioning Ghadban Khalaf King Khalid University, Saudi Arabia, albadran50@yahoo.com Mohamed Iguernane
Introduction to Machine Learning. PCA and Spectral Clustering. Introduction to Machine Learning, Slides: Eran Halperin
 1 Introduction to Machine Learning PCA and Spectral Clustering Introduction to Machine Learning, 2013-14 Slides: Eran Halperin Singular Value Decomposition (SVD) The singular value decomposition (SVD)
PDEEC Machine Learning 2016/17
 PDEEC Machine Learning 2016/17 Lecture - Model assessment, selection and Ensemble Jaime S. Cardoso jaime.cardoso@inesctec.pt INESC TEC and Faculdade Engenharia, Universidade do Porto Nov. 07, 2017 1 /