Visual Imaging and the Electronic Age Color Science Metamers & Chromaticity Diagrams. Lecture #6 September 7, 2017 Prof. Donald P.
|
|
|
- Jade Todd
- 5 years ago
- Views:
Transcription
1 Visual Imaging and the Electronic Age Color Science Metamers & Chromaticity Diagrams Lecture #6 September 7, 2017 Prof. Donald P. Greenberg
2 Matching the Power Spectrum of the Test Lamp with a Full Set of Spectral Lights 400 nm 700 nm Test lamp observer Energy of each of the spectral lights is adjusted to match a test lamp with its power spectrum
3 Spectral Distribution of Test Lamp Test lamp Power P 1.73 units Wavelength (nm) Energy of each of the spectral lights is adjusted to match a test lamp with its power spectrum
4 Matched Spectral Distribution of Test Lamp Power P = P Wavelength (nm)
5 Matched Spectral Distribution of Test Lamp Equal energy Distribution Test lamp Distribution Power 1 unit Power P = P P 1.73 units Wavelength (nm) Wavelength (nm) To get spectrum light energy of test lamp, need to multiply each unit energy spectral light by P.
6 Matching the Power Spectrum of the Test Lamp with 3 Primary Lights 400 nm 700 nm 700 nm 546 nm 436 nm observer Matching the equivalent of the test lamp s power spectrum with three primary lights.
7 Equal Energy Distribution From the response matching functions, Power 1 unit for each wavelength Wavelength (nm)
8 Response Matching Functions 400 nm 700 nm 700 nm 546 nm 436 nm observer Individually match the RGB primary lights to the unit values of each of the spectral lamps.

9 Response Matching Functions These are the response matching functions of the average human observer for these three primary lights.
10 If we cannot conclusively establish physiological properties of the human eye, how can we quantitatively work with color? Answer: We treat the human visual system as a black box, and characterize it by its response to color stimuli.
11 Computing Tristimulus Values P = P = P r + P g + P b R = P r, G = P g, B = P b The energy of the entire test lamp, P, is equal to the sum of the individual wavelength energies.
12 Computing Tristimulus Values with the Response Matching Functions For each test lamp we can compute the equivalent RGB tristimulus values using the color matching functions = = = d b P B d g P G d r P R ) ( ) ( ) ( ) ( ) ( ) (
13 So what? In the first test, for a given test lamp we had to experimentally find the RGB values of the primary lights. In the second test, we experimentally found the response matching functions of the average human observer.
14 So what? In the third test, if we know the spectral distribution of the test lamp, and we know the response matching functions of the average human observer, we can PREDICT the RGB values of the primary lights. We do not have to perform the experiments.
15 Metamer A metamer is a phenomenon in which two spectrally different stimuli match to a given observer.

16 Metamers P P Physically different Perceptual filter R,G,B R,G,B Perceptually equal
17 What happens if we have a different set of three primary lights? We get a different set of response matching functions
18 Response Matching Functions R = 700 nm G = nm B = nm
19 R = 650 nm G = 530 nm B = 460 nm
20 Transformations A new set of response matching functions is generated for each new set of primary colors. It is possible to mathematically transform the response matching functions for each new set of primary colors. It is also possible to mathematically transform the tristimulus values from one set of primaries to another.
21 Transformation of Color Primaries New color primary lights can be matched by the original color primary lights. These are the new tristimulus values. B a G a R a B B a G a R a G B a G a R a R = + + = + + = [ ] = B G R B G R A
22 Comments on Response Matching Functions Note that knowing the spectral distributions of the primary light sources and the response matching functions of the average human observer, we can then represent a large range of colors with any three primary light sources. (Monitors, cell phones, and printers). Perhaps most important, is the fact that these are perceptual spaces because a human observer is within the experimental testing loop. All of these tests have been conducted in a dark room and thus do not consider the effect of the illumination within the external environment.
23 Chromaticity Diagrams How can we describe the perceptual color space in a way which is easy to use and consistent with its results no matter what input or output devices are used? Television (video) Digital cameras Printers Projectors
24 RGB Space G 1 G Q Q: Color vector R 1 R R, G, B: tristimulus values i.e. RGB coordinates :Unit plane (r+g+b = 1) B 1 B
25 Color Triangle for RGB Primaries R = 650 nm G = 530 nm B = 460 nm r+g+b = 1
26 Color Triangle for RGB Primaries R = 650 nm G = 530 nm B = 460 nm r+g+b = 1 Note: Only colors lying within the color triangle rgb can be exactly reproduced.

27 Response Matching Functions R = 700 nm G = nm B = nm
28 Color Triangle for RGB Primaries r = g = b = R R + G + B G R + G + B B R + G + B 3 2 g R = 700 nm G = nm B = nm Note: Only colors lying within the color triangle rgb can be exactly reproduced. 1 r+g+b = 1 r -2-1 b 1
29 Commentary Dealing with color spaces that have negative regions is mathematically difficult and not intuitive How can we rectify this?
30 Color Triangle for RGB and XYZ Y 3 g 2 1 Z r -2-1 b 1 X
31 XYZ Assumptions 1. One coordinate, and one coordinate only, should represent the luminance. 2. The line between x and y should be nearly coincident with the spectral locus for colors in the 550nm to 700nm (greenred) range. 3. The spectral locus of all realizable colors should lie in the allpositive XYZ quadrant. For realizable colors, all XYZ values and all color matching functions are positive.

32 XYZ Color Matching Functions All positive values y is the luminous efficiency function Equal area

33 XYZ Color Space
")
34 Describing Color in XYZ Luminance Y Chromaticity x = y = z = X X + Y Y X + Y Z X + Y + Z + Z + Z ( x + y + z = 1)

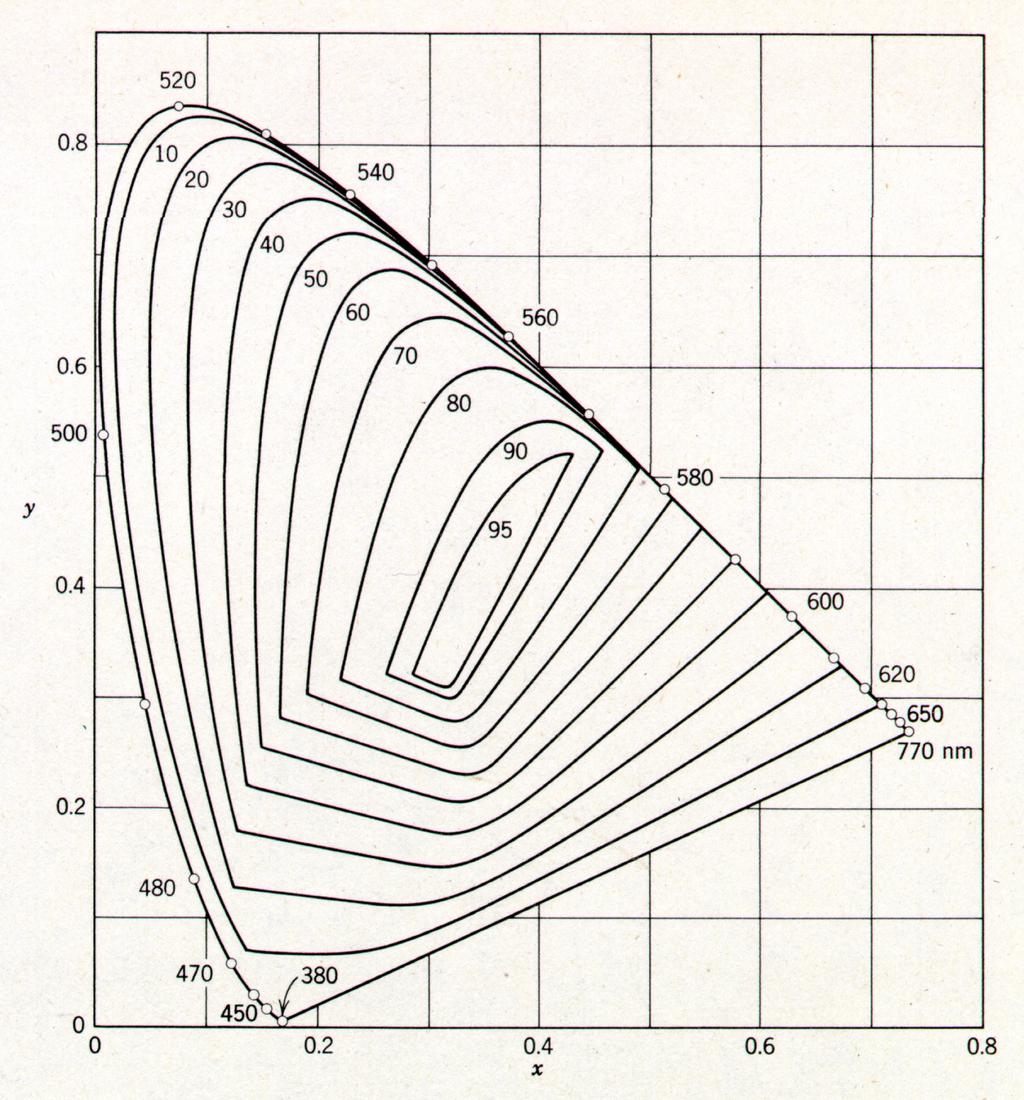
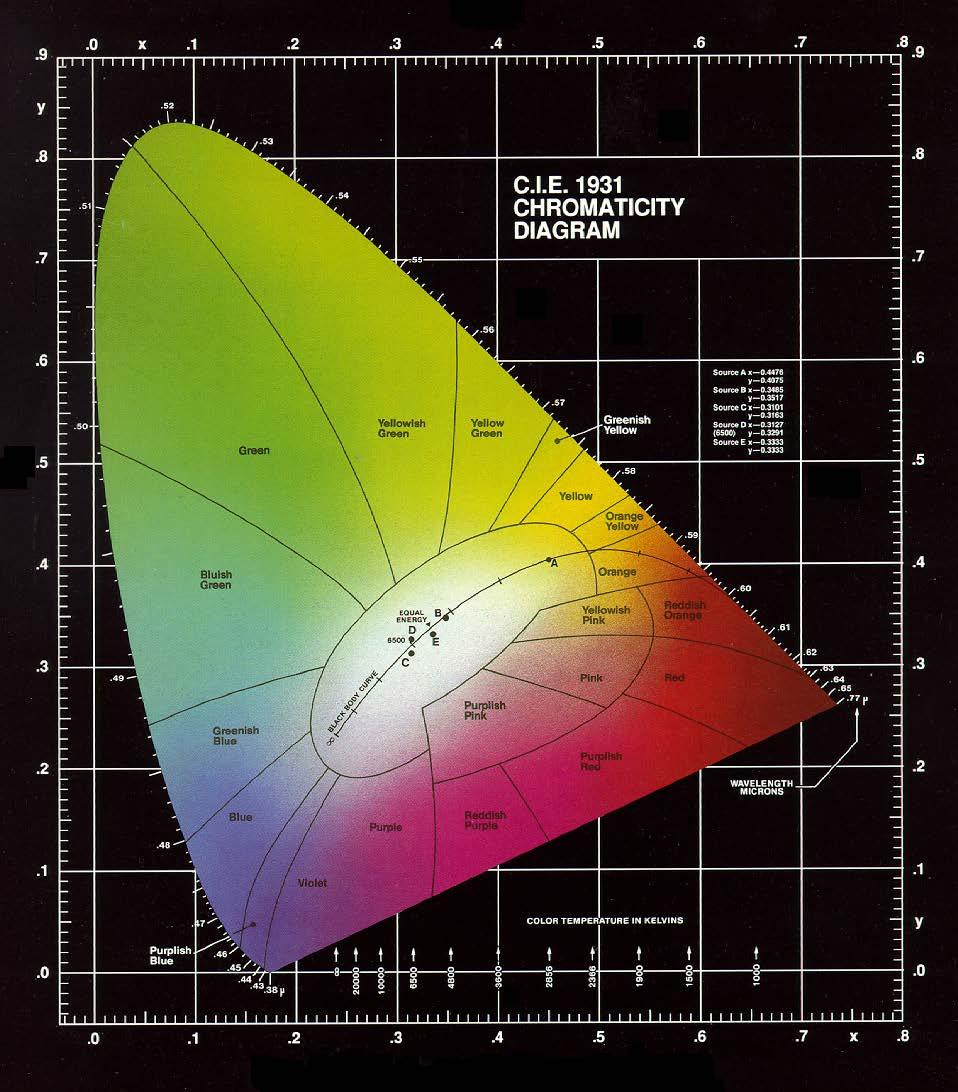
35 Chromaticity Diagram
36 Chromaticity Diagram

37 The luminance or lightness axis, when added to the chromaticity diagrams provides the third dimension for color.
38
39

40 3D Model - Billmeyer
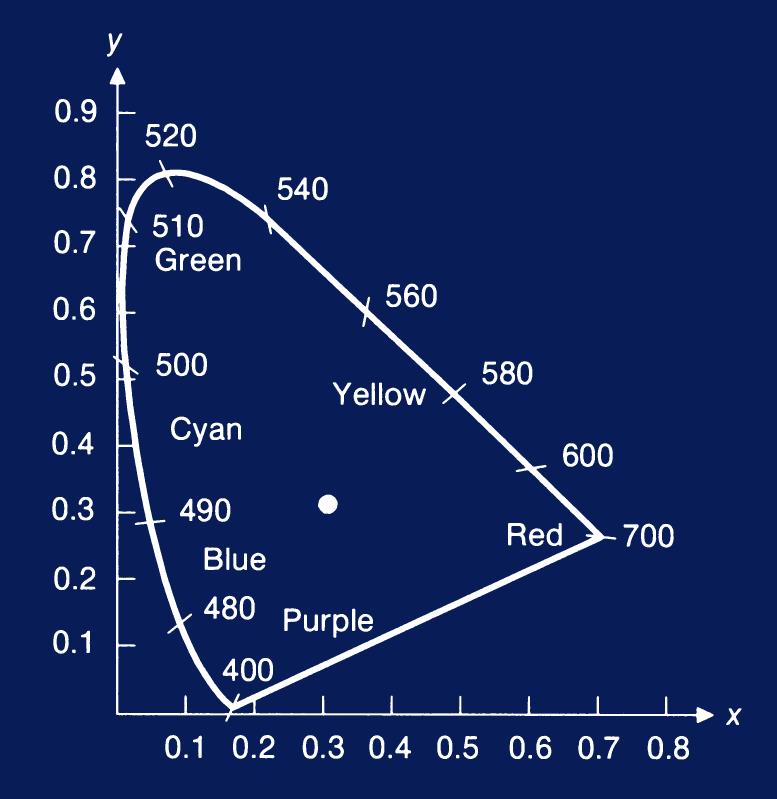
41 Chromaticity Diagram & Gamut (monitors)
42 Chromaticity Diagram & Gamut (monitors) Dominant Hue
43 Chromaticity Diagram & Gamut (monitors).. Nearest Color
44 Chromaticity Diagram & Gamut (printers)
45 Trichromatic Generalization Many colors can be matched by additive mixtures of suitable amounts of three fixed primary colors. Others have to be mixed with a suitable amount of one before it can be matched by the other two. All the colors can be matched in one of these two ways: The restriction is that none of the primary colors can be matched by an additive mixture of the other two.
46 Commentary When we describe Grassman s Experiments, we derived response matching functions which had negative values. How can we have negative light? This is not physically possible. Reproduction is limited to the domain within the triangle defined by the three phosphor/inks.
47 Color Demonstration Video (Jeremy Selan Color Cube Demo)
48 End...
Visual Imaging and the Electronic Age Color Science
 Visual Imaging and the Electronic Age Color Science Color Gamuts & Color Spaces for User Interaction Lecture #7 September 16, 2014 Donald P. Greenberg Color Triangle for XYZ Y g 2 1 Z r -2-1 b 1 X XYZ
Visual Imaging and the Electronic Age Color Science
 Visual Imaging and the Electronic Age Color Science Grassman s Experiments & Trichromacy Lecture #5 September 6, 2016 Prof. Donald P. Greenberg Light as Rays Light as Waves Light as Photons What is Color
Visual Imaging and the Electronic Age Color Science
 Visual Imaging and the Electronic Age Color Science Grassman s Experiments & Trichromacy Lecture #5 September 8, 2015 Prof. Donald P. Greenberg What is Color Science? Quantifying the physical energy which
CS Color. Aditi Majumder, CS 112 Slide 1
 CS 112 - Color Aditi Majumder, CS 112 Slide 1 Visible Light Spectrum Aditi Majumder, CS 112 Slide 2 Color is due to.. Selective emission/reflection of different wavelengths by surfaces in the world Different
Introduction to Colorimetry
 IES NY Issues in Color Seminar February 26, 2011 Introduction to Colorimetry Jean Paul Freyssinier Lighting Research Center, Rensselaer Polytechnic Institute Troy, New York, U.S.A. sponsored by www.lrc.rpi.edu/programs/solidstate/assist
wavelength (nm)
") CS 465 Homework 0 out: Monday 20 November 2006 due: Friday December 2006 Note: You are encouraged to use mathematical tools like MATLAB, Excel, graphing caluclators, or small programs in Java to come up
CS 465 Homework 0 out: Monday 20 November 2006 due: Friday December 2006 Note: You are encouraged to use mathematical tools like MATLAB, Excel, graphing caluclators, or small programs in Java to come up
Colour Part One. Energy Density CPSC 553 P Wavelength 700 nm
 Colour Part One Energy Density 400 Wavelength 700 nm CPSC 553 P 1 Human Perception An Active Organising Process Many illusions experiments from psychology Colour not just a matter of measuring wavelength
Digital Image Processing
 Digital Image Processing 16 November 2006 Dr. ir. Aleksandra Pizurica Prof. Dr. Ir. Wilfried Philips Aleksandra.Pizurica @telin.ugent.be Tel: 09/264.3415 UNIVERSITEIT GENT Telecommunicatie en Informatieverwerking
Vision & Perception. Simple model: simple reflectance/illumination model. image: x(n 1,n 2 )=i(n 1,n 2 )r(n 1,n 2 ) 0 < r(n 1,n 2 ) < 1
=i(n 1,n 2 )r(n 1,n 2 ) 0 < r(n 1,n 2 ) < 1") Simple model: simple reflectance/illumination model Eye illumination source i(n 1,n 2 ) image: x(n 1,n 2 )=i(n 1,n 2 )r(n 1,n 2 ) reflectance term r(n 1,n 2 ) where 0 < i(n 1,n 2 ) < 0 < r(n 1,n 2 )
Simple model: simple reflectance/illumination model Eye illumination source i(n 1,n 2 ) image: x(n 1,n 2 )=i(n 1,n 2 )r(n 1,n 2 ) reflectance term r(n 1,n 2 ) where 0 < i(n 1,n 2 ) < 0 < r(n 1,n 2 )
Color perception SINA 08/09
 Color perception Color adds another dimension to visual perception Enhances our visual experience Increase contrast between objects of similar lightness Helps recognizing objects However, it is clear that
Multimedia Information Systems
 Multimedia Information Systems Samson Cheung EE 639, Fall 2004 Lecture 3 & 4: Color, Video, and Fundamentals of Data Compression 1 Color Science Light is an electromagnetic wave. Its color is characterized
Color and compositing
 Color and compositing 2D Computer Graphics: Diego Nehab Summer 208. Radiometry Measurement of radiant energy in terms of absolute power Wave vs. particle Wavelength (λ), frequency (ν = c λ ), and amplitude
Color vision and colorimetry
 Color vision and colorimetry Photoreceptor types Rods Scotopic vision (low illumination) Do not mediate color perception High density in the periphery to capture many quanta Low spatial resolution Many-to-one
Color Basics. Lecture 2. Electromagnetic Radiation - Spectrum. Spectral Power Distribution
 ectur Color Basics Wavelength Encoding Trichromatic Color Theory Color Matching Experiments -2-8 -4 4 8 Wavelength in meters (m) Newton s Experiment Visible light 4nm 5nm 6nm 7nm Wavelength 665, Cambridge
COLOR SCIENCE. Concepts and Methods, Quantitative Data and Formulae, 2nd Edition. John Wiley & Sons New York Chichester Brisbane Toronto Singapore
 COLOR SCIENCE Concepts and Methods, Quantitative Data and Formulae, 2nd Edition GÜNTER WYSZECKI National Research Council, Ottawa, Ontario, Canada W. S. STILES Richmond, Surrey, England t^- n M 1982 A
Color vision and colorimetry
 Color vision and colorimetry Photoreceptor types Rods Scotopic vision (low illumination) Do not mediate color perception High density in the periphery to capture many quanta Low spatial resolution Many-to-one
Colour. The visible spectrum of light corresponds wavelengths roughly from 400 to 700 nm.
 Colour The visible spectrum of light corresponds wavelengths roughly from 4 to 7 nm. The image above is not colour calibrated. But it offers a rough idea of the correspondence between colours and wavelengths.
Color images C1 C2 C3
 Color imaging Color images C1 C2 C3 Each colored pixel corresponds to a vector of three values {C1,C2,C3} The characteristics of the components depend on the chosen colorspace (RGB, YUV, CIELab,..) Digital
Application of Neugebauer-Based Models to Ceramic Printing
 Application of Neugebauer-Based Models to Ceramic Printing L Iovine, S Westland* and TLV Cheung* Colour and Imaging Institute, University of Derby, Derby, United Kingdom *Centre for Colour Design Technology,
The Visual Perception of Images
 C. A. Bouman: Digital Image Processing - January 8, 2018 1 The Visual Perception of Images In order to understand images you must understand how humans perceive visual stimulus. Objectives: Understand
Motion influences the Effects of Systematic Chromatic Changes
 Motion influences the Effects of Systematic Chromatic Changes Peggy Gérardin 1, Philippe Roud 1, Sabine Süsstrunk 1 and Kenneth Knoblauch 2,3 1 Ecole Polytechnique Fédérale de Lausanne (EPFL), Lausanne,
CITS 4402 Computer Vision
 CITS 4402 Computer Vision A/Prof Ajmal Mian Adj/A/Prof Mehdi Ravanbakhsh Lecture 06 Object Recognition Objectives To understand the concept of image based object recognition To learn how to match images
Perceptually Uniform Color Spaces
 C. A. Bouman: Digital Image Processing - January 8, 2018 1 Perceptually Uniform Color Spaces Problem: Small changes in XYZ may result in small or large perceptual changes. Solution: Formulate a perceptually
Gernot Hoffmann CIE Color Space
 Gernot Hoffmann CIE Color Space Contents 1. CIE Chromaticity Diagram 2 2. Color Matching and Primaries 3 3. Color Volumes and Chromaticity 4 4. RGB to XYZ Conversion 5 5. CIE Primaries 6 6. Visibility
Old painting digital color restoration
 Old painting digital color restoration Michail Pappas Ioannis Pitas Dept. of Informatics, Aristotle University of Thessaloniki GR-54643 Thessaloniki, Greece Abstract Many old paintings suffer from the
Radiometry, photometry, measuring color
 Radiometry, photometry, measuring color Lecture notes are done by Géza Várady, based on the lecture notes of Prof. János Schanda varady.geza@mik.pte.hu University of Pécs, Faculty of Engineering and Information
Screen-space processing Further Graphics
 Screen-space processing Rafał Mantiuk Computer Laboratory, University of Cambridge Cornell Box and tone-mapping Rendering Photograph 2 Real-world scenes are more challenging } The match could not be achieved
THE MEASUREMENT OF COLOR IN A QUALITY CONTROL SYSTEM: TEXTILE COLOR MATCHING
 th IMEKO TC7 International Symposium June 3 July 2, 24, Saint-Petersburg, Russia THE MEASUREMENT OF COLOR IN A QUALITY CONTROL SYSTEM: TEXTILE COLOR MATCHING Andrea Zanobini, Gaetano Iuculano Department
Opponent Color Spaces
 C. A. Bouman: Digital Image Processing - January 8, 2018 1 Opponent Color Spaces Perception of color is usually not best represented in RGB. A better model of HVS is the so-call opponent color model Opponent
Vectorial Color James A. Worthey 11 Rye Court, Gaithersburg, Maryland , USA. Copyright 2008 by James A. Worthey
 Friday, 2009 March 6, 22:55:38 JAW, Wednesday, 2004 November 17, 11:42:48 Vectorial Color James A. Worthey 11 Rye Court, Gaithersburg, Maryland 20878-1901, USA. Copyright 2008 by James A. Worthey Abstract
Multi-variant data scaling and additivity analysis in potentially nonlinear systems using balanced equivalence tracking
 1 Multi-variant data scaling and additivity analysis in potentially nonlinear systems using balanced equivalence tracking David Oulton November 2014 Introduction It is common experience that when investigating
CS681 Computational Colorimetry
 CS681 Computational Colorimetry Min H. Kim KAIST School of Computing Energy on a Lambertian surface An ideal surface that provides uniform diffusion of the incident radiation such that its luminance is
UGRA Display Analysis & Certification Tool Report
 Basics Date: Report-Version: Monitor-Name: EDID-Name: EDID-Serial: Profile: UGRA Display Analysis & Certification Tool Report 2014-5-12 10:21:53 v2.0.0 EIZO CX271 Created: 2014-5-12 8:09 Measurement device:
Theory of colour measurement Contemporary wool dyeing and finishing
 Theory of colour measurement Contemporary wool dyeing and finishing Dr Rex Brady Deakin University Colour measurement theory Topics 1. How we see colour 2. Generation of colours 3. Measurement of colour
SIGNAL DETECTION BY HUMAN OBSERVERS" Prof. J. A. Swets P. D. Donahue Louise Iarussi
 XIV. SIGNAL DETECTION BY HUMAN OBSERVERS" Prof. J. A. Swets P. D. Donahue Louise Iarussi Prof. D. M. Green Susan A. Sewall A. COLOR VISION The "law of additivity of luminances" has long been regarded as
The Electromagnetic Spectrum
 The Electromagnetic Spectrum Color Definition Color is a visual sensation related to the wavelength distribution of the light energy hitting the retina of the eye. When that wavelength distribution is
EXTENDING THE CIE 2006 MODEL
 MARK D. FAIRCHILD & YUTA ASANO CUSTOM COLOR MATCHING FUNCTIONS: EXTENDING THE CIE 2006 MODEL TWO BIG QUESTIONS WHAT DO YOU SEE? DO YOU SEE WHAT I SEE? CIE COLORIMETRY 1931 & 1964, 2- & 10-deg. 2 1.5 Tristimulus
Color Image Correction
 FLDE. p. 1/48 Color Image Correction Benasque, September 2007 Vicent Caselles Departament de Tecnologia Universitat Pompeu Fabra joint work with M.Bertalmío, R. Palma, E. Provenzi FLDE. p. 2/48 Overview
Designing Information Devices and Systems I Fall 2017 Official Lecture Notes Note 2
 EECS 6A Designing Information Devices and Systems I Fall 07 Official Lecture Notes Note Introduction Previously, we introduced vectors and matrices as a way of writing systems of linear equations more
Designing Information Devices and Systems I Spring 2015 Note 3
 EECS 16A Designing Information Devices and Systems I Spring 2015 Note 3 Lecture notes by Christine Wang (01/27/2015) Introduction to Vectors Remark. Often, vectors are represented as letters in boldface(x),
Technical Report. Camera Encoding Evaluation for Image Archiving of Cultural Heritage Roy S. Berns
 Technical Report Camera Encoding Evaluation for Image Archiving of Cultural Heritage Roy S. Berns May 2014 Executive Summary A computational analysis was performed to evaluate color errors caused by color-
Technology, 3 rd edition, John Wiley, New York, 2000
 Errata V3 R. S. Berns, Billmeyer and Saltzman s Principles of Color Technology, 3 rd edition, John Wiley, New York, 000 These are the errors I have found and that have been sent to me by understanding
The CIE 1997 Interim Colour Appearance Model (Simple Version), CIECAM97s. CIE TC1-34 April, 1998
, CIECAM97s. CIE TC1-34 April, 1998") The CIE 1997 Interim Colour Appearance Model (Simple Version), CIECAM97s CIE TC1-34 April, 1998 i The following members of TC1-34, Testing Colour Appearance Models, took part in the preparation of this
The CIE 1997 Interim Colour Appearance Model (Simple Version), CIECAM97s CIE TC1-34 April, 1998 i The following members of TC1-34, Testing Colour Appearance Models, took part in the preparation of this
Measurement Challenge Measurement Lab Activities
 Introduction Measurement Challenge Measurement Lab Activities Take the measurement challenge! Accurately estimate the length, width, and height of a small plastic block and calculate the block s volume.
Module 1. Illumination Engineering Basics. Version 2 EE IIT, Kharagpur 1
 Module 1 Illumination Engineering Basics Version 2 EE IIT, Kharagpur 1 Lesson 2 Radiation Version 2 EE IIT, Kharagpur 2 Instructional objectives 1. State the Visible Range of light. 2. State the range
Internet Video Search
 Internet Video Search Arnold W.M. Smeulders & Cees Snoek CWI & UvA Overview Image and Video Search Lecture 1 Lecture 2 Lecture 3 visual search, the problem color-spatial-textural-temporal features measures
Uncertainty determination of correlated color temperature for high intensity discharge lamps.
 Uncertainty determination of correlated color temperature for high intensity discharge lamps A.B. El-Bialy 1, M.M. El-Ganainy 2 and E.M. El-Moghazy 3 1 University College for Woman for Art, science and
Fresnel Equations cont.
 Lecture 11 Chapter 4 Fresnel quations cont. Total internal reflection and evanescent waves Optical properties of metals Familiar aspects of the interaction of light and matter Fresnel quations: phases
Standard Practice for Calculating Yellowness and Whiteness Indices from Instrumentally Measured Color Coordinates 1
 Designation: E 313 05 Standard Practice for Calculating Yellowness and Whiteness Indices from Instrumentally Measured Color Coordinates 1 This standard is issued under the fixed designation E 313; the
REPORT issued by an Accredited Testing Laboratory
 issued by an Accredited Testing Laboratory Contact person RISE Maria Nilsson Tengelin 2018-01-09 MTt7P09138 1 (2) Measurement Science and Technology +46 516 54 51 maria.nilssontengelin@ri.se Universelt
Color and Color Model Chap. 12
 Coor and Coor Mode Chap. 12 Coor Visibiity n Interpretation of coor is a psychophysioogy probem We coud not fuy understand the mechanism Physica characteristics of coor can be represented by a forma expression
Design of visual environment
 esign of visual environment 6-1 Outline CIE Colorimetry for light sources Fundamentals of Colorimetry Planckian radiators or incandescent light sources Correlated color temperature Color rendering index
Uncertainty determination of correlated color temperature for high intensity discharge lamps
 Uncertainty determination of correlated color temperature for high intensity discharge lamps A.B. El-Bialy 1, M.M. El-Ganainy 2 and E.M. El-Moghazy 3 1 University College for Woman for Art, science and
CEG4311 Digital Image Processing Dec. 21, Professor: Eric Dubois
 This exam has 23 pages 1 CEG4311 Digital Image Processing Dec. 21, 2004 Final exam Duration: 3 hours Professor: Eric Dubois Closed-book exam: you may not use any books, notes or calculator. Answer all
The Truth about Neutrality
 The Truth about Neutrality How Close is Close Enough By Ron Engvaldsen Schneider Optics Inc. March 23, 2017 For many years, the manufacture of neutral density filters (ND s) has been a challenge for all
A Comprehensive Framework for Modeling and Correcting Color Variations in Multi Projector Displays
 A Comprehensive Framework for Modeling and Correcting Color Variations in Multi Projector Displays Aditi Majumder Slide 1 Historical Perspective A dream computer in 1980 (Bill Joy and others) Megabytes
MA EXAM 3 INSTRUCTIONS VERSION 01 November 8, Section # and recitation time
 MA 16500 EXAM 3 INSTRUCTIONS VERSION 01 November 8, 2016 Your name Student ID # Your TA s name Section # and recitation time 1. You must use a #2 pencil on the scantron sheet (answer sheet). 2. Check that
From CIE 2006 Physiological Model to Improved Age- Dependent and Average Colorimetric Observers
 Dependent and Average Colorimetric Observers Abhijit Sarkar, 1, 2, * Florent Autrusseau, 2 Françoise Viénot, 3 Patrick Le Callet, 2 Laurent Blondé 1 1 Technicolor Research & Innovation, 1 av Belle Fontaine
White High-Intensity LED Lamp (3 mm, 40 Viewing Angle)
") (3 mm, 40 Viewing Angle) High luminous intensity Through-hole type Clear lens High efficiency Product Photo Here The is a round 3mm white high-intensity through-hole lamp with a 40 viewing angle. It is
(3 mm, 40 Viewing Angle) High luminous intensity Through-hole type Clear lens High efficiency Product Photo Here The is a round 3mm white high-intensity through-hole lamp with a 40 viewing angle. It is
Fundamentals of light
 Fundamentals of light CHAPTER 1 Introduction Environmental issues Limited resources. Consumption. Sustainability Environmental damage will result in environmental changes (climate change, global warming,
Fundamentals of light
 Fundamentals of light CHAPTER 1 Introduction Environmental issues Limited resources. Consumption. Sustainability Environmental damage will result in environmental changes (climate change, global warming,
Brightness induction: Unequal spatial integration with increments and decrements
 Visual Neuroscience (2004), 21, 353 357. Printed in the USA. Copyright 2004 Cambridge University Press 0952-5238004 $16.00 DOI: 10.10170S0952523804213037 Brightness induction: Unequal spatial integration
CLINICAL VISUAL OPTICS (OPTO 223) Weeks XII & XIII Dr Salwa Alsaleh
 Weeks XII & XIII Dr Salwa Alsaleh") CLINICAL VISUAL OPTICS (OPTO 223) Weeks XII & XIII Dr Salwa Alsaleh OUTLINE OF WEEKS XII & XIII Temporal resolution Temporal Summation. Broca-Sulzer effect. Critical flicker frequency (CFF). Temporal Contrast
CLINICAL VISUAL OPTICS (OPTO 223) Weeks XII & XIII Dr Salwa Alsaleh OUTLINE OF WEEKS XII & XIII Temporal resolution Temporal Summation. Broca-Sulzer effect. Critical flicker frequency (CFF). Temporal Contrast
Errata V7. Page 24 The left-hand figure did not print correctly. The figure should have looked like:
 Errata V7 R. S. Berns, Billmeyer and Saltzman s Principles of Color Technology, 3 rd edition, John Wiley, New York, 2000 These are the errors I have found and that have been sent to me by understanding
From CIE 2006 Physiological Model to Improved Age-Dependent and Average Colorimetric Observers
 From CIE 2006 Physiological Model to Improved Age-Dependent and Average Colorimetric Observers Abhijit Sarkar, Florent Autrusseau, Françoise Viénot, Patrick Le Callet, Laurent Blondé To cite this version:
HunterLab s Guide to Hitch Standardization
 Insight on Color September, 1998, Vol. 10, No. 9 HunterLab s Guide to Hitch Standardization Hitch standardization, also known as transfer standardization, is a process by which two instruments of similar
Sources' Spectra, Roadway Surfaces and the Potential for Uplight Scattering
 Sources' Spectra, Roadway Surfaces and the Potential for Uplight Scattering by Jefferey F. Knox * & David M. Keith, FIES + Authors' Affiliations: * Luminous Design, Inc., Longmont, CO + Marshall Design,
Color difference Delta E - A survey
 See discussions, stats, and author profiles for this publication at: https://www.researchgate.net/publication/236023905 Color difference Delta E - A survey Article in Machine Graphics and Vision April
Surround effects on the shape of the temporal contrast-sensitivity function
 B. Spehar and Q. Zaidi Vol. 14, No. 9/September 1997/J. Opt. Soc. Am. A 2517 Surround effects on the shape of the temporal contrast-sensitivity function Branka Spehar School of Psychology, University of
ALS - PD70-01C/TR7. Surface - Mount Ambient Light Sensor. Features. Description. Applications
 Features Close to the human eye's response Low sensitivity variation across various light sources Operating temperature performance, -40 o C to 85 o C Wide supply voltage range, 2.5V to 5.5V Size : 4.4mm(L)*3.9mm(W)*.2mm(H)
Designing Information Devices and Systems I Fall 2018 Lecture Notes Note 21
 EECS 16A Designing Information Devices and Systems I Fall 2018 Lecture Notes Note 21 21.1 Module Goals In this module, we introduce a family of ideas that are connected to optimization and machine learning,
PROCEEDINGS OF SPIE. Modulation of visualized electrical field. Chin-Jung Chuang, Chi-Chung Wu, Yi-Ting Wang, Shiuan-Hau Huang
 PROCEEDINGS OF SPIE SPIEDigitalLibrary.org/conference-proceedings-of-spie Modulation of visualized electrical field Chin-Jung Chuang, Chi-Chung Wu, Yi-Ting Wang, Shiuan-Hau Huang Chin-Jung Chuang, Chi-Chung
Biological Applications Illustrating Linear Algebra Concepts
 Biological Applications Illustrating Linear Algebra Concepts David Brian Walton Department of Mathematics and Statistics James Madison University Background BIO2010, National Research Council, Recommendation
Systems Analysis and Control
 Systems Analysis and Control Matthew M. Peet Illinois Institute of Technology Lecture 12: Overview In this Lecture, you will learn: Review of Feedback Closing the Loop Pole Locations Changing the Gain
Grau 1214 D Values marked with do not apply to the type of glass or no values are available.
 Grau 1214 Colour: Application: grey Dark tinted sunglare filter with with IR- and high UV- absorption filter category 3 acc. to DIN EN 1836 The subsequent properties are based primarily upon the measuring
2 Foundations of physics Calculation sheet. OCR Physics A. Determining uncertainty. Specification references. Learning outcomes
 Determining uncertainty Specification references 2.2.1 c) M0.3 Use ratios, fractions, and percentages M1.5 Identify uncertainties in measurements and use simple techniques to determine uncertainty when
Precision and Bias of Spectrocolorimeters
 White Paper 22 Level: Intermediate Precision and Bias of Spectrocolorimeters INTRODUCTION The development and application of color management requires the exchange of device profiles that contain the information
6.896: Topics in Algorithmic Game Theory
 6.896: Topics in Algorithmic Game Theory Audiovisual Supplement to Lecture 5 Constantinos Daskalakis On the blackboard we defined multi-player games and Nash equilibria, and showed Nash s theorem that
Designing Information Devices and Systems I Fall 2018 Lecture Notes Note 2
 EECS 6A Designing Information Devices and Systems I Fall 08 Lecture Notes Note Vectors and Matrices In the previous note, we introduced vectors and matrices as a way of writing systems of linear equations
Introduction. Procedure and Data
 Introduction The spectrum is the entire range over which some measurable property of a physical system of phenomenon can vary. Systems that have spectrums include sound frequency, electromagnetic radiation
Color Rendering: a Calculation That Estimates Colorimetric Shifts James A. Worthey, 11 Rye Court, Gaithersburg, Maryland , USA.
 Tuesday, 2003 April 5, 23:33:0 JAW, 200 January Color Rendering: a Calculation That Estimates Colorimetric Shifts James A. Worthey, Rye Court, Gaithersburg, Maryland 20878-90, USA. Abstract Lights vary
Sequence Quantization y. C. B. Atkins, T. J. Flohr, D. P. Hilgenberg, C. A. Bouman, and J. P. Allebach
 Model-Based Color Image Sequence Quantization y C. B. Atkins, T. J. Flohr, D. P. Hilgenberg, C. A. Bouman, and J. P. Allebach School of Electrical Engineering, Purdue University, West Lafayette, IN 4797-1285
FIBER OPTICS. Prof. R.K. Shevgaonkar. Department of Electrical Engineering. Indian Institute of Technology, Bombay. Lecture: 15. Optical Sources-LASER
 FIBER OPTICS Prof. R.K. Shevgaonkar Department of Electrical Engineering Indian Institute of Technology, Bombay Lecture: 15 Optical Sources-LASER Fiber Optics, Prof. R.K. Shevgaonkar, Dept. of Electrical
Fundametals of Rendering - Radiometry / Photometry
 Fundametals of Rendering - Radiometry / Photometry Physically Based Rendering by Pharr & Humphreys Chapter 5: Color and Radiometry Chapter 6: Camera Models - we won t cover this in class Realistic Rendering
Color Science Light & Spectra
 COLOR Visible Light Color Science Light & Spectra Light is an electromagnetic wave It s color is characterized by it s wavelength Most light sources produce contributions over many wavelengths, contributions
Spectral characterization of a Philips LED lamp
 Departamento de Astrofísica y Ciencias de la Atmósfera Grupo de Astrofísica Extragaláctica e Instrumentación Astronómica Spectral characterization of a Philips LED lamp Authors: Carlos Tapia Ayuga & Jaime
Engineering Physics 1 Prof. G.D. Vermaa Department of Physics Indian Institute of Technology-Roorkee
 Engineering Physics 1 Prof. G.D. Vermaa Department of Physics Indian Institute of Technology-Roorkee Module-04 Lecture-02 Diffraction Part - 02 In the previous lecture I discussed single slit and double
The Hertzprung-Russell Diagram. The Hertzprung-Russell Diagram. Question
 Key Concepts: Lecture 21: Measuring the properties of stars (cont.) The Hertzsprung-Russell (HR) Diagram (L versus T) The Hertzprung-Russell Diagram The Stefan-Boltzmann Law: flux emitted by a black body
Designing Information Devices and Systems I Spring 2019 Lecture Notes Note 2
 EECS 6A Designing Information Devices and Systems I Spring 9 Lecture Notes Note Vectors and Matrices In the previous note, we introduced vectors and matrices as a way of writing systems of linear equations
Stripey Squares. Kelly Delp Ithaca College Ithaca, NY 14850, USA Abstract
 Stripey Squares Kelly Delp Ithaca College Ithaca, NY 14850, USA kelly.delp@gmail.com Abstract A black and white image can be represented by a matrix containing numbers between 0 and 1; we describe a way
Core Concept. PowerPoint Lectures to accompany Physical Science, 8e. Chapter 7 Light. New Symbols for this Chapter 3/29/2011
 PowerPoint Lectures to accompany Physical Science, 8e Chapter 7 Light Copyright The McGraw-Hill Companies, Inc. Permission required for reproduction or display. Core Concept Light is electromagnetic radiation
1.6mm Side Looking Phototransistor PT968-8C
 Features Fast response time High sensitivity Small junction capacitance Pb Free This product itself will remain within RoHS compliant version. Description is a phototransistor in miniature package which
The CIECAM02 color appearance model
 Rochester Institute of Technology RIT Scholar Works Presentations and other scholarship 11-12-2002 The CIECAM02 color appearance model Nathan Moroney Mark Fairchild Robert Hunt Changjun Li Follow this
Mini half-watt SMD 3.5mm (120 Viewing Angle)
") (120 Viewing Angle) Series Compact Package Outline of 3.5 x 3.5 x 1.2 mm Robust energy-efficient design with long operating life Low thermal resistance Exceptional spatial uniformity Compatible to IR reflow
(120 Viewing Angle) Series Compact Package Outline of 3.5 x 3.5 x 1.2 mm Robust energy-efficient design with long operating life Low thermal resistance Exceptional spatial uniformity Compatible to IR reflow
Key objectives in Lighting design
 Key objectives in Lighting design Visual performance Physiological conditions Visual quality no strong "contrasts" good "color rendering" adequate "light levels" no "disturbing reflections" no direct "glare"
Expressions and the Number System
 Name: 8 th Grade Math 1 st Semester Review Pd: Expressions and the Number System 1. A square rug has an area of 225 square feet. How long is each side of the rug? A 15 feet B 22.5 feet C 23 feet D 25 feet
NJL6502R-1. Ambient Light Sensor GENERAL DESCRIPTION FEATURES APPLICATIONS. ABSOLUTE MAXIMUM RATINGS (Ta=25 C)
") Ambient Light Sensor GENERAL DESCRIPTION The NJL6502R-1 is the ambient light sensor with optical filter to solve the interference problem by the infrared. Also, the spectral response is close to human
Ambient Light Sensor GENERAL DESCRIPTION The NJL6502R-1 is the ambient light sensor with optical filter to solve the interference problem by the infrared. Also, the spectral response is close to human
(Refer Slide Time: )
") Digital Signal Processing Prof. S. C. Dutta Roy Department of Electrical Engineering Indian Institute of Technology, Delhi FIR Lattice Synthesis Lecture - 32 This is the 32nd lecture and our topic for
Digital Signal Processing Prof. S. C. Dutta Roy Department of Electrical Engineering Indian Institute of Technology, Delhi FIR Lattice Synthesis Lecture - 32 This is the 32nd lecture and our topic for
Rosalite 9148 UV D 9148
 Rosalite 9148 UV Colour: Application: dark rose light tinted sunglare filter with contrast intensification red / yellow and high UV - absorption filter category 1 acc. to DIN EN 1836 The subsequent properties
LM-79 Report TEST REPORT NO. L523A
 LM-79 Report TEST REPORT NO. L523A Test Result Summary Luminaire Manufacturer Pioneer Engineering Inc. Luminaire Model Number S ST-0246-5L-5K-120 Input Voltage RMS (V) 120.03 Input Current RMS (A) 0.28