Mixed Models for Longitudinal Ordinal and Nominal Outcomes
|
|
|
- Hollie Allyson Quinn
- 6 years ago
- Views:
Transcription
1 Mixed Models for Longitudinal Ordinal and Nominal Outcomes Don Hedeker Department of Public Health Sciences Biological Sciences Division University of Chicago Hedeker, D. (2008). Multilevel models for ordinal and nominal variables. In J. de Leeuw & E. Meijer (Eds.), Handbook of Multilevel Analysis. Springer, New York. Hedeker, D. & Gibbons, R.D. (2006). Longitudinal Data Analysis, chapters 10 & 11. Wiley. Hedeker, D. (2014). Methods for multilevel ordinal data in prevention research. Prevention Science. This work was supported by National Institute of Mental Health Contract N44MH
2 Why analyze as ordinal? Efficiency: Armstrong & Sloan (1989, Amer Jrn of Epid) and Strömberg (1996, Amer Jrn of Epid) report efficiency losses between 49% to 87% when dichotomizing an ordinal outcome with five categories. Bias: continuous model can yield correlated residuals and regressors when used for ordinal outcomes; continuous model does not take into account the ceiling and floor effects of the ordinal outcome. Results in biased estimates of regression coefficients and is most critical when the ordinal variables is highly skewed (see Bauer & Sterba, 2011, Psych Methods) Logic: continuous model can yield predicted values outside of the range of the ordinal variable. 2
3 Ordinal Logistic Regression Model (aka Proportional Odds or Cumulative Logit Model) - McCullagh (1980) log P (Y c) = γ c x β 1 P (Y c) c = 1,..., C 1 for the C categories of the ordinal outcome x = vector of explanatory variables (plus the intercept) γ c = threshold parameters; reflect cumulative logits when x = 0 (for identification: γ 1 = 0 or β 0 = 0) positive association between explanatory variable x and ordinal outcome variable Y is reflected by β x is assumed to have the same effect on each cumulative logit (proportional odds assumption) 3
4 Ordinal Response and Threshold Concept Continuous y i - unobservable latent variable - related to ordinal response Y i via threshold concept threshold values γ 1, γ 2,..., γ C 1 (γ 0 = and γ C = ) C = number of ordered categories Response occurs in category c, Y i = c if γ c 1 < y i < γ c 4
5 The Threshold Concept in Practice How was your day? (what is your level of satisfaction today?) Satisfaction may be continuous, but we sometimes emit an ordinal response: 5
6 Model for Latent Continuous Responses Consider the model with p covariates for the latent response strength y i (i = 1, 2,..., N): y i = x iβ + ε i probit: ε i standard normal (mean=0, variance=1) logistic: ε i standard logistic (mean=0, variance=π 2 /3) β estimates from logistic regression are larger (in abs. value) than from probit regression by approximately π 2 /3 = 1.8 Underlying latent variable useful way of thinking of the problem not an essential assumption of the model 6
7 Mixed-effects ordinal logistic regression model (Hedeker & Gibbons, 1994, 1996) i = 1,... N level-2 units (clusters or subjects) j = 1,..., n i level-1 units (subjects or repeated observations) c = 1, 2,..., C response categories Y ij = ordinal response of level-2 unit i and level-1 unit j How was your day? (asked repeatedly each day for a week) 7
8 Mixed-effects ordinal logistic regression model λ ijc = log P ijc = γ c (x (1 P ijc ) ijβ + z ijυ i ) P ijc = Pr (Y ij c υ ; γ c, β, Σ υ ) = 1 1+exp( λ ijc ) p ijc = Pr (Y ij = c υ ; γ c, β, Σ υ ) = P ijc P ijc 1 C 1 strictly increasing model thresholds γ c x ij = p 1 covariate vector z ij = r 1 design vector for random effects β = p 1 fixed regression parameters υ i = r 1 random effects for level-2 unit i N(0, Σ υ ) 8
9 Model for Latent Continuous Responses Model with p covariates for the latent response strength y ij : y ij = x ijβ + υ 0i + ε ij where υ 0i N(0, σ 2 υ), and assuming ε ij standard normal (mean 0 and σ 2 = 1) leads to mixed-effects ordinal probit regression ε ij standard logistic (mean 0 and σ 2 = π 2 /3) leads to mixed-effects ordinal logistic regression 9
10 Underlying latent variable not an essential assumption of the model useful for obtaining intra-class correlation (r) and for design effect (d) r = σ2 υ σ 2 υ + σ 2 d = σ2 υ + σ 2 σ 2 = 1/(1 r) ratio of actual variance to the variance that would be obtained by simple random sampling (holding sample size constant) 10
11 Scaling of regression coefficients Fixed-effects model β estimates from logistic regression are larger (in abs. value) than from probit regression by approximately because π 2 /3 1 V (y) = σ 2 = π 2 /3 for logistic V (y) = σ 2 = 1 for probit =
12 Mixed-effects model β estimates from mixed-effects (random intercepts) model are larger (in abs. value) than from fixed-effects model by approximately because d = συ 2 + σ 2 σ 2 V (y) = σ 2 υ + σ 2 in mixed-effects (random intercepts) model V (y) = σ 2 in fixed-effects model difference depends on size of random-effects variance σ 2 υ more complex for models with multiple random effects 12
13 Treatment-Related Change Across Time Data from the NIMH Schizophrenia collaborative study on treatment related changes in overall severity. IMPS item 79, Severity of Illness, was scored as: 1 = normal or borderline mentally ill 2 = mildly or moderately ill 3 = markedly ill 4 = severely or among the most extremely ill The experimental design and corresponding sample sizes: Sample size at Week Group completers PLC (n=108) % DRUG (n=329) % Drug = Chlorpromazine, Fluphenazine, or Thioridazine Main question of interest: Was there differential improvement for the drug groups relative to the control group? 13
14 Under SSI, Inc > SuperMix (English) or SuperMix (English) Student Under File click on Open Spreadsheet Open C:\SuperMixEn Examples\Workshop\Binary\SCHIZX1.ss3 (or C:\SuperMixEn Student Examples\Workshop\Binary\SCHIZX1.ss3) 14

15 C:\SuperMixEn Examples\Workshop\Binary\SCHIZX1.ss3 15

16 Select Imps79O column, then Edit > Set Missing Value 16

17 Select File > Data-based Graphs > Bivariate 17
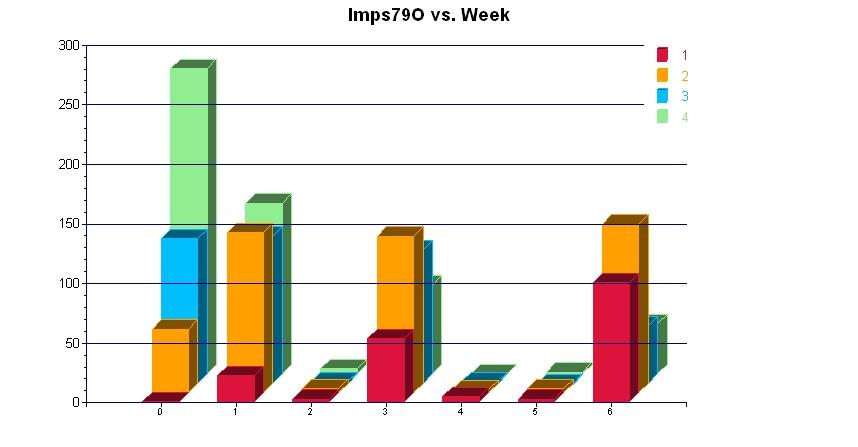
18 18
19 Select File > Data-based Graphs > Bivariate 19

20 20
21 Observed Logits across Time by Condition 21
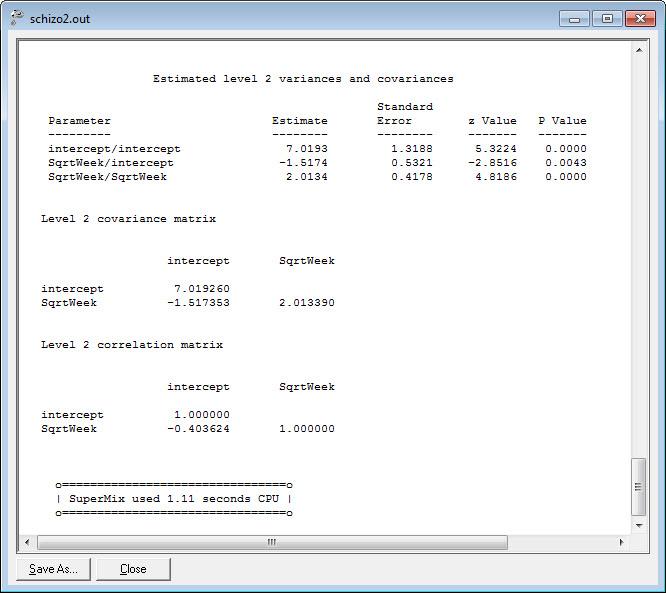
22 Within-Subjects / Between-Subjects components Within-subjects model - level 1 (j = 1,..., n i obs) λ ijc = γ c [b 0i + b 1i W eekj ] Between-subjects model - level 2 (i = 1,..., N subjects) b 0i = β 0 + β 2 Grp i + υ 0i b 1i = β 1 + β 3 Grp i + υ 1i υ i N ID(0, Σ υ ) 22

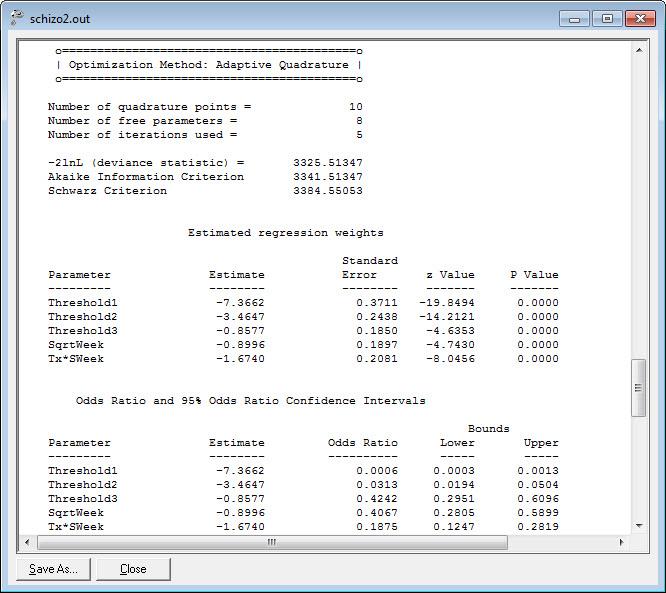
23 Under File click on Open Existing Model Setup Open C:\SuperMixEn Examples\Workshop\Ordinal\schizo2.mum (or C:\SuperMixEn Student Examples\Workshop\Ordinal\schizo2.mum) 23
24 Note that Dependent Variable Type is ordered 24
25 Note the lack of TxDrug as an explanatory variable 25
26 Make sure Optimization Method is set to adaptive quadrature 26

27 Note: Cumulative Logit link function 27
")
28 Category response indicators (IMPS79O1-IMPS79O4); results of fixed-effects model (to be ignored, or for comparison purposes) 28
29 29
30 30

31 31
32 Model Fit of Observed Proportions 32
33 SAS IML code: SCHZOFIT.SAS - computing marginal probabilities - ordinal model adapted from syntax at (Week 12) TITLE1 NIMH Schizophrenia Data - Estimated Marginal Probabilities ; PROC IML; /* Results from random intercept and trend model */; /* using Population Average Estimates */; x0 = { , , , }; x1 = { , , , }; beta = { , }; thresh = { , ,.4765}; 33
34 za0 = (thresh[1] - x0*beta) ; zb0 = (thresh[2] - x0*beta) ; zc0 = (thresh[3] - x0*beta) ; za1 = (thresh[1] - x1*beta) ; zb1 = (thresh[2] - x1*beta) ; zc1 = (thresh[3] - x1*beta) ; grp0a = 1 / ( 1 + EXP(- za0)); grp0b = 1 / ( 1 + EXP(- zb0)); grp0c = 1 / ( 1 + EXP(- zc0)); grp1a = 1 / ( 1 + EXP(- za1)); grp1b = 1 / ( 1 + EXP(- zb1)); grp1c = 1 / ( 1 + EXP(- zc1)); print Random intercept and trend model ; print using Population Average Estimates ; print marginal prob for group 0 - catg 1 grp0a [FORMAT=8.4]; print marginal prob for group 0 - catg 2 (grp0b-grp0a) [FORMAT=8.4]; print marginal prob for group 0 - catg 3 (grp0c-grp0b) [FORMAT=8.4]; print marginal prob for group 0 - catg 4 (1-grp0c) [FORMAT=8.4]; print marginal prob for group 1 - catg 1 grp1a [FORMAT=8.4]; print marginal prob for group 1 - catg 2 (grp1b-grp1a) [FORMAT=8.4]; print marginal prob for group 1 - catg 3 (grp1c-grp1b) [FORMAT=8.4]; print marginal prob for group 1 - catg 4 (1-grp1c) [FORMAT=8.4]; 34
35 Proportional and Non-proportional Odds Proportional Odds model log P (Y ij c) = γ c [ x 1 P (Y ij c) ijβ + z ] ijυ i with υ i N(0, Σ υ ) relationship between the explanatory variables and the cumulative logits does not depend on c effects of x variables DO NOT vary across the C 1 cumulative logits 35
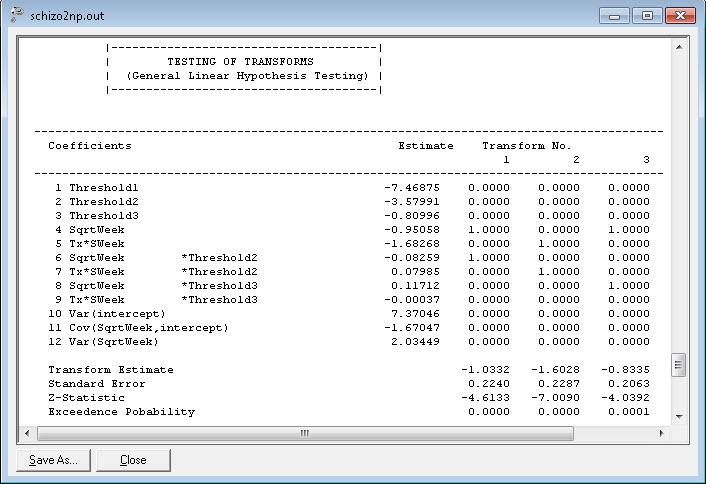
36 Non-Proportional/Partial Proportional Odds model log P (Y ij c) = γ 1 P (Y ij c) 0c [ u ijγ c + x ijβ + z ] ijυ i u ij = h 1 vector for the set of h covariates for which proportional odds is not assumed effects of u variables DO vary across the C 1 cumulative logits more flexible model for ordinal response relations can be used to empirically test proportional odds assumption 36
37 Proportional Odds Assumption: covariate effects are the same across all cumulative logits Response group Absent Mild Severe total control cumulative odds = = 2.7 logit -1 1 treatment cumulative odds = = 4.6 logit group difference =.5 for both cumulative logits 37
38 Non-Proportional Odds: covariate effects vary across the cumulative logits Response group Absent Mild Severe total control cumulative odds = = 2.7 logit -1 1 treatment cumulative odds = = 7.3 logit UNEQUAL group difference across cumulative logits 38
39 Open C:\SuperMixEn Examples\Workshop\Ordinal\schizo2np.mum (or C:\SuperMixEn Student Examples\Workshop\Ordinal\schizo2np.mum) 39
40 Note that Dependent Variable Type is ordered 40

41 Two explanatory variables: SqrtWeek and Tx SWeek 41
42 Explanatory Variable Interactions - both are selected 42

43 Proportional Odds Assumption Accepted: χ 2 4 = =
44 Linear Transforms Fixed part of model: λ c = ˆγ 0c ˆβ1 SqrtWeek + ˆβ 2 Tx*SWeek + ˆγ 1c SqrtWeek + ˆγ 2c Tx*SWeek] cumulative logit variable 1 vs 2,3,4 1,2 vs 3,4 1,2,3, vs 4 SqrtWeek ˆβ1 ˆβ1 + ˆγ 12 ˆβ1 + ˆγ 13 Tx SWeek ˆβ2 ˆβ2 + ˆγ 22 ˆβ2 + ˆγ 23 H 0 : β 1 + γ 12 = 0; SqrtWeek effect is 0 on the 2nd cumulative logit z = ˆβ 1 + ˆγ 12 SE( ˆβ 1 + ˆγ 12 ) 44

45 45
46 46

47 47
48 NIMH Schiz Study: Severity of Illness (N = 437) Ordinal LR Estimates (se) - random intercept and trend model Proportional Non-Proportional Odds Model Odds Model 1 vs 2,3,4 1,2 vs 3,4 1,2,3 vs 4 Time (sqrt week) (0.190) (0.331) (0.224) (0.206) Drug by Time (0.208) (0.288) (0.229) (0.237) 2 log L Proportional Odds accepted (χ 2 4 = = 1.35) 48
49 San Diego Homeless Research Project (Hough) 361 mentally ill subjects who were homeless or at very high risk of becoming homeless 2 conditions: HUD Section 8 rental certificates (yes/no) baseline and 6, 12, and 24 month follow-ups Categorical outcome: housing status streets / shelters (Y = 0) community / institutions (Y = 1) independent (Y = 2) Question: Do Section 8 certificates influence housing status across time? 49

50 Under SSI, Inc > SuperMix (English) or SuperMix (English) Student Under File click on Open Spreadsheet Open C:\SuperMixEn Examples\Workshop\Nominal\SDHOUSE.ss3 (or C:\SuperMixEn Student Examples\Workshop\Nominal\SDHOUSE.ss3) 50
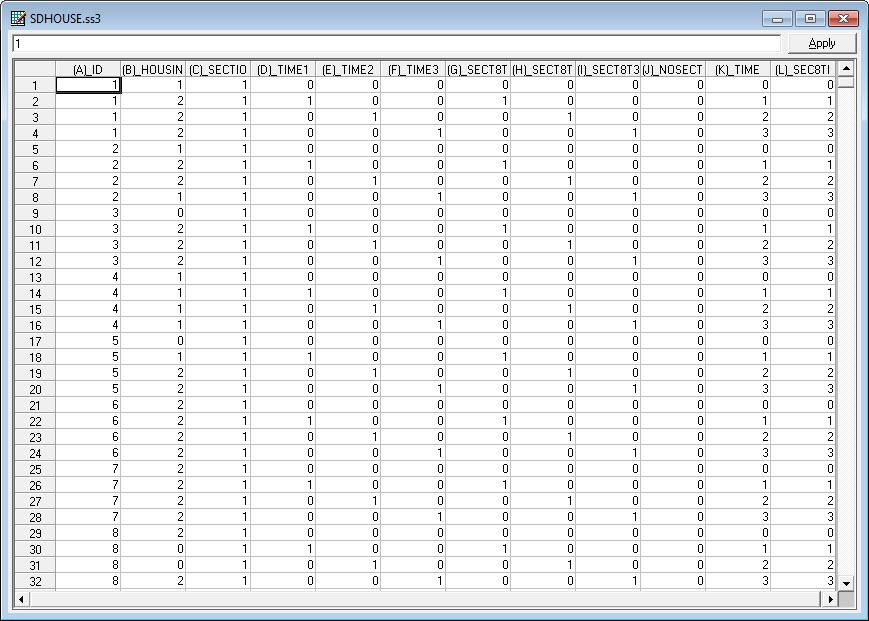
51 C:\SuperMixEn Examples\Workshop\Nominal\SDHOUSE.ss3 51

52 Select Housing column, then Edit > Set Missing Value 52
53 Select File > Data-based Graphs > Bivariate 53
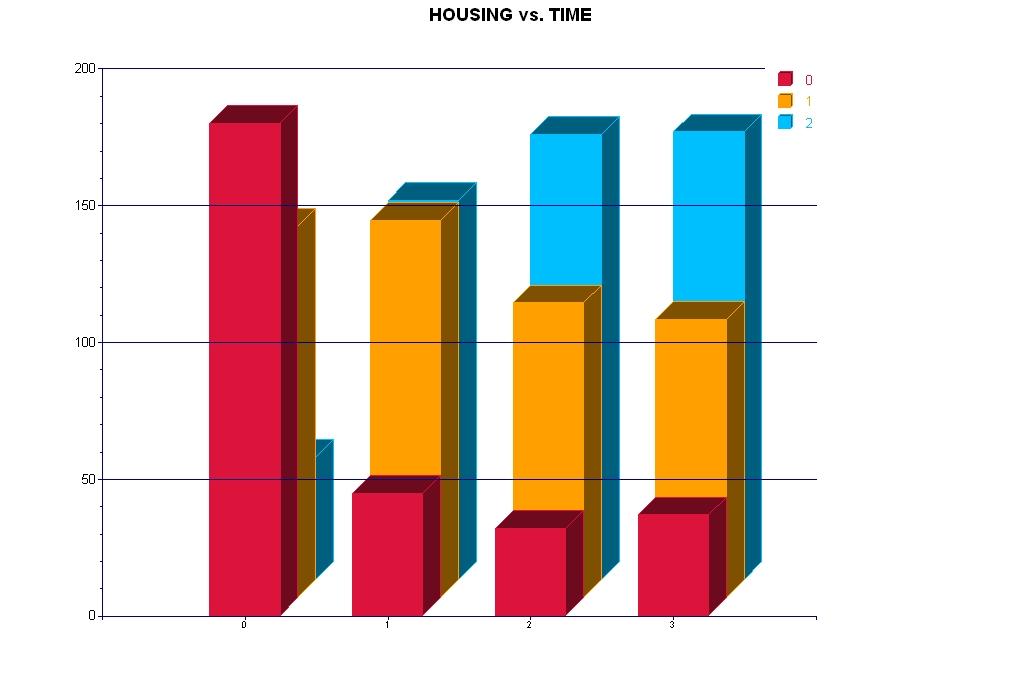
54 54

55 Select File > Data-based Graphs > Bivariate 55

56 56
57 57

58 Under File click on Open Existing Model Setup Open C:\SuperMixEn Examples\Workshop\Ordinal\SDO1.mum (or C:\SuperMixEn Student Examples\Workshop\Ordinal\SDO1.mum) 58

59 Note that Dependent Variable Type is ordered 59
60 All explanatory variables are indicator (dummy) variables 60
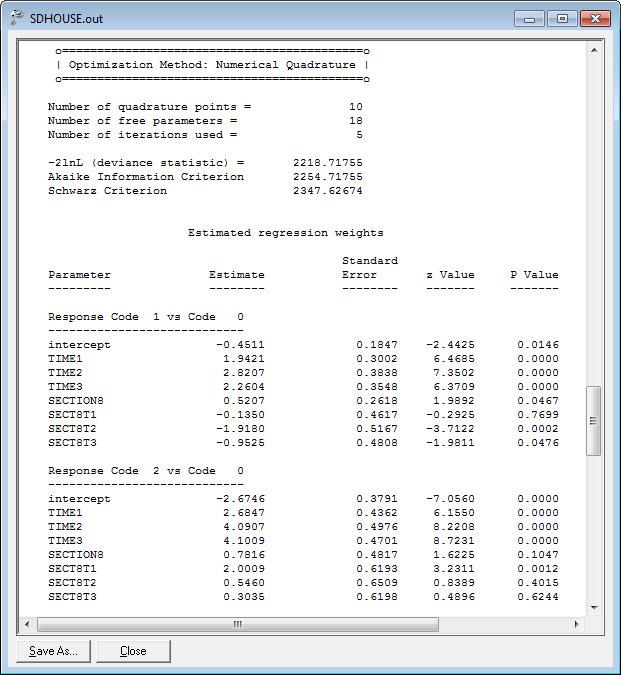
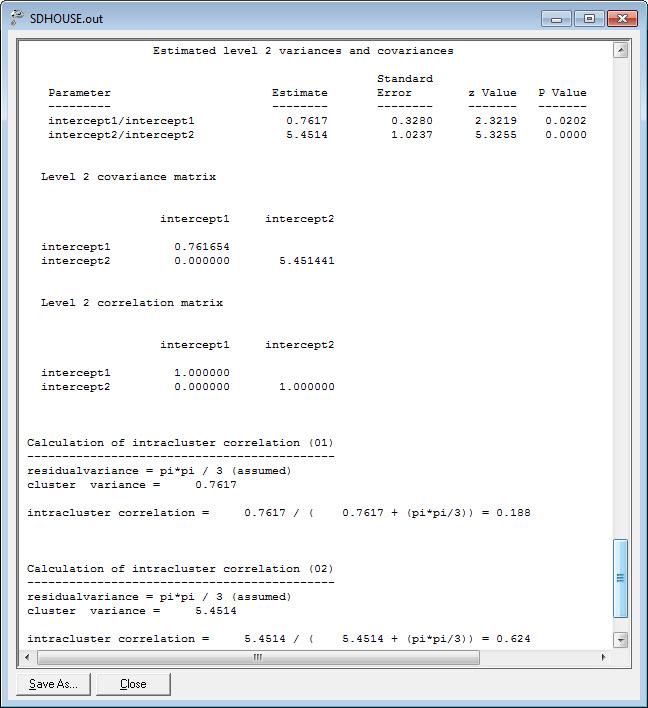
61 Housing status across time: 1289 observations within 361 subjects Ordinal Mixed Regression Model estimates and standard errors (se) Proportional Odds Non-Proportional Odds Non-street 1 Independent 2 difference term estimate se estimate se estimate se estimate se threshold threshold t1 (6 month) t2 (12 month) t3 (24 month) section 8 (yes=1) section 8 by t section 8 by t section 8 by t subject var (ICC.4) 2 log L (χ 2 7 = 52.14) bold indicates p <.05 italic indicates.05 < p <.10 1 = independent + community vs street 2 = independent vs community + street 61

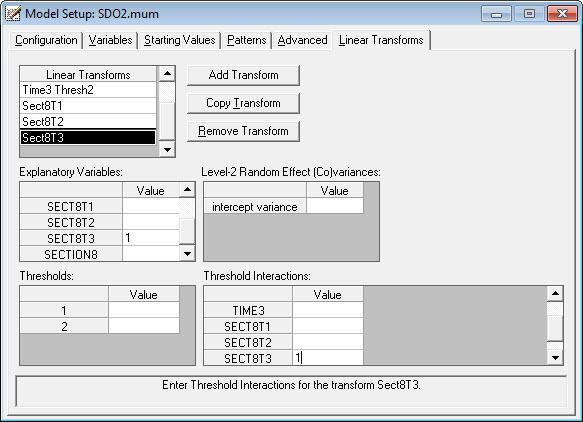
62 For Non-Proportional Odds model, under File click on Open Existing Model Setup Open C:\SuperMixEn Examples\Workshop\Ordinal\SDO2.mum (or C:\SuperMixEn Student Examples\Workshop\Ordinal\SDO2.mum) 62
63 Note that Dependent Variable Type is ordered 63

64 Note Explanatory Variable Interactions is set to 7 64
65 65

66 Mixed Multinomial Logistic Regression Model Y ij = nominal response of level-2 unit i and level-1 unit j Which member of The Polkaholics is your favorite? (asked before, during, and after a show) 66
67 Mixed-effects Multinomial Logistic Regression Model log p ijc p ij1 = u ijγ c + z ijυ ic C 1 contrasts to reference cell (c = 1) regression effects γ c vary across contrasts random-effects υ ic vary across contrasts independent correlated For example, with C = 3 c = 2, 3,... C contrast ordinal nominal c1 2 & 3 vs 1 2 vs 1 c2 3 vs 1 & 2 3 vs 1 67
68 Model in terms of the category probabilities p ijc = Pr(Y ij = c υ ic ) = exp(z ijc ) 1 + C h=2 exp(z ijh ) for c = 2, 3,..., C p ij1 = Pr(Y ij = 1 υ ic ) = C h=2 exp(z ijh ) where the multinomial logit z ijc = u ijγ c + z ijυ ic 68
69 69

70 Under File click on Open Existing Model Setup Open C:\SuperMixEn Examples\Workshop\Nominal\sdhouse.mum (or C:\SuperMixEn Student Examples\Workshop\Nominal\sdhouse.mum) 70
71 Note that Dependent Variable Type is nominal 71

72 72

73 Can select first or last category as the reference cell 73

74 Try independent random effects first 74
75 75
76 76
77 Now allow the random effects to be correlated 77

78 LR test comparing models: χ 2 1 = =

79 79
80 Summary Models for longitudinal ordinal and nominal data as developed as models for continuous and dichotomous data Proportional odds models Non and partial proportional odds models Nominal models (with reference-cell contrasts) Grouped-time survival analysis models SuperMix can do it all, including 3-level models, also for counts full likelihood solution using adaptive quadrature 80
Mixed Models for Longitudinal Ordinal and Nominal Outcomes. Don Hedeker Department of Public Health Sciences University of Chicago
 Mixed Models for Longitudinal Ordinal and Nominal Outcomes Don Hedeker Department of Public Health Sciences University of Chicago hedeker@uchicago.edu https://hedeker-sites.uchicago.edu/ Hedeker, D. (2008).
More Mixed-Effects Models for Ordinal & Nominal Data. Don Hedeker University of Illinois at Chicago
 More Mixed-Effects Models for Ordinal & Nominal Data Don Hedeker University of Illinois at Chicago This work was supported by National Institute of Mental Health Contract N44MH32056. 1 Proportional and
Why analyze as ordinal? Mixed Models for Longitudinal Ordinal Data Don Hedeker University of Illinois at Chicago
 Why analyze as ordinal? Mixed Models for Longitudinal Ordinal Data Don Hedeker University of Illinois at Chicago hedeker@uic.edu www.uic.edu/ hedeker/long.html Efficiency: Armstrong & Sloan (1989, Amer
Mixed Models for Longitudinal Binary Outcomes. Don Hedeker Department of Public Health Sciences University of Chicago.
 Mixed Models for Longitudinal Binary Outcomes Don Hedeker Department of Public Health Sciences University of Chicago hedeker@uchicago.edu https://hedeker-sites.uchicago.edu/ Hedeker, D. (2005). Generalized
Mixed Models for Longitudinal Ordinal and Nominal Data
 Mixed Models for Longitudinal Ordinal and Nominal Data Hedeker, D. (2008). Multilevel models for ordinal and nominal variables. In J. de Leeuw & E. Meijer (Eds.), Handbook of Multilevel Analysis. Springer,
Mixed-Effects Pattern-Mixture Models for Incomplete Longitudinal Data. Don Hedeker University of Illinois at Chicago
 Mixed-Effects Pattern-Mixture Models for Incomplete Longitudinal Data Don Hedeker University of Illinois at Chicago This work was supported by National Institute of Mental Health Contract N44MH32056. 1
Missing Data in Longitudinal Studies: Mixed-effects Pattern-Mixture and Selection Models
 Missing Data in Longitudinal Studies: Mixed-effects Pattern-Mixture and Selection Models Hedeker D & Gibbons RD (1997). Application of random-effects pattern-mixture models for missing data in longitudinal
Multilevel Modeling of Non-Normal Data. Don Hedeker Department of Public Health Sciences University of Chicago.
 Multilevel Modeling of Non-Normal Data Don Hedeker Department of Public Health Sciences University of Chicago email: hedeker@uchicago.edu https://hedeker-sites.uchicago.edu/ Hedeker, D. (2005). Generalized
Generalized Linear Models for Non-Normal Data
 Generalized Linear Models for Non-Normal Data Today s Class: 3 parts of a generalized model Models for binary outcomes Complications for generalized multivariate or multilevel models SPLH 861: Lecture
GEE for Longitudinal Data - Chapter 8
 GEE for Longitudinal Data - Chapter 8 GEE: generalized estimating equations (Liang & Zeger, 1986; Zeger & Liang, 1986) extension of GLM to longitudinal data analysis using quasi-likelihood estimation method
Correspondence Analysis of Longitudinal Data
 Correspondence Analysis of Longitudinal Data Mark de Rooij* LEIDEN UNIVERSITY, LEIDEN, NETHERLANDS Peter van der G. M. Heijden UTRECHT UNIVERSITY, UTRECHT, NETHERLANDS *Corresponding author (rooijm@fsw.leidenuniv.nl)
Review. Timothy Hanson. Department of Statistics, University of South Carolina. Stat 770: Categorical Data Analysis
 Review Timothy Hanson Department of Statistics, University of South Carolina Stat 770: Categorical Data Analysis 1 / 22 Chapter 1: background Nominal, ordinal, interval data. Distributions: Poisson, binomial,
Advantages of Mixed-effects Regression Models (MRM; aka multilevel, hierarchical linear, linear mixed models) 1. MRM explicitly models individual
 1. MRM explicitly models individual") Advantages of Mixed-effects Regression Models (MRM; aka multilevel, hierarchical linear, linear mixed models) 1. MRM explicitly models individual change across time 2. MRM more flexible in terms of repeated
Advantages of Mixed-effects Regression Models (MRM; aka multilevel, hierarchical linear, linear mixed models) 1. MRM explicitly models individual change across time 2. MRM more flexible in terms of repeated
Hierarchical Generalized Linear Models. ERSH 8990 REMS Seminar on HLM Last Lecture!
 Hierarchical Generalized Linear Models ERSH 8990 REMS Seminar on HLM Last Lecture! Hierarchical Generalized Linear Models Introduction to generalized models Models for binary outcomes Interpreting parameter
Investigating Models with Two or Three Categories
 Ronald H. Heck and Lynn N. Tabata 1 Investigating Models with Two or Three Categories For the past few weeks we have been working with discriminant analysis. Let s now see what the same sort of model might
Generalized Models: Part 1
 Generalized Models: Part 1 Topics: Introduction to generalized models Introduction to maximum likelihood estimation Models for binary outcomes Models for proportion outcomes Models for categorical outcomes
Chapter 1. Modeling Basics
 Chapter 1. Modeling Basics What is a model? Model equation and probability distribution Types of model effects Writing models in matrix form Summary 1 What is a statistical model? A model is a mathematical
8 Nominal and Ordinal Logistic Regression
 8 Nominal and Ordinal Logistic Regression 8.1 Introduction If the response variable is categorical, with more then two categories, then there are two options for generalized linear models. One relies on
Application of Item Response Theory Models for Intensive Longitudinal Data
 Application of Item Response Theory Models for Intensive Longitudinal Data Don Hedeker, Robin Mermelstein, & Brian Flay University of Illinois at Chicago hedeker@uic.edu Models for Intensive Longitudinal
Lecture 3.1 Basic Logistic LDA
 y Lecture.1 Basic Logistic LDA 0.2.4.6.8 1 Outline Quick Refresher on Ordinary Logistic Regression and Stata Women s employment example Cross-Over Trial LDA Example -100-50 0 50 100 -- Longitudinal Data
Longitudinal Modeling with Logistic Regression
 Newsom 1 Longitudinal Modeling with Logistic Regression Longitudinal designs involve repeated measurements of the same individuals over time There are two general classes of analyses that correspond to
Introduction to Generalized Models
 Introduction to Generalized Models Today s topics: The big picture of generalized models Review of maximum likelihood estimation Models for binary outcomes Models for proportion outcomes Models for categorical
Comparing IRT with Other Models
 Comparing IRT with Other Models Lecture #14 ICPSR Item Response Theory Workshop Lecture #14: 1of 45 Lecture Overview The final set of slides will describe a parallel between IRT and another commonly used
STAT 705 Generalized linear mixed models
 STAT 705 Generalized linear mixed models Timothy Hanson Department of Statistics, University of South Carolina Stat 705: Data Analysis II 1 / 24 Generalized Linear Mixed Models We have considered random
Stat 642, Lecture notes for 04/12/05 96
 Stat 642, Lecture notes for 04/12/05 96 Hosmer-Lemeshow Statistic The Hosmer-Lemeshow Statistic is another measure of lack of fit. Hosmer and Lemeshow recommend partitioning the observations into 10 equal
Ronald Heck Week 14 1 EDEP 768E: Seminar in Categorical Data Modeling (F2012) Nov. 17, 2012
 Nov. 17, 2012") Ronald Heck Week 14 1 From Single Level to Multilevel Categorical Models This week we develop a two-level model to examine the event probability for an ordinal response variable with three categories (persist
Ronald Heck Week 14 1 From Single Level to Multilevel Categorical Models This week we develop a two-level model to examine the event probability for an ordinal response variable with three categories (persist
Econometrics Lecture 5: Limited Dependent Variable Models: Logit and Probit
 Econometrics Lecture 5: Limited Dependent Variable Models: Logit and Probit R. G. Pierse 1 Introduction In lecture 5 of last semester s course, we looked at the reasons for including dichotomous variables
Latent Variable Models for Binary Data. Suppose that for a given vector of explanatory variables x, the latent
 Latent Variable Models for Binary Data Suppose that for a given vector of explanatory variables x, the latent variable, U, has a continuous cumulative distribution function F (u; x) and that the binary
ST3241 Categorical Data Analysis I Multicategory Logit Models. Logit Models For Nominal Responses
 ST3241 Categorical Data Analysis I Multicategory Logit Models Logit Models For Nominal Responses 1 Models For Nominal Responses Y is nominal with J categories. Let {π 1,, π J } denote the response probabilities
Homework Solutions Applied Logistic Regression
 Homework Solutions Applied Logistic Regression WEEK 6 Exercise 1 From the ICU data, use as the outcome variable vital status (STA) and CPR prior to ICU admission (CPR) as a covariate. (a) Demonstrate that
Ron Heck, Fall Week 8: Introducing Generalized Linear Models: Logistic Regression 1 (Replaces prior revision dated October 20, 2011)
") Ron Heck, Fall 2011 1 EDEP 768E: Seminar in Multilevel Modeling rev. January 3, 2012 (see footnote) Week 8: Introducing Generalized Linear Models: Logistic Regression 1 (Replaces prior revision dated October
Ron Heck, Fall 2011 1 EDEP 768E: Seminar in Multilevel Modeling rev. January 3, 2012 (see footnote) Week 8: Introducing Generalized Linear Models: Logistic Regression 1 (Replaces prior revision dated October
General structural model Part 2: Categorical variables and beyond. Psychology 588: Covariance structure and factor models
 General structural model Part 2: Categorical variables and beyond Psychology 588: Covariance structure and factor models Categorical variables 2 Conventional (linear) SEM assumes continuous observed variables
Data-analysis and Retrieval Ordinal Classification
 Data-analysis and Retrieval Ordinal Classification Ad Feelders Universiteit Utrecht Data-analysis and Retrieval 1 / 30 Strongly disagree Ordinal Classification 1 2 3 4 5 0% (0) 10.5% (2) 21.1% (4) 42.1%
Sample Size Estimation for Longitudinal Studies. Don Hedeker University of Illinois at Chicago hedeker
 Sample Size Estimation for Longitudinal Studies Don Hedeker University of Illinois at Chicago www.uic.edu/ hedeker Hedeker, Gibbons, & Waternaux (1999). Sample size estimation for longitudinal designs
Lecture 12: Effect modification, and confounding in logistic regression
 Lecture 12: Effect modification, and confounding in logistic regression Ani Manichaikul amanicha@jhsph.edu 4 May 2007 Today Categorical predictor create dummy variables just like for linear regression
Model Assumptions; Predicting Heterogeneity of Variance
 Model Assumptions; Predicting Heterogeneity of Variance Today s topics: Model assumptions Normality Constant variance Predicting heterogeneity of variance CLP 945: Lecture 6 1 Checking for Violations of
Generalized Linear Modeling - Logistic Regression
 1 Generalized Linear Modeling - Logistic Regression Binary outcomes The logit and inverse logit interpreting coefficients and odds ratios Maximum likelihood estimation Problem of separation Evaluating
Interpreting and using heterogeneous choice & generalized ordered logit models
 Interpreting and using heterogeneous choice & generalized ordered logit models Richard Williams Department of Sociology University of Notre Dame July 2006 http://www.nd.edu/~rwilliam/ The gologit/gologit2
Introduction to mtm: An R Package for Marginalized Transition Models
 Introduction to mtm: An R Package for Marginalized Transition Models Bryan A. Comstock and Patrick J. Heagerty Department of Biostatistics University of Washington 1 Introduction Marginalized transition
Single-level Models for Binary Responses
 Single-level Models for Binary Responses Distribution of Binary Data y i response for individual i (i = 1,..., n), coded 0 or 1 Denote by r the number in the sample with y = 1 Mean and variance E(y) =
The Multilevel Logit Model for Binary Dependent Variables Marco R. Steenbergen
 The Multilevel Logit Model for Binary Dependent Variables Marco R. Steenbergen January 23-24, 2012 Page 1 Part I The Single Level Logit Model: A Review Motivating Example Imagine we are interested in voting
Introducing Generalized Linear Models: Logistic Regression
 Ron Heck, Summer 2012 Seminars 1 Multilevel Regression Models and Their Applications Seminar Introducing Generalized Linear Models: Logistic Regression The generalized linear model (GLM) represents and
Using Mixture Latent Markov Models for Analyzing Change in Longitudinal Data with the New Latent GOLD 5.0 GUI
 Using Mixture Latent Markov Models for Analyzing Change in Longitudinal Data with the New Latent GOLD 5.0 GUI Jay Magidson, Ph.D. President, Statistical Innovations Inc. Belmont, MA., U.S. statisticalinnovations.com
Package threg. August 10, 2015
 Package threg August 10, 2015 Title Threshold Regression Version 1.0.3 Date 2015-08-10 Author Tao Xiao Maintainer Tao Xiao Depends R (>= 2.10), survival, Formula Fit a threshold regression
Logistic regression: Why we often can do what we think we can do. Maarten Buis 19 th UK Stata Users Group meeting, 10 Sept. 2015
 Logistic regression: Why we often can do what we think we can do Maarten Buis 19 th UK Stata Users Group meeting, 10 Sept. 2015 1 Introduction Introduction - In 2010 Carina Mood published an overview article
Logistic Regression. Continued Psy 524 Ainsworth
 Logistic Regression Continued Psy 524 Ainsworth Equations Regression Equation Y e = 1 + A+ B X + B X + B X 1 1 2 2 3 3 i A+ B X + B X + B X e 1 1 2 2 3 3 Equations The linear part of the logistic regression
Using the Delta Method to Construct Confidence Intervals for Predicted Probabilities, Rates, and Discrete Changes 1
 Using the Delta Method to Construct Confidence Intervals for Predicted Probabilities, Rates, Discrete Changes 1 JunXuJ.ScottLong Indiana University 2005-02-03 1 General Formula The delta method is a general
Bayesian Multivariate Logistic Regression
 Bayesian Multivariate Logistic Regression Sean M. O Brien and David B. Dunson Biostatistics Branch National Institute of Environmental Health Sciences Research Triangle Park, NC 1 Goals Brief review of
Simple logistic regression
 Simple logistic regression Biometry 755 Spring 2009 Simple logistic regression p. 1/47 Model assumptions 1. The observed data are independent realizations of a binary response variable Y that follows a
NATIONAL UNIVERSITY OF SINGAPORE EXAMINATION (SOLUTIONS) ST3241 Categorical Data Analysis. (Semester II: )
 ST3241 Categorical Data Analysis. (Semester II: )") NATIONAL UNIVERSITY OF SINGAPORE EXAMINATION (SOLUTIONS) Categorical Data Analysis (Semester II: 2010 2011) April/May, 2011 Time Allowed : 2 Hours Matriculation No: Seat No: Grade Table Question 1 2 3
NATIONAL UNIVERSITY OF SINGAPORE EXAMINATION (SOLUTIONS) Categorical Data Analysis (Semester II: 2010 2011) April/May, 2011 Time Allowed : 2 Hours Matriculation No: Seat No: Grade Table Question 1 2 3
STA 4504/5503 Sample Exam 1 Spring 2011 Categorical Data Analysis. 1. Indicate whether each of the following is true (T) or false (F).
 or false (F).") STA 4504/5503 Sample Exam 1 Spring 2011 Categorical Data Analysis 1. Indicate whether each of the following is true (T) or false (F). (a) T In 2 2 tables, statistical independence is equivalent to a population
STA 4504/5503 Sample Exam 1 Spring 2011 Categorical Data Analysis 1. Indicate whether each of the following is true (T) or false (F). (a) T In 2 2 tables, statistical independence is equivalent to a population
multilevel modeling: concepts, applications and interpretations
 multilevel modeling: concepts, applications and interpretations lynne c. messer 27 october 2010 warning social and reproductive / perinatal epidemiologist concepts why context matters multilevel models
Goodness-of-Fit Tests for the Ordinal Response Models with Misspecified Links
 Communications of the Korean Statistical Society 2009, Vol 16, No 4, 697 705 Goodness-of-Fit Tests for the Ordinal Response Models with Misspecified Links Kwang Mo Jeong a, Hyun Yung Lee 1, a a Department
Consider Table 1 (Note connection to start-stop process).
.") Discrete-Time Data and Models Discretized duration data are still duration data! Consider Table 1 (Note connection to start-stop process). Table 1: Example of Discrete-Time Event History Data Case Event
Discrete-Time Data and Models Discretized duration data are still duration data! Consider Table 1 (Note connection to start-stop process). Table 1: Example of Discrete-Time Event History Data Case Event
Example 7b: Generalized Models for Ordinal Longitudinal Data using SAS GLIMMIX, STATA MEOLOGIT, and MPLUS (last proportional odds model only)
") CLDP945 Example 7b page 1 Example 7b: Generalized Models for Ordinal Longitudinal Data using SAS GLIMMIX, STATA MEOLOGIT, and MPLUS (last proportional odds model only) This example comes from real data
CLDP945 Example 7b page 1 Example 7b: Generalized Models for Ordinal Longitudinal Data using SAS GLIMMIX, STATA MEOLOGIT, and MPLUS (last proportional odds model only) This example comes from real data
EPSY 905: Fundamentals of Multivariate Modeling Online Lecture #7
 Introduction to Generalized Univariate Models: Models for Binary Outcomes EPSY 905: Fundamentals of Multivariate Modeling Online Lecture #7 EPSY 905: Intro to Generalized In This Lecture A short review
Spring RMC Professional Development Series January 14, Generalized Linear Mixed Models (GLMMs): Concepts and some Demonstrations
: Concepts and some Demonstrations") Spring RMC Professional Development Series January 14, 2016 Generalized Linear Mixed Models (GLMMs): Concepts and some Demonstrations Ann A. O Connell, Ed.D. Professor, Educational Studies (QREM) Director,
Spring RMC Professional Development Series January 14, 2016 Generalized Linear Mixed Models (GLMMs): Concepts and some Demonstrations Ann A. O Connell, Ed.D. Professor, Educational Studies (QREM) Director,
SuperMix2 features not available in HLM 7 Contents
 SuperMix2 features not available in HLM 7 Contents Spreadsheet display of.ss3 files... 2 Continuous Outcome Variables: Additional Distributions... 3 Additional Estimation Methods... 5 Count variables including
NELS 88. Latent Response Variable Formulation Versus Probability Curve Formulation
 NELS 88 Table 2.3 Adjusted odds ratios of eighth-grade students in 988 performing below basic levels of reading and mathematics in 988 and dropping out of school, 988 to 990, by basic demographics Variable
STA 4504/5503 Sample Exam 1 Spring 2011 Categorical Data Analysis. 1. Indicate whether each of the following is true (T) or false (F).
 or false (F).") STA 4504/5503 Sample Exam 1 Spring 2011 Categorical Data Analysis 1. Indicate whether each of the following is true (T) or false (F). (a) (b) (c) (d) (e) In 2 2 tables, statistical independence is equivalent
STA 4504/5503 Sample Exam 1 Spring 2011 Categorical Data Analysis 1. Indicate whether each of the following is true (T) or false (F). (a) (b) (c) (d) (e) In 2 2 tables, statistical independence is equivalent
Statistical Analysis of List Experiments
 Statistical Analysis of List Experiments Graeme Blair Kosuke Imai Princeton University December 17, 2010 Blair and Imai (Princeton) List Experiments Political Methodology Seminar 1 / 32 Motivation Surveys
Class Notes: Week 8. Probit versus Logit Link Functions and Count Data
 Ronald Heck Class Notes: Week 8 1 Class Notes: Week 8 Probit versus Logit Link Functions and Count Data This week we ll take up a couple of issues. The first is working with a probit link function. While
Model Estimation Example
 Ronald H. Heck 1 EDEP 606: Multivariate Methods (S2013) April 7, 2013 Model Estimation Example As we have moved through the course this semester, we have encountered the concept of model estimation. Discussions
CHAPTER 9 EXAMPLES: MULTILEVEL MODELING WITH COMPLEX SURVEY DATA
 Examples: Multilevel Modeling With Complex Survey Data CHAPTER 9 EXAMPLES: MULTILEVEL MODELING WITH COMPLEX SURVEY DATA Complex survey data refers to data obtained by stratification, cluster sampling and/or
Regression Methods for Survey Data
 Regression Methods for Survey Data Professor Ron Fricker! Naval Postgraduate School! Monterey, California! 3/26/13 Reading:! Lohr chapter 11! 1 Goals for this Lecture! Linear regression! Review of linear
Anders Skrondal. Norwegian Institute of Public Health London School of Hygiene and Tropical Medicine. Based on joint work with Sophia Rabe-Hesketh
 Constructing Latent Variable Models using Composite Links Anders Skrondal Norwegian Institute of Public Health London School of Hygiene and Tropical Medicine Based on joint work with Sophia Rabe-Hesketh
Fitting mixed-effects models for repeated ordinal outcomes with the NLMIXED procedure
 Behavior Research Methods, Instruments, & Computers 00, 34 (), 151-157 ARTICLES FROM THE SCIP CONFERENCE Fitting mixed-effects models for repeated ordinal outcomes with the NLMIXED procedure CHING-FAN
NATIONAL UNIVERSITY OF SINGAPORE EXAMINATION. ST3241 Categorical Data Analysis. (Semester II: ) April/May, 2011 Time Allowed : 2 Hours
 April/May, 2011 Time Allowed : 2 Hours") NATIONAL UNIVERSITY OF SINGAPORE EXAMINATION Categorical Data Analysis (Semester II: 2010 2011) April/May, 2011 Time Allowed : 2 Hours Matriculation No: Seat No: Grade Table Question 1 2 3 4 5 6 Full marks
NATIONAL UNIVERSITY OF SINGAPORE EXAMINATION Categorical Data Analysis (Semester II: 2010 2011) April/May, 2011 Time Allowed : 2 Hours Matriculation No: Seat No: Grade Table Question 1 2 3 4 5 6 Full marks
SAS Syntax and Output for Data Manipulation: CLDP 944 Example 3a page 1
 CLDP 944 Example 3a page 1 From Between-Person to Within-Person Models for Longitudinal Data The models for this example come from Hoffman (2015) chapter 3 example 3a. We will be examining the extent to
Review of Multinomial Distribution If n trials are performed: in each trial there are J > 2 possible outcomes (categories) Multicategory Logit Models
 Multicategory Logit Models") Chapter 6 Multicategory Logit Models Response Y has J > 2 categories. Extensions of logistic regression for nominal and ordinal Y assume a multinomial distribution for Y. 6.1 Logit Models for Nominal Responses
Chapter 6 Multicategory Logit Models Response Y has J > 2 categories. Extensions of logistic regression for nominal and ordinal Y assume a multinomial distribution for Y. 6.1 Logit Models for Nominal Responses
Categorical Predictor Variables
 Categorical Predictor Variables We often wish to use categorical (or qualitative) variables as covariates in a regression model. For binary variables (taking on only 2 values, e.g. sex), it is relatively
Models for Binary Outcomes
 Models for Binary Outcomes Introduction The simple or binary response (for example, success or failure) analysis models the relationship between a binary response variable and one or more explanatory variables.
Multi-level Models: Idea
 Review of 140.656 Review Introduction to multi-level models The two-stage normal-normal model Two-stage linear models with random effects Three-stage linear models Two-stage logistic regression with random
Categorical and Zero Inflated Growth Models
 Categorical and Zero Inflated Growth Models Alan C. Acock* Summer, 2009 *Alan C. Acock, Department of Human Development and Family Sciences, Oregon State University, Corvallis OR 97331 (alan.acock@oregonstate.edu).
Generalized Linear Latent and Mixed Models with Composite Links and Exploded
 Generalized Linear Latent and Mixed Models with Composite Links and Exploded Likelihoods Anders Skrondal 1 and Sophia Rabe-Hesketh 2 1 Norwegian Institute of Public Health, Oslo (anders.skrondal@fhi.no)
Chapter 5: Logistic Regression-I
 : Logistic Regression-I Dipankar Bandyopadhyay Department of Biostatistics, Virginia Commonwealth University BIOS 625: Categorical Data & GLM [Acknowledgements to Tim Hanson and Haitao Chu] D. Bandyopadhyay
Generalized Multilevel Models for Non-Normal Outcomes
 Generalized Multilevel Models for Non-Normal Outcomes Topics: 3 parts of a generalized (multilevel) model Models for binary, proportion, and categorical outcomes Complications for generalized multilevel
RESEARCH ARTICLE. Likelihood-based Approach for Analysis of Longitudinal Nominal Data using Marginalized Random Effects Models
 Journal of Applied Statistics Vol. 00, No. 00, August 2009, 1 14 RESEARCH ARTICLE Likelihood-based Approach for Analysis of Longitudinal Nominal Data using Marginalized Random Effects Models Keunbaik Lee
McGill University. Faculty of Science. Department of Mathematics and Statistics. Statistics Part A Comprehensive Exam Methodology Paper
 Student Name: ID: McGill University Faculty of Science Department of Mathematics and Statistics Statistics Part A Comprehensive Exam Methodology Paper Date: Friday, May 13, 2016 Time: 13:00 17:00 Instructions
Answers to Problem Set #4
 Answers to Problem Set #4 Problems. Suppose that, from a sample of 63 observations, the least squares estimates and the corresponding estimated variance covariance matrix are given by: bβ bβ 2 bβ 3 = 2
mixor: An R Package for Longitudinal and Clustered Ordinal Response Modeling
 mixor: An R Package for Longitudinal and Clustered Ordinal Response Modeling Kellie J. Archer Donald Hedeker Rachel Nordgren Robert D. Gibbons Virginia Commonwealth University University of Illinois Chicago
Repeated ordinal measurements: a generalised estimating equation approach
 Repeated ordinal measurements: a generalised estimating equation approach David Clayton MRC Biostatistics Unit 5, Shaftesbury Road Cambridge CB2 2BW April 7, 1992 Abstract Cumulative logit and related
Binary Dependent Variables
 Binary Dependent Variables In some cases the outcome of interest rather than one of the right hand side variables - is discrete rather than continuous Binary Dependent Variables In some cases the outcome
7/28/15. Review Homework. Overview. Lecture 6: Logistic Regression Analysis
 Lecture 6: Logistic Regression Analysis Christopher S. Hollenbeak, PhD Jane R. Schubart, PhD The Outcomes Research Toolbox Review Homework 2 Overview Logistic regression model conceptually Logistic regression
Faculty of Health Sciences. Regression models. Counts, Poisson regression, Lene Theil Skovgaard. Dept. of Biostatistics
 Faculty of Health Sciences Regression models Counts, Poisson regression, 27-5-2013 Lene Theil Skovgaard Dept. of Biostatistics 1 / 36 Count outcome PKA & LTS, Sect. 7.2 Poisson regression The Binomial
Lecture 14: Introduction to Poisson Regression
 Lecture 14: Introduction to Poisson Regression Ani Manichaikul amanicha@jhsph.edu 8 May 2007 1 / 52 Overview Modelling counts Contingency tables Poisson regression models 2 / 52 Modelling counts I Why
Modelling counts. Lecture 14: Introduction to Poisson Regression. Overview
 Modelling counts I Lecture 14: Introduction to Poisson Regression Ani Manichaikul amanicha@jhsph.edu Why count data? Number of traffic accidents per day Mortality counts in a given neighborhood, per week
(z) normal >< ª(z) logistic 1=(1 + exp( z)) P(v ij c) = (z) clog-log 1 exp( exp(z)) 1 (z) log-log exp( exp(z))
 normal >< ª(z) logistic 1=(1 + exp( z)) P(v ij c) = (z) clog-log 1 exp( exp(z)) 1 (z) log-log exp( exp(z))") MIXOR2: MIXOR version 2 ² i = 1:::N level-2 units ² j = 1:::n i level-1 units for level-2 unit i ² c = 1:::C categories The response model for MIXOR2 can be written as: z ijc = c h u 0 ij ³ c +w 0 ij +x0
MIXOR2: MIXOR version 2 ² i = 1:::N level-2 units ² j = 1:::n i level-1 units for level-2 unit i ² c = 1:::C categories The response model for MIXOR2 can be written as: z ijc = c h u 0 ij ³ c +w 0 ij +x0
Computationally Efficient Estimation of Multilevel High-Dimensional Latent Variable Models
 Computationally Efficient Estimation of Multilevel High-Dimensional Latent Variable Models Tihomir Asparouhov 1, Bengt Muthen 2 Muthen & Muthen 1 UCLA 2 Abstract Multilevel analysis often leads to modeling
Models for Heterogeneous Choices
 APPENDIX B Models for Heterogeneous Choices Heteroskedastic Choice Models In the empirical chapters of the printed book we are interested in testing two different types of propositions about the beliefs
Fixed effects results...32
 1 MODELS FOR CONTINUOUS OUTCOMES...7 1.1 MODELS BASED ON A SUBSET OF THE NESARC DATA...7 1.1.1 The data...7 1.1.1.1 Importing the data and defining variable types...8 1.1.1.2 Exploring the data...12 Univariate
STAT 7030: Categorical Data Analysis
 STAT 7030: Categorical Data Analysis 5. Logistic Regression Peng Zeng Department of Mathematics and Statistics Auburn University Fall 2012 Peng Zeng (Auburn University) STAT 7030 Lecture Notes Fall 2012
Lecture 10: Introduction to Logistic Regression
 Lecture 10: Introduction to Logistic Regression Ani Manichaikul amanicha@jhsph.edu 2 May 2007 Logistic Regression Regression for a response variable that follows a binomial distribution Recall the binomial
Review of Statistics 101
 Review of Statistics 101 We review some important themes from the course 1. Introduction Statistics- Set of methods for collecting/analyzing data (the art and science of learning from data). Provides methods
Introduction to lnmle: An R Package for Marginally Specified Logistic-Normal Models for Longitudinal Binary Data
 Introduction to lnmle: An R Package for Marginally Specified Logistic-Normal Models for Longitudinal Binary Data Bryan A. Comstock and Patrick J. Heagerty Department of Biostatistics University of Washington
ECON 594: Lecture #6
 ECON 594: Lecture #6 Thomas Lemieux Vancouver School of Economics, UBC May 2018 1 Limited dependent variables: introduction Up to now, we have been implicitly assuming that the dependent variable, y, was
Introduction to Random Effects of Time and Model Estimation
 Introduction to Random Effects of Time and Model Estimation Today s Class: The Big Picture Multilevel model notation Fixed vs. random effects of time Random intercept vs. random slope models How MLM =
Calculating Effect-Sizes. David B. Wilson, PhD George Mason University
 Calculating Effect-Sizes David B. Wilson, PhD George Mason University The Heart and Soul of Meta-analysis: The Effect Size Meta-analysis shifts focus from statistical significance to the direction and
Multilevel Statistical Models: 3 rd edition, 2003 Contents
 Multilevel Statistical Models: 3 rd edition, 2003 Contents Preface Acknowledgements Notation Two and three level models. A general classification notation and diagram Glossary Chapter 1 An introduction
Transitional modeling of experimental longitudinal data with missing values
 Adv Data Anal Classif (2018) 12:107 130 https://doi.org/10.1007/s11634-015-0226-6 REGULAR ARTICLE Transitional modeling of experimental longitudinal data with missing values Mark de Rooij 1 Received: 28