Stats for Engineers: Lecture 4
|
|
|
- Dwayne Tate
- 6 years ago
- Views:
Transcription
1 Stats for Engineers: Lecture 4
2 Summary from last time Standard deviation σ measure spread of distribution μ Variance = (standard deviation) σ = var X = k μ P(X = k) k = k P X = k k μ σ σ k Discrete Random Variables Binomial distribution number k of successes from n independent Bernoulli (YES/NO) trials P X = k = n k pk 1 p n k
3 Example: A component has a 0% chance of being a dud. If five are selected from a large batch, what is the probability that more than one is a dud? Answer: Let X = number of duds in selection of 5 Bernoulli trial: dud or not dud, X B(5,0.) P(More than one dud) = P X > 1 = 1 P X 1 = 1 P X = 0 P(X = 1) = 1 C C = =
4 Binomial or not? A mixed box of 10 screws contains 5 that are galvanized and 5 that are non-galvanized. Three screws are picked at random without replacement. I want galvanized screws, so consider picking a galvanized screw to be a success. Does the number of successes have a Binomial distribution? 1. Yes. No 0% 0% 0 1 Countdown
5 Binomial or not? A mixed box of 10 screws contains 5 that are galvanized and 5 that are non-galvanized. Three screws are picked at random without replacement. I want galvanized screws, so consider picking a galvanized screw to be a success. Does the number of successes have a Binomial distribution? No, the picks are not independent Independent events have P A B = P(A) but P second galvanized first galvanized P(second galvanized) - If the first is galvanized, then only 4 9 of the remaining screws are galvanized, which is 1 Note: If the box were much larger then consecutive picks would be nearly independent - Binomial then a good approximation. e.g. if box of 1000 screws, with 500 galvanized P second galvanized first galvanized = =
6 Mean and variance of a binomial distribution If X B(n, p), μ = E X = np σ = var(x) = np(1 p) Derivation Suppose first that we have a single Bernoulli trial. Assign the value 1 to success, and 0 to failure, the first occurring with probability p and the second having probability 1 p. The expected value for one trial is μ 1 = The variance in a single trial is: k kp X = k = 1 p p = p Since the n trials are independent, the total expected value is just the sum of the n expected values for each trial, hence μ 1 = np i=1. σ 1 = X X = 1 p p p = p(1 p) Hence the variance for the sum of n independent trials is, by the rule for summing the variances of independent variables, σ n = i=1 σ 1 = np 1 p.
7 Polling In the French population about 0% of people prefer Le Pen to other candidates (inc. Hollande and Sarkozy). Mean and variance of a binomial distribution μ = np σ = np(1 p) An opinion poll asks 1000 people if they will vote for Le Pen (YES) or not (NO). The expected number of Le Pen voters (YESs) in the poll is therefore μ = np = 00 What is the standard deviation (approximately)? % 0% 0% 0% 0% Countdown
8 Polling In the French population about 0% of people prefer Le Pen to other candidates (inc. Hollande and Sarkozy). An opinion poll asks 1000 people if they will vote for Le Pen (YES) or not (NO). The expected number of Le Pen voters (YESs) in the poll is therefore μ = np = 00 What is the standard deviation (approximately)? The number of YES votes has a distribution X B 1000,0. The variance is therefore σ = np 1 p = (1 0.) = = 160 σ = σ = expect 00 ± 1.6 in poll to say Le Pen i.e. the fractional error of % Note: quoted errors in polls are not usually the standard deviation see later
9 Binomial Distribution Summary Discrete random variable X ~ B(n, p) if X is the number of successes in n independent Bernoulli trials each with probability p of success P X = k = n k pk 1 p n k Mean and variance μ = np σ = np(1 p)
10 Poisson distribution If events happen independently of each other, with average number of events in some fixed interval λ, then the distribution of the number of events k in that interval is Poisson. A random variable X has the Poisson distribution with parameter λ(> 0) if P X = k = e λ λ k k! (k = 0,1,, ) If you are interested in the derivation, see the notes.
11 Examples of possible Poisson distributions 1) Number of messages arriving at a telecommunications system in a day ) Number of flaws in a metre of fibre optic cable 3) Number of radio-active particles detected in a given time 4) Number of photons arriving at a CCD pixel in some exposure time (e.g. astronomy observations) Sum of Poisson variables If X is Poisson with average number λ X and Y is Poisson with average number λ Y Then X + Y is Poisson with average number λ X + λ Y The probability of events per unit time does not have to be constant for the total number of events to be Poisson can split up the total into a sum of the number of events in smaller intervals.

12 P(X = k) Example: On average lightning kills three people each year in the UK, λ = 3. What is the probability that only one person is killed this year? Answer: Assuming these are independent random events, the number of people killed in a given year therefore has a Poisson distribution: Let the random variable X be the number of people killed in a year. k Poisson distribution P X = k = e λ λ k k! with λ = 3 P X = 1 = e ! 0.15
13 Poisson distribution Question from Derek Bruff Suppose that trucks arrive at a receiving dock with an average arrival rate of 3 per hour. What is the probability exactly 5 trucks will arrive in a two-hour period? e ! e ! e ! e ! Reminder: P X = k = e λ λ k k! 0% 0% 0% 0% Countdown

14 Poisson distribution Suppose that trucks arrive at a receiving dock with an average arrival rate of 3 per hour. What is the probability exactly 5 trucks will arrive in a two-hour period? In two hours mean number is λ = 3 = 6. P X = k = 5 = e λ λ k k! = e !

15 Mean and variance If X Poisson with mean λ, then μ = E X σ = var X = λ = λ
16 Example: Telecommunications Messages arrive at a switching centre at random and at an average rate of 1. per second. (a) Find the probability of 5 messages arriving in a -sec interval. (b) For how long can the operation of the centre be interrupted, if the probability of losing one or more messages is to be no more than 0.05? Answer: Times of arrivals form a Poisson process, rate ν = 1./sec. (a) Let Y = number of messages arriving in a -sec interval. Then Y ~ Poisson, mean number λ = νt = 1. =.4 P Y = k = 5 = e λ λ k k! = e ! = 0.060
17 Question: (b) For how long can the operation of the centre be interrupted, if the probability of losing one or more messages is to be no more than 0.05? Answer: (b) Let the required time = t seconds. Average rate of arrival is 1./second. Let k = number of messages in t seconds, so that k Poisson, with λ = 1. t = 1.t Want P(At least one message) = P k 1 = 1 P k = P k = 0 = e λ λ k k! = e 1.t 1.t 0 0! = e 1.t 1 e 1.t 0.05 e 1.t e 1.t t ln 0.95 = t seconds

18 Poisson or not? Which of the following are likely to be well modelled by a Poisson distribution? (can click more than one) Can you tell what is fish, or will you flounder? 1. Number of duds found when I test four components. The number of heart attacks in Brighton each year 3. The number of planes landing at Heathrow between 8 and 9am 4. The number of cars getting punctures on the M1 each year 5. Number of people in the UK flooded out of their home in July 0% 0% 0% 0% 0% Countdown
19 Are they Poisson? Answers: Number of duds found when I test four components - NO: this is Binomial (it is not the number of independent random events in a continuous interval) The number of heart attacks in Brighton each year - YES: large population, no obvious correlations between heart attacks in different people The number of planes landing at Heathrow between 8 and 9am - NO: 8-9am is rush hour, planes land regularly to land as many as possible (1- a minute) they do not land at random times or they would hit each other! The number of cars getting punctures on the M1 each year - YES (roughly): If punctures are due to tires randomly wearing thin, then expect punctures to happen independently at random But: may not all be independent, e.g. if there is broken glass in one lane Number of people in the UK flooded out of their home in July - NO: floodings of different homes not at all independent; usually a small number of floods each flood many homes at once, P flooded next door flooded P(flooded)
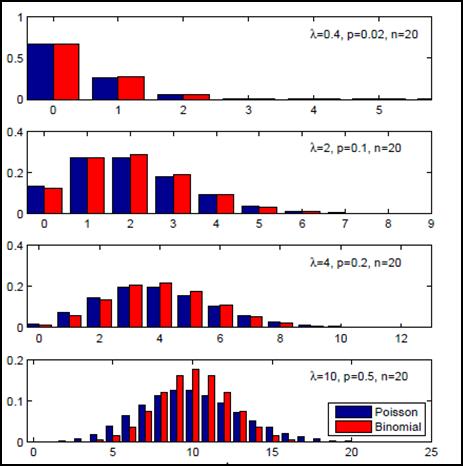
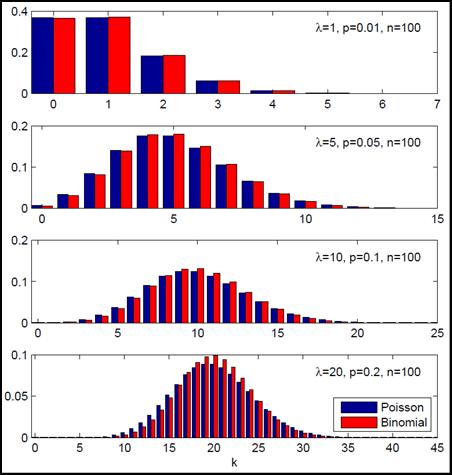
. In that case, if X B(n, p) then P(X = k) e λ λ k k! Where λ = np i.e. X is approximately Poisson, with mean λ = np.")
20 Approximation to the Binomial distribution The Poisson distribution is an approximation to B(n, p), when n is large and p is small (e.g. if np < 7, say). In that case, if X B(n, p) then P(X = k) e λ λ k k! Where λ = np i.e. X is approximately Poisson, with mean λ = np.
21
22
23 Example The probability of a certain part failing within ten years is Five million of the parts have been sold so far. What is the probability that three or more will fail within ten years? Answer: Let X = number failing in ten years, out of 5,000,000; X B( ,10 6 ) Evaluating the Binomial probabilities is rather awkward; better to use the Poisson approximation. X has approximately Poisson distribution with λ = np = = 5. P(Three or more fail) = P X 3 = 1 P X = 0 P X = 1 P(X = ) = 1 e ! e ! e 5 5! = 1 e = For such small p and large n the Poisson approximation is very accurate (exact result is also to three significant figures).
24 Poisson Distribution Summary Describes discrete random variable that is the number of independent and randomly occurring events, with mean number λ. Probability of k such events is P X = k = e λ λ k k! Mean and variance: μ = σ = λ The sum of Poisson variables X i is also Poisson, with average number λ i i Approximation to Binomial for large n and small p: if X B(n, p) then P(X = k) e λ λ k k! where λ = np
25 Continuous Random Variables A continuous random variable is a random variable which can take values measured on a continuous scale e.g. weights, strengths, times or lengths. For any pre-determined value x, P X = x = 0, since if we measured X accurately enough, we are never going to hit the value x exactly. However the probability of some region of values near x can be non-zero. Probability density function (pdf):f(x) P( 1.5 < X < 0.7) b P a X b = f x dx a f(x) Probability of X in the range a to b.
26 Normalization: Since X has to have some value f x dx = P < X < = 1 And since 0 P 1, for a pdf, f x 0 for all x. Cumulative distribution function (cdf) : This is the probability of X < x. x F x P X < x = f x dx F x = P(X < 1.1)
27 Mean Expected value (mean) of X: μ = xf x dx Variance Variance of X: σ = x μ f x dx = x f x dx μ Note: the mean and variance may not be well defined for distributions with broad tails. The mode is the value of x where f x is maximum (which may not be unique). Mean μ P X < x = 0.5 Mode The median is given by the value of x where x f x dx = 1. P X > x = 0.5 Median
28 Question from Derek Bruff Probability density function Consider the continuous random variable X = the weight in pounds of a randomly selected new-born baby. Let f be the probability density function for X. It is safe to assume that P(X < 0) = 0 and P(X < 0) = 1. Which of the following is not a justifiable conclusion about f given this information? 1. No portion of the graph of f can lie below the x-axis.. f is non-zero for x in the range 0 x < 0 3. The area under the graph of f between x = 0 and x = 0 is The non-zero portion of the graph of f lies entirely between x = 0 and x = 0. 0% 0% 0% 0% Countdown
 = 0 and P(X < 0) = 1. Which of the following is not a justifiable conclusion about f given this information? 1. No portion of the graph of f can lie below the x-axis.")
29 Probability density function Consider the continuous random variable X = the weight in pounds of a randomly selected new-born baby. Let f be the probability density function for X. It is safe to assume that P(X < 0) = 0 and P(X < 0) = 1. Which of the following is not a justifiable conclusion about f given this information? 1. No portion of the graph of f can lie below the x-axis. - Correct, f x 0 for all probabilities to be 0. f is non-zero for x in the range 0 x < 0 - Incorrect, f x can be zero e.g babies must weigh more than an embryo, so at least f x < embryo weight = 0 3. The area under the graph of f between x = 0 and x = 0 is Correct. f x dx = f(x) dx = 1 4. The non-zero portion of the graph of f lies entirely between x = 0 and x = 0. - Correct. P x < 0 = 0 f x < 0 = 0 and P x < 0 = 1 f(x) 0 dx = 0
30 Uniform distribution The continuous random variable X has the Uniform distribution between θ 1 and θ, with θ 1 < θ if f x = x otherwise X U(θ 1, θ ), for short. f(x) 1 x
31 Occurrence of the Uniform distribution 1) Waiting times from random arrival time until a regular event (see later) ) Simulation: programming languages often have a standard routine for simulating the U(0, 1) distribution. This can be used to simulate other probability distributions. Actually not very common
32 Example: Disk wait times In a hard disk drive, the disk rotates at 700rpm. The wait time is defined as the time between the read/write head moving into position and the beginning of the required information appearing under the head. (a) Find the distribution of the wait time. (b) Find the mean and standard deviation of the wait time. (c) Booting a computer requires that 000 pieces of information are read from random positions. What is the total expected contribution of the wait time to the boot time, and rms deviation? Answer: (a) Rotation rate of 700rpm gives rotation time = s = 8.33ms. Wait time can be anything between 0 and 8.33ms and each time in this range is as likely as any other time. Therefore, distribution of the wait time is uniform, U(0, 8.33ms)
33 Mean and variance: for U(θ 1, θ ) Proof: μ = θ 1+θ Let y be the distance from the midpoint, and the width be w = θ θ 1. y = x (θ + θ 1 )/ f(x) σ = θ θ 1 1 Mid-point (θ 1 + θ )/ y 1 w = θ θ 1 x Then since x = θ 1+θ + y, and means add μ = x = θ + θ 1 + y = θ + θ 1 w + yf(y)dy w = θ + θ 1 w + y 1 w dy = θ 1 + θ +0 w Unsurprisingly the mean is the midpoint!
34 Variance: σ = w x μ f x = y 1 w dy = 1 w w y 3 w 3 w dx f(x) μ y 1 w = θ θ 1 x = 1 3w w w3 8 = w 1 = θ θ 1 1
35 Example: Disk wait times In a hard disk drive, the disk rotates at 700rpm. The wait time is defined as the time between the read/write head moving into position and the beginning of the required information appearing under the head. (b) Find the mean and standard deviation of the wait time. Answer: (b) μ = θ 1+θ = ms = 4.17 ms σ = θ θ 1 1 = ms = 5.8 ms σ =.4 ms
36 Example: Disk wait times In a hard disk drive, the disk rotates at 700rpm. The wait time is defined as the time between the read/write head moving into position and the beginning of the required information appearing under the head. (c) Booting a computer requires that 000 pieces of information are read from random positions. What is the total expected contribution of the wait time to the boot time, and rms deviation? Answer: (c) μ = 4. ms For 000 reads the mean total time is μ tot =000 4.ms = 8.3s. Note: rms = Root Mean Square = standard deviation σ =.4 ms So the variance is σ tot = 000 σ = ms = 0.01s σ tot = 0.01 s = 0.11s
Guidelines for Solving Probability Problems
 Guidelines for Solving Probability Problems CS 1538: Introduction to Simulation 1 Steps for Problem Solving Suggested steps for approaching a problem: 1. Identify the distribution What distribution does
Time: 1 hour 30 minutes
 Paper Reference(s) 6684/01 Edexcel GCE Statistics S Silver Level S4 Time: 1 hour 30 minutes Materials required for examination papers Mathematical Formulae (Green) Items included with question Nil Candidates
A Probability Primer. A random walk down a probabilistic path leading to some stochastic thoughts on chance events and uncertain outcomes.
 A Probability Primer A random walk down a probabilistic path leading to some stochastic thoughts on chance events and uncertain outcomes. Are you holding all the cards?? Random Events A random event, E,
Some Continuous Probability Distributions: Part I. Continuous Uniform distribution Normal Distribution. Exponential Distribution
 Some Continuous Probability Distributions: Part I Continuous Uniform distribution Normal Distribution Exponential Distribution 1 Chapter 6: Some Continuous Probability Distributions: 6.1 Continuous Uniform
EXAM. Exam #1. Math 3342 Summer II, July 21, 2000 ANSWERS
 EXAM Exam # Math 3342 Summer II, 2 July 2, 2 ANSWERS i pts. Problem. Consider the following data: 7, 8, 9, 2,, 7, 2, 3. Find the first quartile, the median, and the third quartile. Make a box and whisker
Bernoulli Trials, Binomial and Cumulative Distributions
 Bernoulli Trials, Binomial and Cumulative Distributions Sec 4.4-4.6 Cathy Poliak, Ph.D. cathy@math.uh.edu Office in Fleming 11c Department of Mathematics University of Houston Lecture 9-3339 Cathy Poliak,
POISSON RANDOM VARIABLES
 POISSON RANDOM VARIABLES Suppose a random phenomenon occurs with a mean rate of occurrences or happenings per unit of time or length or area or volume, etc. Note: >. Eamples: 1. Cars passing through an
Introduction to Statistical Data Analysis Lecture 3: Probability Distributions
 Introduction to Statistical Data Analysis Lecture 3: Probability Distributions James V. Lambers Department of Mathematics The University of Southern Mississippi James V. Lambers Statistical Data Analysis
Random Variables Example:
 Random Variables Example: We roll a fair die 6 times. Suppose we are interested in the number of 5 s in the 6 rolls. Let X = number of 5 s. Then X could be 0, 1, 2, 3, 4, 5, 6. X = 0 corresponds to the
Lecture 20 Random Samples 0/ 13
 0/ 13 One of the most important concepts in statistics is that of a random sample. The definition of a random sample is rather abstract. However it is critical to understand the idea behind the definition,
3.4. The Binomial Probability Distribution
 3.4. The Binomial Probability Distribution Objectives. Binomial experiment. Binomial random variable. Using binomial tables. Mean and variance of binomial distribution. 3.4.1. Four Conditions that determined
Statistics 2. Revision Notes
 Statistics 2 Revision Notes June 2016 2 S2 JUNE 2016 SDB Statistics 2 1 The Binomial distribution 5 Factorials... 5 Combinations... 5 Properties of n C r... 5 Binomial Theorem... 6 Binomial coefficients...
Brief Review of Probability
 Maura Department of Economics and Finance Università Tor Vergata Outline 1 Distribution Functions Quantiles and Modes of a Distribution 2 Example 3 Example 4 Distributions Outline Distribution Functions
Probability and Probability Distributions. Dr. Mohammed Alahmed
 Probability and Probability Distributions 1 Probability and Probability Distributions Usually we want to do more with data than just describing them! We might want to test certain specific inferences about
S n = x + X 1 + X X n.
 0 Lecture 0 0. Gambler Ruin Problem Let X be a payoff if a coin toss game such that P(X = ) = P(X = ) = /2. Suppose you start with x dollars and play the game n times. Let X,X 2,...,X n be payoffs in each
Chapter 7: Theoretical Probability Distributions Variable - Measured/Categorized characteristic
 BSTT523: Pagano & Gavreau, Chapter 7 1 Chapter 7: Theoretical Probability Distributions Variable - Measured/Categorized characteristic Random Variable (R.V.) X Assumes values (x) by chance Discrete R.V.
Basics on Probability. Jingrui He 09/11/2007
 Basics on Probability Jingrui He 09/11/2007 Coin Flips You flip a coin Head with probability 0.5 You flip 100 coins How many heads would you expect Coin Flips cont. You flip a coin Head with probability
37.3. The Poisson Distribution. Introduction. Prerequisites. Learning Outcomes
 The Poisson Distribution 37.3 Introduction In this Section we introduce a probability model which can be used when the outcome of an experiment is a random variable taking on positive integer values and
Counting principles, including permutations and combinations.
 1 Counting principles, including permutations and combinations. The binomial theorem: expansion of a + b n, n ε N. THE PRODUCT RULE If there are m different ways of performing an operation and for each
Continuous Distributions
 Continuous Distributions 1.8-1.9: Continuous Random Variables 1.10.1: Uniform Distribution (Continuous) 1.10.4-5 Exponential and Gamma Distributions: Distance between crossovers Prof. Tesler Math 283 Fall
Page Max. Possible Points Total 100
 Math 3215 Exam 2 Summer 2014 Instructor: Sal Barone Name: GT username: 1. No books or notes are allowed. 2. You may use ONLY NON-GRAPHING and NON-PROGRAMABLE scientific calculators. All other electronic
STAT Examples Based on all chapters and sections
 Stat 345 Examples 1/6 STAT 345 - Examples Based on all chapters and sections Introduction 0.1 Populations and Samples Ex 1: Research engineers with the University of Kentucky Transportation Research Program
18.440: Lecture 19 Normal random variables
 18.440 Lecture 19 18.440: Lecture 19 Normal random variables Scott Sheffield MIT Outline Tossing coins Normal random variables Special case of central limit theorem Outline Tossing coins Normal random
Each trial has only two possible outcomes success and failure. The possible outcomes are exactly the same for each trial.
 Section 8.6: Bernoulli Experiments and Binomial Distribution We have already learned how to solve problems such as if a person randomly guesses the answers to 10 multiple choice questions, what is the
Part 3: Parametric Models
 Part 3: Parametric Models Matthew Sperrin and Juhyun Park August 19, 2008 1 Introduction There are three main objectives to this section: 1. To introduce the concepts of probability and random variables.
STAT 516 Midterm Exam 2 Friday, March 7, 2008
 STAT 516 Midterm Exam 2 Friday, March 7, 2008 Name Purdue student ID (10 digits) 1. The testing booklet contains 8 questions. 2. Permitted Texas Instruments calculators: BA-35 BA II Plus BA II Plus Professional
Poisson Processes and Poisson Distributions. Poisson Process - Deals with the number of occurrences per interval.
 Poisson Processes and Poisson Distributions Poisson Process - Deals with the number of occurrences per interval. Eamples Number of phone calls per minute Number of cars arriving at a toll both per hour
MgtOp 215 Chapter 5 Dr. Ahn
 MgtOp 215 Chapter 5 Dr. Ahn Random variable: a variable that assumes its values corresponding to a various outcomes of a random experiment, therefore its value cannot be predicted with certainty. Discrete
Continuous Expectation and Variance, the Law of Large Numbers, and the Central Limit Theorem Spring 2014
 Continuous Expectation and Variance, the Law of Large Numbers, and the Central Limit Theorem 18.5 Spring 214.5.4.3.2.1-4 -3-2 -1 1 2 3 4 January 1, 217 1 / 31 Expected value Expected value: measure of
(Ch 3.4.1, 3.4.2, 4.1, 4.2, 4.3)
") 3 Probability Distributions (Ch 3.4.1, 3.4.2, 4.1, 4.2, 4.3) Probability Distribution Functions Probability distribution function (pdf): Function for mapping random variables to real numbers. Discrete
3 Probability Distributions (Ch 3.4.1, 3.4.2, 4.1, 4.2, 4.3) Probability Distribution Functions Probability distribution function (pdf): Function for mapping random variables to real numbers. Discrete
STAT 430/510 Probability Lecture 12: Central Limit Theorem and Exponential Distribution
 STAT 430/510 Probability Lecture 12: Central Limit Theorem and Exponential Distribution Pengyuan (Penelope) Wang June 15, 2011 Review Discussed Uniform Distribution and Normal Distribution Normal Approximation
Binomial random variable
 Binomial random variable Toss a coin with prob p of Heads n times X: # Heads in n tosses X is a Binomial random variable with parameter n,p. X is Bin(n, p) An X that counts the number of successes in many
STAT Chapter 5 Continuous Distributions
 STAT 270 - Chapter 5 Continuous Distributions June 27, 2012 Shirin Golchi () STAT270 June 27, 2012 1 / 59 Continuous rv s Definition: X is a continuous rv if it takes values in an interval, i.e., range
Statistics 100A Homework 5 Solutions
 Chapter 5 Statistics 1A Homework 5 Solutions Ryan Rosario 1. Let X be a random variable with probability density function a What is the value of c? fx { c1 x 1 < x < 1 otherwise We know that for fx to
Discrete probability distributions
 Discrete probability s BSAD 30 Dave Novak Fall 08 Source: Anderson et al., 05 Quantitative Methods for Business th edition some slides are directly from J. Loucks 03 Cengage Learning Covered so far Chapter
Definition: A random variable X is a real valued function that maps a sample space S into the space of real numbers R. X : S R
 Random Variables Definition: A random variable X is a real valued function that maps a sample space S into the space of real numbers R. X : S R As such, a random variable summarizes the outcome of an experiment
STAT2201. Analysis of Engineering & Scientific Data. Unit 3
 STAT2201 Analysis of Engineering & Scientific Data Unit 3 Slava Vaisman The University of Queensland School of Mathematics and Physics What we learned in Unit 2 (1) We defined a sample space of a random
(Ch 3.4.1, 3.4.2, 4.1, 4.2, 4.3)
") 3 Probability Distributions (Ch 3.4.1, 3.4.2, 4.1, 4.2, 4.3) Probability Distribution Functions Probability distribution function (pdf): Function for mapping random variables to real numbers. Discrete
3 Probability Distributions (Ch 3.4.1, 3.4.2, 4.1, 4.2, 4.3) Probability Distribution Functions Probability distribution function (pdf): Function for mapping random variables to real numbers. Discrete
ACM 116: Lecture 2. Agenda. Independence. Bayes rule. Discrete random variables Bernoulli distribution Binomial distribution
 1 ACM 116: Lecture 2 Agenda Independence Bayes rule Discrete random variables Bernoulli distribution Binomial distribution Continuous Random variables The Normal distribution Expected value of a random
Probability and Statistics Concepts
 University of Central Florida Computer Science Division COT 5611 - Operating Systems. Spring 014 - dcm Probability and Statistics Concepts Random Variable: a rule that assigns a numerical value to each
Lecture 13. Poisson Distribution. Text: A Course in Probability by Weiss 5.5. STAT 225 Introduction to Probability Models February 16, 2014
 Lecture 13 Text: A Course in Probability by Weiss 5.5 STAT 225 Introduction to Probability Models February 16, 2014 Whitney Huang Purdue University 13.1 Agenda 1 2 3 13.2 Review So far, we have seen discrete
INF FALL NATURAL LANGUAGE PROCESSING. Jan Tore Lønning
 1 INF4080 2018 FALL NATURAL LANGUAGE PROCESSING Jan Tore Lønning 2 Probability distributions Lecture 5, 5 September Today 3 Recap: Bayes theorem Discrete random variable Probability distribution Discrete
Part 3: Parametric Models
 Part 3: Parametric Models Matthew Sperrin and Juhyun Park April 3, 2009 1 Introduction Is the coin fair or not? In part one of the course we introduced the idea of separating sampling variation from a
Introduction to Probability
 LECTURE NOTES Course 6.041-6.431 M.I.T. FALL 2000 Introduction to Probability Dimitri P. Bertsekas and John N. Tsitsiklis Professors of Electrical Engineering and Computer Science Massachusetts Institute
Mathematical Methods (CAS) Unit 4 Revision Lecture Presented by Samuel Goh
 Unit 4 Revision Lecture Presented by Samuel Goh") Mathematical Methods (CAS) Unit 4 Revision Lecture Presented by Samuel Goh Introduction Multiple Choice Question Get familiar with the audience response software! What colour is this dress? a) Blue and
Mathematical Methods (CAS) Unit 4 Revision Lecture Presented by Samuel Goh Introduction Multiple Choice Question Get familiar with the audience response software! What colour is this dress? a) Blue and
Probability Theory and Simulation Methods. April 6th, Lecture 19: Special distributions
 April 6th, 2018 Lecture 19: Special distributions Week 1 Chapter 1: Axioms of probability Week 2 Chapter 3: Conditional probability and independence Week 4 Chapters 4, 6: Random variables Week 9 Chapter
1. If X has density. cx 3 e x ), 0 x < 0, otherwise. Find the value of c that makes f a probability density. f(x) =
, 0 x < 0, otherwise. Find the value of c that makes f a probability density. f(x) =") 1. If X has density f(x) = { cx 3 e x ), 0 x < 0, otherwise. Find the value of c that makes f a probability density. 2. Let X have density f(x) = { xe x, 0 < x < 0, otherwise. (a) Find P (X > 2). (b) Find
1. If X has density f(x) = { cx 3 e x ), 0 x < 0, otherwise. Find the value of c that makes f a probability density. 2. Let X have density f(x) = { xe x, 0 < x < 0, otherwise. (a) Find P (X > 2). (b) Find
CSE 103 Homework 8: Solutions November 30, var(x) = np(1 p) = P r( X ) 0.95 P r( X ) 0.
 = np(1 p) = P r( X ) 0.95 P r( X ) 0.") () () a. X is a binomial distribution with n = 000, p = /6 b. The expected value, variance, and standard deviation of X is: E(X) = np = 000 = 000 6 var(x) = np( p) = 000 5 6 666 stdev(x) = np( p) = 000
() () a. X is a binomial distribution with n = 000, p = /6 b. The expected value, variance, and standard deviation of X is: E(X) = np = 000 = 000 6 var(x) = np( p) = 000 5 6 666 stdev(x) = np( p) = 000
S2 QUESTIONS TAKEN FROM JANUARY 2006, JANUARY 2007, JANUARY 2008, JANUARY 2009
 S2 QUESTIONS TAKEN FROM JANUARY 2006, JANUARY 2007, JANUARY 2008, JANUARY 2009 SECTION 1 The binomial and Poisson distributions. Students will be expected to use these distributions to model a real-world
Random Variable. Discrete Random Variable. Continuous Random Variable. Discrete Random Variable. Discrete Probability Distribution
 Random Variable Theoretical Probability Distribution Random Variable Discrete Probability Distributions A variable that assumes a numerical description for the outcome of a random eperiment (by chance).
Chapter 4 Continuous Random Variables and Probability Distributions
 Chapter 4 Continuous Random Variables and Probability Distributions Part 3: The Exponential Distribution and the Poisson process Section 4.8 The Exponential Distribution 1 / 21 Exponential Distribution
Special distributions
 Special distributions August 22, 2017 STAT 101 Class 4 Slide 1 Outline of Topics 1 Motivation 2 Bernoulli and binomial 3 Poisson 4 Uniform 5 Exponential 6 Normal STAT 101 Class 4 Slide 2 What distributions
Chapter 2: Discrete Distributions. 2.1 Random Variables of the Discrete Type
 Chapter 2: Discrete Distributions 2.1 Random Variables of the Discrete Type 2.2 Mathematical Expectation 2.3 Special Mathematical Expectations 2.4 Binomial Distribution 2.5 Negative Binomial Distribution
Lecture 12. Poisson random variables
 18.440: Lecture 12 Poisson random variables Scott Sheffield MIT 1 Outline Poisson random variable definition Poisson random variable properties Poisson random variable problems 2 Outline Poisson random
SS257a Midterm Exam Monday Oct 27 th 2008, 6:30-9:30 PM Talbot College 342 and 343. You may use simple, non-programmable scientific calculators.
 SS657a Midterm Exam, October 7 th 008 pg. SS57a Midterm Exam Monday Oct 7 th 008, 6:30-9:30 PM Talbot College 34 and 343 You may use simple, non-programmable scientific calculators. This exam has 5 questions
Probability Distributions Columns (a) through (d)
 through (d)") Discrete Probability Distributions Columns (a) through (d) Probability Mass Distribution Description Notes Notation or Density Function --------------------(PMF or PDF)-------------------- (a) (b) (c)
Discrete Probability Distributions Columns (a) through (d) Probability Mass Distribution Description Notes Notation or Density Function --------------------(PMF or PDF)-------------------- (a) (b) (c)
Name: Firas Rassoul-Agha
 Midterm 1 - Math 5010 - Spring 016 Name: Firas Rassoul-Agha Solve the following 4 problems. You have to clearly explain your solution. The answer carries no points. Only the work does. CALCULATORS ARE
Special Discrete RV s. Then X = the number of successes is a binomial RV. X ~ Bin(n,p).
.") Sect 3.4: Binomial RV Special Discrete RV s 1. Assumptions and definition i. Experiment consists of n repeated trials ii. iii. iv. There are only two possible outcomes on each trial: success (S) or failure
Sect 3.4: Binomial RV Special Discrete RV s 1. Assumptions and definition i. Experiment consists of n repeated trials ii. iii. iv. There are only two possible outcomes on each trial: success (S) or failure
MATH 19B FINAL EXAM PROBABILITY REVIEW PROBLEMS SPRING, 2010
 MATH 9B FINAL EXAM PROBABILITY REVIEW PROBLEMS SPRING, 00 This handout is meant to provide a collection of exercises that use the material from the probability and statistics portion of the course The
MATH 3510: PROBABILITY AND STATS July 1, 2011 FINAL EXAM
 MATH 3510: PROBABILITY AND STATS July 1, 2011 FINAL EXAM YOUR NAME: KEY: Answers in blue Show all your work. Answers out of the blue and without any supporting work may receive no credit even if they are
Binomial and Poisson Probability Distributions
 Binomial and Poisson Probability Distributions Esra Akdeniz March 3, 2016 Bernoulli Random Variable Any random variable whose only possible values are 0 or 1 is called a Bernoulli random variable. What
18.175: Lecture 13 Infinite divisibility and Lévy processes
 18.175 Lecture 13 18.175: Lecture 13 Infinite divisibility and Lévy processes Scott Sheffield MIT Outline Poisson random variable convergence Extend CLT idea to stable random variables Infinite divisibility
Chapter 5. Statistical Models in Simulations 5.1. Prof. Dr. Mesut Güneş Ch. 5 Statistical Models in Simulations
 Chapter 5 Statistical Models in Simulations 5.1 Contents Basic Probability Theory Concepts Discrete Distributions Continuous Distributions Poisson Process Empirical Distributions Useful Statistical Models
Random Variables. Definition: A random variable (r.v.) X on the probability space (Ω, F, P) is a mapping
 X on the probability space (Ω, F, P) is a mapping") Random Variables Example: We roll a fair die 6 times. Suppose we are interested in the number of 5 s in the 6 rolls. Let X = number of 5 s. Then X could be 0, 1, 2, 3, 4, 5, 6. X = 0 corresponds to the
Random Variables Example: We roll a fair die 6 times. Suppose we are interested in the number of 5 s in the 6 rolls. Let X = number of 5 s. Then X could be 0, 1, 2, 3, 4, 5, 6. X = 0 corresponds to the
The Binomial distribution. Probability theory 2. Example. The Binomial distribution
 Probability theory Tron Anders Moger September th 7 The Binomial distribution Bernoulli distribution: One experiment X i with two possible outcomes, probability of success P. If the experiment is repeated
Massachusetts Institute of Technology
 6.04/6.4: Probabilistic Systems Analysis Fall 00 Quiz Solutions: October, 00 Problem.. 0 points Let R i be the amount of time Stephen spends at the ith red light. R i is a Bernoulli random variable with
Probability Theory and Statistics (EE/TE 3341) Homework 3 Solutions
 Homework 3 Solutions") Probability Theory and Statistics (EE/TE 3341) Homework 3 Solutions Yates and Goodman 3e Solution Set: 3.2.1, 3.2.3, 3.2.10, 3.2.11, 3.3.1, 3.3.3, 3.3.10, 3.3.18, 3.4.3, and 3.4.4 Problem 3.2.1 Solution
Probability Theory and Statistics (EE/TE 3341) Homework 3 Solutions Yates and Goodman 3e Solution Set: 3.2.1, 3.2.3, 3.2.10, 3.2.11, 3.3.1, 3.3.3, 3.3.10, 3.3.18, 3.4.3, and 3.4.4 Problem 3.2.1 Solution
STATISTICS 1 REVISION NOTES
 STATISTICS 1 REVISION NOTES Statistical Model Representing and summarising Sample Data Key words: Quantitative Data This is data in NUMERICAL FORM such as shoe size, height etc. Qualitative Data This is
1 Basic continuous random variable problems
 Name M362K Final Here are problems concerning material from Chapters 5 and 6. To review the other chapters, look over previous practice sheets for the two exams, previous quizzes, previous homeworks and
ECO227: Term Test 2 (Solutions and Marking Procedure)
") ECO7: Term Test (Solutions and Marking Procedure) January 6, 9 Question 1 Random variables X and have the joint pdf f X, (x, y) e x y, x > and y > Determine whether or not X and are independent. [1 marks]
ECO7: Term Test (Solutions and Marking Procedure) January 6, 9 Question 1 Random variables X and have the joint pdf f X, (x, y) e x y, x > and y > Determine whether or not X and are independent. [1 marks]
Confidence Intervals for the Mean of Non-normal Data Class 23, Jeremy Orloff and Jonathan Bloom
 Confidence Intervals for the Mean of Non-normal Data Class 23, 8.05 Jeremy Orloff and Jonathan Bloom Learning Goals. Be able to derive the formula for conservative normal confidence intervals for the proportion
Analysis of Engineering and Scientific Data. Semester
 Analysis of Engineering and Scientific Data Semester 1 2019 Sabrina Streipert s.streipert@uq.edu.au Example: Draw a random number from the interval of real numbers [1, 3]. Let X represent the number. Each
EDEXCEL S2 PAPERS MARK SCHEMES AVAILABLE AT:
 EDEXCEL S2 PAPERS 2009-2007. MARK SCHEMES AVAILABLE AT: http://www.physicsandmathstutor.com/a-level-maths-papers/s2-edexcel/ JUNE 2009 1. A bag contains a large number of counters of which 15% are coloured
CS 1538: Introduction to Simulation Homework 1
 CS 1538: Introduction to Simulation Homework 1 1. A fair six-sided die is rolled three times. Let X be a random variable that represents the number of unique outcomes in the three tosses. For example,
Discrete Distributions
 A simplest example of random experiment is a coin-tossing, formally called Bernoulli trial. It happens to be the case that many useful distributions are built upon this simplest form of experiment, whose
Exercises in Probability Theory Paul Jung MA 485/585-1C Fall 2015 based on material of Nikolai Chernov
 Exercises in Probability Theory Paul Jung MA 485/585-1C Fall 2015 based on material of Nikolai Chernov Many of the exercises are taken from two books: R. Durrett, The Essentials of Probability, Duxbury
success and failure independent from one trial to the next?
 , section 8.4 The Binomial Distribution Notes by Tim Pilachowski Definition of Bernoulli trials which make up a binomial experiment: The number of trials in an experiment is fixed. There are exactly two
Some Special Discrete Distributions
 Mathematics Department De La Salle University Manila February 6, 2017 Some Discrete Distributions Often, the observations generated by different statistical experiments have the same general type of behaviour.
Lecture 2: Discrete Probability Distributions
 Lecture 2: Discrete Probability Distributions IB Paper 7: Probability and Statistics Carl Edward Rasmussen Department of Engineering, University of Cambridge February 1st, 2011 Rasmussen (CUED) Lecture
Class 26: review for final exam 18.05, Spring 2014
 Probability Class 26: review for final eam 8.05, Spring 204 Counting Sets Inclusion-eclusion principle Rule of product (multiplication rule) Permutation and combinations Basics Outcome, sample space, event
HW7 Solutions. f(x) = 0 otherwise. 0 otherwise. The density function looks like this: = 20 if x [10, 90) if x [90, 100]
![HW7 Solutions. f(x) = 0 otherwise. 0 otherwise. The density function looks like this: = 20 if x [10, 90) if x [90, 100]](/thumbs/76/73074579.jpg "HW7 Solutions. f(x) = 0 otherwise. 0 otherwise. The density function looks like this: = 20 if x [10, 90) if x [90, 100]") HW7 Solutions. 5 pts.) James Bond James Bond, my favorite hero, has again jumped off a plane. The plane is traveling from from base A to base B, distance km apart. Now suppose the plane takes off from
HW7 Solutions. 5 pts.) James Bond James Bond, my favorite hero, has again jumped off a plane. The plane is traveling from from base A to base B, distance km apart. Now suppose the plane takes off from
Applied Statistics I
 Applied Statistics I (IMT224β/AMT224β) Department of Mathematics University of Ruhuna A.W.L. Pubudu Thilan Department of Mathematics University of Ruhuna Applied Statistics I(IMT224β/AMT224β) 1/158 Chapter
STAT 224 Exam 1, Version 1 Discussion (check one): Show your work for partial credit.
: Show your work for partial credit.") Last name: STAT 224 Exam 1, Version 1 Discussion (check one): Show your work for partial credit. First: 1. The four sides of a rectangluar blower enclosure consist of two short pieces chosen randomly from
Last name: STAT 224 Exam 1, Version 1 Discussion (check one): Show your work for partial credit. First: 1. The four sides of a rectangluar blower enclosure consist of two short pieces chosen randomly from
Lecture 18: Central Limit Theorem. Lisa Yan August 6, 2018
 Lecture 18: Central Limit Theorem Lisa Yan August 6, 2018 Announcements PS5 due today Pain poll PS6 out today Due next Monday 8/13 (1:30pm) (will not be accepted after Wed 8/15) Programming part: Java,
Chapter 3 Common Families of Distributions
 Lecture 9 on BST 631: Statistical Theory I Kui Zhang, 9/3/8 and 9/5/8 Review for the previous lecture Definition: Several commonly used discrete distributions, including discrete uniform, hypergeometric,
STAT509: Continuous Random Variable
 University of South Carolina September 23, 2014 Continuous Random Variable A continuous random variable is a random variable with an interval (either finite or infinite) of real numbers for its range.
b. ( ) ( ) ( ) ( ) ( ) 5. Independence: Two events (A & B) are independent if one of the conditions listed below is satisfied; ( ) ( ) ( )
 ( ) ( ) ( ) ( ) 5. Independence: Two events (A & B) are independent if one of the conditions listed below is satisfied; ( ) ( ) ( )") 1. Set a. b. 2. Definitions a. Random Experiment: An experiment that can result in different outcomes, even though it is performed under the same conditions and in the same manner. b. Sample Space: This
1. Set a. b. 2. Definitions a. Random Experiment: An experiment that can result in different outcomes, even though it is performed under the same conditions and in the same manner. b. Sample Space: This
Lecture 10: Probability distributions TUESDAY, FEBRUARY 19, 2019
 Lecture 10: Probability distributions DANIEL WELLER TUESDAY, FEBRUARY 19, 2019 Agenda What is probability? (again) Describing probabilities (distributions) Understanding probabilities (expectation) Partial
A random variable is a variable whose value is determined by the outcome of some chance experiment. In general, each outcome of an experiment can be
 Random Variables A random variable is a variable whose value is determined by the outcome of some chance experiment. In general, each outcome of an experiment can be associated with a number by specifying
5.2 Continuous random variables
 5.2 Continuous random variables It is often convenient to think of a random variable as having a whole (continuous) interval for its set of possible values. The devices used to describe continuous probability
Lecture 7: Confidence interval and Normal approximation
 Lecture 7: Confidence interval and Normal approximation 26th of November 2015 Confidence interval 26th of November 2015 1 / 23 Random sample and uncertainty Example: we aim at estimating the average height
Lecture Notes 2 Random Variables. Discrete Random Variables: Probability mass function (pmf)
") Lecture Notes 2 Random Variables Definition Discrete Random Variables: Probability mass function (pmf) Continuous Random Variables: Probability density function (pdf) Mean and Variance Cumulative Distribution
Lecture Notes 2 Random Variables Definition Discrete Random Variables: Probability mass function (pmf) Continuous Random Variables: Probability density function (pdf) Mean and Variance Cumulative Distribution
Bernoulli Trials and Binomial Distribution
 Bernoulli Trials and Binomial Distribution Sec 4.4-4.5 Cathy Poliak, Ph.D. cathy@math.uh.edu Office in Fleming 11c Department of Mathematics University of Houston Lecture 10-3339 Cathy Poliak, Ph.D. cathy@math.uh.edu
Discrete and continuous
 Discrete and continuous A curve, or a function, or a range of values of a variable, is discrete if it has gaps in it - it jumps from one value to another. In practice in S2 discrete variables are variables
Outline PMF, CDF and PDF Mean, Variance and Percentiles Some Common Distributions. Week 5 Random Variables and Their Distributions
 Week 5 Random Variables and Their Distributions Week 5 Objectives This week we give more general definitions of mean value, variance and percentiles, and introduce the first probability models for discrete
Lecture 14. Text: A Course in Probability by Weiss 5.6. STAT 225 Introduction to Probability Models February 23, Whitney Huang Purdue University
 Lecture 14 Text: A Course in Probability by Weiss 5.6 STAT 225 Introduction to Probability Models February 23, 2014 Whitney Huang Purdue University 14.1 Agenda 14.2 Review So far, we have covered Bernoulli
MTH4451Test#2-Solutions Spring 2009
 Pat Rossi Instructions. MTH4451Test#2-Solutions Spring 2009 Name Show CLEARLY how you arrive at your answers. 1. A large jar contains US coins. In this jar, there are 350 pennies ($0.01), 300 nickels ($0.05),
Poisson Distribution (Poisson Random Variable)
") Poisson Distribution (Poisson Random Variable) Practical applications for Poisson random variables include 1. Number of phone calls per hour (day or week, etc.) received at an exchange or a call center
Poisson Distribution (Poisson Random Variable) Practical applications for Poisson random variables include 1. Number of phone calls per hour (day or week, etc.) received at an exchange or a call center
CONTINUOUS RANDOM VARIABLES
 the Further Mathematics network www.fmnetwork.org.uk V 07 REVISION SHEET STATISTICS (AQA) CONTINUOUS RANDOM VARIABLES The main ideas are: Properties of Continuous Random Variables Mean, Median and Mode
(a) Calculate the bee s mean final position on the hexagon, and clearly label this position on the figure below. Show all work.
 Calculate the bee s mean final position on the hexagon, and clearly label this position on the figure below. Show all work.") 1. A worker bee inspects a hexagonal honeycomb cell, starting at corner A. When done, she proceeds to an adjacent corner (always facing inward as shown), either by randomly moving along the lefthand edge
1. A worker bee inspects a hexagonal honeycomb cell, starting at corner A. When done, she proceeds to an adjacent corner (always facing inward as shown), either by randomly moving along the lefthand edge