June 12 to 15, 2011 San Diego, CA. for Wafer Test. Lance Milner. Intel Fab 12, Chandler, AZ
|
|
|
- Roy Edwards
- 6 years ago
- Views:
Transcription


1 June 12 to 15, 2011 San Diego, CA Statistical Analysis Fundamentals for Wafer Test Lance Milner Intel Fab 12, Chandler, AZ
2 Why Statistics? In God we trust. All others bring data. W Edwards Deming ( )
3 Data Driven Decision Making We use statistics to learn about a process or piece of equipment and to make decisions. Is this technology better than that one? Is the second metrology tool producing equivalent results to the first one? Is the manufacturing process stable and capable? 3
4 Statistical Tools, Techniques and Concepts Graphical techniques to study data Distributions, Trend charts, box plots, probability plots, control charts etc Analytical techniques to process data Summary and descriptive metrics ( Mean, Standard Deviation etc ) Decision making and hypothesis testing Concepts and Models Distributions andprobability Confidence intervals Risk assessments 4
5 Visualizing Data : Distributions Distributions are fundamental to a lot of statistical analysis. They are also very useful to quickly understand the structure of a dataset. MEASURED VALUES DISTRIBUTION Spread Center X X X X X X X X X Quality Char acteristic Most Values are Her e Fe w Value s are Her e 5
6 Distributions, Continued A distribution is described by its shape, center, and spread. Shape is determined by: Symmetry Modality Outliers Common measures of center: Mean Median Common measures of spread: Range, Interquartile Range (IQR) Standard Deviation, Variance 6

7 Distribution Shape : Symmetry Symmetric Skewed Portions above and below the center are roughly mirror images. Examples: Heights of females. Measurement errors. Average dil daily temperatures Skewed Skewed left long tail to the left. Skewed right long tail to the right. Examples: Total daily rainfall (right) Annual salaries (right) 7

8 Distribution Shape Modality Modality Mode: Most frequent value. Modality: Number of peaks in a dataset. Bi Modal Two peaks Tri Modal Three peaks Multi Modal Modal Many peaks Usually the result of the combination of multiple groups of data Examples : Heights of American and Japanese males ( bimodal) Length measurements from 3 machines that have not been calibrated and matched 8
9 Distribution Shape Outliers Outliers are observations that fall outside the rest of the distribution. Outliers are usually the result of special causes. Do not simply delete and ignore outliers! Their cause needs to be identified and understood. Analysis should be done with and without outliers to understand their effect. 9
10 Outliers: Potential Mistakes Do not simply delete and ignore outliers! Their cause needs to be identified dand understood. They almost always have some meaning. Analysis should be done with and without outliers to understand their effect.
11 Distributions: Measures of Center The mean and median are equivalent for symmetric distributions. Median Mean The mean is influenced by extreme values. Skewed left: mean < median. Skewed right: mean > median
12 Distributions: Measures of Spread 12
13 Distributions Wrapup Group of numbers put together is known as a distribution. While many things are happening within a distribution, ib i and they may be very large, the key information about a distribution can be summarized dby three concepts Shape Center Spread
14 Graphical Tools
15 Graphical Representation of Data You can tell a lot just by looking at it Yogi iberra
16 Graphical Tools: Histogram Most common and simple tool for data representation. Effective for identifying center, spread, and shape of distribution. Less effective for comparing multiple distributions.
17 Graphical Tools: Boxplots Also known as a 5 number summary. Will show the Minimum, Maximum, Q1, Q3, and Median. Can loose some information ato of a distribution, but can be used to effectively demonstrate distribution differences.
18 Graphical Tools: Trend Plots Used to determine stability of a distribution over time. Can identify shifts in the data and detect subtle trends. Distribution ib i of interest on Y axis, time on X axis. A stable process has mean and standard deviation consistent over a period of time. An extension of the Trend Plot is the Control Charts, as the basis for Statistical Process Control.
19 Graphical Tools: Trend Plots Is this process stable? Precise timing of process Precise timing of process shift identified.
20 Graphical Tools: Normal Probability Plots Can be used to test normality of distribution. Plots distribution on X axis, normalized value on Y axis. Effective for comparing multiple distributions at once.
21 Graphical Tool Comparisons
22 Graphical Mistakes Which piece of the pie is bigger?


23 Graphical Mistakes The bar graph is better for categorical data. Arc lengthofcircle very difficulttoto detect with human eye.


24 Graphical Mistakes 3D graphs can be difficult to read


25 Graphical Mistakes Always beware of the scale of the graph. Which shows a larger gap?
26 CPK Example Data Data in this example is a comparison of 3 different technologies (using made up data) comparing the CPK of probe marks. CPK is a measure of how close a distribution ib i is to violating a spec limit. In this case, how close the probe marks are to the edge of the pad. CPK value of less than 1.0 is considered to indicate low level of quality. CPK value above 1.3 is an indication of higher quality.
27 Summary data Technology Mean SD A B C
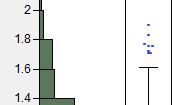
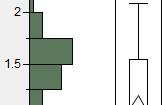
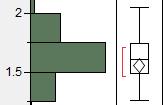
28 Histograms A is skewed B is bi-modal C has outliers
29 Box Plot Comparison
30 Box Plots and Normal Probability Plots Probability plots can be effective at comparing multiple distributions. Probability plots can be busy but effectively show the nuances of a distribution.

31 Time Plots Relatively constant Clear shift seen trend over time for with B. This A. information can be used to determine why the sift happened. Timing of outliers can be seen with trend plots.
32 Graphics Wrapup Use histogram to get first idea of distribution shape, center, and spread. Prob plots and box plots can be used to compare multiple li l distributions ib i at once. Once items of interest are identified within a distribution, look at trend plots to determine specific trends, shifts, or spikes in data. Always ask What question are we asking the data?
33 Normal Distribution

34 The Normal Distribution Also known as the Bell Curve, or the Gaussian Distribution. Is critical to Statistical understanding for 3 reasons: Distribution ib i occurs frequently in nature Central Limit Theorem states that distribution of means of ANY distribution tion will be normal Predictable percentiles.


35 Normal Distribution: Central Limit Theorem Distribution of unknown shape. Mean = 1.0, Standard deviation = 1.0 Randomly sample 16 data points at a time, calculate l mean of each sample. Plot distribution of means. Distribution is normal. Mean = 1.0, Standard d error = s 1 n
36 Normal Distribution: CLT A f d l Averages of random sample of size N.
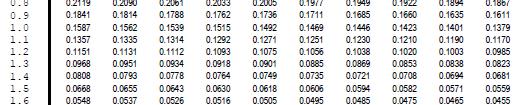
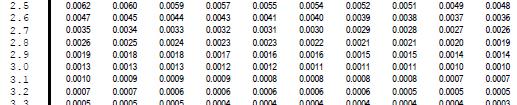
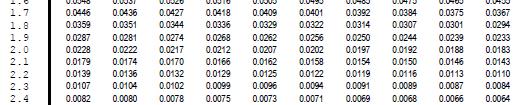
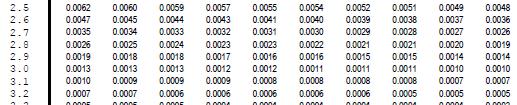
37 Normal Probabilities It is known that tthe region within +/ 1 standard deviation of the mean of a normal distribution ib ti will contain ti 68% of the data. dt The region within +/ 2 standard deviations of the mean will contain 95% of the data. The region within +/ 3 standard deviations of the mean will contain 99.7% of the data. Other percentiles es asodete also determined ed by Z table.
38 Normal Probabilities
39 Normal Probability: Z score Percent of distribution from a single data point can be determined by normalizing the data point to the mean and standard deviation of the distribution. Uses the Z score formula. Z x
40 Normal Probability: Z score example Measured values are normally distributed with a mean of 5400 and a standard deviation of 50. What is the probability of the next value chosen being 5487, assumingthe process is problem free? x Z

41
 P( Z 1.")

42 P( X 5487 ) P( Z 1.74 )
43 Normal Distribution Mistakes Do not always assume that distributions are normal. Dangerous to apply normal probabilities and Z scores to non normal data. CLT makes the distributions ib i of larger sample means normal, but not the original distribution.
44 Normal Distribution Review Normal Distribution key to Statistical understanding Common in nature Central Limit Theorem states that distribution of sample means will be normal. Normal probability means that with only the overall mean, standard deviation, and a single point, one can determine the percentile of that single point.
45 Statistical Sampling


46 Population vs. Sample Population: Consists of ALL measurements for a specific group. Sample: A representative subset of a population. p Sampling is a more cost effective and efficient way of measuring an entire population, and nearly as accurate.
47 Population vs. Sample Population The entire population of the United States of America (census) Every single Canadian Goose Planarity and orientation of every single probe within a probe card array. Sample A marketing study of 1000 Americans for a certain test product A sample of 200 Canadian Geese being tracked in a migration study Measurements of the planarity and orientation of a smaller subset of the probes used to estimate the overall probe card health
48 Good sampling Sampling can be a highly effective way of measuring an infinitely large population. Sample must be indicative of overall population. Sample should be sufficiently random. Sample size should be adequate. Avoidconvenience sampling.
49 Good Sampling: Randomization If sample is chosen from a population in a way that each member of the population has an equal way of being chosen, it is random. Non random samples contain bias.
50 Example of Bad Randomization A B C D E 1 A1 8 B1 19 C1 13 D1 7 E1 8 2 A2 11 B2 25 C2 32 D2 22 E2 6 3 A3 B3 C3 D3 E A4 8 5 A5 13 B4 32 B5 10 C4 24 C5 18 D4 21 D5 16 E4 4 E5 12
51 Sample Size 33 1/3 of the mice used in the experiment were cured by the test drug; 33 1/3 of the test population were unaffected by the drug and remained ina moribundcondition; the third mouse got away. Erwin Nt Neter
52 Sample Size Logically, the larger the sample size, the closer the results will be to the population. Solid estimates can be obtained with sample sizes of around 20 to 30. Sampling should be based on measurement level withhighestlevelhighest ofvariability. Ex: Variability likely larger from one probe card to another rather than within a single probe card. Better to sample more cards and fewer probes within card.
53 Sample Size Detectable Difference 0.35 standard deviations standard deviations standard 0.75 deviations standard deviations standard deviations standard deviations 6 Gross Reality Check (GRC) Minimal Sample Size 5 or less Note: numbers are taken from a larger sample size table for a 1 sample hypothesis test assuming alpha and beta values of 0.05.
54 Parameters vs. Statistics Parameter is a number describing a characteristic of a population. Statistic is a number describing a characteristic of a sample. In short, study of Statistics is study of using sample data as estimate for unknown population parameter. Calculation Parameter Statistic Mean x Standard Deviation s
55 Sampling Wrapup Populations contain every possible set of the data in question, but is often very difficult or impossible to completely measure. Sampling is an effective way to measure part of a distribution which will represent the population. Some of the mistakes made in sampling include not randomizing, using an insufficient sample size, or pulling non representative samples.
56 Measurement Capability
57 Metrology Wafer Test is a Metrology the product of testingwafers isdata. We don t actually change the Silicon, we just measure and report on it.
58 Measurement Statistics concepts Bias: How close is measurement to real value. Precision: Measure of the variability bl of measurements. Defined as how closely multiple li l measurements of same thing resemble each other.
59 Bias is: Accuracy: Bias Thenumerical value used to quantify accuracy. The difference between the mean value of all the measurements ( ) and the true value ( 0 ). Note: Bias is sometimes called offset. Bias = - 0 Bias is not number of significant digits of a measurement. If something is measured to 15 decimal places it has a high level of resolution, not necessarily high accuracy. 59
60 Accuracy: Bias Bias quantifies the amount by which a metrology is consistently off target from the true value. True value must be based on known standard. Note: Bias can be positive or negative. = Mean of Measurements BIAS = = = True Value
61 Precision Precision measures the natural variation of repeated measurements. The total variation in the measurement system is quantified by σ ms (standard deviation of the measurement system). The smaller the standard deviation, the better the precision Precision is also known as spread or noise. Distribution of Measurements of Same Part Standard Deviation = = ms PRECISION 61
62 Accuracy vs. Precision The difference between precision and accuracy: Accuracy describes how close the measurements are to the truth. Precision describes how close the measurements are to each other. 62
 (Mean is off Target) Precise (Small")
 Intel metrology almost always")

63 Precision and Bias Unbiased Biased (Mean is on Target) (Mean is off Target) Precise (Small Standard Deviation) Not Precise (Large Standard Deviation) Intel metrology almost always assesses precision and bias relative to a specified reference tool, rather than a NIST reference standard 63
64 Two Components of Precision Precision can be separated into two components, called repeatability and reproducibility y( (abbreviated R&R ). The variance of the measurement system is the sum of the repeatability variance and the reproducibility variance. 64
65 Repeatability Repeatability is: Thevariation that results when repeated measurements are made of a parameter under identical conditions: Same operator Same set up procedure Same environmental conditions During a very short period of time The inherent variability of the measurement equipment and method. Measured dby rpt, the standard ddeviation of the distribution ib ti of repeated measurements. 65
66 Dynamic vs. Static Repeatability Static Repeatability: Measures the inherent variability in the measurement tool itself. Variation from repeated measurements in which the part is not removed from the tool between measurements. Dynamic Repeatability: Measures the inherent variability of the tool and the measurement method. Variation from repeated measurements in which the part is removed and re fixtured between measurements. 66
67 Examples: Static vs. Dynamic Static Repeatability: Unit is Placed in Thermal Resistance is Unit is Removed Socket Measured 30 Times from Socket Dynamic Repeatability: Repeat 30 times Unit is Placed in Socket Thermal Resistance is Measured Once Unit is Removed from Socket 67
68 Dynamic or Static? Dynamic repeatability will usually discover problems with the measurement tool sooner rather than later. Can be used to check robustness of other elements of the measurement process including procedures and fixtures. Static repeatability is always smaller than dynamic repeatability. If dynamic repeatability is too large, a small additional experiment can be done to investigate if the large variation is due to the static repeatability or to other elements. Dynamic repeatability is always preferred. 68
69 Reproducibility Reproducibility is: The variation that results when different conditions are used to make the same measurement: Different operators Different set ups Different positions Different measurement media or fixtures Different environmental conditions Different times Measured by rpd, which is approximately the standard deviation of all measurements taken under different conditions. 69
70 Two Components of Precision The variance of the measurement system is the sum of the repeatability variance and the reproducibility variance. Recall that: 2 Measurement System (ms) 2 Repeatability (rpt) 2 Reproducibility (rpd) 2 2 (1 2)
71 Capability The capability of a manufacturing process is its ability to meet specifications. In contrast, the capability of a measurement system is the amount of the spec window that is lost to measurement variation. 71
72 Measurement System Capability Two Sided Specs Single Sided Spec LSL USL Process Mean USL Spec Window = USL - LSL Spec Window Total Measurement Total Measurement Error Variation = 6 MS Error Variation = 3 MS 72
73 P/T Ratio The capability bl of the measurement system is quantified by the Precision to Tolerance (P/T) Ratio. The P/T ratio expresses the percentage of the spec window that is lost to measurement error. 73
74 P/T Ratio Formula For two sided specs (both USL and LSL): 6 MS MS P/T 100% USL - LSL For one sided specs (either USL or LSL): 3 MS P/T TOL Where: TOL = (Process Mean LSL) for LSL only TOL = (USL Process Mean) for USL only 100 % 74
75 P/T Ratio Criteria Smaller P/T values are desirable. P/T 30%: Measurement system is capable. P/T > 30%: Measurement system is not capable (not precise enough). P/T ratios can also be computed for repeatability, by replacing ms with rpt (denoted d as P/T rpt ). 75
76 Confidence Interval

.")
77 Confidence Interval On April 16, 2011 Pat s Run (the Pat Tillman Memorial Run) was held in Tempe, AZ with over 22,000 participants. A random sample of 75 results show that the averagefinishing timewas48:30 (witha standard deviation of 460 seconds). Can we believe that the actual mean of all 22,000 finishers was EXACTLY 48:30? Can we believe that the actual value was close? How close?
78 Confidence Interval x Z / 2 n
79 95% Confidence Interval x 2 n
80 x Race Time Confidence Interval 2 n ,3016 Calculations X-bar=48:30 = 2910 seconds, s=460 seconds, n=75. Calculated 95% Confidence Interval between 46:44 and 50:16. Recall that with sampling, we 75 using partial data to estimate a true mean value which we cannot know at this time. 95% Confidence Interval means that We can be 95% certain that the true mean value lies within the interval.
81 Confidence Interval Most of the time, a sample will create a confidence interval which contains the true value. (95% of the time for a 95% CI) 1 in 20 samples will by random chance create a CI which will not contain the true mean.
82 Confidence Intervals 99.7% 95% 90% Adjusting the confidence level leads to changing size interval. Tradeoff of more confidence against less useful information. 68%
83 Confidence Interval Lower process variation leads to tighter confidence x Z / 2 n Increasing confidence level leads to lower probability of being wrong. Higher sample size leads to tighter confidence
84 Confidence Interval: T Distribution Use of the Z score (standard normal table) requires sufficiently large sample size and a known process standard deviation (sigma). Since these assumptions are almost always not met, best to use the T distribution. T distribution utilizes information on sample size, and will slightly penalize the confidence interval size for smaller samples.
85 Confidence Interval based on T Sample standard deviation x t / 2, df s n


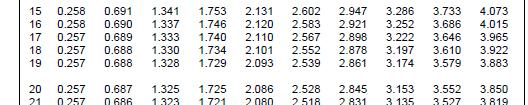
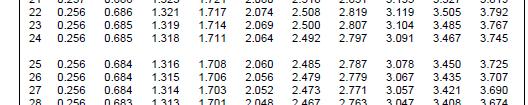
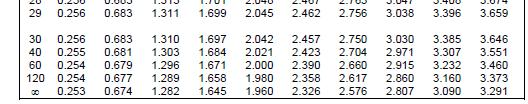
86 df n 1
87 Confidence Interval Wrapup Confidence intervals can be used to determine how closely a statistic estimate is to the population parameter. With iha 95% CI, we are 95% confident that the true mean lies somewhere within the interval. Best to use the T distribution since actual sigma is often not known.
88 Acknowledgements Bulk of material adapted from the following Intel Statistical training material: Stat Basics Rev 3.2 Survival Statistics Rev 4 Measurement Capability Analysis Rev Thanks for some data and guidance from Tom S Leahy, Intel STTD, Hillsboro, OR. June 12 to 15, 2011 IEEE SW Test Workshop 88
Shape, Outliers, Center, Spread Frequency and Relative Histograms Related to other types of graphical displays
 Histograms: Shape, Outliers, Center, Spread Frequency and Relative Histograms Related to other types of graphical displays Sep 9 1:13 PM Shape: Skewed left Bell shaped Symmetric Bi modal Symmetric Skewed
Variables, distributions, and samples (cont.) Phil 12: Logic and Decision Making Fall 2010 UC San Diego 10/18/2010
 Phil 12: Logic and Decision Making Fall 2010 UC San Diego 10/18/2010") Variables, distributions, and samples (cont.) Phil 12: Logic and Decision Making Fall 2010 UC San Diego 10/18/2010 Review Recording observations - Must extract that which is to be analyzed: coding systems,
Variables, distributions, and samples (cont.) Phil 12: Logic and Decision Making Fall 2010 UC San Diego 10/18/2010 Review Recording observations - Must extract that which is to be analyzed: coding systems,
Business Statistics. Lecture 10: Course Review
 Business Statistics Lecture 10: Course Review 1 Descriptive Statistics for Continuous Data Numerical Summaries Location: mean, median Spread or variability: variance, standard deviation, range, percentiles,
MATH 1150 Chapter 2 Notation and Terminology
 MATH 1150 Chapter 2 Notation and Terminology Categorical Data The following is a dataset for 30 randomly selected adults in the U.S., showing the values of two categorical variables: whether or not the
Chapter 2: Tools for Exploring Univariate Data
 Stats 11 (Fall 2004) Lecture Note Introduction to Statistical Methods for Business and Economics Instructor: Hongquan Xu Chapter 2: Tools for Exploring Univariate Data Section 2.1: Introduction What is
Last Lecture. Distinguish Populations from Samples. Knowing different Sampling Techniques. Distinguish Parameters from Statistics
 Last Lecture Distinguish Populations from Samples Importance of identifying a population and well chosen sample Knowing different Sampling Techniques Distinguish Parameters from Statistics Knowing different
are the objects described by a set of data. They may be people, animals or things.
 ( c ) E p s t e i n, C a r t e r a n d B o l l i n g e r 2016 C h a p t e r 5 : E x p l o r i n g D a t a : D i s t r i b u t i o n s P a g e 1 CHAPTER 5: EXPLORING DATA DISTRIBUTIONS 5.1 Creating Histograms
What is statistics? Statistics is the science of: Collecting information. Organizing and summarizing the information collected
 What is statistics? Statistics is the science of: Collecting information Organizing and summarizing the information collected Analyzing the information collected in order to draw conclusions Two types
AP Final Review II Exploring Data (20% 30%)
") AP Final Review II Exploring Data (20% 30%) Quantitative vs Categorical Variables Quantitative variables are numerical values for which arithmetic operations such as means make sense. It is usually a measure
AP Final Review II Exploring Data (20% 30%) Quantitative vs Categorical Variables Quantitative variables are numerical values for which arithmetic operations such as means make sense. It is usually a measure
CIVL 7012/8012. Collection and Analysis of Information
 CIVL 7012/8012 Collection and Analysis of Information Uncertainty in Engineering Statistics deals with the collection and analysis of data to solve real-world problems. Uncertainty is inherent in all real
20 Hypothesis Testing, Part I
 20 Hypothesis Testing, Part I Bob has told Alice that the average hourly rate for a lawyer in Virginia is $200 with a standard deviation of $50, but Alice wants to test this claim. If Bob is right, she
Stat 101 Exam 1 Important Formulas and Concepts 1
 1 Chapter 1 1.1 Definitions Stat 101 Exam 1 Important Formulas and Concepts 1 1. Data Any collection of numbers, characters, images, or other items that provide information about something. 2. Categorical/Qualitative
Elementary Statistics
 Elementary Statistics Q: What is data? Q: What does the data look like? Q: What conclusions can we draw from the data? Q: Where is the middle of the data? Q: Why is the spread of the data important? Q:
AP Statistics Cumulative AP Exam Study Guide
 AP Statistics Cumulative AP Eam Study Guide Chapters & 3 - Graphs Statistics the science of collecting, analyzing, and drawing conclusions from data. Descriptive methods of organizing and summarizing statistics
Describing distributions with numbers
 Describing distributions with numbers A large number or numerical methods are available for describing quantitative data sets. Most of these methods measure one of two data characteristics: The central
Review of Statistics 101
 Review of Statistics 101 We review some important themes from the course 1. Introduction Statistics- Set of methods for collecting/analyzing data (the art and science of learning from data). Provides methods
2.0 Lesson Plan. Answer Questions. Summary Statistics. Histograms. The Normal Distribution. Using the Standard Normal Table
 2.0 Lesson Plan Answer Questions 1 Summary Statistics Histograms The Normal Distribution Using the Standard Normal Table 2. Summary Statistics Given a collection of data, one needs to find representations
Descriptive Statistics-I. Dr Mahmoud Alhussami
 Descriptive Statistics-I Dr Mahmoud Alhussami Biostatistics What is the biostatistics? A branch of applied math. that deals with collecting, organizing and interpreting data using well-defined procedures.
Chapter 3. Data Description
 Chapter 3. Data Description Graphical Methods Pie chart It is used to display the percentage of the total number of measurements falling into each of the categories of the variable by partition a circle.
Harvard University. Rigorous Research in Engineering Education
 Statistical Inference Kari Lock Harvard University Department of Statistics Rigorous Research in Engineering Education 12/3/09 Statistical Inference You have a sample and want to use the data collected
Describing Distributions
 Describing Distributions With Numbers April 18, 2012 Summary Statistics. Measures of Center. Percentiles. Measures of Spread. A Summary Statement. Choosing Numerical Summaries. 1.0 What Are Summary Statistics?
What is Statistics? Statistics is the science of understanding data and of making decisions in the face of variability and uncertainty.
 What is Statistics? Statistics is the science of understanding data and of making decisions in the face of variability and uncertainty. Statistics is a field of study concerned with the data collection,
M 140 Test 1 B Name (1 point) SHOW YOUR WORK FOR FULL CREDIT! Problem Max. Points Your Points Total 75
 SHOW YOUR WORK FOR FULL CREDIT! Problem Max. Points Your Points Total 75") M 140 est 1 B Name (1 point) SHOW YOUR WORK FOR FULL CREDI! Problem Max. Points Your Points 1-10 10 11 10 12 3 13 4 14 18 15 8 16 7 17 14 otal 75 Multiple choice questions (1 point each) For questions
M 140 est 1 B Name (1 point) SHOW YOUR WORK FOR FULL CREDI! Problem Max. Points Your Points 1-10 10 11 10 12 3 13 4 14 18 15 8 16 7 17 14 otal 75 Multiple choice questions (1 point each) For questions
Statistics Boot Camp. Dr. Stephanie Lane Institute for Defense Analyses DATAWorks 2018
 Statistics Boot Camp Dr. Stephanie Lane Institute for Defense Analyses DATAWorks 2018 March 21, 2018 Outline of boot camp Summarizing and simplifying data Point and interval estimation Foundations of statistical
Example 2. Given the data below, complete the chart:
 Statistics 2035 Quiz 1 Solutions Example 1. 2 64 150 150 2 128 150 2 256 150 8 8 Example 2. Given the data below, complete the chart: 52.4, 68.1, 66.5, 75.0, 60.5, 78.8, 63.5, 48.9, 81.3 n=9 The data is
Sampling Distribution Models. Chapter 17
 Sampling Distribution Models Chapter 17 Objectives: 1. Sampling Distribution Model 2. Sampling Variability (sampling error) 3. Sampling Distribution Model for a Proportion 4. Central Limit Theorem 5. Sampling
Vocabulary: Samples and Populations
 Vocabulary: Samples and Populations Concept Different types of data Categorical data results when the question asked in a survey or sample can be answered with a nonnumerical answer. For example if we
1-1. Chapter 1. Sampling and Descriptive Statistics by The McGraw-Hill Companies, Inc. All rights reserved.
 1-1 Chapter 1 Sampling and Descriptive Statistics 1-2 Why Statistics? Deal with uncertainty in repeated scientific measurements Draw conclusions from data Design valid experiments and draw reliable conclusions
STP 420 INTRODUCTION TO APPLIED STATISTICS NOTES
 INTRODUCTION TO APPLIED STATISTICS NOTES PART - DATA CHAPTER LOOKING AT DATA - DISTRIBUTIONS Individuals objects described by a set of data (people, animals, things) - all the data for one individual make
Lesson Plan. Answer Questions. Summary Statistics. Histograms. The Normal Distribution. Using the Standard Normal Table
 Lesson Plan Answer Questions Summary Statistics Histograms The Normal Distribution Using the Standard Normal Table 1 2. Summary Statistics Given a collection of data, one needs to find representations
Describing distributions with numbers
 Describing distributions with numbers A large number or numerical methods are available for describing quantitative data sets. Most of these methods measure one of two data characteristics: The central
Chapter 4. Displaying and Summarizing. Quantitative Data
 STAT 141 Introduction to Statistics Chapter 4 Displaying and Summarizing Quantitative Data Bin Zou (bzou@ualberta.ca) STAT 141 University of Alberta Winter 2015 1 / 31 4.1 Histograms 1 We divide the range
3.1 Measure of Center
 3.1 Measure of Center Calculate the mean for a given data set Find the median, and describe why the median is sometimes preferable to the mean Find the mode of a data set Describe how skewness affects
CHAPTER 5: EXPLORING DATA DISTRIBUTIONS. Individuals are the objects described by a set of data. These individuals may be people, animals or things.
 (c) Epstein 2013 Chapter 5: Exploring Data Distributions Page 1 CHAPTER 5: EXPLORING DATA DISTRIBUTIONS 5.1 Creating Histograms Individuals are the objects described by a set of data. These individuals
Lecture 6: Chapter 4, Section 2 Quantitative Variables (Displays, Begin Summaries)
") Lecture 6: Chapter 4, Section 2 Quantitative Variables (Displays, Begin Summaries) Summarize with Shape, Center, Spread Displays: Stemplots, Histograms Five Number Summary, Outliers, Boxplots Cengage Learning
Lecture 6: Chapter 4, Section 2 Quantitative Variables (Displays, Begin Summaries) Summarize with Shape, Center, Spread Displays: Stemplots, Histograms Five Number Summary, Outliers, Boxplots Cengage Learning
Performance of fourth-grade students on an agility test
 Starter Ch. 5 2005 #1a CW Ch. 4: Regression L1 L2 87 88 84 86 83 73 81 67 78 83 65 80 50 78 78? 93? 86? Create a scatterplot Find the equation of the regression line Predict the scores Chapter 5: Understanding
Algebra 2. Outliers. Measures of Central Tendency (Mean, Median, Mode) Standard Deviation Normal Distribution (Bell Curves)
 Standard Deviation Normal Distribution (Bell Curves)") Algebra 2 Outliers Measures of Central Tendency (Mean, Median, Mode) Standard Deviation Normal Distribution (Bell Curves) Algebra 2 Notes #1 Chp 12 Outliers In a set of numbers, sometimes there will be
Algebra 2 Outliers Measures of Central Tendency (Mean, Median, Mode) Standard Deviation Normal Distribution (Bell Curves) Algebra 2 Notes #1 Chp 12 Outliers In a set of numbers, sometimes there will be
TOPIC: Descriptive Statistics Single Variable
 TOPIC: Descriptive Statistics Single Variable I. Numerical data summary measurements A. Measures of Location. Measures of central tendency Mean; Median; Mode. Quantiles - measures of noncentral tendency
Histograms allow a visual interpretation
 Chapter 4: Displaying and Summarizing i Quantitative Data s allow a visual interpretation of quantitative (numerical) data by indicating the number of data points that lie within a range of values, called
Determining the Spread of a Distribution
 Determining the Spread of a Distribution 1.3-1.5 Cathy Poliak, Ph.D. cathy@math.uh.edu Department of Mathematics University of Houston Lecture 3-2311 Lecture 3-2311 1 / 58 Outline 1 Describing Quantitative
Determining the Spread of a Distribution
 Determining the Spread of a Distribution 1.3-1.5 Cathy Poliak, Ph.D. cathy@math.uh.edu Department of Mathematics University of Houston Lecture 3-2311 Lecture 3-2311 1 / 58 Outline 1 Describing Quantitative
Preliminary Statistics course. Lecture 1: Descriptive Statistics
 Preliminary Statistics course Lecture 1: Descriptive Statistics Rory Macqueen (rm43@soas.ac.uk), September 2015 Organisational Sessions: 16-21 Sep. 10.00-13.00, V111 22-23 Sep. 15.00-18.00, V111 24 Sep.
Z score indicates how far a raw score deviates from the sample mean in SD units. score Mean % Lower Bound
 1 EDUR 8131 Chat 3 Notes 2 Normal Distribution and Standard Scores Questions Standard Scores: Z score Z = (X M) / SD Z = deviation score divided by standard deviation Z score indicates how far a raw score
Describing Distributions With Numbers
 Describing Distributions With Numbers October 24, 2012 What Do We Usually Summarize? Measures of Center. Percentiles. Measures of Spread. A Summary Statement. Choosing Numerical Summaries. 1.0 What Do
Last two weeks: Sample, population and sampling distributions finished with estimation & confidence intervals
 Past weeks: Measures of central tendency (mean, mode, median) Measures of dispersion (standard deviation, variance, range, etc). Working with the normal curve Last two weeks: Sample, population and sampling
Section 3. Measures of Variation
 Section 3 Measures of Variation Range Range = (maximum value) (minimum value) It is very sensitive to extreme values; therefore not as useful as other measures of variation. Sample Standard Deviation The
How Measurement Error Affects the Four Ways We Use Data
 Measurement error is generally considered to be a bad thing, and yet there is very little written about how measurement error affects the way we use our measurements. This column will consider these effects
Unit Two Descriptive Biostatistics. Dr Mahmoud Alhussami
 Unit Two Descriptive Biostatistics Dr Mahmoud Alhussami Descriptive Biostatistics The best way to work with data is to summarize and organize them. Numbers that have not been summarized and organized are
Week 1: Intro to R and EDA
 Statistical Methods APPM 4570/5570, STAT 4000/5000 Populations and Samples 1 Week 1: Intro to R and EDA Introduction to EDA Objective: study of a characteristic (measurable quantity, random variable) for
y response variable x 1, x 2,, x k -- a set of explanatory variables
 11. Multiple Regression and Correlation y response variable x 1, x 2,, x k -- a set of explanatory variables In this chapter, all variables are assumed to be quantitative. Chapters 12-14 show how to incorporate
Statistics I Chapter 2: Univariate data analysis
 Statistics I Chapter 2: Univariate data analysis Chapter 2: Univariate data analysis Contents Graphical displays for categorical data (barchart, piechart) Graphical displays for numerical data data (histogram,
Further Mathematics 2018 CORE: Data analysis Chapter 2 Summarising numerical data
 Chapter 2: Summarising numerical data Further Mathematics 2018 CORE: Data analysis Chapter 2 Summarising numerical data Extract from Study Design Key knowledge Types of data: categorical (nominal and ordinal)
Chapter 6. The Standard Deviation as a Ruler and the Normal Model 1 /67
 Chapter 6 The Standard Deviation as a Ruler and the Normal Model 1 /67 Homework Read Chpt 6 Complete Reading Notes Do P129 1, 3, 5, 7, 15, 17, 23, 27, 29, 31, 37, 39, 43 2 /67 Objective Students calculate
Chapter 23. Inference About Means
 Chapter 23 Inference About Means 1 /57 Homework p554 2, 4, 9, 10, 13, 15, 17, 33, 34 2 /57 Objective Students test null and alternate hypotheses about a population mean. 3 /57 Here We Go Again Now that
ADMS2320.com. We Make Stats Easy. Chapter 4. ADMS2320.com Tutorials Past Tests. Tutorial Length 1 Hour 45 Minutes
 We Make Stats Easy. Chapter 4 Tutorial Length 1 Hour 45 Minutes Tutorials Past Tests Chapter 4 Page 1 Chapter 4 Note The following topics will be covered in this chapter: Measures of central location Measures
STT 315 This lecture is based on Chapter 2 of the textbook.
 STT 315 This lecture is based on Chapter 2 of the textbook. Acknowledgement: Author is thankful to Dr. Ashok Sinha, Dr. Jennifer Kaplan and Dr. Parthanil Roy for allowing him to use/edit some of their
Statistics I Chapter 2: Univariate data analysis
 Statistics I Chapter 2: Univariate data analysis Chapter 2: Univariate data analysis Contents Graphical displays for categorical data (barchart, piechart) Graphical displays for numerical data data (histogram,
Introduction to statistics
 Introduction to statistics Literature Raj Jain: The Art of Computer Systems Performance Analysis, John Wiley Schickinger, Steger: Diskrete Strukturen Band 2, Springer David Lilja: Measuring Computer Performance:
Last week: Sample, population and sampling distributions finished with estimation & confidence intervals
 Past weeks: Measures of central tendency (mean, mode, median) Measures of dispersion (standard deviation, variance, range, etc). Working with the normal curve Last week: Sample, population and sampling
Notes 3: Statistical Inference: Sampling, Sampling Distributions Confidence Intervals, and Hypothesis Testing
 Notes 3: Statistical Inference: Sampling, Sampling Distributions Confidence Intervals, and Hypothesis Testing 1. Purpose of statistical inference Statistical inference provides a means of generalizing
1 Measures of the Center of a Distribution
 1 Measures of the Center of a Distribution Qualitative descriptions of the shape of a distribution are important and useful. But we will often desire the precision of numerical summaries as well. Two aspects
Chapter 5. Understanding and Comparing. Distributions
 STAT 141 Introduction to Statistics Chapter 5 Understanding and Comparing Distributions Bin Zou (bzou@ualberta.ca) STAT 141 University of Alberta Winter 2015 1 / 27 Boxplots How to create a boxplot? Assume
Nicole Dalzell. July 2, 2014
 UNIT 1: INTRODUCTION TO DATA LECTURE 3: EDA (CONT.) AND INTRODUCTION TO STATISTICAL INFERENCE VIA SIMULATION STATISTICS 101 Nicole Dalzell July 2, 2014 Teams and Announcements Team1 = Houdan Sai Cui Huanqi
The Empirical Rule, z-scores, and the Rare Event Approach
 Overview The Empirical Rule, z-scores, and the Rare Event Approach Look at Chebyshev s Rule and the Empirical Rule Explore some applications of the Empirical Rule How to calculate and use z-scores Introducing
Chapter2 Description of samples and populations. 2.1 Introduction.
 Chapter2 Description of samples and populations. 2.1 Introduction. Statistics=science of analyzing data. Information collected (data) is gathered in terms of variables (characteristics of a subject that
Data Analysis and Statistical Methods Statistics 651
 Data Analysis and Statistical Methods Statistics 651 http://www.stat.tamu.edu/~suhasini/teaching.html Suhasini Subba Rao Review Our objective: to make confident statements about a parameter (aspect) in
9/2/2010. Wildlife Management is a very quantitative field of study. throughout this course and throughout your career.
 Introduction to Data and Analysis Wildlife Management is a very quantitative field of study Results from studies will be used throughout this course and throughout your career. Sampling design influences
UCLA STAT 10 Statistical Reasoning - Midterm Review Solutions Observational Studies, Designed Experiments & Surveys
 UCLA STAT 10 Statistical Reasoning - Midterm Review Solutions Observational Studies, Designed Experiments & Surveys.. 1. (i) The treatment being compared is: (ii). (5) 3. (3) 4. (4) Study 1: the number
Lecture 3B: Chapter 4, Section 2 Quantitative Variables (Displays, Begin Summaries)
") Lecture 3B: Chapter 4, Section 2 Quantitative Variables (Displays, Begin Summaries) Summarize with Shape, Center, Spread Displays: Stemplots, Histograms Five Number Summary, Outliers, Boxplots Mean vs.
Lecture 3B: Chapter 4, Section 2 Quantitative Variables (Displays, Begin Summaries) Summarize with Shape, Center, Spread Displays: Stemplots, Histograms Five Number Summary, Outliers, Boxplots Mean vs.
CHAPTER 1. Introduction
 CHAPTER 1 Introduction Engineers and scientists are constantly exposed to collections of facts, or data. The discipline of statistics provides methods for organizing and summarizing data, and for drawing
Lecture 1 : Basic Statistical Measures
 Lecture 1 : Basic Statistical Measures Jonathan Marchini October 11, 2004 In this lecture we will learn about different types of data encountered in practice different ways of plotting data to explore
2.830J / 6.780J / ESD.63J Control of Manufacturing Processes (SMA 6303) Spring 2008
 Spring 2008") MIT OpenCourseWare http://ocw.mit.edu 2.830J / 6.780J / ESD.63J Control of Manufacturing Processes (SMA 6303) Spring 2008 For information about citing these materials or our Terms of Use, visit: http://ocw.mit.edu/terms.
MIT OpenCourseWare http://ocw.mit.edu 2.830J / 6.780J / ESD.63J Control of Manufacturing Processes (SMA 6303) Spring 2008 For information about citing these materials or our Terms of Use, visit: http://ocw.mit.edu/terms.
Descriptive statistics
 Patrick Breheny February 6 Patrick Breheny to Biostatistics (171:161) 1/25 Tables and figures Human beings are not good at sifting through large streams of data; we understand data much better when it
STAT 200 Chapter 1 Looking at Data - Distributions
 STAT 200 Chapter 1 Looking at Data - Distributions What is Statistics? Statistics is a science that involves the design of studies, data collection, summarizing and analyzing the data, interpreting the
SESSION 5 Descriptive Statistics
 SESSION 5 Descriptive Statistics Descriptive statistics are used to describe the basic features of the data in a study. They provide simple summaries about the sample and the measures. Together with simple
BIOL 51A - Biostatistics 1 1. Lecture 1: Intro to Biostatistics. Smoking: hazardous? FEV (l) Smoke
 Smoke") BIOL 51A - Biostatistics 1 1 Lecture 1: Intro to Biostatistics Smoking: hazardous? FEV (l) 1 2 3 4 5 No Yes Smoke BIOL 51A - Biostatistics 1 2 Box Plot a.k.a box-and-whisker diagram or candlestick chart
BIOL 51A - Biostatistics 1 1 Lecture 1: Intro to Biostatistics Smoking: hazardous? FEV (l) 1 2 3 4 5 No Yes Smoke BIOL 51A - Biostatistics 1 2 Box Plot a.k.a box-and-whisker diagram or candlestick chart
Statistics in medicine
 Statistics in medicine Lecture 1- part 1: Describing variation, and graphical presentation Outline Sources of variation Types of variables Fatma Shebl, MD, MS, MPH, PhD Assistant Professor Chronic Disease
CS 361: Probability & Statistics
 January 24, 2018 CS 361: Probability & Statistics Relationships in data Standard coordinates If we have two quantities of interest in a dataset, we might like to plot their histograms and compare the two
FREQUENCY DISTRIBUTIONS AND PERCENTILES
 FREQUENCY DISTRIBUTIONS AND PERCENTILES New Statistical Notation Frequency (f): the number of times a score occurs N: sample size Simple Frequency Distributions Raw Scores The scores that we have directly
Chapter. Numerically Summarizing Data Pearson Prentice Hall. All rights reserved
 Chapter 3 Numerically Summarizing Data Section 3.1 Measures of Central Tendency Objectives 1. Determine the arithmetic mean of a variable from raw data 2. Determine the median of a variable from raw data
Chapter 4.notebook. August 30, 2017
 Sep 1 7:53 AM Sep 1 8:21 AM Sep 1 8:21 AM 1 Sep 1 8:23 AM Sep 1 8:23 AM Sep 1 8:23 AM SOCS When describing a distribution, make sure to always tell about three things: shape, outliers, center, and spread
CHAPTER 2: Describing Distributions with Numbers
 CHAPTER 2: Describing Distributions with Numbers The Basic Practice of Statistics 6 th Edition Moore / Notz / Fligner Lecture PowerPoint Slides Chapter 2 Concepts 2 Measuring Center: Mean and Median Measuring
A is one of the categories into which qualitative data can be classified.
 Chapter 2 Methods for Describing Sets of Data 2.1 Describing qualitative data Recall qualitative data: non-numerical or categorical data Basic definitions: A is one of the categories into which qualitative
Lecture 1: Descriptive Statistics
 Lecture 1: Descriptive Statistics MSU-STT-351-Sum 15 (P. Vellaisamy: MSU-STT-351-Sum 15) Probability & Statistics for Engineers 1 / 56 Contents 1 Introduction 2 Branches of Statistics Descriptive Statistics
Chapter 3: Displaying and summarizing quantitative data p52 The pattern of variation of a variable is called its distribution.
 Chapter 3: Displaying and summarizing quantitative data p52 The pattern of variation of a variable is called its distribution. 1 Histograms p53 The breakfast cereal data Study collected data on nutritional
1.0 Continuous Distributions. 5.0 Shapes of Distributions. 6.0 The Normal Curve. 7.0 Discrete Distributions. 8.0 Tolerances. 11.
 Chapter 4 Statistics 45 CHAPTER 4 BASIC QUALITY CONCEPTS 1.0 Continuous Distributions.0 Measures of Central Tendency 3.0 Measures of Spread or Dispersion 4.0 Histograms and Frequency Distributions 5.0
Statistics for Managers using Microsoft Excel 6 th Edition
 Statistics for Managers using Microsoft Excel 6 th Edition Chapter 3 Numerical Descriptive Measures 3-1 Learning Objectives In this chapter, you learn: To describe the properties of central tendency, variation,
GRAPHS AND STATISTICS Central Tendency and Dispersion Common Core Standards
 B Graphs and Statistics, Lesson 2, Central Tendency and Dispersion (r. 2018) GRAPHS AND STATISTICS Central Tendency and Dispersion Common Core Standards Next Generation Standards S-ID.A.2 Use statistics
COUNTING ERRORS AND STATISTICS RCT STUDY GUIDE Identify the five general types of radiation measurement errors.
 LEARNING OBJECTIVES: 2.03.01 Identify the five general types of radiation measurement errors. 2.03.02 Describe the effect of each source of error on radiation measurements. 2.03.03 State the two purposes
Describing Distributions With Numbers Chapter 12
 Describing Distributions With Numbers Chapter 12 May 1, 2013 What Do We Usually Summarize? Measures of Center. Percentiles. Measures of Spread. A Summary. 1.0 What Do We Usually Summarize? source: Prof.
Sem. 1 Review Ch. 1-3
 AP Stats Sem. 1 Review Ch. 1-3 Name 1. You measure the age, marital status and earned income of an SRS of 1463 women. The number and type of variables you have measured is a. 1463; all quantitative. b.
Chapter 1: Exploring Data
 Chapter 1: Exploring Data Section 1.3 with Numbers The Practice of Statistics, 4 th edition - For AP* STARNES, YATES, MOORE Chapter 1 Exploring Data Introduction: Data Analysis: Making Sense of Data 1.1
Final Exam - Solutions
 Ecn 102 - Analysis of Economic Data University of California - Davis March 19, 2010 Instructor: John Parman Final Exam - Solutions You have until 5:30pm to complete this exam. Please remember to put your
2.830J / 6.780J / ESD.63J Control of Manufacturing Processes (SMA 6303)
") MIT OpenCourseWare http://ocw.mit.edu 2.830J / 6.780J / ESD.63J Control of Processes (SMA 6303) Spring 2008 For information about citing these materials or our Terms of Use, visit: http://ocw.mit.edu/terms.
MIT OpenCourseWare http://ocw.mit.edu 2.830J / 6.780J / ESD.63J Control of Processes (SMA 6303) Spring 2008 For information about citing these materials or our Terms of Use, visit: http://ocw.mit.edu/terms.
Descriptive Data Summarization
 Descriptive Data Summarization Descriptive data summarization gives the general characteristics of the data and identify the presence of noise or outliers, which is useful for successful data cleaning
Math 120 Introduction to Statistics Mr. Toner s Lecture Notes 3.1 Measures of Central Tendency
 Math 1 Introduction to Statistics Mr. Toner s Lecture Notes 3.1 Measures of Central Tendency The word average: is very ambiguous and can actually refer to the mean, median, mode or midrange. Notation:
- measures the center of our distribution. In the case of a sample, it s given by: y i. y = where n = sample size.
 Descriptive Statistics: One of the most important things we can do is to describe our data. Some of this can be done graphically (you should be familiar with histograms, boxplots, scatter plots and so
Data Analysis and Statistical Methods Statistics 651
 Data Analysis and Statistical Methods Statistics 651 http://www.stat.tamu.edu/~suhasini/teaching/ Suhasini Subba Rao Review In the previous lecture we looked at the statistics of M&Ms. This example illustrates
Lecture Slides. Elementary Statistics Tenth Edition. by Mario F. Triola. and the Triola Statistics Series. Slide 1
 Lecture Slides Elementary Statistics Tenth Edition and the Triola Statistics Series by Mario F. Triola Slide 1 Chapter 3 Statistics for Describing, Exploring, and Comparing Data 3-1 Overview 3-2 Measures
Perhaps the most important measure of location is the mean (average). Sample mean: where n = sample size. Arrange the values from smallest to largest:
. Sample mean: where n = sample size. Arrange the values from smallest to largest:") 1 Chapter 3 - Descriptive stats: Numerical measures 3.1 Measures of Location Mean Perhaps the most important measure of location is the mean (average). Sample mean: where n = sample size Example: The number
1 Chapter 3 - Descriptive stats: Numerical measures 3.1 Measures of Location Mean Perhaps the most important measure of location is the mean (average). Sample mean: where n = sample size Example: The number