Extra Exam Empirical Methods VU University Amsterdam, Faculty of Exact Sciences , July 2, 2015
|
|
|
- Ashlyn Moore
- 6 years ago
- Views:
Transcription
1 Extra Exam Empirical Methods VU University Amsterdam, Faculty of Exact Sciences , July 2, 2015 Also hand in this exam and your scrap paper. Always motivate your answers. Write your answers in English. Only the use of a simple, non-graphical calculator is allowed. Programmable/graphical calculators, laptops, mobile phones, smart watches, books, own formula sheets, etc. are not allowed. On the last four pages of the exam, some formulas and tables that you may want to use can be found. The total number of points you can receive is 90: Grade = 1 + points 10. The division of points per question and subparts is as follows: Question Part (a) Part (b) Part (c) Part (d) Part (e) Total If you are asked to perform a test, do not only give the conclusion of your test, but report: 1. the hypotheses in terms of the population parameter of interest; 2. the significance level; 3. the test statistic and its distribution under the null hypothesis; 4. the observed value of the test statistic; 5. the P -value or the critical value(s); 6. whether or not the null hypothesis is rejected and why; 7. finally, phrase your conclusion in terms of the context of the problem. 1
2 1. For the following situations identify which of the following applies: simple random sample, systematic sample, convenience sample, stratified sample, or cluster sample. In each case, state whether you think the procedure is likely to yield a representative sample or a biased sample, and briefly explain why. (a) People magazine chooses its best dressed celebrities by compiling responses from readers who mailed the magazine their answers to the questions in a survey that was printed in the magazine. (b) A marketing expert for MTV is planning a survey in which 500 people will be randomly selected from each age group of 10-19, 20-29, and so on. Determine whether the data described in parts (c) and (d) are qualitative or quantitative and give their level of measurement. Indicate also which type of visualization is most suited for these data and why. (c) A question in a survey has five possible answers, 1, 2, 3, 4, and 5, which stand for very unhappy, unhappy, neutral, happy, and very happy, respectively. The data consist of the answers to this question of 150 people. (d) With carbon dating, the ages (in years) of 78 specimens of wood were determined. 2. From a study conducted three years ago it was concluded that 80% of the people had good financial credit ratings, while the remaining 20% had bad financial credit ratings. Current records show that 30% of those with bad credit ratings have since improved their ratings to good, while 15% of those with good credit ratings have since changed to having bad credit ratings. In the items below, do not only give your answer, but also show how you obtained it and name the rule(s) or property(ies) of probabilities that you have used for its computation. (a) What is the probability that two randomly chosen people from the population had good credit ratings three years ago? (b) What is the probability that at least one of three randomly chosen people had bad credit ratings three years ago? (c) What is the probability that a randomly selected person now has good ratings? (d) What is the probability that a person who has good ratings now, had bad ratings three years ago? 3. Assume that systolic blood pressure is a normally distributed random variable with mean µ sys = 121 and standard deviation σ sys = 15. (a) What is the probability that the systolic blood pressure of a randomly selected person is larger than 140? (b) What is the probability that the mean of the systolic blood pressures of 25 randomly selected people is between 118 and 126? Now assume that the diastolic blood pressure in a population is a normally distributed random variable with unknown mean µ dia and known standard deviation σ dia = 15. Suppose that the diastolic blood pressure in a sample of 16 randomly selected people from that population is measured and that the sample mean is 2
3 x = We want to investigate the conjecture that the unknown population mean µ dia is larger than 81. (c) Use a suitable statistical test to investigate this conjecture. Take significance level α = Listed below are two samples of body temperatures (in C): sample 1: ; sample 2: The sample means and sample standard deviations for these data are: for sample 1 : x 1 = 36.3, s 1 = 0.59; for sample 2 : x 2 = 36.8, s 2 = 0.26; for the pairwise differences : d = 0.5, s d = Some other numbers that you may or may not use: s 2 1 s p 1/n1 + 1/n 2 = 0.26, + s2 2 = n 1 n 2 First assume that the temperatures were measured on 6 subjects, at 8.00h and at 12.00h in the morning, resulting in sample 1 and sample 2, respectively. (a) Give an estimate of the difference in mean temperature at 8.00h and 12.00h. (b) Use a suitable t-test (motivate your choice!) to investigate the claim that on average the temperatures at 8.00h are lower than those at 12.00h. Take significance level α = Now assume instead that all temperatures were measured at 8.00h, with sample 1 containing the temperatures of 6 men and sample 2 containing the temperatures of 6 women. (c) Give an estimate of the difference in mean temperature at 8.00h of men and women. (d) Use a suitable t-test (motivate your choice!) to investigate the claim that the mean temperatures at 8.00h of men and women are different. Take significance level α = (e) Is the use of a t-test in parts (b) and (d) justifiable? Motivate your answer. 5. In a poll among 100 randomly selected VU-students about whether or not they agree with the statement that students who have more than 12,000 euros extra earnings should not obtain a scholarship, 8 students agreed with the statement and 92 students disagreed. Let p be the fraction of VU-students who agree with the statement. (a) Determine the usual point estimate ˆp for p. (b) What is the interpretation of a 95% confidence interval for the unknown population proportion p? (c) Give the 95% confidence interval based on the results of the poll among the 100 students. 3
4 (d) In general, to estimate p with a 95% degree confidence and a margin of error of 0.05, what should be the minimum sample size? (e) Compare your answer and the margin of error of part (d) with the size of the poll and the margin of error that you used to compute the interval in part (c). Can you explain the differences/similarities? 6. In each province a number of randomly selected people were asked whether or not they think that the appearance of Zwarte Piet should change. The results for Limburg, Groningen, and Noord-Holland are given in the following table. change no change total Limburg Groningen Noord-Holland total (a) Use the table to give, for each of the three provinces separately and under the assumption that there is no relationship between the variables province and change, the expected number of people in the sample from that province who think that the appearance of Zwarte Piet should change. (b) Suppose that we wish to investigate with a chi-square test whether or not there is a relationship between the variables province and change. Formulate suitable hypotheses, specify the test statistic (also tell what the symbols that you use in the formula that you give for the test statistic, stand for), and its distribution under the null hypothesis. (You do not need to compute the observed value of the test statistic.) (c) The observed value of the test statistic for these data is What would be the conclusion of the test that you described in part (b) for significance level α = 1%? Motivate your answer. (d) The test that you described in part (b) should only be used when certain requirements are met. What are these requirements and are they satisfied in this case? 4
5 Formulas and Tables for Exam Empirical Methods Probability We use the following notation: Ω sample space, P probability measure. B, A 1, A 2,..., A m events, A 1, A 2,..., A m a partition of Ω with P (A i ) > 0 for all i {1, 2,..., m}. Law of Total Probability: Bayes Theorem: P (B) = P (A r B) = m P (B A i ) = i=1 m P (B A i )P (A i ). i=1 P (A r B) m i=1 P (B A i)p (A i ) = P (B A r)p (A r ) m i=1 P (B A i)p (A i ). Two independent samples (The statements below hold if certain requirements are met.) For two independent samples, (i) if σ 1 and σ 2 are unknown and σ 1 σ 2, the test statistic T 2 = ( x 1 x 2 ) (µ 1 µ 2 ) s 2 1 /n 1 + s 2 2 /n 2 has a t-distribution with approximately ñ degrees of freedom under the null hypothesis. We use the conservative estimate ñ = min{n 1 1, n 2 1}. (ii) if σ 1 and σ 2 are unknown and σ 1 = σ 2, then the test statistic 2 = ( x 1 x 2 ) (µ 1 µ 2 ) s 2 p/n 1 + s 2 p/n 2 T eq has a t-distribution with n 1 + n 2 2 degrees of freedom under the null hypothesis. Here s p is the square root of the pooled sample variance s 2 p given by s 2 p = (n 1 1)s (n 2 1)s 2 2. n 1 + n 2 2 (iii) if σ 1 and σ 2 are known, then the test statistic Z = ( x 1 x 2 ) (µ 1 µ 2 ) σ 2 1 /n 1 + σ 2 2 /n 2 1
6 has a standard normal distribution under the null hypothesis. (iv) if p 1 = p 2, the test statistic Z = (ˆp 1 ˆp 2 ) (p 1 p 2 ) p(1 p)/n1 + p(1 p)/n 2 approximately has a standard normal distribution. Here p = (x 1 +x 2 )/(n 1 +n 2 ) is the pooled sample proportion. (v) the margin of error for a 1 α confidence interval for p 1 p 2 is given by E = z α/2 ˆp1 (1 ˆp 1 )/n 1 + ˆp 2 (1 ˆp 2 )/n 2. Correlation Under certain conditions the test statistic T cor = r ρ (1 r 2 )/(n 2) has a t-distribution with n 2 degrees of freedom. Here ρ is the population linear correlation coefficient and r is the sample linear correlation coefficient given by r = 1 n 1 n i=1 [ (xi x)(y i ȳ) ]. s x s y Linear regression Let β 0 be the unknown intercept and β 1 the unknown slope of a linear regression model with one explanatory variable, and let b 0 and b 1 be the corresponding estimators, i.e. the intercept and slope of the regression line (the best line). Then b 0 and b 1 are given by b 1 = r s y s x and b 0 = ȳ b 1 x. If certain requirements are met, then the test statistic T 1 = b 1 β 1 s b1 has a t-distribution with n 2 degrees of freedom. Here s b1 is the standard error (i.e. estimated standard deviation) of the estimator b 1. 2
7
8
Exam Empirical Methods VU University Amsterdam, Faculty of Exact Sciences h, February 12, 2015
 Exam Empirical Methods VU University Amsterdam, Faculty of Exact Sciences 18.30 21.15h, February 12, 2015 Question 1 is on this page. Always motivate your answers. Write your answers in English. Only the
Test 3 Practice Test A. NOTE: Ignore Q10 (not covered)
") Test 3 Practice Test A NOTE: Ignore Q10 (not covered) MA 180/418 Midterm Test 3, Version A Fall 2010 Student Name (PRINT):............................................. Student Signature:...................................................
Test 3 Practice Test A NOTE: Ignore Q10 (not covered) MA 180/418 Midterm Test 3, Version A Fall 2010 Student Name (PRINT):............................................. Student Signature:...................................................
Review 6. n 1 = 85 n 2 = 75 x 1 = x 2 = s 1 = 38.7 s 2 = 39.2
 Review 6 Use the traditional method to test the given hypothesis. Assume that the samples are independent and that they have been randomly selected ) A researcher finds that of,000 people who said that
Lecture 14. Analysis of Variance * Correlation and Regression. The McGraw-Hill Companies, Inc., 2000
 Lecture 14 Analysis of Variance * Correlation and Regression Outline Analysis of Variance (ANOVA) 11-1 Introduction 11-2 Scatter Plots 11-3 Correlation 11-4 Regression Outline 11-5 Coefficient of Determination
Lecture 14. Outline. Outline. Analysis of Variance * Correlation and Regression Analysis of Variance (ANOVA)
") Outline Lecture 14 Analysis of Variance * Correlation and Regression Analysis of Variance (ANOVA) 11-1 Introduction 11- Scatter Plots 11-3 Correlation 11-4 Regression Outline 11-5 Coefficient of Determination
Outline Lecture 14 Analysis of Variance * Correlation and Regression Analysis of Variance (ANOVA) 11-1 Introduction 11- Scatter Plots 11-3 Correlation 11-4 Regression Outline 11-5 Coefficient of Determination
Section 9 1B: Using Confidence Intervals to Estimate the Difference ( p 1 p 2 ) in 2 Population Proportions p 1 and p 2 using Two Independent Samples
 in 2 Population Proportions p 1 and p 2 using Two Independent Samples") Section 9 1B: Using Confidence Intervals to Estimate the Difference ( p 1 p 2 ) in 2 Population Proportions p 1 and p 2 using Two Independent Samples If p 1 p 1 = 0 then there is no difference in the 2
Section 9 1B: Using Confidence Intervals to Estimate the Difference ( p 1 p 2 ) in 2 Population Proportions p 1 and p 2 using Two Independent Samples If p 1 p 1 = 0 then there is no difference in the 2
11 Correlation and Regression
 Chapter 11 Correlation and Regression August 21, 2017 1 11 Correlation and Regression When comparing two variables, sometimes one variable (the explanatory variable) can be used to help predict the value
2.57 when the critical value is 1.96, what decision should be made?
 Math 1342 Ch. 9-10 Review Name SHORT ANSWER. Write the word or phrase that best completes each statement or answers the question. 9.1 1) If the test value for the difference between the means of two large
ST430 Exam 1 with Answers
 ST430 Exam 1 with Answers Date: October 5, 2015 Name: Guideline: You may use one-page (front and back of a standard A4 paper) of notes. No laptop or textook are permitted but you may use a calculator.
Math 1040 Final Exam Form A Introduction to Statistics Fall Semester 2010
 Math 1040 Final Exam Form A Introduction to Statistics Fall Semester 2010 Instructor Name Time Limit: 120 minutes Any calculator is okay. Necessary tables and formulas are attached to the back of the exam.
Answer keys for Assignment 10: Measurement of study variables (The correct answer is underlined in bold text)
") Answer keys for Assignment 10: Measurement of study variables (The correct answer is underlined in bold text) 1. A quick and easy indicator of dispersion is a. Arithmetic mean b. Variance c. Standard deviation
Answer keys for Assignment 10: Measurement of study variables (The correct answer is underlined in bold text) 1. A quick and easy indicator of dispersion is a. Arithmetic mean b. Variance c. Standard deviation
AMS7: WEEK 7. CLASS 1. More on Hypothesis Testing Monday May 11th, 2015
 AMS7: WEEK 7. CLASS 1 More on Hypothesis Testing Monday May 11th, 2015 Testing a Claim about a Standard Deviation or a Variance We want to test claims about or 2 Example: Newborn babies from mothers taking
MGEC11H3Y L01 Introduction to Regression Analysis Term Test Friday July 5, PM Instructor: Victor Yu
 Last Name (Print): Solution First Name (Print): Student Number: MGECHY L Introduction to Regression Analysis Term Test Friday July, PM Instructor: Victor Yu Aids allowed: Time allowed: Calculator and one
STA 101 Final Review
 STA 101 Final Review Statistics 101 Thomas Leininger June 24, 2013 Announcements All work (besides projects) should be returned to you and should be entered on Sakai. Office Hour: 2 3pm today (Old Chem
The Purpose of Hypothesis Testing
 Section 8 1A:! An Introduction to Hypothesis Testing The Purpose of Hypothesis Testing See s Candy states that a box of it s candy weighs 16 oz. They do not mean that every single box weights exactly 16
Inferences for Regression
 Inferences for Regression An Example: Body Fat and Waist Size Looking at the relationship between % body fat and waist size (in inches). Here is a scatterplot of our data set: Remembering Regression In
The scatterplot is the basic tool for graphically displaying bivariate quantitative data.
 Bivariate Data: Graphical Display The scatterplot is the basic tool for graphically displaying bivariate quantitative data. Example: Some investors think that the performance of the stock market in January
WISE International Masters
 WISE International Masters ECONOMETRICS Instructor: Brett Graham INSTRUCTIONS TO STUDENTS 1 The time allowed for this examination paper is 2 hours. 2 This examination paper contains 32 questions. You are
Confidence Intervals, Testing and ANOVA Summary
 Confidence Intervals, Testing and ANOVA Summary 1 One Sample Tests 1.1 One Sample z test: Mean (σ known) Let X 1,, X n a r.s. from N(µ, σ) or n > 30. Let The test statistic is H 0 : µ = µ 0. z = x µ 0
This is a multiple choice and short answer practice exam. It does not count towards your grade. You may use the tables in your book.
 NAME (Please Print): HONOR PLEDGE (Please Sign): statistics 101 Practice Final Key This is a multiple choice and short answer practice exam. It does not count towards your grade. You may use the tables
WISE MA/PhD Programs Econometrics Instructor: Brett Graham Spring Semester, Academic Year Exam Version: A
 WISE MA/PhD Programs Econometrics Instructor: Brett Graham Spring Semester, 2016-17 Academic Year Exam Version: A INSTRUCTIONS TO STUDENTS 1 The time allowed for this examination paper is 2 hours. 2 This
Chapter 9. Correlation and Regression
 Chapter 9 Correlation and Regression Lesson 9-1/9-2, Part 1 Correlation Registered Florida Pleasure Crafts and Watercraft Related Manatee Deaths 100 80 60 40 20 0 1991 1993 1995 1997 1999 Year Boats in
Chapter 27 Summary Inferences for Regression
 Chapter 7 Summary Inferences for Regression What have we learned? We have now applied inference to regression models. Like in all inference situations, there are conditions that we must check. We can test
Chapter 22. Comparing Two Proportions. Bin Zou STAT 141 University of Alberta Winter / 15
 Chapter 22 Comparing Two Proportions Bin Zou (bzou@ualberta.ca) STAT 141 University of Alberta Winter 2015 1 / 15 Introduction In Ch.19 and Ch.20, we studied confidence interval and test for proportions,
STATISTICS 141 Final Review
 STATISTICS 141 Final Review Bin Zou bzou@ualberta.ca Department of Mathematical & Statistical Sciences University of Alberta Winter 2015 Bin Zou (bzou@ualberta.ca) STAT 141 Final Review Winter 2015 1 /
Correlation Analysis
 Simple Regression Correlation Analysis Correlation analysis is used to measure strength of the association (linear relationship) between two variables Correlation is only concerned with strength of the
Practice Questions: Statistics W1111, Fall Solutions
 Practice Questions: Statistics W, Fall 9 Solutions Question.. The standard deviation of Z is 89... P(=6) =..3. is definitely inside of a 95% confidence interval for..4. (a) YES (b) YES (c) NO (d) NO Questions
Correlation and Regression
 Correlation and Regression October 25, 2017 STAT 151 Class 9 Slide 1 Outline of Topics 1 Associations 2 Scatter plot 3 Correlation 4 Regression 5 Testing and estimation 6 Goodness-of-fit STAT 151 Class
UNIVERSITY OF TORONTO Faculty of Arts and Science
 UNIVERSITY OF TORONTO Faculty of Arts and Science December 2013 Final Examination STA442H1F/2101HF Methods of Applied Statistics Jerry Brunner Duration - 3 hours Aids: Calculator Model(s): Any calculator
Inference for the Regression Coefficient
 Inference for the Regression Coefficient Recall, b 0 and b 1 are the estimates of the slope β 1 and intercept β 0 of population regression line. We can shows that b 0 and b 1 are the unbiased estimates
INTERVAL ESTIMATION AND HYPOTHESES TESTING
 INTERVAL ESTIMATION AND HYPOTHESES TESTING 1. IDEA An interval rather than a point estimate is often of interest. Confidence intervals are thus important in empirical work. To construct interval estimates,
Review: General Approach to Hypothesis Testing. 1. Define the research question and formulate the appropriate null and alternative hypotheses.
 1 Review: Let X 1, X,..., X n denote n independent random variables sampled from some distribution might not be normal!) with mean µ) and standard deviation σ). Then X µ σ n In other words, X is approximately
χ test statistics of 2.5? χ we see that: χ indicate agreement between the two sets of frequencies.
 I. T or F. (1 points each) 1. The χ -distribution is symmetric. F. The χ may be negative, zero, or positive F 3. The chi-square distribution is skewed to the right. T 4. The observed frequency of a cell
Chapter 3. Comparing two populations
 Chapter 3. Comparing two populations Contents Hypothesis for the difference between two population means: matched pairs Hypothesis for the difference between two population means: independent samples Two
One sided tests. An example of a two sided alternative is what we ve been using for our two sample tests:
 One sided tests So far all of our tests have been two sided. While this may be a bit easier to understand, this is often not the best way to do a hypothesis test. One simple thing that we can do to get
WISE MA/PhD Programs Econometrics Instructor: Brett Graham Spring Semester, Academic Year Exam Version: A
 WISE MA/PhD Programs Econometrics Instructor: Brett Graham Spring Semester, 2016-17 Academic Year Exam Version: A INSTRUCTIONS TO STUDENTS 1 The time allowed for this examination paper is 2 hours. 2 This
Bivariate Data: Graphical Display The scatterplot is the basic tool for graphically displaying bivariate quantitative data.
 Bivariate Data: Graphical Display The scatterplot is the basic tool for graphically displaying bivariate quantitative data. Example: Some investors think that the performance of the stock market in January
appstats27.notebook April 06, 2017
 Chapter 27 Objective Students will conduct inference on regression and analyze data to write a conclusion. Inferences for Regression An Example: Body Fat and Waist Size pg 634 Our chapter example revolves
An Analysis of College Algebra Exam Scores December 14, James D Jones Math Section 01
 An Analysis of College Algebra Exam s December, 000 James D Jones Math - Section 0 An Analysis of College Algebra Exam s Introduction Students often complain about a test being too difficult. Are there
Can you tell the relationship between students SAT scores and their college grades?
 Correlation One Challenge Can you tell the relationship between students SAT scores and their college grades? A: The higher SAT scores are, the better GPA may be. B: The higher SAT scores are, the lower
Mock Exam - 2 hours - use of basic (non-programmable) calculator is allowed - all exercises carry the same marks - exam is strictly individual
 calculator is allowed - all exercises carry the same marks - exam is strictly individual") Mock Exam - 2 hours - use of basic (non-programmable) calculator is allowed - all exercises carry the same marks - exam is strictly individual Question 1. Suppose you want to estimate the percentage of
Mock Exam - 2 hours - use of basic (non-programmable) calculator is allowed - all exercises carry the same marks - exam is strictly individual Question 1. Suppose you want to estimate the percentage of
Salt Lake Community College MATH 1040 Final Exam Fall Semester 2011 Form E
 Salt Lake Community College MATH 1040 Final Exam Fall Semester 011 Form E Name Instructor Time Limit: 10 minutes Any hand-held calculator may be used. Computers, cell phones, or other communication devices
STAT FINAL EXAM
 STAT101 2013 FINAL EXAM This exam is 2 hours long. It is closed book but you can use an A-4 size cheat sheet. There are 10 questions. Questions are not of equal weight. You may need a calculator for some
Final Exam Review STAT 212
 Final Exam Review STAT 212 1/ A market researcher randomly selects 100 homeowners under 60 years of age and 200 homeowners over 60 years of age. What sampling technique was used? A. Systematic B. Convenience
(ii) Scan your answer sheets INTO ONE FILE only, and submit it in the drop-box.
 Scan your answer sheets INTO ONE FILE only, and submit it in the drop-box.") FINAL EXAM ** Two different ways to submit your answer sheet (i) Use MS-Word and place it in a drop-box. (ii) Scan your answer sheets INTO ONE FILE only, and submit it in the drop-box. Deadline: December
FINAL EXAM ** Two different ways to submit your answer sheet (i) Use MS-Word and place it in a drop-box. (ii) Scan your answer sheets INTO ONE FILE only, and submit it in the drop-box. Deadline: December
STA Module 10 Comparing Two Proportions
 STA 2023 Module 10 Comparing Two Proportions Learning Objectives Upon completing this module, you should be able to: 1. Perform large-sample inferences (hypothesis test and confidence intervals) to compare
Multiple Linear Regression
 Multiple Linear Regression Simple linear regression tries to fit a simple line between two variables Y and X. If X is linearly related to Y this explains some of the variability in Y. In most cases, there
Machine Learning. Module 3-4: Regression and Survival Analysis Day 2, Asst. Prof. Dr. Santitham Prom-on
 Machine Learning Module 3-4: Regression and Survival Analysis Day 2, 9.00 16.00 Asst. Prof. Dr. Santitham Prom-on Department of Computer Engineering, Faculty of Engineering King Mongkut s University of
STAT 512 MidTerm I (2/21/2013) Spring 2013 INSTRUCTIONS
 Spring 2013 INSTRUCTIONS") STAT 512 MidTerm I (2/21/2013) Spring 2013 Name: Key INSTRUCTIONS 1. This exam is open book/open notes. All papers (but no electronic devices except for calculators) are allowed. 2. There are 5 pages in
STAT 512 MidTerm I (2/21/2013) Spring 2013 Name: Key INSTRUCTIONS 1. This exam is open book/open notes. All papers (but no electronic devices except for calculators) are allowed. 2. There are 5 pages in
Chapter 9 Inferences from Two Samples
 Chapter 9 Inferences from Two Samples 9-1 Review and Preview 9-2 Two Proportions 9-3 Two Means: Independent Samples 9-4 Two Dependent Samples (Matched Pairs) 9-5 Two Variances or Standard Deviations Review
Point Estimation and Confidence Interval
 Chapter 8 Point Estimation and Confidence Interval 8.1 Point estimator The purpose of point estimation is to use a function of the sample data to estimate the unknown parameter. Definition 8.1 A parameter
Final Exam STAT On a Pareto chart, the frequency should be represented on the A) X-axis B) regression C) Y-axis D) none of the above
 X-axis B) regression C) Y-axis D) none of the above") King Abdul Aziz University Faculty of Sciences Statistics Department Final Exam STAT 0 First Term 49-430 A 40 Name No ID: Section: You have 40 questions in 9 pages. You have 90 minutes to solve the exam.
King Abdul Aziz University Faculty of Sciences Statistics Department Final Exam STAT 0 First Term 49-430 A 40 Name No ID: Section: You have 40 questions in 9 pages. You have 90 minutes to solve the exam.
Two-Sample Inference for Proportions and Inference for Linear Regression
 Two-Sample Inference for Proportions and Inference for Linear Regression Kwonsang Lee University of Pennsylvania kwonlee@wharton.upenn.edu April 24, 2015 Kwonsang Lee STAT111 April 24, 2015 1 / 13 Announcement:
Two Sample Problems. Two sample problems
 Two Sample Problems Two sample problems The goal of inference is to compare the responses in two groups. Each group is a sample from a different population. The responses in each group are independent
Harvard University. Rigorous Research in Engineering Education
 Statistical Inference Kari Lock Harvard University Department of Statistics Rigorous Research in Engineering Education 12/3/09 Statistical Inference You have a sample and want to use the data collected
Data Analysis and Statistical Methods Statistics 651
 Data Analysis and Statistical Methods Statistics 651 http://www.stat.tamu.edu/~suhasini/teaching.html Lecture 31 (MWF) Review of test for independence and starting with linear regression Suhasini Subba
Inference for Regression
 Inference for Regression Section 9.4 Cathy Poliak, Ph.D. cathy@math.uh.edu Office in Fleming 11c Department of Mathematics University of Houston Lecture 13b - 3339 Cathy Poliak, Ph.D. cathy@math.uh.edu
Simple Linear Regression
 9-1 l Chapter 9 l Simple Linear Regression 9.1 Simple Linear Regression 9.2 Scatter Diagram 9.3 Graphical Method for Determining Regression 9.4 Least Square Method 9.5 Correlation Coefficient and Coefficient
MATH 644: Regression Analysis Methods
 MATH 644: Regression Analysis Methods FINAL EXAM Fall, 2012 INSTRUCTIONS TO STUDENTS: 1. This test contains SIX questions. It comprises ELEVEN printed pages. 2. Answer ALL questions for a total of 100
Lecture 10: Comparing two populations: proportions
 Lecture 10: Comparing two populations: proportions Problem: Compare two sets of sample data: e.g. is the proportion of As in this semester 152 the same as last Fall? Methods: Extend the methods introduced
Økonomisk Kandidateksamen 2004 (I) Econometrics 2. Rettevejledning
 Econometrics 2. Rettevejledning") Økonomisk Kandidateksamen 2004 (I) Econometrics 2 Rettevejledning This is a closed-book exam (uden hjælpemidler). Answer all questions! The group of questions 1 to 4 have equal weight. Within each group,
Økonomisk Kandidateksamen 2004 (I) Econometrics 2 Rettevejledning This is a closed-book exam (uden hjælpemidler). Answer all questions! The group of questions 1 to 4 have equal weight. Within each group,
LECTURE 6. Introduction to Econometrics. Hypothesis testing & Goodness of fit
 LECTURE 6 Introduction to Econometrics Hypothesis testing & Goodness of fit October 25, 2016 1 / 23 ON TODAY S LECTURE We will explain how multiple hypotheses are tested in a regression model We will define
PART I. (a) Describe all the assumptions for a normal error regression model with one predictor variable,
 Describe all the assumptions for a normal error regression model with one predictor variable,") Concordia University Department of Mathematics and Statistics Course Number Section Statistics 360/2 01 Examination Date Time Pages Final December 2002 3 hours 6 Instructors Course Examiner Marks Y.P.
Concordia University Department of Mathematics and Statistics Course Number Section Statistics 360/2 01 Examination Date Time Pages Final December 2002 3 hours 6 Instructors Course Examiner Marks Y.P.
CIVL /8904 T R A F F I C F L O W T H E O R Y L E C T U R E - 8
 CIVL - 7904/8904 T R A F F I C F L O W T H E O R Y L E C T U R E - 8 Chi-square Test How to determine the interval from a continuous distribution I = Range 1 + 3.322(logN) I-> Range of the class interval
Black White Total Observed Expected χ 2 = (f observed f expected ) 2 f expected (83 126) 2 ( )2 126
 2 f expected (83 126) 2 ( )2 126") Psychology 60 Fall 2013 Practice Final Actual Exam: This Wednesday. Good luck! Name: To view the solutions, check the link at the end of the document. This practice final should supplement your studying;
Psychology 60 Fall 2013 Practice Final Actual Exam: This Wednesday. Good luck! Name: To view the solutions, check the link at the end of the document. This practice final should supplement your studying;
Statistics Introductory Correlation
 Statistics Introductory Correlation Session 10 oscardavid.barrerarodriguez@sciencespo.fr April 9, 2018 Outline 1 Statistics are not used only to describe central tendency and variability for a single variable.
Quantitative Introduction ro Risk and Uncertainty in Business Module 5: Hypothesis Testing
 Quantitative Introduction ro Risk and Uncertainty in Business Module 5: Hypothesis Testing M. Vidyasagar Cecil & Ida Green Chair The University of Texas at Dallas Email: M.Vidyasagar@utdallas.edu October
Lecture 11 - Tests of Proportions
 Lecture 11 - Tests of Proportions Statistics 102 Colin Rundel February 27, 2013 Research Project Research Project Proposal - Due Friday March 29th at 5 pm Introduction, Data Plan Data Project - Due Friday,
In order to carry out a study on employees wages, a company collects information from its 500 employees 1 as follows:
 INTRODUCTORY ECONOMETRICS Dpt of Econometrics & Statistics (EA3) University of the Basque Country UPV/EHU OCW Self Evaluation answers Time: 21/2 hours SURNAME: NAME: ID#: Specific competences to be evaluated
AMS 315/576 Lecture Notes. Chapter 11. Simple Linear Regression
 AMS 315/576 Lecture Notes Chapter 11. Simple Linear Regression 11.1 Motivation A restaurant opening on a reservations-only basis would like to use the number of advance reservations x to predict the number
This gives us an upper and lower bound that capture our population mean.
 Confidence Intervals Critical Values Practice Problems 1 Estimation 1.1 Confidence Intervals Definition 1.1 Margin of error. The margin of error of a distribution is the amount of error we predict when
Statistics 135: Fall 2004 Final Exam
 Name: SID#: Statistics 135: Fall 2004 Final Exam There are 10 problems and the number of points for each is shown in parentheses. There is a normal table at the end. Show your work. 1. The designer of
Part III: Unstructured Data
 Inf1-DA 2010 2011 III: 51 / 89 Part III Unstructured Data Data Retrieval: III.1 Unstructured data and data retrieval Statistical Analysis of Data: III.2 Data scales and summary statistics III.3 Hypothesis
ECON 497 Midterm Spring
 ECON 497 Midterm Spring 2009 1 ECON 497: Economic Research and Forecasting Name: Spring 2009 Bellas Midterm You have three hours and twenty minutes to complete this exam. Answer all questions and explain
This document contains 3 sets of practice problems.
 P RACTICE PROBLEMS This document contains 3 sets of practice problems. Correlation: 3 problems Regression: 4 problems ANOVA: 8 problems You should print a copy of these practice problems and bring them
1 Statistical inference for a population mean
 1 Statistical inference for a population mean 1. Inference for a large sample, known variance Suppose X 1,..., X n represents a large random sample of data from a population with unknown mean µ and known
MATH c UNIVERSITY OF LEEDS Examination for the Module MATH1725 (May-June 2009) INTRODUCTION TO STATISTICS. Time allowed: 2 hours
 INTRODUCTION TO STATISTICS. Time allowed: 2 hours") 01 This question paper consists of 11 printed pages, each of which is identified by the reference. Only approved basic scientific calculators may be used. Statistical tables are provided at the end of
01 This question paper consists of 11 printed pages, each of which is identified by the reference. Only approved basic scientific calculators may be used. Statistical tables are provided at the end of
Ordinary Least Squares Regression Explained: Vartanian
 Ordinary Least Squares Regression Explained: Vartanian When to Use Ordinary Least Squares Regression Analysis A. Variable types. When you have an interval/ratio scale dependent variable.. When your independent
STAT 501 EXAM I NAME Spring 1999
 STAT 501 EXAM I NAME Spring 1999 Instructions: You may use only your calculator and the attached tables and formula sheet. You can detach the tables and formula sheet from the rest of this exam. Show your
MAT 2377C FINAL EXAM PRACTICE
 Department of Mathematics and Statistics University of Ottawa MAT 2377C FINAL EXAM PRACTICE 10 December 2015 Professor: Rafal Kulik Time: 180 minutes Student Number: Family Name: First Name: This is a
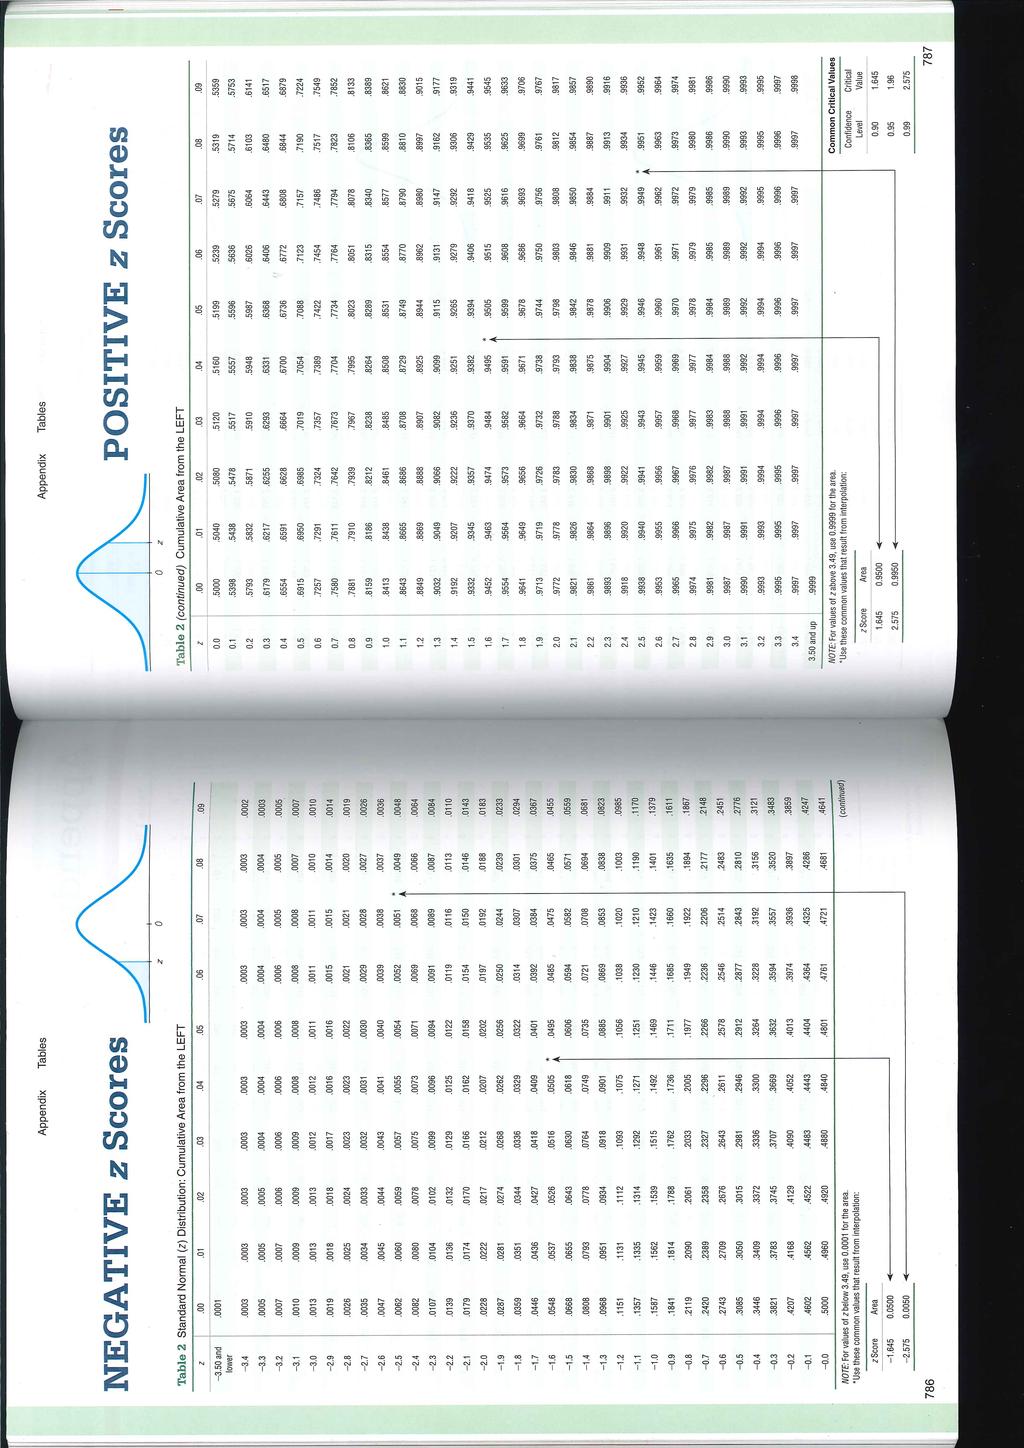
Table of z values and probabilities for the standard normal distribution. z is the first column plus the top row. Each cell shows P(X z).
.") Table of z values and probabilities for the standard normal distribution. z is the first column plus the top row. Each cell shows P(X z). For example P(X.04) =.8508. For z < 0 subtract the value from,
Table of z values and probabilities for the standard normal distribution. z is the first column plus the top row. Each cell shows P(X z). For example P(X.04) =.8508. For z < 0 subtract the value from,
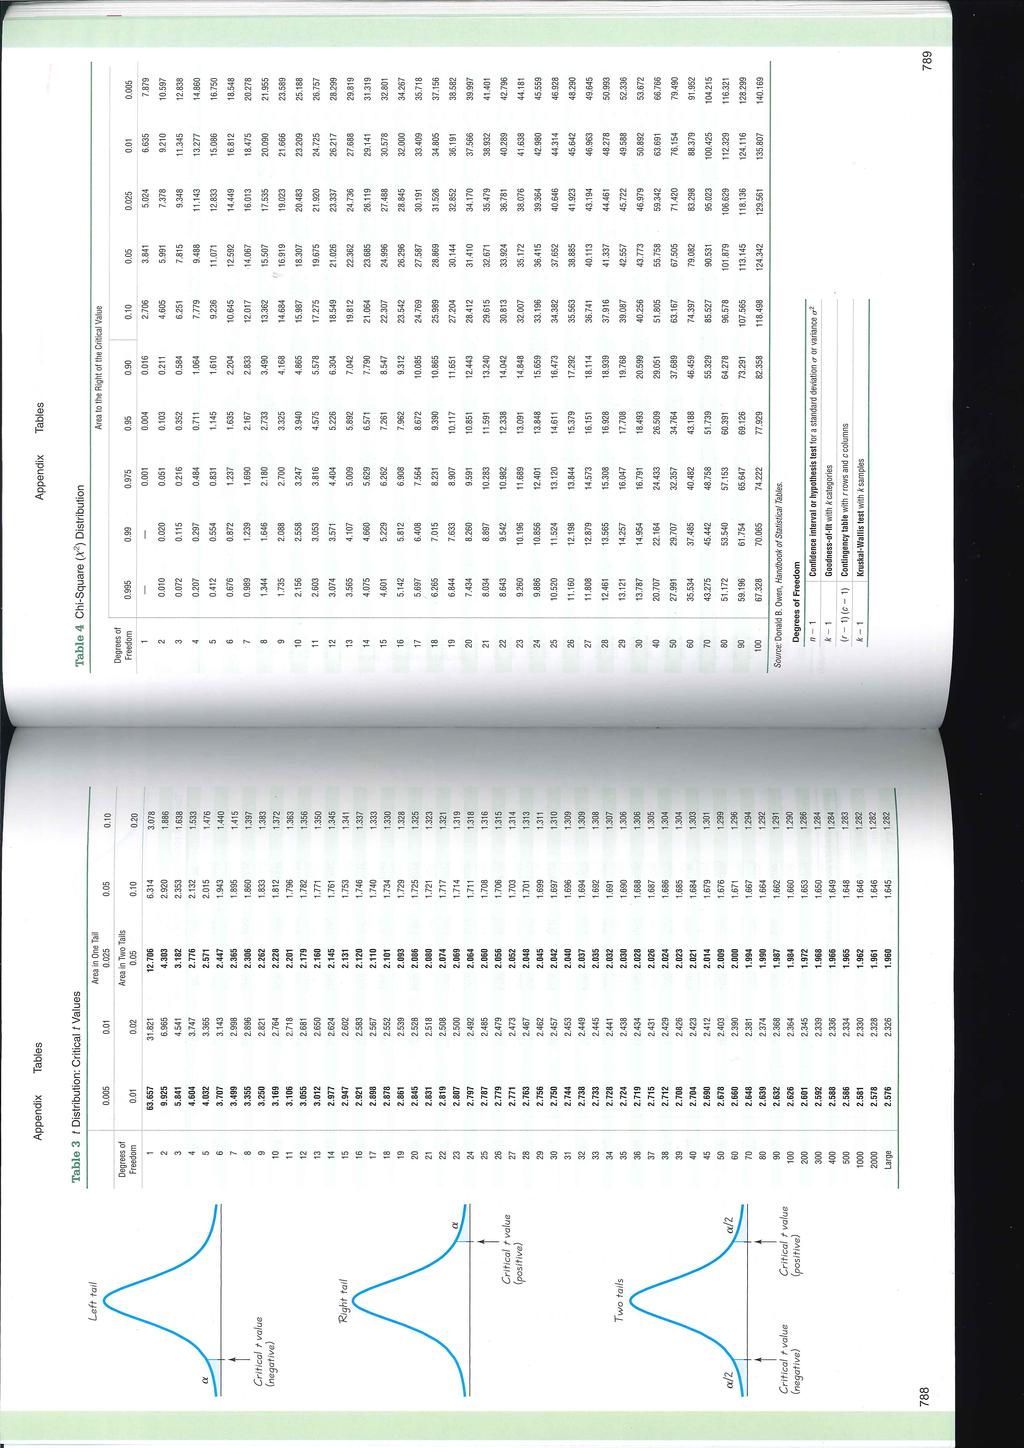
Tables Table A Table B Table C Table D Table E 675
 BMTables.indd Page 675 11/15/11 4:25:16 PM user-s163 Tables Table A Standard Normal Probabilities Table B Random Digits Table C t Distribution Critical Values Table D Chi-square Distribution Critical Values
Stats Review Chapter 14. Mary Stangler Center for Academic Success Revised 8/16
 Stats Review Chapter 14 Revised 8/16 Note: This review is meant to highlight basic concepts from the course. It does not cover all concepts presented by your instructor. Refer back to your notes, unit
UNIVERSITY OF TORONTO. Faculty of Arts and Science APRIL - MAY 2005 EXAMINATIONS STA 248 H1S. Duration - 3 hours. Aids Allowed: Calculator
 UNIVERSITY OF TORONTO Faculty of Arts and Science APRIL - MAY 2005 EXAMINATIONS STA 248 H1S Duration - 3 hours Aids Allowed: Calculator LAST NAME: FIRST NAME: STUDENT NUMBER: There are 17 pages including
Sampling, Confidence Interval and Hypothesis Testing
 Sampling, Confidence Interval and Hypothesis Testing Christopher Grigoriou Executive MBA HEC Lausanne 2007-2008 1 Sampling : Careful with convenience samples! World War II: A statistical study to decide
Department of Mathematics & Statistics STAT 2593 Final Examination 17 April, 2000
 Department of Mathematics & Statistics STAT 2593 Final Examination 17 April, 2000 TIME: 3 hours. Total marks: 80. (Marks are indicated in margin.) Remember that estimate means to give an interval estimate.
Swarthmore Honors Exam 2012: Statistics
 Swarthmore Honors Exam 2012: Statistics 1 Swarthmore Honors Exam 2012: Statistics John W. Emerson, Yale University NAME: Instructions: This is a closed-book three-hour exam having six questions. You may
Midterm 1 and 2 results
 Midterm 1 and 2 results Midterm 1 Midterm 2 ------------------------------ Min. :40.00 Min. : 20.0 1st Qu.:60.00 1st Qu.:60.00 Median :75.00 Median :70.0 Mean :71.97 Mean :69.77 3rd Qu.:85.00 3rd Qu.:85.0
Scatter plot of data from the study. Linear Regression
 1 2 Linear Regression Scatter plot of data from the study. Consider a study to relate birthweight to the estriol level of pregnant women. The data is below. i Weight (g / 100) i Weight (g / 100) 1 7 25
Midterm 2 - Solutions
 Ecn 102 - Analysis of Economic Data University of California - Davis February 24, 2010 Instructor: John Parman Midterm 2 - Solutions You have until 10:20am to complete this exam. Please remember to put
Simple Linear Regression
 Simple Linear Regression ST 430/514 Recall: A regression model describes how a dependent variable (or response) Y is affected, on average, by one or more independent variables (or factors, or covariates)
Statistics 253/317 Introduction to Probability Models. Winter Midterm Exam Friday, Feb 8, 2013
 Statistics 253/317 Introduction to Probability Models Winter 2014 - Midterm Exam Friday, Feb 8, 2013 Student Name (print): (a) Do not sit directly next to another student. (b) This is a closed-book, closed-note
Statistical Inference for Means
 Statistical Inference for Means Jamie Monogan University of Georgia February 18, 2011 Jamie Monogan (UGA) Statistical Inference for Means February 18, 2011 1 / 19 Objectives By the end of this meeting,
STAT 350 Final (new Material) Review Problems Key Spring 2016
 Review Problems Key Spring 2016") 1. The editor of a statistics textbook would like to plan for the next edition. A key variable is the number of pages that will be in the final version. Text files are prepared by the authors using LaTeX,
1. The editor of a statistics textbook would like to plan for the next edition. A key variable is the number of pages that will be in the final version. Text files are prepared by the authors using LaTeX,
Marketing Research Session 10 Hypothesis Testing with Simple Random samples (Chapter 12)
") Marketing Research Session 10 Hypothesis Testing with Simple Random samples (Chapter 12) Remember: Z.05 = 1.645, Z.01 = 2.33 We will only cover one-sided hypothesis testing (cases 12.3, 12.4.2, 12.5.2,
Marketing Research Session 10 Hypothesis Testing with Simple Random samples (Chapter 12) Remember: Z.05 = 1.645, Z.01 = 2.33 We will only cover one-sided hypothesis testing (cases 12.3, 12.4.2, 12.5.2,
Subject CS1 Actuarial Statistics 1 Core Principles
 Institute of Actuaries of India Subject CS1 Actuarial Statistics 1 Core Principles For 2019 Examinations Aim The aim of the Actuarial Statistics 1 subject is to provide a grounding in mathematical and
y n 1 ( x i x )( y y i n 1 i y 2
( y y i n 1 i y 2") STP3 Brief Class Notes Instructor: Ela Jackiewicz Chapter Regression and Correlation In this chapter we will explore the relationship between two quantitative variables, X an Y. We will consider n ordered
STP3 Brief Class Notes Instructor: Ela Jackiewicz Chapter Regression and Correlation In this chapter we will explore the relationship between two quantitative variables, X an Y. We will consider n ordered
Inferential Statistics
 Inferential Statistics Part 1 Sampling Distributions, Point Estimates & Confidence Intervals Inferential statistics are used to draw inferences (make conclusions/judgements) about a population from a sample.
Chapter Goals. To introduce you to data collection
 Chapter Goals To introduce you to data collection You will learn to think critically about the data collected or presented learn various methods for selecting a sample Formulate Theories Interpret Results/Make
Chapter 10. Regression. Understandable Statistics Ninth Edition By Brase and Brase Prepared by Yixun Shi Bloomsburg University of Pennsylvania
 Chapter 10 Regression Understandable Statistics Ninth Edition By Brase and Brase Prepared by Yixun Shi Bloomsburg University of Pennsylvania Scatter Diagrams A graph in which pairs of points, (x, y), are