Machine Learning. Module 3-4: Regression and Survival Analysis Day 2, Asst. Prof. Dr. Santitham Prom-on
|
|
|
- Amie Hodge
- 5 years ago
- Views:
Transcription


1 Machine Learning Module 3-4: Regression and Survival Analysis Day 2, Asst. Prof. Dr. Santitham Prom-on Department of Computer Engineering, Faculty of Engineering King Mongkut s University of Technology Thonburi
2 Module 3 Overview Linear regression Poisson regression Survival analysis
3 Simple linear regression Simple linear regression allows us to summarize and study relationships between two continuous (quantitative) variables: One variable, denoted x, is regarded as the predictor, explanatory, or independent variable. The other variable, denoted y, is regarded as the response, outcome, or dependent variable.

4 Types of relationship Deterministic Statistical
5 Example of statistical relationships Height and weight Alcohol consumed and blood alcohol content Spending amount and number of spending Number of exercises per week and loosing weight Credit-line and average credit usage
6 Assessing statistical linear relationship Graphical Scatter plot Statistics Correlation
7 Correlation coefficient The correlation coefficient computed from the sample data measures the strength and direction of a linear relationship between two variables. The symbol for the sample correlation coefficient is r. The symbol for the population correlation coefficient is ρ. There are several types of correlation coefficients. The one explained in this section is called the Pearson product moment correlation coefficient (PPMC)
8 Pearson product moment correlation Given n pairs of observations (x 1,y 1 ), (x 2,y 2 ),,(x n,y n ) It is natural to speak of x and y having a positive relationship if large x s are paired with large y s and small x s with small y s On the contrary, if large x s are paired with small y s and small x s with large y s, then a negative relationship between the variable is implied
9 Pearson product moment correlation Consider the quantity n s = å x -x y - y ( )( ) xy i i i= 1 Then, if the relationship is strongly positive, an x i above the mean will tend to be paired with a y i above the mean, so that and this product will also be positive whenever both x i and y i are below their means x -x y - y > ( )( ) 0 i i
10 Pearson product moment correlation To make this measure dimensionless, we divide as follow r s å ( x -x)( y - y) xy i= 1 i i = = n 2 n 2 sxx s å yy ( x ) ( ) i 1 i -x å y i 1 i - y = = A more convenient form for this equation is r = n ( å ) ( )( ) i i - å å i i n xy x y ( 2) ( ) ( 2) ( ) i - i i - i 2 2 å å å å n x x n y y
11 Correlation coefficient and scatter plot The range of the correlation coefficient is from -1 to 1. If there is a strong positive linear relationship between the variables, the value of r will be close to 1. If there is a strong negative linear relationship, the value of r will be close to -1. When there is no linear relationship between the variables or only a weak one, the value of r will be close to 0
12 Strong correlation? A frequently asked question is: what can it be said that there is a strong correlation between variables, and when is the correlation weak? A reasonable rule of thumb is to say that the correlation is weak if 0 r 0.5 strong 0.8 r 1 moderate otherwise
13 Correlation and shape
14 Python: Loading data
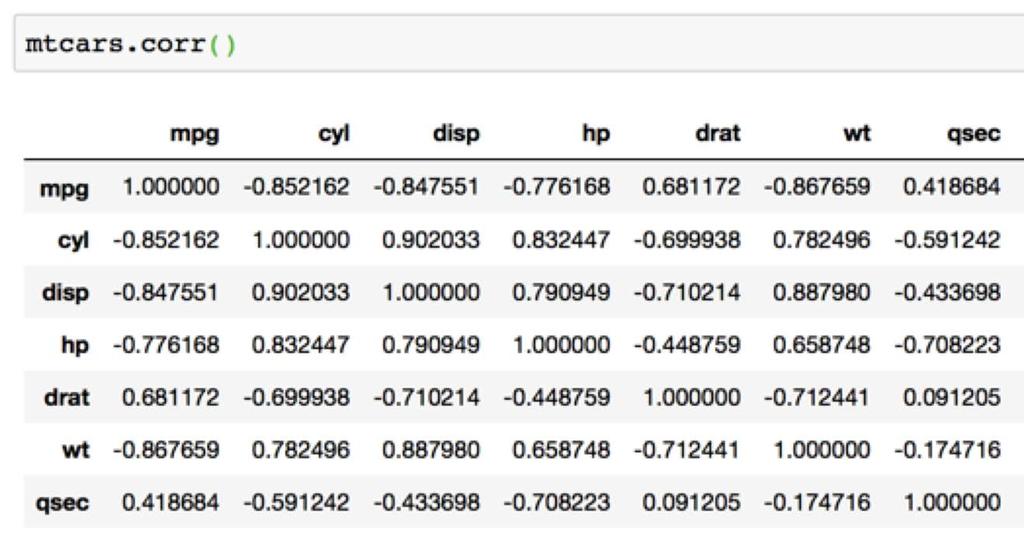
15 Pairwise Correlation

16 Correlation and scatter plot Negative relationship, mpg vs wt
17 Correlation and scatter plot Positive relationship, hp vs disp


18 Correlation and scatter plot No relationship, qsec vs drat
19 Scatter and trend Since we are interested in summarizing the trend between two quantitative variables, the natural question arises "what is the best fitting line?" Scatter plot shows points distribution and potentially the trend in the data Look at the figure in next pages, which lines do you think best summarizes the trend between height and weight?
20 Line equation y i denotes the observed response for experimental unit i x i denotes the predictor value for experimental unit i ŷ i is the predicted response (or fitted value) for experimental unit i The equation for best fitting line is: ŷ i = b 0 + b 1 x i
21 Regression parameters Given a value x i, how do we interpret b 0 and b 1. b 1 tells us: if the value we saw for x was one unit bigger, how much would our prediction for y changes? b 0 tells us: what would we predict for y if x = 0?
22 Residual must be normally distributed with zero mean
23
24 Best line
25 Error In general, when we use ŷ i = b 0 + b 1 x i to predict the actual response y i, we make a prediction error (or residual error) of size: e i = y i ŷ i A line that fits the data "best" will be one for which the n prediction errors one for each observed data point are as small as possible in some overall sense.
26 Method of least squares Choose the b s so that the sum of the squares of the errors, e i, are minimized The error function is '! = # $%& ' = # $%& ( $ ) $ +, + & - $.
27 Ordinary least square solution Minimum of a function is the point where the slope is zero E(α) E(x) xα

28 Coefficient of determination (r 2 ) The coefficient of determination is a number that indicates the proportion of the variance in the dependent variable that is predictable from the independent variables
29 Coefficient of determination The coefficient of determination R 2 (or sometimes r 2 ) is another measure of how well the least squares equation Y = α + βx perform as a predictor of y R 2 is computed as: R 2 SS yy - SSE SS yy SSE SSE = = - = 1- SS SS SS SS yy yy yy yy R 2 measures the relative sizes of SS yy and SSE. The smaller SSE, the more reliable the predictions obtained from the model.
30 Coefficient of determination SS yy measures the deviation of the observations from their mean: yy ( ) 2 = åi i - SS y y SSE measures the deviation of observations from their predicted values ( ) 2 = åi i - SSE y Y i
31 Coefficient of determination The higher the R 2, the more useful the model R 2 takes on values between 0 and 1 Essentially, R 2 tells us how much better we can do in predicting y by using the model and computing Y than by just using the mean of y as a predictor. Note that when we use the model and compute Y the prediction depends on X because Y = α + βx. Thus, we act as if x contains information about y. If we just use the mean of y to predict y, then we are saying that x does not contribute information about y and thus our predictions of y do not depend on x.

32 Python: Separate X and Y

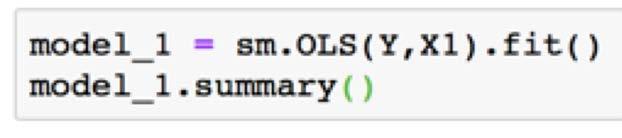
33 Simple linear regression No intercept
34 Coefficients Estimates: values of the coefficients Standard errors: This measures the average amount that the coefficient estimates vary from the actual average value of our response variable t-value: The coefficient t-value is a measure of how many standard deviations our coefficient estimate is far away from 0. Pr(>t): This indicates whether the probability that the impact of the parameter is due to chance.
35 Simple linear regression With intercept
36
37 Residual and R 2 The Residual Standard Error is the average amount that the response (dist) will deviate from the true regression line. In multiple regression settings, the R 2 will always increase as more variables are included in the model. That s why the adjusted R 2 is the preferred measure as it adjusts for the number of variables considered.
38 F-statistics F-statistic is a good indicator of whether there is a relationship between our predictor and the response variables. The further the F-statistic is from 1 the better it is.

39 R: prediction with linear regression

40 Root mean square error
41 Multiple linear regression We move from the simple linear regression model with one predictor to the multiple linear regression model with two or more predictors. That is, we use the adjective "simple" to denote that our model has only predictor, and we use the adjective "multiple" to indicate that our model has at least two predictors
42 Multiple regression Additive model, no interaction Multiple linear regression model structure is exactly the same as the linear regression f ( x) = w 0 + w 1 x 1 + w 2 x 2 +! Mathematically, parameters are obtained by least square method
43 Multiple regression additive model
44 Interaction in multiple regression Adding interaction terms to a regression model can greatly expand understanding of the relationships among the variables in the model This occurs when two or more variables depend on one another for the outcome For example, drug and alcohol may interact and creates addition (adverse) affect Another example, credit card types and number of active month may interact (depend) and have different spending results
45 Adding interaction term
46 Multiple regression multiplicative model (interaction)
47 Survival analysis
48 Logistic regression vs time In logistic regression, we were interested in studying how risk factors were associated with presence or absence of disease. Sometimes, we are interested in how a risk factor or treatment affects time to disease or some other event. In these cases, logistic regression is not appropriate.
49 Survival analysis Survival analysis is used to analyze data in which the time until the event is of interest. The response is often referred to as a failure time, survival time, or event time.
50 Example: Time until tumor recurrence Time until a machine part fails Time until mobile phone recharge Time until the next credit card usage
51 The survival time response Usually continuous May be incompletely determined for some subjects For some subjects we may know that their survival time was at least equal to some time t. Whereas, for other subjects, we will know their exact time of event. Incompletely observed responses are censored Is always 0.
52 Analysis issue If there is no censoring, standard linear regression procedures could be used. However, these may be inadequate because Time to event is restricted to be positive and has a skewed distribution. The probability of surviving past a certain point in time may be of more interest than the expected time of event. The hazard function, used for regression in survival analysis, can lend more insight into the failure mechanism than linear regression.
53 Censoring Censoring is present when we have some information about a subject s event time, but we don t know the exact event time. For the analysis methods we will discuss to be valid, censoring mechanism must be independent of the survival mechanism.
54 Reasons censoring might occur A subject does not experience the event before the study ends A person is lost to follow-up during the study period A person withdraws from the study These are all examples of right-censoring.
55 Terminology and notation
56 Survival function The survival function gives the probability that a subject will survive past time t. As t ranges from 0 to, the survival function has the following properties It is non-increasing At time t= 0, S(t) = 1. In other words, the probability of surviving past time 0 is 1. At time t=, S(t)=S( )=0. As time goes to infinity, the survival curve goes to 0. In theory, the survival function is smooth. In practice, we observe events on a discrete time scale (days, weeks, etc.).
57
58
59 Survival data
60
61
62
63
64
65 Survival analysis data
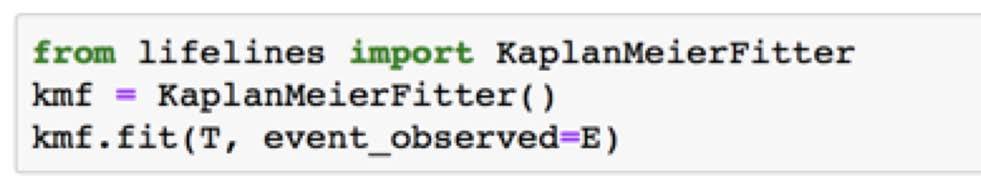
66 Kaplan-Meier estimator
67
68 Multiple groups
69 Parametric survival functions The Kaplan-Meier estimator is a very useful tool for estimating survival functions. Sometimes, we may want to make more assumptions that allow us to model the data in more detail.
70 Benefit of using parametric survival functions By specifying a parametric form for S(t), we can easily compute selected quantiles of the distribution estimate the expected failure time derive a concise equation and smooth function for estimating S(t),H(t) and h(t) estimate S(t) more precisely than KM assuming the parametric form is correct!
71 Cox proportional hazards regression model The Cox PH model is a semiparametric model makes no assumptions about the form of h(t) (nonparametric part of model) assumes parametric form for the effect of the predictors on the hazard In most situations, we are more interested in the parameter estimates than the shape of the hazard. The Cox PH model is well-suited to this goal.
72 Survival regression While the above KaplanMeierFitter is useful, they only give us an average view of the population. Often we have specific data at the individual level, either continuous or categorical, that we would like to use. For this, we turn to survival regression, specifically CoxPHFitter.
73 Python: Load survival regression data
74 Survival regression
75 Survival regression result
76 Result
77 Thank you Question?
Exploratory data analysis
 Exploratory data analysis November 29, 2017 Dr. Khajonpong Akkarajitsakul Department of Computer Engineering, Faculty of Engineering King Mongkut s University of Technology Thonburi Module III Overview
Statistics in medicine
 Statistics in medicine Lecture 4: and multivariable regression Fatma Shebl, MD, MS, MPH, PhD Assistant Professor Chronic Disease Epidemiology Department Yale School of Public Health Fatma.shebl@yale.edu
BIOSTATISTICS NURS 3324
 Simple Linear Regression and Correlation Introduction Previously, our attention has been focused on one variable which we designated by x. Frequently, it is desirable to learn something about the relationship
TMA 4275 Lifetime Analysis June 2004 Solution
 TMA 4275 Lifetime Analysis June 2004 Solution Problem 1 a) Observation of the outcome is censored, if the time of the outcome is not known exactly and only the last time when it was observed being intact,
Correlation and Regression
 Elementary Statistics A Step by Step Approach Sixth Edition by Allan G. Bluman http://www.mhhe.com/math/stat/blumanbrief SLIDES PREPARED BY LLOYD R. JAISINGH MOREHEAD STATE UNIVERSITY MOREHEAD KY Updated
Correlation and Regression
 Correlation and Regression October 25, 2017 STAT 151 Class 9 Slide 1 Outline of Topics 1 Associations 2 Scatter plot 3 Correlation 4 Regression 5 Testing and estimation 6 Goodness-of-fit STAT 151 Class
AMS 315/576 Lecture Notes. Chapter 11. Simple Linear Regression
 AMS 315/576 Lecture Notes Chapter 11. Simple Linear Regression 11.1 Motivation A restaurant opening on a reservations-only basis would like to use the number of advance reservations x to predict the number
1 The problem of survival analysis
 1 The problem of survival analysis Survival analysis concerns analyzing the time to the occurrence of an event. For instance, we have a dataset in which the times are 1, 5, 9, 20, and 22. Perhaps those
MAS3301 / MAS8311 Biostatistics Part II: Survival
 MAS3301 / MAS8311 Biostatistics Part II: Survival M. Farrow School of Mathematics and Statistics Newcastle University Semester 2, 2009-10 1 13 The Cox proportional hazards model 13.1 Introduction In the
Simple Linear Regression
 9-1 l Chapter 9 l Simple Linear Regression 9.1 Simple Linear Regression 9.2 Scatter Diagram 9.3 Graphical Method for Determining Regression 9.4 Least Square Method 9.5 Correlation Coefficient and Coefficient
Survival Analysis Math 434 Fall 2011
 Survival Analysis Math 434 Fall 2011 Part IV: Chap. 8,9.2,9.3,11: Semiparametric Proportional Hazards Regression Jimin Ding Math Dept. www.math.wustl.edu/ jmding/math434/fall09/index.html Basic Model Setup
AP Statistics Unit 6 Note Packet Linear Regression. Scatterplots and Correlation
 Scatterplots and Correlation Name Hr A scatterplot shows the relationship between two quantitative variables measured on the same individuals. variable (y) measures an outcome of a study variable (x) may
Simple Linear Regression Using Ordinary Least Squares
 Simple Linear Regression Using Ordinary Least Squares Purpose: To approximate a linear relationship with a line. Reason: We want to be able to predict Y using X. Definition: The Least Squares Regression
Introduction and Single Predictor Regression. Correlation
 Introduction and Single Predictor Regression Dr. J. Kyle Roberts Southern Methodist University Simmons School of Education and Human Development Department of Teaching and Learning Correlation A correlation
Simple Linear Regression
 Simple Linear Regression OI CHAPTER 7 Important Concepts Correlation (r or R) and Coefficient of determination (R 2 ) Interpreting y-intercept and slope coefficients Inference (hypothesis testing and confidence
Measuring the fit of the model - SSR
 Measuring the fit of the model - SSR Once we ve determined our estimated regression line, we d like to know how well the model fits. How far/close are the observations to the fitted line? One way to do
Correlation & Regression. Dr. Moataza Mahmoud Abdel Wahab Lecturer of Biostatistics High Institute of Public Health University of Alexandria
 بسم الرحمن الرحيم Correlation & Regression Dr. Moataza Mahmoud Abdel Wahab Lecturer of Biostatistics High Institute of Public Health University of Alexandria Correlation Finding the relationship between
Scatter plot of data from the study. Linear Regression
 1 2 Linear Regression Scatter plot of data from the study. Consider a study to relate birthweight to the estriol level of pregnant women. The data is below. i Weight (g / 100) i Weight (g / 100) 1 7 25
Chapter 4. Regression Models. Learning Objectives
 Chapter 4 Regression Models To accompany Quantitative Analysis for Management, Eleventh Edition, by Render, Stair, and Hanna Power Point slides created by Brian Peterson Learning Objectives After completing
Introduction to Statistical Analysis
 Introduction to Statistical Analysis Changyu Shen Richard A. and Susan F. Smith Center for Outcomes Research in Cardiology Beth Israel Deaconess Medical Center Harvard Medical School Objectives Descriptive
Lecture 11: Simple Linear Regression
 Lecture 11: Simple Linear Regression Readings: Sections 3.1-3.3, 11.1-11.3 Apr 17, 2009 In linear regression, we examine the association between two quantitative variables. Number of beers that you drink
TMA4255 Applied Statistics V2016 (5)
") TMA4255 Applied Statistics V2016 (5) Part 2: Regression Simple linear regression [11.1-11.4] Sum of squares [11.5] Anna Marie Holand To be lectured: January 26, 2016 wiki.math.ntnu.no/tma4255/2016v/start
TMA4255 Applied Statistics V2016 (5) Part 2: Regression Simple linear regression [11.1-11.4] Sum of squares [11.5] Anna Marie Holand To be lectured: January 26, 2016 wiki.math.ntnu.no/tma4255/2016v/start
STAT 4385 Topic 03: Simple Linear Regression
 STAT 4385 Topic 03: Simple Linear Regression Xiaogang Su, Ph.D. Department of Mathematical Science University of Texas at El Paso xsu@utep.edu Spring, 2017 Outline The Set-Up Exploratory Data Analysis
Multiple Regression: Chapter 13. July 24, 2015
 Multiple Regression: Chapter 13 July 24, 2015 Multiple Regression (MR) Response Variable: Y - only one response variable (quantitative) Several Predictor Variables: X 1, X 2, X 3,..., X p (p = # predictors)
Extra Exam Empirical Methods VU University Amsterdam, Faculty of Exact Sciences , July 2, 2015
 Extra Exam Empirical Methods VU University Amsterdam, Faculty of Exact Sciences 12.00 14.45, July 2, 2015 Also hand in this exam and your scrap paper. Always motivate your answers. Write your answers in
Scatter plot of data from the study. Linear Regression
 1 2 Linear Regression Scatter plot of data from the study. Consider a study to relate birthweight to the estriol level of pregnant women. The data is below. i Weight (g / 100) i Weight (g / 100) 1 7 25
Ph.D. course: Regression models. Introduction. 19 April 2012
 Ph.D. course: Regression models Introduction PKA & LTS Sect. 1.1, 1.2, 1.4 19 April 2012 www.biostat.ku.dk/~pka/regrmodels12 Per Kragh Andersen 1 Regression models The distribution of one outcome variable
Midterm 2 - Solutions
 Ecn 102 - Analysis of Economic Data University of California - Davis February 24, 2010 Instructor: John Parman Midterm 2 - Solutions You have until 10:20am to complete this exam. Please remember to put
Glossary. The ISI glossary of statistical terms provides definitions in a number of different languages:
 Glossary The ISI glossary of statistical terms provides definitions in a number of different languages: http://isi.cbs.nl/glossary/index.htm Adjusted r 2 Adjusted R squared measures the proportion of the
Analysing data: regression and correlation S6 and S7
 Basic medical statistics for clinical and experimental research Analysing data: regression and correlation S6 and S7 K. Jozwiak k.jozwiak@nki.nl 2 / 49 Correlation So far we have looked at the association
Ph.D. course: Regression models. Regression models. Explanatory variables. Example 1.1: Body mass index and vitamin D status
 Ph.D. course: Regression models Introduction PKA & LTS Sect. 1.1, 1.2, 1.4 25 April 2013 www.biostat.ku.dk/~pka/regrmodels13 Per Kragh Andersen Regression models The distribution of one outcome variable
LINEAR REGRESSION ANALYSIS. MODULE XVI Lecture Exercises
 LINEAR REGRESSION ANALYSIS MODULE XVI Lecture - 44 Exercises Dr. Shalabh Department of Mathematics and Statistics Indian Institute of Technology Kanpur Exercise 1 The following data has been obtained on
STAT 6350 Analysis of Lifetime Data. Failure-time Regression Analysis
 STAT 6350 Analysis of Lifetime Data Failure-time Regression Analysis Explanatory Variables for Failure Times Usually explanatory variables explain/predict why some units fail quickly and some units survive
Nonparametric Model Construction
 Nonparametric Model Construction Chapters 4 and 12 Stat 477 - Loss Models Chapters 4 and 12 (Stat 477) Nonparametric Model Construction Brian Hartman - BYU 1 / 28 Types of data Types of data For non-life
STAT Chapter 11: Regression
 STAT 515 -- Chapter 11: Regression Mostly we have studied the behavior of a single random variable. Often, however, we gather data on two random variables. We wish to determine: Is there a relationship
Review of Statistics 101
 Review of Statistics 101 We review some important themes from the course 1. Introduction Statistics- Set of methods for collecting/analyzing data (the art and science of learning from data). Provides methods
Turning a research question into a statistical question.
 Turning a research question into a statistical question. IGINAL QUESTION: Concept Concept Concept ABOUT ONE CONCEPT ABOUT RELATIONSHIPS BETWEEN CONCEPTS TYPE OF QUESTION: DESCRIBE what s going on? DECIDE
Chapter 7. Linear Regression (Pt. 1) 7.1 Introduction. 7.2 The Least-Squares Regression Line
 7.1 Introduction. 7.2 The Least-Squares Regression Line") Chapter 7 Linear Regression (Pt. 1) 7.1 Introduction Recall that r, the correlation coefficient, measures the linear association between two quantitative variables. Linear regression is the method of fitting
Chapter 7 Linear Regression (Pt. 1) 7.1 Introduction Recall that r, the correlation coefficient, measures the linear association between two quantitative variables. Linear regression is the method of fitting
23. Inference for regression
 23. Inference for regression The Practice of Statistics in the Life Sciences Third Edition 2014 W. H. Freeman and Company Objectives (PSLS Chapter 23) Inference for regression The regression model Confidence
Statistics 203 Introduction to Regression Models and ANOVA Practice Exam
 Statistics 203 Introduction to Regression Models and ANOVA Practice Exam Prof. J. Taylor You may use your 4 single-sided pages of notes This exam is 7 pages long. There are 4 questions, first 3 worth 10
Simple Linear Regression Analysis
 LINEAR REGRESSION ANALYSIS MODULE II Lecture - 6 Simple Linear Regression Analysis Dr. Shalabh Department of Mathematics and Statistics Indian Institute of Technology Kanpur Prediction of values of study
Regression Analysis and Forecasting Prof. Shalabh Department of Mathematics and Statistics Indian Institute of Technology-Kanpur
 Regression Analysis and Forecasting Prof. Shalabh Department of Mathematics and Statistics Indian Institute of Technology-Kanpur Lecture 10 Software Implementation in Simple Linear Regression Model using
Using regression to study economic relationships is called econometrics. econo = of or pertaining to the economy. metrics = measurement
 EconS 450 Forecasting part 3 Forecasting with Regression Using regression to study economic relationships is called econometrics econo = of or pertaining to the economy metrics = measurement Econometrics
Conflicts of Interest
 Analysis of Dependent Variables: Correlation and Simple Regression Zacariah Labby, PhD, DABR Asst. Prof. (CHS), Dept. of Human Oncology University of Wisconsin Madison Conflicts of Interest None to disclose
Final Exam - Solutions
 Ecn 102 - Analysis of Economic Data University of California - Davis March 19, 2010 Instructor: John Parman Final Exam - Solutions You have until 5:30pm to complete this exam. Please remember to put your
Elementary Statistics Lecture 3 Association: Contingency, Correlation and Regression
 Elementary Statistics Lecture 3 Association: Contingency, Correlation and Regression Chong Ma Department of Statistics University of South Carolina chongm@email.sc.edu Chong Ma (Statistics, USC) STAT 201
Simple Linear Regression
 Simple Linear Regression Reading: Hoff Chapter 9 November 4, 2009 Problem Data: Observe pairs (Y i,x i ),i = 1,... n Response or dependent variable Y Predictor or independent variable X GOALS: Exploring
Tied survival times; estimation of survival probabilities
 Tied survival times; estimation of survival probabilities Patrick Breheny November 5 Patrick Breheny Survival Data Analysis (BIOS 7210) 1/22 Introduction Tied survival times Introduction Breslow approximation
11 Correlation and Regression
 Chapter 11 Correlation and Regression August 21, 2017 1 11 Correlation and Regression When comparing two variables, sometimes one variable (the explanatory variable) can be used to help predict the value
REVIEW 8/2/2017 陈芳华东师大英语系
 REVIEW Hypothesis testing starts with a null hypothesis and a null distribution. We compare what we have to the null distribution, if the result is too extreme to belong to the null distribution (p
Overview. Overview. Overview. Specific Examples. General Examples. Bivariate Regression & Correlation
 Bivariate Regression & Correlation Overview The Scatter Diagram Two Examples: Education & Prestige Correlation Coefficient Bivariate Linear Regression Line SPSS Output Interpretation Covariance ou already
Ch 2: Simple Linear Regression
 Ch 2: Simple Linear Regression 1. Simple Linear Regression Model A simple regression model with a single regressor x is y = β 0 + β 1 x + ɛ, where we assume that the error ɛ is independent random component
Chapter 8. Linear Regression /71
 Chapter 8 Linear Regression 1 /71 Homework p192 1, 2, 3, 5, 7, 13, 15, 21, 27, 28, 29, 32, 35, 37 2 /71 3 /71 Objectives Determine Least Squares Regression Line (LSRL) describing the association of two
1. Simple Linear Regression
 1. Simple Linear Regression Suppose that we are interested in the average height of male undergrads at UF. We put each male student s name (population) in a hat and randomly select 100 (sample). Then their
INTRODUCING LINEAR REGRESSION MODELS Response or Dependent variable y
 INTRODUCING LINEAR REGRESSION MODELS Response or Dependent variable y Predictor or Independent variable x Model with error: for i = 1,..., n, y i = α + βx i + ε i ε i : independent errors (sampling, measurement,
Lecture 3. Truncation, length-bias and prevalence sampling
 Lecture 3. Truncation, length-bias and prevalence sampling 3.1 Prevalent sampling Statistical techniques for truncated data have been integrated into survival analysis in last two decades. Truncation in
STAT 511. Lecture : Simple linear regression Devore: Section Prof. Michael Levine. December 3, Levine STAT 511
 STAT 511 Lecture : Simple linear regression Devore: Section 12.1-12.4 Prof. Michael Levine December 3, 2018 A simple linear regression investigates the relationship between the two variables that is not
Regression Analysis. Regression: Methodology for studying the relationship among two or more variables
 Regression Analysis Regression: Methodology for studying the relationship among two or more variables Two major aims: Determine an appropriate model for the relationship between the variables Predict the
Single and multiple linear regression analysis
 Single and multiple linear regression analysis Marike Cockeran 2017 Introduction Outline of the session Simple linear regression analysis SPSS example of simple linear regression analysis Additional topics
Final Exam - Solutions
 Ecn 102 - Analysis of Economic Data University of California - Davis March 17, 2010 Instructor: John Parman Final Exam - Solutions You have until 12:30pm to complete this exam. Please remember to put your
Faculty of Health Sciences. Regression models. Counts, Poisson regression, Lene Theil Skovgaard. Dept. of Biostatistics
 Faculty of Health Sciences Regression models Counts, Poisson regression, 27-5-2013 Lene Theil Skovgaard Dept. of Biostatistics 1 / 36 Count outcome PKA & LTS, Sect. 7.2 Poisson regression The Binomial
Correlation & Linear Regression. Slides adopted fromthe Internet
 Correlation & Linear Regression Slides adopted fromthe Internet Roadmap Linear Correlation Spearman s rho correlation Kendall s tau correlation Linear regression Linear correlation Recall: Covariance n
Lecture 14 Simple Linear Regression
 Lecture 4 Simple Linear Regression Ordinary Least Squares (OLS) Consider the following simple linear regression model where, for each unit i, Y i is the dependent variable (response). X i is the independent
9. Linear Regression and Correlation
 9. Linear Regression and Correlation Data: y a quantitative response variable x a quantitative explanatory variable (Chap. 8: Recall that both variables were categorical) For example, y = annual income,
Chapter 4 Describing the Relation between Two Variables
 Chapter 4 Describing the Relation between Two Variables 4.1 Scatter Diagrams and Correlation The is the variable whose value can be explained by the value of the or. A is a graph that shows the relationship
Correlation and Regression
 Correlation and Regression Dr. Bob Gee Dean Scott Bonney Professor William G. Journigan American Meridian University 1 Learning Objectives Upon successful completion of this module, the student should
ANOVA Situation The F Statistic Multiple Comparisons. 1-Way ANOVA MATH 143. Department of Mathematics and Statistics Calvin College
 1-Way ANOVA MATH 143 Department of Mathematics and Statistics Calvin College An example ANOVA situation Example (Treating Blisters) Subjects: 25 patients with blisters Treatments: Treatment A, Treatment
Big Data Analysis with Apache Spark UC#BERKELEY
 Big Data Analysis with Apache Spark UC#BERKELEY This Lecture: Relation between Variables An association A trend» Positive association or Negative association A pattern» Could be any discernible shape»
Semiparametric Regression
 Semiparametric Regression Patrick Breheny October 22 Patrick Breheny Survival Data Analysis (BIOS 7210) 1/23 Introduction Over the past few weeks, we ve introduced a variety of regression models under
Typical Survival Data Arising From a Clinical Trial. Censoring. The Survivor Function. Mathematical Definitions Introduction
 Outline CHL 5225H Advanced Statistical Methods for Clinical Trials: Survival Analysis Prof. Kevin E. Thorpe Defining Survival Data Mathematical Definitions Non-parametric Estimates of Survival Comparing
Review of Statistics
 Review of Statistics Topics Descriptive Statistics Mean, Variance Probability Union event, joint event Random Variables Discrete and Continuous Distributions, Moments Two Random Variables Covariance and
Bivariate Relationships Between Variables
 Bivariate Relationships Between Variables BUS 735: Business Decision Making and Research 1 Goals Specific goals: Detect relationships between variables. Be able to prescribe appropriate statistical methods
Basic Medical Statistics Course
 Basic Medical Statistics Course S7 Logistic Regression November 2015 Wilma Heemsbergen w.heemsbergen@nki.nl Logistic Regression The concept of a relationship between the distribution of a dependent variable
STATISTICS 1 REVISION NOTES
 STATISTICS 1 REVISION NOTES Statistical Model Representing and summarising Sample Data Key words: Quantitative Data This is data in NUMERICAL FORM such as shoe size, height etc. Qualitative Data This is
SF2930: REGRESION ANALYSIS LECTURE 1 SIMPLE LINEAR REGRESSION.
 SF2930: REGRESION ANALYSIS LECTURE 1 SIMPLE LINEAR REGRESSION. Tatjana Pavlenko 17 January 2018 WHAT IS REGRESSION? INTRODUCTION Regression analysis is a statistical technique for investigating and modeling
Inference for Regression Inference about the Regression Model and Using the Regression Line
 Inference for Regression Inference about the Regression Model and Using the Regression Line PBS Chapter 10.1 and 10.2 2009 W.H. Freeman and Company Objectives (PBS Chapter 10.1 and 10.2) Inference about
CIMAT Taller de Modelos de Capture y Recaptura Known Fate Survival Analysis
 CIMAT Taller de Modelos de Capture y Recaptura 2010 Known Fate urvival Analysis B D BALANCE MODEL implest population model N = λ t+ 1 N t Deeper understanding of dynamics can be gained by identifying variation
Proportional hazards regression
 Proportional hazards regression Patrick Breheny October 8 Patrick Breheny Survival Data Analysis (BIOS 7210) 1/28 Introduction The model Solving for the MLE Inference Today we will begin discussing regression
Chapter 1: Linear Regression with One Predictor Variable also known as: Simple Linear Regression Bivariate Linear Regression
 BSTT523: Kutner et al., Chapter 1 1 Chapter 1: Linear Regression with One Predictor Variable also known as: Simple Linear Regression Bivariate Linear Regression Introduction: Functional relation between
Extensions of Cox Model for Non-Proportional Hazards Purpose
 PhUSE Annual Conference 2013 Paper SP07 Extensions of Cox Model for Non-Proportional Hazards Purpose Author: Jadwiga Borucka PAREXEL, Warsaw, Poland Brussels 13 th - 16 th October 2013 Presentation Plan
y n 1 ( x i x )( y y i n 1 i y 2
( y y i n 1 i y 2") STP3 Brief Class Notes Instructor: Ela Jackiewicz Chapter Regression and Correlation In this chapter we will explore the relationship between two quantitative variables, X an Y. We will consider n ordered
STP3 Brief Class Notes Instructor: Ela Jackiewicz Chapter Regression and Correlation In this chapter we will explore the relationship between two quantitative variables, X an Y. We will consider n ordered
regression analysis is a type of inferential statistics which tells us whether relationships between two or more variables exist
 regression analysis is a type of inferential statistics which tells us whether relationships between two or more variables exist sales $ (y - dependent variable) advertising $ (x - independent variable)
where Female = 0 for males, = 1 for females Age is measured in years (22, 23, ) GPA is measured in units on a four-point scale (0, 1.22, 3.45, etc.
 GPA is measured in units on a four-point scale (0, 1.22, 3.45, etc.") Notes on regression analysis 1. Basics in regression analysis key concepts (actual implementation is more complicated) A. Collect data B. Plot data on graph, draw a line through the middle of the scatter
Notes on regression analysis 1. Basics in regression analysis key concepts (actual implementation is more complicated) A. Collect data B. Plot data on graph, draw a line through the middle of the scatter
Linear regression and correlation
 Faculty of Health Sciences Linear regression and correlation Statistics for experimental medical researchers 2018 Julie Forman, Christian Pipper & Claus Ekstrøm Department of Biostatistics, University
Statistics 262: Intermediate Biostatistics Regression & Survival Analysis
 Statistics 262: Intermediate Biostatistics Regression & Survival Analysis Jonathan Taylor & Kristin Cobb Statistics 262: Intermediate Biostatistics p.1/?? Introduction This course is an applied course,
Lecture 10 Multiple Linear Regression
 Lecture 10 Multiple Linear Regression STAT 512 Spring 2011 Background Reading KNNL: 6.1-6.5 10-1 Topic Overview Multiple Linear Regression Model 10-2 Data for Multiple Regression Y i is the response variable
STAT 135 Lab 11 Tests for Categorical Data (Fisher s Exact test, χ 2 tests for Homogeneity and Independence) and Linear Regression
 and Linear Regression") STAT 135 Lab 11 Tests for Categorical Data (Fisher s Exact test, χ 2 tests for Homogeneity and Independence) and Linear Regression Rebecca Barter April 20, 2015 Fisher s Exact Test Fisher s Exact Test
STAT 135 Lab 11 Tests for Categorical Data (Fisher s Exact test, χ 2 tests for Homogeneity and Independence) and Linear Regression Rebecca Barter April 20, 2015 Fisher s Exact Test Fisher s Exact Test
THE ROYAL STATISTICAL SOCIETY 2008 EXAMINATIONS SOLUTIONS HIGHER CERTIFICATE (MODULAR FORMAT) MODULE 4 LINEAR MODELS
 MODULE 4 LINEAR MODELS") THE ROYAL STATISTICAL SOCIETY 008 EXAMINATIONS SOLUTIONS HIGHER CERTIFICATE (MODULAR FORMAT) MODULE 4 LINEAR MODELS The Society provides these solutions to assist candidates preparing for the examinations
THE ROYAL STATISTICAL SOCIETY 008 EXAMINATIONS SOLUTIONS HIGHER CERTIFICATE (MODULAR FORMAT) MODULE 4 LINEAR MODELS The Society provides these solutions to assist candidates preparing for the examinations
Simple Linear Regression
 Simple Linear Regression September 24, 2008 Reading HH 8, GIll 4 Simple Linear Regression p.1/20 Problem Data: Observe pairs (Y i,x i ),i = 1,...n Response or dependent variable Y Predictor or independent
Dependence and scatter-plots. MVE-495: Lecture 4 Correlation and Regression
 Dependence and scatter-plots MVE-495: Lecture 4 Correlation and Regression It is common for two or more quantitative variables to be measured on the same individuals. Then it is useful to consider what
Quantitative Analysis of Financial Markets. Summary of Part II. Key Concepts & Formulas. Christopher Ting. November 11, 2017
 Summary of Part II Key Concepts & Formulas Christopher Ting November 11, 2017 christopherting@smu.edu.sg http://www.mysmu.edu/faculty/christophert/ Christopher Ting 1 of 16 Why Regression Analysis? Understand
A discussion on multiple regression models
 A discussion on multiple regression models In our previous discussion of simple linear regression, we focused on a model in which one independent or explanatory variable X was used to predict the value
Chapter 10. Regression. Understandable Statistics Ninth Edition By Brase and Brase Prepared by Yixun Shi Bloomsburg University of Pennsylvania
 Chapter 10 Regression Understandable Statistics Ninth Edition By Brase and Brase Prepared by Yixun Shi Bloomsburg University of Pennsylvania Scatter Diagrams A graph in which pairs of points, (x, y), are
Lectures on Simple Linear Regression Stat 431, Summer 2012
 Lectures on Simple Linear Regression Stat 43, Summer 0 Hyunseung Kang July 6-8, 0 Last Updated: July 8, 0 :59PM Introduction Previously, we have been investigating various properties of the population
Correlation and Regression
 Correlation and Regression Marc H. Mehlman marcmehlman@yahoo.com University of New Haven All models are wrong. Some models are useful. George Box the statistician knows that in nature there never was a
Ch. 1: Data and Distributions
 Ch. 1: Data and Distributions Populations vs. Samples How to graphically display data Histograms, dot plots, stem plots, etc Helps to show how samples are distributed Distributions of both continuous and
Correlation & Simple Regression
 Chapter 11 Correlation & Simple Regression The previous chapter dealt with inference for two categorical variables. In this chapter, we would like to examine the relationship between two quantitative variables.
STATISTICS Relationships between variables: Correlation
 STATISTICS 16 Relationships between variables: Correlation The gentleman pictured above is Sir Francis Galton. Galton invented the statistical concept of correlation and the use of the regression line.
Statistical aspects of prediction models with high-dimensional data
 Statistical aspects of prediction models with high-dimensional data Anne Laure Boulesteix Institut für Medizinische Informationsverarbeitung, Biometrie und Epidemiologie February 15th, 2017 Typeset by