a table or a graph or an equation.
|
|
|
- Gervais Warner
- 6 years ago
- Views:
Transcription
1 Topic (8) POPULATION DISTRIBUTIONS 8-1 So far: Topic (8) POPULATION DISTRIBUTIONS We ve seen some ways to summarize a set of data, including numerical summaries. We ve heard a little about how to sample a population effectively in order to get good estimates of the population quantities of interest (e.g. taking a good sample and calculating the sample mean as a way of estimating the true but unknown population mean value) We ve talked about the ideas of probability and independence. Now we need to start putting all this together in order to do Statistical Inference, the methods of analyzing data and interpreting the results of those analyses with respect to the population(s) of interest. The Probability Distribution for a random variable can be a table or a graph or an equation.
2 Topic (8) POPULATION DISTRIBUTIONS 8-2 Let s start by reviewing the ideas of frequency distributions for populations using categorical variables. QUALITATIVE (NON-NUMERIC) VARIABLES For a random variable that takes on values of categories, the Probability distribution is a table showing the likelihood of each value. EXAMPLE Tree species found in a boreal forest. For each possible species there would a probability associated with it. E.g. suppose there are 4 species and three are very rare and one is very common. A probability table might look like: Species Probability All 1.00 We interpret these values as the probability that a random selection would result in observing that species. We could also draw a bar chart but it would be fairly noninformative in this instance since one value is so much larger than the others! An equation cannot be developed since the values that the variable takes on are non-numeric.
3 Topic (8) POPULATION DISTRIBUTIONS 8-3 QUANTITATIVE (NUMERICAL) VARIABLES A) Discrete Random Variables Recall that a discrete random variable is one that takes on values only from a set of isolated (specific) numbers. The relative frequency distribution for a discrete random variable (also sometimes called a probability mass function) is a list of probabilities for each possible value that the variable can take on. BERNOULLI DISTRIBUTION Suppose the scientist studying the tree species overlaid a grid of square quadrats over the region of interest and then recorded whether any tree was in the quadrat or not. Hence, the random variable is binary, i.e. only two outcomes presence (1) or absence (0). The Bernoulli distribution describes the probability of each outcome: Pr(X=1) = π Pr(X=0) = 1 π The mean for a Bernoulli variable is π and the variance is π(1-π).
4 Topic (8) POPULATION DISTRIBUTIONS 8-4 POISSON DISTRIBUTION Suppose the scientist studying the tree species overlaid a grid of square quadrats over the region of interest and then counted the number of hickory trees in each quadrat. The histogram of the number of trees per quadrat for all of the quadrats might look like Tree Count Quantiles Moments maximum 100.0% 99.5% 97.5% Mean Std Dev Std Error Mean quartile 90.0% 75.0% Upper 95% Mean Lower 95% Mean median quartile 50.0% 25.0% 10.0% N Sum Weights minimum 2.5% 0.5% 0.0%
5 Topic (8) POPULATION DISTRIBUTIONS 8-5 Since we have sampled the entire population (the set of counts for every quadrat in the region), this histogram represents the probability distribution of the random variable X = number of trees/quadrat. In general, the Poisson distribution is a common probability distribution for counts per unit time or unit area or unit volume. The graph can also be described using an equation known as the Poisson Distribution Probability Mass Function. It gives the probability of observing a specific count (x) in any randomly selected quadrat as Pr( X = x) = e µ µ x! x where x! = x( x 1)( x 2)...(3)(2)(1) and x = 0,1, 2,.... In order for this distribution to be a valid probability distribution, we require that the total probability for all possible values equal 1 and that every possible value have a probability associated with it. Pr( X X = 0,1,2,... = x) = X = 0,1,2,... e µ µ x! x = 1
6 Topic (8) POPULATION DISTRIBUTIONS 8-6 µ e µ and Pr( X = x) = 0 x! The mean of the Poisson distribution is µ and the variance is µ as well. DISCRETE UNIFORM DISTRIBUTION: every discrete value that the random variable can take on has the same probability of occurring. For example, suppose a researcher is interested in whether the number of setae on the first antennae of an insect is random or not. Further, the researcher believes that there must be at least 1 seta and at most 8. Then s/he is postulating that every value between 1 and 8 are equally likely to be observed in a random draw of an insect from the population (or equivalently, that there are equal numbers of insects with 1, 2,, or 8 setae in the population). Such a distribution is known as the Discrete Uniform Distribution. Let K be the total number of distinct values that the random variable can take on (e.g. the set {1, 2,, 8} contains K = 8 distinct values). Then, 1 Pr( X = x) = for x = 1, 2,, 8 K x
7 Topic (8) POPULATION DISTRIBUTIONS 8-7 In addition, the mean for this particular discrete uniform is 36 = x µ = = 4.5 K 8 and the variance is 2 ( 4.5) = x σ = K 2 Also, it is easy to see that the probabilities sum to 1 as required. Finally, the graph of the distribution looks like a rectangle:
8 Topic (8) POPULATION DISTRIBUTIONS 8-8 B) Continuous Random Variables Recall that a continuous random variable is one that can take on any value from an interval on the number line. Now, for relative frequency distributions: Fact 1: They show the frequencies of the values of the variable of interest in a set of data: Std. Dev = Mean = N = TIME where the data have been assigned to specific groupings (bins or categories). The height of each bar is proportional to the relative frequency in the data set of the group it represents. Multiplying the heights by the widths of the bars and adding all the areas gives the total area under in the bars (red). The area under any one bar divided by the total area equals Pr(an observation falls in that grouping)
9 Topic (8) POPULATION DISTRIBUTIONS 8-9 Fact 2: For a continuous variable and an extremely large population, the number of bars is very large and the heights of the bars approach a smooth curve. This curve is often referred to as a DENSITY CURVE or the probability distribution. The curve describes the shape of the distribution and also depends on the mean and standard deviation of the population under study.

10 Topic (8) POPULATION DISTRIBUTIONS 8-10 Fact 3: When the curve is describing frequency distribution of the population, every observation must fall within the limits of the distribution. Hence, 100% of the observations are listed.
11 Topic (8) POPULATION DISTRIBUTIONS 8-11 When we combine these three facts, we get that the density curve describing the frequency distribution of values of a quantitative variable 1) has a total area under the curve of 1 (analogous to 100%) and 2) the area over a range of values equals the relative frequency of that range in the population, i.e. the area equals the probability of observing a value within that range Area in between these two lines is the probability that X falls between the values of 5 and There are many standard (common) density curves:
12 Topic (8) POPULATION DISTRIBUTIONS 8-12 UNIFORM DISTRIBUTION every subset interval of the same length is equal likely. For example, suppose we randomly selected a number from the number line [0, 10]. Then the Probability distribution is given by Pr( a < X < b) = b U a L for X [ L, U] and L, U > 0. Uniform e.g. Pr(3<X<4) = The mean of a Uniform distribution is variance is U L = 2 µ and the
13 Topic (8) POPULATION DISTRIBUTIONS 8-13 NORMAL DISTRIBUTION (Bell-Curve or Gaussian Distribution) symmetric, unimodal and bell-shaped Some interesting facts about the NORMAL DISTRIBUTION: 1. mean = median = mode 2. the shape is perfectly symmetric with equal sized tails 3. the Empirical Rule has an exact form: % of the values fall within µ ± σ 95.44% of the values fall within µ ± 2σ 99.74% of the values fall within µ ± 3σ 4. the endpoints of the interval µ ± σ fall exactly at the inflection points of the curve 5. it s the most common distribution for natural phenomena that take on continuous values
14 Topic (8) POPULATION DISTRIBUTIONS 8-14 Calculating Probabilities Of Events For A Normal Distribution: EXAMPLE IQ as measured by the Stanford-Binet test has a mean of µ=100 and a standard deviation of σ= What proportion of the US adult population has an IQ above 100? i.e. find Pr(IQ>100). 2. What proportion of the population has an IQ between 85 and 115? i.e. find Pr(85<IQ<115).
15 Topic (8) POPULATION DISTRIBUTIONS 8-15 Question: What do we do when the value of interest in the probability phrase does NOT fall exactly at the standard deviation cutoffs? E.g. find Pr(IQ<110)? Answer: Convert the value to a Z-score and use it and a look up table (or a computer program) to calculate the probability. Recall the Z-SCORE for a value is the number of standard deviations that value is from the mean: * x µ Z score = z = σ e.g. IQ of 110 z * 110 µ = = = σ 15
16 Topic (8) POPULATION DISTRIBUTIONS 8-16 Defn: When X is normally distributed, the Z-score has a STANDARD NORMAL DISTRIBUTION. The Standard normal distribution is a normal distribution with a mean of µ=0 and a standard deviation of σ=1. µ 3σ µ 1σ µ+1σ µ+3σ µ 2σ µ µ+2σ Original IQ score Equivalent Z-score
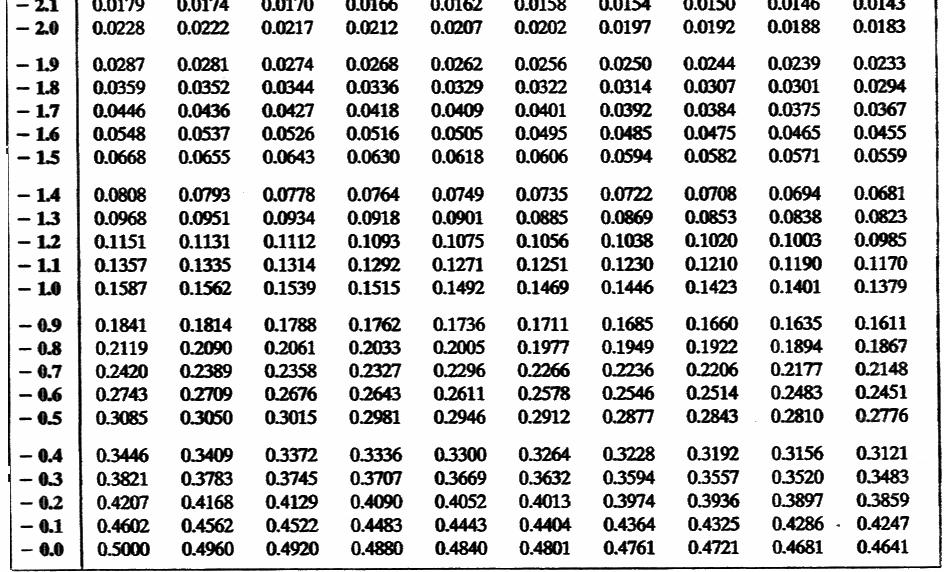
17 Topic (8) POPULATION DISTRIBUTIONS 8-17 So, the important point here is that we need to do the conversion X µ a µ Pr( X < a) = Pr < = Pr( Z < σ σ z) in order to find probabilities of events under a normal distribution e.g. IQ µ 110 µ Pr( IQ < 110) = Pr < σ σ IQ = Pr < = Pr( Z < ) Next, look up the area (i.e. Probability) on a table: Pr( Z < 0.667) = , so approximately 75% of the population has an IQ less than 110.

18 Topic (8) POPULATION DISTRIBUTIONS 8-18


19 Topic (8) POPULATION DISTRIBUTIONS 8-19
20 Topic (8) POPULATION DISTRIBUTIONS 8-20 Some practice which also uses the rules for Probability that we learned earlier: 1. Find Pr(IQ>92) 2. Find Pr(70<IQ<120).
21 Topic (8) POPULATION DISTRIBUTIONS 8-21 Finding Quantiles for the Normal Distribution Most often used to find extreme values in the very highest (or lowest) percentages EXAMPLE Suppose adult male heights are normally distributed with a mean of 69 and a standard deviation of 3.5. We have learned how to answer questions like: What proportion of the population are taller than 6 (72 )? How do we answer a question like: Find the range of likely heights for the shortest 5% of the male population, i.e. what height is the 5 th percentile of the population? Here we are being asked to find the value of a that makes the following probability statement true: We know that So we ll start by solving Pr(Height < a) = 0.05 Pr(Height < a) = Pr(Z < z * ) Pr(Z < z * )=0.05
22 Topic (8) POPULATION DISTRIBUTIONS 8-22 for z *. a Now, we ll use the fact that z * = µ and our σ knowledge of the values of µ and σ to solve for a.
Unit 4 Probability. Dr Mahmoud Alhussami
 Unit 4 Probability Dr Mahmoud Alhussami Probability Probability theory developed from the study of games of chance like dice and cards. A process like flipping a coin, rolling a die or drawing a card from
9/19/2012. PSY 511: Advanced Statistics for Psychological and Behavioral Research 1
 PSY 511: Advanced Statistics for Psychological and Behavioral Research 1 The aspect of the data we want to describe/measure is relative position z scores tell us how many standard deviations above or below
Section 3.4 Normal Distribution MDM4U Jensen
 Section 3.4 Normal Distribution MDM4U Jensen Part 1: Dice Rolling Activity a) Roll two 6- sided number cubes 18 times. Record a tally mark next to the appropriate number after each roll. After rolling
Chapter 4a Probability Models
 Chapter 4a Probability Models 4a.2 Probability models for a variable with a finite number of values 297 4a.1 Introduction Chapters 2 and 3 are concerned with data description (descriptive statistics) where
STAT 200 Chapter 1 Looking at Data - Distributions
 STAT 200 Chapter 1 Looking at Data - Distributions What is Statistics? Statistics is a science that involves the design of studies, data collection, summarizing and analyzing the data, interpreting the
STT 315 This lecture is based on Chapter 2 of the textbook.
 STT 315 This lecture is based on Chapter 2 of the textbook. Acknowledgement: Author is thankful to Dr. Ashok Sinha, Dr. Jennifer Kaplan and Dr. Parthanil Roy for allowing him to use/edit some of their
A is one of the categories into which qualitative data can be classified.
 Chapter 2 Methods for Describing Sets of Data 2.1 Describing qualitative data Recall qualitative data: non-numerical or categorical data Basic definitions: A is one of the categories into which qualitative
STP 420 INTRODUCTION TO APPLIED STATISTICS NOTES
 INTRODUCTION TO APPLIED STATISTICS NOTES PART - DATA CHAPTER LOOKING AT DATA - DISTRIBUTIONS Individuals objects described by a set of data (people, animals, things) - all the data for one individual make
Elementary Statistics
 Elementary Statistics Q: What is data? Q: What does the data look like? Q: What conclusions can we draw from the data? Q: Where is the middle of the data? Q: Why is the spread of the data important? Q:
4.2 The Normal Distribution. that is, a graph of the measurement looks like the familiar symmetrical, bell-shaped
 4.2 The Normal Distribution Many physiological and psychological measurements are normality distributed; that is, a graph of the measurement looks like the familiar symmetrical, bell-shaped distribution
Chapter 6 The Normal Distribution
 Chapter 6 The Normal PSY 395 Oswald Outline s and area The normal distribution The standard normal distribution Setting probable limits on a score/observation Measures related to 2 s and Area The idea
Learning Objectives for Stat 225
 Learning Objectives for Stat 225 08/20/12 Introduction to Probability: Get some general ideas about probability, and learn how to use sample space to compute the probability of a specific event. Set Theory:
MODULE 9 NORMAL DISTRIBUTION
 MODULE 9 NORMAL DISTRIBUTION Contents 9.1 Characteristics of a Normal Distribution........................... 62 9.2 Simple Areas Under the Curve................................. 63 9.3 Forward Calculations......................................
Ø Set of mutually exclusive categories. Ø Classify or categorize subject. Ø No meaningful order to categorization.
 Statistical Tools in Evaluation HPS 41 Dr. Joe G. Schmalfeldt Types of Scores Continuous Scores scores with a potentially infinite number of values. Discrete Scores scores limited to a specific number
Business Statistics. Lecture 10: Course Review
 Business Statistics Lecture 10: Course Review 1 Descriptive Statistics for Continuous Data Numerical Summaries Location: mean, median Spread or variability: variance, standard deviation, range, percentiles,
Essential Statistics Chapter 6
 1 Essential Statistics Chapter 6 By Navidi and Monk Copyright 2016 Mark A. Thomas. All rights reserved. 2 Continuous Probability Distributions chapter 5 focused upon discrete probability distributions,
Chapter 6 Group Activity - SOLUTIONS
 Chapter 6 Group Activity - SOLUTIONS Group Activity Summarizing a Distribution 1. The following data are the number of credit hours taken by Math 105 students during a summer term. You will be analyzing
MATH 1150 Chapter 2 Notation and Terminology
 MATH 1150 Chapter 2 Notation and Terminology Categorical Data The following is a dataset for 30 randomly selected adults in the U.S., showing the values of two categorical variables: whether or not the
BNG 495 Capstone Design. Descriptive Statistics
 BNG 495 Capstone Design Descriptive Statistics Overview The overall goal of this short course in statistics is to provide an introduction to descriptive and inferential statistical methods, with a focus
Ø Set of mutually exclusive categories. Ø Classify or categorize subject. Ø No meaningful order to categorization.
 Statistical Tools in Evaluation HPS 41 Fall 213 Dr. Joe G. Schmalfeldt Types of Scores Continuous Scores scores with a potentially infinite number of values. Discrete Scores scores limited to a specific
Review for Exam #1. Chapter 1. The Nature of Data. Definitions. Population. Sample. Quantitative data. Qualitative (attribute) data
 data") Review for Exam #1 1 Chapter 1 Population the complete collection of elements (scores, people, measurements, etc.) to be studied Sample a subcollection of elements drawn from a population 11 The Nature
Review for Exam #1 1 Chapter 1 Population the complete collection of elements (scores, people, measurements, etc.) to be studied Sample a subcollection of elements drawn from a population 11 The Nature
Descriptive Univariate Statistics and Bivariate Correlation
 ESC 100 Exploring Engineering Descriptive Univariate Statistics and Bivariate Correlation Instructor: Sudhir Khetan, Ph.D. Wednesday/Friday, October 17/19, 2012 The Central Dogma of Statistics used to
Chapter 5. Understanding and Comparing. Distributions
 STAT 141 Introduction to Statistics Chapter 5 Understanding and Comparing Distributions Bin Zou (bzou@ualberta.ca) STAT 141 University of Alberta Winter 2015 1 / 27 Boxplots How to create a boxplot? Assume
The Empirical Rule, z-scores, and the Rare Event Approach
 Overview The Empirical Rule, z-scores, and the Rare Event Approach Look at Chebyshev s Rule and the Empirical Rule Explore some applications of the Empirical Rule How to calculate and use z-scores Introducing
Chapter 3. Data Description
 Chapter 3. Data Description Graphical Methods Pie chart It is used to display the percentage of the total number of measurements falling into each of the categories of the variable by partition a circle.
Chapter 2 Solutions Page 15 of 28
 Chapter Solutions Page 15 of 8.50 a. The median is 55. The mean is about 105. b. The median is a more representative average" than the median here. Notice in the stem-and-leaf plot on p.3 of the text that
Probability and Samples. Sampling. Point Estimates
 Probability and Samples Sampling We want the results from our sample to be true for the population and not just the sample But our sample may or may not be representative of the population Sampling error
Descriptive Data Summarization
 Descriptive Data Summarization Descriptive data summarization gives the general characteristics of the data and identify the presence of noise or outliers, which is useful for successful data cleaning
1-1. Chapter 1. Sampling and Descriptive Statistics by The McGraw-Hill Companies, Inc. All rights reserved.
 1-1 Chapter 1 Sampling and Descriptive Statistics 1-2 Why Statistics? Deal with uncertainty in repeated scientific measurements Draw conclusions from data Design valid experiments and draw reliable conclusions
Chapter 4. Displaying and Summarizing. Quantitative Data
 STAT 141 Introduction to Statistics Chapter 4 Displaying and Summarizing Quantitative Data Bin Zou (bzou@ualberta.ca) STAT 141 University of Alberta Winter 2015 1 / 31 4.1 Histograms 1 We divide the range
Stat 101 Exam 1 Important Formulas and Concepts 1
 1 Chapter 1 1.1 Definitions Stat 101 Exam 1 Important Formulas and Concepts 1 1. Data Any collection of numbers, characters, images, or other items that provide information about something. 2. Categorical/Qualitative
Example 2. Given the data below, complete the chart:
 Statistics 2035 Quiz 1 Solutions Example 1. 2 64 150 150 2 128 150 2 256 150 8 8 Example 2. Given the data below, complete the chart: 52.4, 68.1, 66.5, 75.0, 60.5, 78.8, 63.5, 48.9, 81.3 n=9 The data is
Chapter 6. The Standard Deviation as a Ruler and the Normal Model 1 /67
 Chapter 6 The Standard Deviation as a Ruler and the Normal Model 1 /67 Homework Read Chpt 6 Complete Reading Notes Do P129 1, 3, 5, 7, 15, 17, 23, 27, 29, 31, 37, 39, 43 2 /67 Objective Students calculate
Lecture 10/Chapter 8 Bell-Shaped Curves & Other Shapes. From a Histogram to a Frequency Curve Standard Score Using Normal Table Empirical Rule
 Lecture 10/Chapter 8 Bell-Shaped Curves & Other Shapes From a Histogram to a Frequency Curve Standard Score Using Normal Table Empirical Rule From Histogram to Normal Curve Start: sample of female hts
(a) (i) Use StatCrunch to simulate 1000 random samples of size n = 10 from this population.
 (i) Use StatCrunch to simulate 1000 random samples of size n = 10 from this population.") Chapter 8 Sampling Distribution Ch 8.1 Distribution of Sample Mean Objective A : Shape, Center, and Spread of the Distributions of A1. Sampling Distributions of Mean A1.1 Sampling Distribution of the Sample
Chapter 8 Sampling Distribution Ch 8.1 Distribution of Sample Mean Objective A : Shape, Center, and Spread of the Distributions of A1. Sampling Distributions of Mean A1.1 Sampling Distribution of the Sample
Chapter 1. Looking at Data
 Chapter 1 Looking at Data Types of variables Looking at Data Be sure that each variable really does measure what you want it to. A poor choice of variables can lead to misleading conclusions!! For example,
Review of Statistics 101
 Review of Statistics 101 We review some important themes from the course 1. Introduction Statistics- Set of methods for collecting/analyzing data (the art and science of learning from data). Provides methods
1 Probability Distributions
 1 Probability Distributions In the chapter about descriptive statistics sample data were discussed, and tools introduced for describing the samples with numbers as well as with graphs. In this chapter
Review of the Normal Distribution
 Sampling and s Normal Distribution Aims of Sampling Basic Principles of Probability Types of Random Samples s of the Mean Standard Error of the Mean The Central Limit Theorem Review of the Normal Distribution
Tastitsticsss? What s that? Principles of Biostatistics and Informatics. Variables, outcomes. Tastitsticsss? What s that?
 Tastitsticsss? What s that? Statistics describes random mass phanomenons. Principles of Biostatistics and Informatics nd Lecture: Descriptive Statistics 3 th September Dániel VERES Data Collecting (Sampling)
SUMMARIZING MEASURED DATA. Gaia Maselli
 SUMMARIZING MEASURED DATA Gaia Maselli maselli@di.uniroma1.it Computer Network Performance 2 Overview Basic concepts Summarizing measured data Summarizing data by a single number Summarizing variability
Lecture 1: Description of Data. Readings: Sections 1.2,
 Lecture 1: Description of Data Readings: Sections 1.,.1-.3 1 Variable Example 1 a. Write two complete and grammatically correct sentences, explaining your primary reason for taking this course and then
Mean/Average Median Mode Range
 Normal Curves Today s Goals Normal curves! Before this we need a basic review of statistical terms. I mean basic as in underlying, not easy. We will learn how to retrieve statistical data from normal curves.
Math 223 Lecture Notes 3/15/04 From The Basic Practice of Statistics, bymoore
 Math 223 Lecture Notes 3/15/04 From The Basic Practice of Statistics, bymoore Chapter 3 continued Describing distributions with numbers Measuring spread of data: Quartiles Definition 1: The interquartile
Introduction to Statistics
 Introduction to Statistics Data and Statistics Data consists of information coming from observations, counts, measurements, or responses. Statistics is the science of collecting, organizing, analyzing,
Z score indicates how far a raw score deviates from the sample mean in SD units. score Mean % Lower Bound
 1 EDUR 8131 Chat 3 Notes 2 Normal Distribution and Standard Scores Questions Standard Scores: Z score Z = (X M) / SD Z = deviation score divided by standard deviation Z score indicates how far a raw score
Chapter 8 Sampling Distributions Defn Defn
 1 Chapter 8 Sampling Distributions Defn: Sampling error is the error resulting from using a sample to infer a population characteristic. Example: We want to estimate the mean amount of Pepsi-Cola in 12-oz.
CS 361: Probability & Statistics
 February 26, 2018 CS 361: Probability & Statistics Random variables The discrete uniform distribution If every value of a discrete random variable has the same probability, then its distribution is called
STAT/SOC/CSSS 221 Statistical Concepts and Methods for the Social Sciences. Random Variables
 STAT/SOC/CSSS 221 Statistical Concepts and Methods for the Social Sciences Random Variables Christopher Adolph Department of Political Science and Center for Statistics and the Social Sciences University
20 Hypothesis Testing, Part I
 20 Hypothesis Testing, Part I Bob has told Alice that the average hourly rate for a lawyer in Virginia is $200 with a standard deviation of $50, but Alice wants to test this claim. If Bob is right, she
are the objects described by a set of data. They may be people, animals or things.
 ( c ) E p s t e i n, C a r t e r a n d B o l l i n g e r 2016 C h a p t e r 5 : E x p l o r i n g D a t a : D i s t r i b u t i o n s P a g e 1 CHAPTER 5: EXPLORING DATA DISTRIBUTIONS 5.1 Creating Histograms
Index I-1. in one variable, solution set of, 474 solving by factoring, 473 cubic function definition, 394 graphs of, 394 x-intercepts on, 474
 Index A Absolute value explanation of, 40, 81 82 of slope of lines, 453 addition applications involving, 43 associative law for, 506 508, 570 commutative law for, 238, 505 509, 570 English phrases for,
IV. The Normal Distribution
 IV. The Normal Distribution The normal distribution (a.k.a., the Gaussian distribution or bell curve ) is the by far the best known random distribution. It s discovery has had such a far-reaching impact
Week 1: Intro to R and EDA
 Statistical Methods APPM 4570/5570, STAT 4000/5000 Populations and Samples 1 Week 1: Intro to R and EDA Introduction to EDA Objective: study of a characteristic (measurable quantity, random variable) for
Quantitative Methods Chapter 0: Review of Basic Concepts 0.1 Business Applications (II) 0.2 Business Applications (III)
 0.2 Business Applications (III)") Quantitative Methods Chapter 0: Review of Basic Concepts 0.1 Business Applications (II) 0.1.1 Simple Interest 0.2 Business Applications (III) 0.2.1 Expenses Involved in Buying a Car 0.2.2 Expenses Involved
Quantitative Methods Chapter 0: Review of Basic Concepts 0.1 Business Applications (II) 0.1.1 Simple Interest 0.2 Business Applications (III) 0.2.1 Expenses Involved in Buying a Car 0.2.2 Expenses Involved
Topic 3: Introduction to Statistics. Algebra 1. Collecting Data. Table of Contents. Categorical or Quantitative? What is the Study of Statistics?!
 Topic 3: Introduction to Statistics Collecting Data We collect data through observation, surveys and experiments. We can collect two different types of data: Categorical Quantitative Algebra 1 Table of
PATTERN RECOGNITION AND MACHINE LEARNING CHAPTER 2: PROBABILITY DISTRIBUTIONS
 PATTERN RECOGNITION AND MACHINE LEARNING CHAPTER 2: PROBABILITY DISTRIBUTIONS Parametric Distributions Basic building blocks: Need to determine given Representation: or? Recall Curve Fitting Binary Variables
Descriptive statistics
 Patrick Breheny February 6 Patrick Breheny to Biostatistics (171:161) 1/25 Tables and figures Human beings are not good at sifting through large streams of data; we understand data much better when it
FREQUENCY DISTRIBUTIONS AND PERCENTILES
 FREQUENCY DISTRIBUTIONS AND PERCENTILES New Statistical Notation Frequency (f): the number of times a score occurs N: sample size Simple Frequency Distributions Raw Scores The scores that we have directly
Bemidji Area Schools Outcomes in Mathematics Algebra 2 Applications. Based on Minnesota Academic Standards in Mathematics (2007) Page 1 of 7
 Page 1 of 7") 9.2.1.1 Understand the definition of a function. Use functional notation and evaluate a function at a given point in its domain. For example: If f x 1, find f(-4). x2 3 Understand the concept of function,
9.2.1.1 Understand the definition of a function. Use functional notation and evaluate a function at a given point in its domain. For example: If f x 1, find f(-4). x2 3 Understand the concept of function,
The Normal Distribution. Chapter 6
 + The Normal Distribution Chapter 6 + Applications of the Normal Distribution Section 6-2 + The Standard Normal Distribution and Practical Applications! We can convert any variable that in normally distributed
Section 5.4. Ken Ueda
 Section 5.4 Ken Ueda Students seem to think that being graded on a curve is a positive thing. I took lasers 101 at Cornell and got a 92 on the exam. The average was a 93. I ended up with a C on the test.
Lecture Slides. Elementary Statistics Twelfth Edition. by Mario F. Triola. and the Triola Statistics Series. Section 3.1- #
 Lecture Slides Elementary Statistics Twelfth Edition and the Triola Statistics Series by Mario F. Triola Chapter 3 Statistics for Describing, Exploring, and Comparing Data 3-1 Review and Preview 3-2 Measures
Describing distributions with numbers
 Describing distributions with numbers A large number or numerical methods are available for describing quantitative data sets. Most of these methods measure one of two data characteristics: The central
Marquette University MATH 1700 Class 5 Copyright 2017 by D.B. Rowe
 Class 5 Daniel B. Rowe, Ph.D. Department of Mathematics, Statistics, and Computer Science Copyright 2017 by D.B. Rowe 1 Agenda: Recap Chapter 3.2-3.3 Lecture Chapter 4.1-4.2 Review Chapter 1 3.1 (Exam
What is Statistics? Statistics is the science of understanding data and of making decisions in the face of variability and uncertainty.
 What is Statistics? Statistics is the science of understanding data and of making decisions in the face of variability and uncertainty. Statistics is a field of study concerned with the data collection,
TOPIC: Descriptive Statistics Single Variable
 TOPIC: Descriptive Statistics Single Variable I. Numerical data summary measurements A. Measures of Location. Measures of central tendency Mean; Median; Mode. Quantiles - measures of noncentral tendency
Chapter 2: Tools for Exploring Univariate Data
 Stats 11 (Fall 2004) Lecture Note Introduction to Statistical Methods for Business and Economics Instructor: Hongquan Xu Chapter 2: Tools for Exploring Univariate Data Section 2.1: Introduction What is
Units. Exploratory Data Analysis. Variables. Student Data
 Units Exploratory Data Analysis Bret Larget Departments of Botany and of Statistics University of Wisconsin Madison Statistics 371 13th September 2005 A unit is an object that can be measured, such as
F78SC2 Notes 2 RJRC. If the interest rate is 5%, we substitute x = 0.05 in the formula. This gives
 F78SC2 Notes 2 RJRC Algebra It is useful to use letters to represent numbers. We can use the rules of arithmetic to manipulate the formula and just substitute in the numbers at the end. Example: 100 invested
Continuous Probability Distributions
 1 Chapter 5 Continuous Probability Distributions 5.1 Probability density function Example 5.1.1. Revisit Example 3.1.1. 11 12 13 14 15 16 21 22 23 24 25 26 S = 31 32 33 34 35 36 41 42 43 44 45 46 (5.1.1)
CS 147: Computer Systems Performance Analysis
 CS 147: Computer Systems Performance Analysis Summarizing Variability and Determining Distributions CS 147: Computer Systems Performance Analysis Summarizing Variability and Determining Distributions 1
Sets and Set notation. Algebra 2 Unit 8 Notes
 Sets and Set notation Section 11-2 Probability Experimental Probability experimental probability of an event: Theoretical Probability number of time the event occurs P(event) = number of trials Sample
The empirical ( ) rule
 rule") The empirical (68-95-99.7) rule With a bell shaped distribution, about 68% of the data fall within a distance of 1 standard deviation from the mean. 95% fall within 2 standard deviations of the mean. 99.7%
The empirical (68-95-99.7) rule With a bell shaped distribution, about 68% of the data fall within a distance of 1 standard deviation from the mean. 95% fall within 2 standard deviations of the mean. 99.7%
IV. The Normal Distribution
 IV. The Normal Distribution The normal distribution (a.k.a., a the Gaussian distribution or bell curve ) is the by far the best known random distribution. It s discovery has had such a far-reaching impact
What is statistics? Statistics is the science of: Collecting information. Organizing and summarizing the information collected
 What is statistics? Statistics is the science of: Collecting information Organizing and summarizing the information collected Analyzing the information collected in order to draw conclusions Two types
200 participants [EUR] ( =60) 200 = 30% i.e. nearly a third of the phone bills are greater than 75 EUR
![200 participants [EUR] ( =60) 200 = 30% i.e. nearly a third of the phone bills are greater than 75 EUR](/thumbs/87/96058730.jpg "200 participants [EUR] ( =60) 200 = 30% i.e. nearly a third of the phone bills are greater than 75 EUR") Ana Jerončić 200 participants [EUR] about half (71+37=108) 200 = 54% of the bills are small, i.e. less than 30 EUR (18+28+14=60) 200 = 30% i.e. nearly a third of the phone bills are greater than 75 EUR
Ana Jerončić 200 participants [EUR] about half (71+37=108) 200 = 54% of the bills are small, i.e. less than 30 EUR (18+28+14=60) 200 = 30% i.e. nearly a third of the phone bills are greater than 75 EUR
STATISTICS/MATH /1760 SHANNON MYERS
 STATISTICS/MATH 103 11/1760 SHANNON MYERS π 100 POINTS POSSIBLE π YOUR WORK MUST SUPPORT YOUR ANSWER FOR FULL CREDIT TO BE AWARDED π YOU MAY USE A SCIENTIFIC AND/OR A TI-83/84/85/86 CALCULATOR ONCE YOU
Introduction to Basic Statistics Version 2
 Introduction to Basic Statistics Version 2 Pat Hammett, Ph.D. University of Michigan 2014 Instructor Comments: This document contains a brief overview of basic statistics and core terminology/concepts
Section 7.1 Properties of the Normal Distribution
 Section 7.1 Properties of the Normal Distribution In Chapter 6, talked about probability distributions. Coin flip problem: Difference of two spinners: The random variable x can only take on certain discrete
II. The Normal Distribution
 II. The Normal Distribution The normal distribution (a.k.a., a the Gaussian distribution or bell curve ) is the by far the best known random distribution. It s discovery has had such a far-reaching impact
Math Literacy. Curriculum (457 topics)
") Math Literacy This course covers the topics shown below. Students navigate learning paths based on their level of readiness. Institutional users may customize the scope and sequence to meet curricular
Math Literacy This course covers the topics shown below. Students navigate learning paths based on their level of readiness. Institutional users may customize the scope and sequence to meet curricular
Do students sleep the recommended 8 hours a night on average?
 BIEB100. Professor Rifkin. Notes on Section 2.2, lecture of 27 January 2014. Do students sleep the recommended 8 hours a night on average? We first set up our null and alternative hypotheses: H0: μ= 8
(a) Calculate the bee s mean final position on the hexagon, and clearly label this position on the figure below. Show all work.
 Calculate the bee s mean final position on the hexagon, and clearly label this position on the figure below. Show all work.") 1. A worker bee inspects a hexagonal honeycomb cell, starting at corner A. When done, she proceeds to an adjacent corner (always facing inward as shown), either by randomly moving along the lefthand edge
1. A worker bee inspects a hexagonal honeycomb cell, starting at corner A. When done, she proceeds to an adjacent corner (always facing inward as shown), either by randomly moving along the lefthand edge
Chapter 3. Measuring data
 Chapter 3 Measuring data 1 Measuring data versus presenting data We present data to help us draw meaning from it But pictures of data are subjective They re also not susceptible to rigorous inference Measuring
Linear Regression. In this lecture we will study a particular type of regression model: the linear regression model
 1 Linear Regression 2 Linear Regression In this lecture we will study a particular type of regression model: the linear regression model We will first consider the case of the model with one predictor
Continuous Probability Distributions
 1 Chapter 5 Continuous Probability Distributions 5.1 Probability density function Example 5.1.1. Revisit Example 3.1.1. 11 12 13 14 15 16 21 22 23 24 25 26 S = 31 32 33 34 35 36 41 42 43 44 45 46 (5.1.1)
Sampling, Frequency Distributions, and Graphs (12.1)
") 1 Sampling, Frequency Distributions, and Graphs (1.1) Design: Plan how to obtain the data. What are typical Statistical Methods? Collect the data, which is then subjected to statistical analysis, which
1 Sampling, Frequency Distributions, and Graphs (1.1) Design: Plan how to obtain the data. What are typical Statistical Methods? Collect the data, which is then subjected to statistical analysis, which
Business Statistics. Lecture 3: Random Variables and the Normal Distribution
 Business Statistics Lecture 3: Random Variables and the Normal Distribution 1 Goals for this Lecture A little bit of probability Random variables The normal distribution 2 Probability vs. Statistics Probability:
Last Lecture. Distinguish Populations from Samples. Knowing different Sampling Techniques. Distinguish Parameters from Statistics
 Last Lecture Distinguish Populations from Samples Importance of identifying a population and well chosen sample Knowing different Sampling Techniques Distinguish Parameters from Statistics Knowing different
AP Final Review II Exploring Data (20% 30%)
") AP Final Review II Exploring Data (20% 30%) Quantitative vs Categorical Variables Quantitative variables are numerical values for which arithmetic operations such as means make sense. It is usually a measure
AP Final Review II Exploring Data (20% 30%) Quantitative vs Categorical Variables Quantitative variables are numerical values for which arithmetic operations such as means make sense. It is usually a measure
In this investigation you will use the statistics skills that you learned the to display and analyze a cup of peanut M&Ms.
 M&M Madness In this investigation you will use the statistics skills that you learned the to display and analyze a cup of peanut M&Ms. Part I: Categorical Analysis: M&M Color Distribution 1. Record the
MA 1125 Lecture 15 - The Standard Normal Distribution. Friday, October 6, Objectives: Introduce the standard normal distribution and table.
 MA 1125 Lecture 15 - The Standard Normal Distribution Friday, October 6, 2017. Objectives: Introduce the standard normal distribution and table. 1. The Standard Normal Distribution We ve been looking at
The Union and Intersection for Different Configurations of Two Events Mutually Exclusive vs Independency of Events
 Section 1: Introductory Probability Basic Probability Facts Probabilities of Simple Events Overview of Set Language Venn Diagrams Probabilities of Compound Events Choices of Events The Addition Rule Combinations
Chapter 3 Probability Distributions and Statistics Section 3.1 Random Variables and Histograms
 Math 166 (c)2013 Epstein Chapter 3 Page 1 Chapter 3 Probability Distributions and Statistics Section 3.1 Random Variables and Histograms The value of the result of the probability experiment is called
Math 140 Introductory Statistics
 Math 140 Introductory Statistics Professor Silvia Fernández Chapter 2 Based on the book Statistics in Action by A. Watkins, R. Scheaffer, and G. Cobb. Visualizing Distributions Recall the definition: The
Math 140 Introductory Statistics
 Visualizing Distributions Math 140 Introductory Statistics Professor Silvia Fernández Chapter Based on the book Statistics in Action by A. Watkins, R. Scheaffer, and G. Cobb. Recall the definition: The
Lecture 1: Descriptive Statistics
 Lecture 1: Descriptive Statistics MSU-STT-351-Sum 15 (P. Vellaisamy: MSU-STT-351-Sum 15) Probability & Statistics for Engineers 1 / 56 Contents 1 Introduction 2 Branches of Statistics Descriptive Statistics
Data Analysis and Statistical Methods Statistics 651
 Data Analysis and Statistical Methods Statistics 651 http://www.stat.tamu.edu/~suhasini/teaching/ Suhasini Subba Rao Review In the previous lecture we looked at the statistics of M&Ms. This example illustrates
Probability and Statistics
 Probability and Statistics Kristel Van Steen, PhD 2 Montefiore Institute - Systems and Modeling GIGA - Bioinformatics ULg kristel.vansteen@ulg.ac.be CHAPTER 4: IT IS ALL ABOUT DATA 4a - 1 CHAPTER 4: IT