Status and future of data assimilation in operational oceanography
|
|
|
- Timothy Allan Greer
- 5 years ago
- Views:
Transcription
1 Status and future of data assimilation in operational oceanography MJ Martin, Met Office, Exeter, UK. M Balmaseda, ECMWF, Reading, UK L Bertino, NERSC, Bergen, Norway P Brasseur, LEGI, Grenoble, France G Brassington, Bureau of Meteorology, Melbourne, Australia J Cummings, NRL, Monterey, USA Y Fujii, JMA/MRI, Tsukuba, Japan DJ Lea, Met Office, Exeter, UK J-M Lellouche, Mercator Ocean, Toulouse, France K Mogensen, ECMWF, Reading, UK P Oke, CSIRO, Hobart, Australia GC Smith, Environment Canada, Montreal, Canada C-E Testut, Mercator Ocean, Toulouse, France GA Waagbø, Norwegian Meteorological Institute, Oslo, Norway J Waters, Met Office, Exeter, UK AT Weaver, CERFACS, Toulouse, France Synopsis Data assimilation systems form a core part of the ocean forecasting capability of the GODAE OceanView systems and an overview of these systems is provided. Similar sets of observations are assimilated by each system using various algorithms, including 3DVar, EnOI, EnKF and the SEEK filter with a fixed basis, and different time windows. The main outputs of the data assimilation systems, the increments, have been compared for February 2014 in various regions. The eddy-permitting systems increments are similar in a number of the regions, indicating similar forecast errors are being corrected by each of the data assimilation systems, while the eddy-resolving systems represent smaller-scale structures in the midlatitude regions investigated and appear to have smaller biases, particularly in the Gulf Stream separation region. Monthly average temperature increments show significant SST biases, particularly in the systems which assimilate swath satellite SST data, indicating systematic errors in the surface heat fluxes and the way in which they are propagated vertically by the ocean models. They also indicate that the ocean models are not fully representing a developing La Nina during the period investigated, and the assimilation acts to correct this model bias. On-going developments to the data assimilation systems include improvements to the specification of error covariance information, dealing with issues in the assimilation of data near the equator, and understanding the effect of assimilation on the Atlantic Meridional Overturning Circulation. Longer term developments are expected to include the implementation of more advanced algorithms to make use of more flowdependent error covariance information either through hybrid variational-ensemble schemes, through the use of 4DVar, or through the use of flow dependent errors in the SEEK filter. Assimilation of new data sources over the coming years, such as wide-swath altimetry, is also expected to improve the accuracy of ocean state estimates and forecasts provided by the GODAE OceanView systems. Introduction The combination of observational data with model fields through data assimilation techniques is a crucial step in the production of accurate operational ocean forecasts and reanalyses. These state estimates rely on the robust and timely delivery of observational information from in situ and remote platforms 1,2. Accurate initial estimates of the mesoscale ocean state provide the basis from which forecasts of the ocean temperature, salinity and current structure, as well as sea-ice variables, can be made using the eddy-permitting and eddyresolving GODAE OceanView modelling systems 3. The data assimilation derived state estimates provided by GODAE OceanView systems are used in a wide range of applications. Their primary uses in near-real time are the initialisation
2 of short-range ocean forecasts (out to a few days), and to initialise forecasts for longer timeranges out to a few seasons using coupled ocean-atmosphere models. The same data assimilation systems are also used to produce reanalyses covering many years for various purposes including the calibration of coupled seasonal forecasts, and for understanding how the ocean has changed over the past decades 4. Data assimilation techniques are described in detail in the literature 5,6,7 and the aim of this paper is not to describe all the various methods. Rather, we aim to give an overview of the various aspects of the data assimilation systems used in current state-of-the-art operational ocean forecasting systems. This builds on the description of the status of the GODAE data assimilation systems as of The current status of operational data assimilation systems is described in the next section, including the observations assimilated, the types of algorithms used, the estimation and modelling of the error covariances, the initialisation methods, and various other operational aspects. Following sections provide examples of the outputs of the data assimilation systems, describe some of the outstanding issues which are currently being worked on with the operational systems, and provide some indications as to the longer-term developments expected. Summary and conclusions are provided in the last section. Current operational ocean data assimilation systems Implementing data assimilative forecasting systems operationally imposes a number of constraints on the system design: the system must be robust and able to produce analysis and forecast products within a set time using the computing resources available. The focus of this paper is on the schemes which have been implemented operationally, with these operational constraints, for basin-scale and global applications. A discussion of the coastal and shelf-seas systems is given in Kerafalou et al. 9 this issue. The research done outside the operational centres is often very useful in determining future upgrades to the operational systems, and some areas of on-going and future research carried out in operational and research centres are discussed in later sections. Here we give an overview of various characteristics of existing operational data assimilation systems. Assimilated observations The observations assimilated into each of the GOV forecasting systems are detailed in Table 1. A variety of approaches is taken for use of sea surface temperature (SST) data with some systems directly assimilating swath data from GHRSST (Bluelink, GOFS and FOAM) and other systems assimilating or relaxing to objective analysis products from GHRSST. Most of the systems also assimilate in situ SST data available over the Global Telecommunications System (GTS) from ships, moored and drifting buoys. The GOFS system additionally assimilates Coastal-Marine Automated Network (C-MAN) in situ data available around the North American coast. Along-track altimeter sea level anomaly (SLA) data are obtained from Aviso/CLS by most systems (directly or through MyOcean), Bluelink obtain the data from RADS and GOFS use data processed by NAVOCAENO. Almost all the systems assimilate the Jason-2, Cryosat-2 and Altika data. In order to assimilate the SLA data, a mean dynamic topography (MDT) is required, and various approaches are taken for this. Some systems (Bluelink, GOFS and TOPAZ) use a mean sea surface height field from a free model run as their MDT. Others, such as ECMWF, uses the MDT from a previous ocean reanalyses that assimilates temperature and salinity data. This approach means that the sea surface height observations (SLA+MDT) are not biased compared to the underlying model, and the assimilation will only work to change the location of mesoscale features rather than adjusting the large-scale structure of the model dynamics. On the other hand, some systems use an observation-based MDT (CONCEPTS, FOAM, Mercator, MOVE) which means that the large-scale dynamics will be brought into line with the observations. This approach can however cause problems if the modelled and observed MDT are significantly different to each other as the assimilation will constantly adjust the model fields (including the sub-surface density structure). Some systems
3 mitigate against this by applying a bias correction approach either off-line (Mercator) or online as part of the data assimilation (FOAM). Profile temperature and salinity data are obtained either over the GTS or through an intermediate processing centre, CORIOLIS (for Mercator and CONCEPTS), with the Bluelink system accessing data through both these routes as well as from the US GODAE server, and generating a combined data-set. A similar set of platforms collecting profile temperature and salinity data are used by all the systems including Argo floats, XBTs (for temperature), moored buoys, gliders and marine mammals, with the TOPAZ system additionally assimilating ice-tethered profile data. Sea-ice concentration data from satellites are assimilated only in the CONCEPTS, GOFS, FOAM, North Pacific (NP) MOVE and TOPAZ systems, with ECMWF prescribing (rather than assimilating) the sea-ice concentration based on observations. Most of these systems assimilate data from the SSM/I and/or SSMIS satellite instruments, with the CONCEPTS system also making use of sea-ice concentration data from Canadian Ice Service (CIS) charts, Radarsat and ship reports. TOPAZ is the only system to assimilate sea-ice drift data (estimated through cross-correlations of successive satellite images) operationally. Assimilation methods A summary of the grid specifications, the algorithm and the initialisation procedure used by each system is provided in table 2. The model resolution of the systems described here varies between about 1/12 for GOFS and Mercator HR (the higher resolution Mercator system), 1/8 for TOPAZ, 1/4 for CONCEPTS, FOAM and Mercator LR (the lower resolution Mercator system), and about 1 for the ECMWF and global MOVE systems. Bluelink runs on a 1/10 grid in the Australian region, with much lower resolution elsewhere. NP MOVE also runs on a 1/10 grid in the western north Pacific region. Most of the systems use the same grid to perform the data assimilation as the model grid. However, Bluelink, CONCEPTS and Mercator use a reduced resolution analysis grid to reduce the computational cost. GOFS uses the same horizontal grid for analysis as the model, but the vertical grid used is based on depth levels rather than the hybrid vertical coordinates of the HYCOM model. A range of algorithms is used by the different operational systems including variational (3DVar) and ensemble schemes (Ensemble Optimal Interpolation, Ensemble Kalman Filter and a fixed-basis implementation of the SEEK filter). The variational schemes of GOFS 10, FOAM 11, ECMWF 12 and MOVE 13 produce global minimisations to the cost function with efficient modelling of the background error covariances. They rely on a priori specification of physical relationships to transfer information between variables, and to determine the lengthscales and variances used to weight and spread the information from the observations (described in more detail in the next section). In contrast, the ensemble schemes rely on statistical information from model runs in order to determine how observational information is spread by the assimilation. The Bluelink 14, CONCEPTS 15 and Mercator 16 ensemble systems use model data from previous long model integrations, while the TOPAZ 17 system uses an up-to-date ensemble of model runs from the current forecast cycle. Most of the systems use a first-guess-at-appropriate-time (FGAT) scheme whereby the model counterpart of the observation is calculated close to the observation time. All of the systems make updates to the full ocean state (three-dimensional temperature, salinity and velocity fields and SSH, or isopycnal layer pressure for GOFS) except for MOVE where only temperature and salinity fields are updated directly by the assimilation. For the other systems, corrections to the velocity fields are calculated using either dynamical or statistical relationships, rather than assimilating velocity data directly. The corrections (increments) produced by the data assimilation are used to initialise the forecasting systems in a number of ways. ECMWF, GOFS, FOAM, MOVE and Mercator use the Incremental Analysis Update (IAU) method 18 which adds in a fraction of the increments to the model fields at each model time-step with the aim of reducing the shock to the model. The period over which these are added in varies from 6 hours in GOFS, to one day in FOAM, out to 5-10 days for Mercator, ECMWF and MOVE. All of these systems use a constant weighting for the IAU except for Mercator 19. The Bluelink system uses an adaptive nudging scheme 20 in which the
4 model is nudged towards the analysis using a time-scale which depends on the magnitude of the increments. CONCEPTS and TOPAZ apply increments directly to the initial model state before the forecast is run. ECMWF employs a bias correction scheme to correct for model biases. It combines a correction to 3D temperature and salinity in the extra-tropics, with a correction to the pressure gradient field in the tropics 21. This latter correction is also used in the FOAM system 22, while Mercator applies a general 3D temperature and salinity slowly-evolving large-scale bias correction globally. These bias correction fields are calculated by accumulating a running average of the data assimilation increments in the ECMWF and FOAM systems, with the Mercator biases calculated using a 3DVar approach based on innovations over the preceding months. Error covariance estimation and modelling In the EnOI of Bluelink and the SEEK scheme as implemented at Mercator and CONCEPTS, a static ensemble of anomalies for three-dimensional temperature, salinity, currents and SSH is used to estimate the background error covariance matrix. A long integration of a free model is carried out and anomalies each day are calculated with respect to a running mean in order to estimate the 7-day scale error in the ocean state at a given period of the year. The anomaly calculation filters out temporal scales at low frequencies and retains the higher frequency signals (e.g. the mesoscale ocean structures) which are to be corrected by the data assimilation. A significant number of anomalies are kept from one analysis to the other, thus ensuring error covariance continuity. The covariances calculated using this technique are used to represent both the univariate and multivariate covariance relationships. The EnKF scheme as implemented in TOPAZ uses a 100-member ensemble to represent the background error covariance of the current cycle. In order to maintain ensemble spread, a perturbation system works indirectly using dynamically consistent perturbations of the atmospheric forcing fields 17. Inflation is also applied in the Deterministic EnKF by using a larger error variance of observations for updating the anomalies than for updating the mean, in order to maintain ensemble spread. All of these ensemble-based schemes require localisation of the covariance information to prevent noisy signals at larger separation distances contaminating the increments, due to the relatively small size of the ensembles. Localisation of the impact of observations in TOPAZ is applied so that observations can only affect model variables within a radius of 300km. Mercator uses a localisation technique which sets the covariances to zero beyond a distance defined as twice the local spatial correlation scales. At each assimilation cycle, an adaptive scheme calculates an optimal variance of the model error maintaining the statistical equilibrium between the innovation and the background and observation error covariances. The 3DVar schemes used at ECMWF, FOAM and GOFS parameterise the background error covariance matrix by splitting the problem into the specification of error variances (the diagonal elements), and horizontal and vertical length-scales associated with a functional representation for the correlations (the off-diagonal elements). The 3DVar scheme in MOVE parameterises it by splitting the problem into the specification of error variances, vertical correlations and horizontal length-scales. GOFS specify the background error variances based on a time history of forecast differences at each update cycle. ECMWF and FOAM use a parameterisation of the background temperature variances which depends on the vertical gradient of temperature in the background field; FOAM includes seasonally varying estimates at the surface based on output of previous assimilative runs. Using these various techniques, these systems (other than MOVE) account for flow-dependence in their background error variance specification. FOAM and GOFS use the Rossby radius to define the horizontal length scales in order to represent the scales of mesoscale phenomena, while ECMWF uses 2 length-scales with equatorial refinement so that the ocean features important for seasonal forecasting can be initialised, and MOVE splits the global domain into multiple (about 50 for global MOVE) subdomains and specifies length-scales in each one. The vertical length-scales in GOFS are
5 specified based on the vertical density gradients, and in FOAM are based on the mixed-layer depth of the background field. In ECMWF they are specified based on the vertical gridspacing of the model. The univariate component of the background error correlations is modelled using a diffusion operator in ECMWF 34 and FOAM 24 which approximates Gaussian correlation functions whereas GOFS uses a Second-Order Auto-Regressive (SOAR) function. MOVE uses the univariate part of vertical coupled temperature-salinity (T-S) Empirical Orthogonal Functions (EOFs) from historical temperature and salinity profile data 23. The multivariate components of the background errors (i.e. those transferring information from one variable to another) are specified in GOFS, ECMWF and FOAM using balance operators. In ECMWF and FOAM these transfer information from temperature to salinity using information from the model background water mass properties 25, from density to sea surface height using the dynamic height relation, and from pressure to velocity using the geostrophic relation. GOFS transfers information from temperature and salinity to geopotential using the equation of state and hydrostatic relation, and then to velocity using the geostrophic relation. MOVE transfers information between temperature and salinity through the coupled nature of the coupled T-S EOFs. All of the systems except for MOVE represent the observation error covariances as a diagonal matrix, omitting any representation of error correlations between observations. In most systems these are specified a priori as either constant or seasonally varying estimates, and most systems specify spatially varying representativity errors 26. In GOFS they are specified based on the current state using a look-up table with profile adjustments based on vertical gradients. MOVE specifies the matrix based on the historical profile data, and approximates it using the first two vertical modes. Operational aspects The delay in receiving an observation at the operational centres, compared to its measurement time (called timeliness here), depends on a number of factors including the transmission time, and the time taken to process and quality control the observation by the data producers. The timeliness of different observing systems puts constraints on the operational forecasting systems in terms of how close to real-time they can be run. SST and sea-ice data tend to be available relatively quickly (less than a day), altimeter SSH data are mostly available within two days, and profile data can take up to a few days to arrive, depending on the platform. Most of the systems therefore have two streams of analyses: one near-real time (NRT) analysis which provides up-to-date information in order to initialise forecasts; and one delayed analysis which provides less timely but more accurate information. The delayed analyses are used to initialise the next cycle of the NRT analyses so that information from late-receipt observations is still able to affect the forecasts. The precise way in which this set-up is implemented varies between the systems. FOAM and GOFS are run on a daily basis assimilating all available data. Late receipt observations are assimilated in FOAM by going back two days each day with the ocean state at T-24h being used to initialise the next day s analysis 37. GOFS assimilates late data by comparing those data to the model fields at the correct time (FGAT), and using those innovations in the current analysis. Bluelink runs each day using a time window which depends on the observation type: one day for SST; 7 days for in situ temperature and salinity; and 11 days for altimeter data. A multi-cycle ensemble is used in Bluelink whereby daily forecasts are made of four independent forecast members, each staggered by a day 27. Each forecast member is run on a different day, and an analysis is performed on that member every four days. CONCEPTS, Mercator and TOPAZ all run the full assimilation system once a week with a 7- day time-window, with an additional analysis of the previous 7-days (T-14 to T-7) to enable assimilation of late-receipt data carried out by CONCEPTS and Mercator. CONCEPTS additionally carries out a daily assimilation which includes only SST and sea-ice data, and daily forecasts are started from those analyses, while Mercator runs daily forecasts with fields updated from the last analysis by running the model with analysed surface fluxes. The
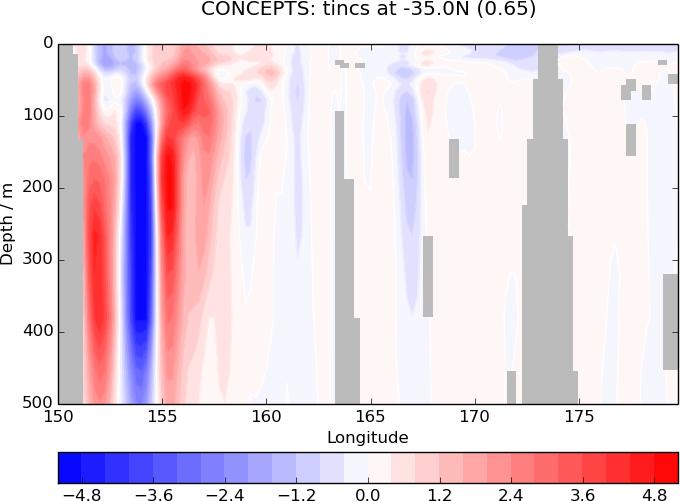
6 TOPAZ analysis is carried out with a three day delay in order to allow most data to be assimilated. ECMWF and global MOVE both use a 10-day time-window. ECMWF perform a full analysis in delayed mode every 10 days with a 6 day delay. The near-real time analyses are updated daily with a variable assimilation window starting from the last delayed mode analysis available. Global MOVE runs every 5 days and produces analyses for the previous 40 days by running four 10-day cycles for the near-real time mode, and running a ten-day cycle every 5 days for the delayed mode. The time taken to run each system is between 30 minutes for global MOVE (excluding the forecast), one hour for the CONCEPTS analysis and forecast, approximately 2 hours for FOAM and GOFS to run the analysis and forecast, and 4.7 hours for the Mercator HR analysis and forecast. Demonstration of operational data assimilation schemes In order to illustrate the outputs of the data assimilation schemes - as opposed to the forecast systems as a whole the increments from each of the operational systems described above are compared for February The increments are useful to show as they illustrate the type of structures which each analysis system produces. These depend on the background model field and the observations assimilated (which also depend on the time window and the delay in running the operational system). They also depend on the error covariance structures specified in the data assimilation algorithm, and on the data assimilation algorithm itself. As described in the previous section, the different systems run on different cycles, so it is impossible to show increments for exactly equivalent periods. For the plots in Figs 1-5 the ECMWF fields are for the 10-day cycle 14 th 23 rd Feb, the global MOVE fields for the 10-day cycle 15 th - 24 th Feb, the NP MOVE fields for the 5-day cycle th Feb, the Mercator and CONCEPTS fields are for the 7 day cycle 19 th 25 th Feb, and the Bluelink, FOAM and GOFS fields are the sum of the daily increments over the same 7 days as the Mercator/CONCEPTS fields. Due to the different periods over which the increments are valid, their magnitudes are different. A simple scaling of the fields based on the assimilation time windows is not appropriate as the growth of forecast error is not linear (accumulating 10-days of daily increments does not give the same result as running a 10-day assimilation cycle, even with the same system). In order to plot comparable fields on the same colour-scale, we have normalised the spatial root-mean-square of each field to be one (K for temperature and m/s for currents); the factor multiplying the fields in order to achieve this is shown in brackets in each plot title. This is done globally for the level and variable plotted except for the crosssection plots in which the factor is calculated based on the region plotted. Regional comparison of 5-10 day increments We focus on four regions for this inter-comparison. The Gulf Stream, East Australian Current (EAC) and Kuroshio regions are shown to illustrate how the eddy-permitting and eddyresolving data assimilation systems represent changes in these important boundary current regions. Some of the systems are also used to initialise longer-range predictions so the tropical Pacific region, an important area for initialisation of seasonal forecasts, is also shown. In each region, only those systems which resolve or permit the dominant features in that region are shown. Fig 1 shows spatial maps of the temperature increments in the EAC region. To investigate how these are related to the vertical structure of changes made by the assimilation systems, cross-sections are also shown at 35 S down to 500m depth. Despite using different models and assimilation schemes, there are some similarities in the increments produced by Mercator, Bluelink, CONCEPTS and FOAM in the region S, west of about 160 E. The magnitude of the increments is different in each system but the location and scale of the increments are similar. The positive-negative-positive temperature increments tri-pole structure moving out from the east Australian coast is reflected in almost all the systems, although Mercator HR produces a negative anomaly close to the coast. Very few in situ
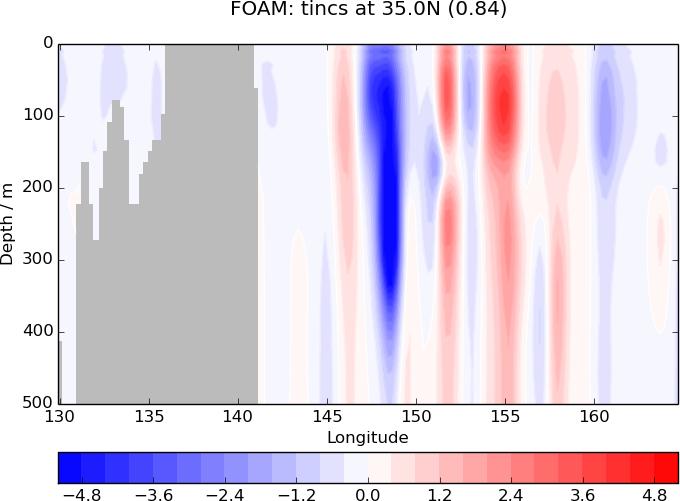
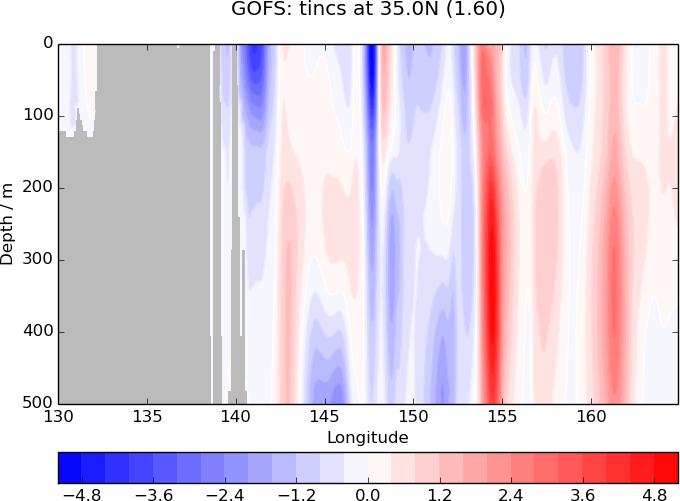
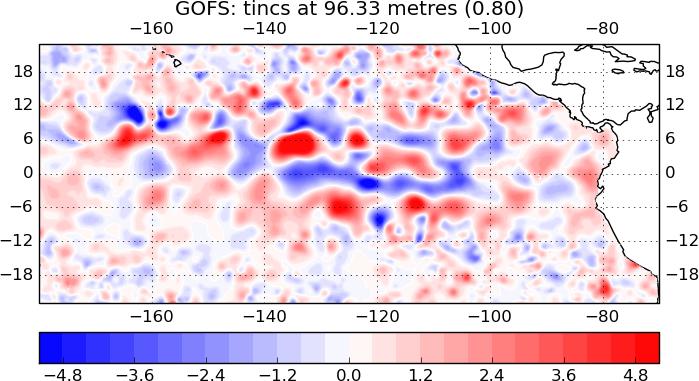
7 temperature data are in the vicinity of these features during this period, so they must be due to the projection of altimeter SLA data through the multivariate aspects of the data assimilation systems. The depth of the maximum temperature increment is different in each system, with FOAM and GOFS producing a maximum at about 100m, with Mercator, CONCEPTS and Bluelink having a broader vertical structure below the top 50m with a maximum closer to 200m depth for Mercator/CONCEPTS and 300m for Bluelink. These differences could be due to the different approaches for projecting the altimeter data into the sub-surface density field: GOFS and FOAM use flow-dependent parameterisations based on the current model background field as opposed to the static ensemble estimates used by Bluelink, Mercator and CONCEPTS. The surface velocity increments made by each system are shown in Fig 2 for the equivalent region and period as Fig 1. The horizontal scales of the velocity increments in CONCEPTS, FOAM and Mercator LR are similar although the reduced resolution analysis grid used in Mercator LR results in less smooth structures. The Bluelink and GOFS velocity increments appear to have smaller spatial scales than the other systems illustrating the difference from having a higher resolution model able to resolve (rather than permit) mesoscale features at this latitude, and the ability of the assimilation schemes to represent those scales. The FOAM velocity increments are close to zero near the coast due to a scheme that increases the observation errors for all data types near coastlines. Fig 3 shows temperature increments at about 100m depth in the Kuroshio region. The GOFS and Mercator HR systems have smaller scale features than the other systems as would be expected due to their higher resolution. The systems have fewer common features in this region than they do in the EAC region, indicating that the forecast errors during this period in this region are not the same in any of the systems. However, there is a mesoscale feature in the increments at about 154 E in the cross-section plots which all the systems except for CONCEPTS represent. In the Gulf Stream region, shown in Fig 4, the CONCEPTS, FOAM, Mercator LR and TOPAZ systems all have a dipole structure near the separation of the Gulf Stream from the eastern US coast, indicating that the assimilation is acting to correct a model bias which is introducing too much lateral mixing. GOFS and, to a lesser extent Mercator HR, appear to have less of a dipole structure in this region, with GOFS having much less bias in the lateral mixing in this region. This demonstrates the improvements which might be expected from higher resolution models, and could be due to improved representation of lateral mixing in the GOFS implementation of the HYCOM model. Fig 5 shows the temperature increments produced by each analysis system in the eastern tropical Pacific. At the Equator, where planetary waves propagate fast, it can be argued that the horizontal decorrelation scales depend more on the length of the assimilation window than on the ocean model resolution. From the horizontal plots it is clear that the longer-window and lower resolution seasonal forecasting systems of ECMWF and MOVE have much larger eastwest scales close to the equator than the other analysis systems. CONCEPTS and Mercator have length-scales which appear to reduce more quickly poleward of the equator compared to FOAM and GOFS. The cross-section plots show that each system produces the largest increments in the region of the thermocline at around 180m depth in the west of the region, and at about 20m depth in the east. The larger horizontal scales of the ECMWF and MOVE systems are again clearly visible, with the other systems increments containing more smallscale structures. The FOAM system produces increments with larger vertical extent in the western part of the domain than the other systems, probably due to the error covariance specification in that region. Global comparison of monthly average increments The global monthly averaged temperature increments have been calculated for each system and are plotted in Fig 6 for the surface and at about 100m depth. These are a useful diagnostic as they represent an estimate of forecast bias, although this is only the case in regions where observations are available to identify the bias, and observational bias can contaminate the signal.
8 FOAM and GOFS have a clear pattern at the surface with negative increments in the tropics and positive increments at mid-latitudes in the summer (southern) hemisphere. These two systems assimilate swath satellite SST data while the others relax to or assimilate objective SST analyses, which could be why the model biases are more obvious in the increments from FOAM and GOFS. The heat fluxes used in the GOFS system are adjusted to correct for atmospheric model forcing errors by adding heat across most of the tropical regions, scaled to minimise 5-day SST forecast errors. The correction results in the model being too warm at the update cycle interval (24 hours), which in turn causes the surface temperature increments to be negative on average. No such correction is carried out in the FOAM system, but the underlying heat fluxes presumably also exhibit this bias. Further investigations into these biases, relating them to heat flux differences, could be an informative follow-up to this work. Almost all the systems have a bias in the cold tongue region of the eastern tropical Pacific which is much more obvious in the monthly averages than the increments from one week shown before. This period coincides with a developing La Nina feature and it appears that the assimilation is acting to increase the magnitude of the colder SSTs. At about 100m depth a cold anomaly centred at about 130 W on the equator is being put in by the data assimilation in the ECMWF, FOAM, GOFS and Mercator systems. The western boundary current regions are clearly visible in almost all the systems, with the eddy resolving and permitting systems correcting for persistent errors in the position of mesoscale structures and the lower resolution systems correcting for larger scale forecast errors. Outstanding operational and research issues in ocean data assimilation A sample of outstanding operational and research questions which are currently being worked on by various groups are described in this section. This is not an exhaustive list due to space limitations, but is meant to illustrate some important developments. Data timeliness issues The requirement described earlier in this paper for the operational systems to be re-run in order to make use of late-receipt data is due to the lack of timeliness in particular observing systems. As an example of this issue, the timeliness of receipt for in situ profile observation types received at NRL in Monterey is shown in Fig 7 for September-November These timeliness estimates are likely to be similar for other operational centres who receive their data over the GTS. Some data types are very timely while others arrive much later. Some data types like the profiles from sensors on marine mammals have very significant data impacts 33 and so are very valuable. Anything that can be done to speed up delivery of those data would enable better use to be made of them; on-going work at SMRU to investigate the possible use of Iridium communications for the marine mammal sensors may improve the situation in the future. It can also be seen from Fig 7 that the Argo data are not as timely as some of the other in situ platforms and, given the importance of Argo for operational ocean forecasting, anything which could be done to speed up the delivery of these data would lead to more use being made of them. Sensitivity of the Atlantic Meridional Overturning Circulation to data assimilation parameters One of the challenges for the systems which are used to generate ocean reanalyses such as the ECMWF ocean analysis system, ORAS4, is related to the assimilation of observations close to the coast, in particular in regions of strong western boundary currents 35. Fig 8 shows the time evolution of the Atlantic Meridional Overturning Circulation (AMOC) at 26 N in two different assimilation experiments, where the observation error standard deviations (OESD) by the coast have been increased with a different length scale (300km and 800km). The resulting AMOC shows a large sensitivity to this single parameter specifying the OESD of the coastal observations. When the coastal OESD is inflated within 800 km of the coast (DC 800 km, red line), the AMOC is substantially stronger than when it is inflated only within 300 km of the coast (DC 300 km). The spectrum of the inter-annual variability also changes in response to this parameter. This extreme sensitivity of large-scale climate indices highlights the
9 importance of independent transport-derived estimations such as those from RAPID, which are essential to continue progress on data assimilation development. Improving assimilation near the equator Near the equator the dominant balance is between the sub-surface pressure gradient and the wind stress applied to the model. Assimilation of profile and altimeter data causes changes to the pressure gradient which results in imbalance to the unchanged wind stress. This leads to the generation of spurious equatorial waves and vertical velocities. The pressure bias correction scheme used in FOAM 22 is designed to reduce the imbalance where it is consistent over the long term. However, we still see the impact of data assimilation on the equatorial currents and vertical velocities from shorter time-scale imbalances. In the pressure bias correction scheme the correction is calculated from accumulated temperature and salinity increments and can be considered a bias correction. The application of an instantaneous pressure correction is being investigated whereby the correction is calculated from the temperature and salinity increments from the current analysis step. In Fig 9 equatorial Atlantic sections of vertical velocity anomaly fields at the end of the 24 hour IAU step are presented. The anomalies are calculated as the IAU vertical velocities minus the vertical velocities from a free run starting from the same initial conditions. In these experiments temperature, salinity, SSH and SST observations are assimilated for one day. Fig 9 shows the vertical velocity anomalies with and without the instantaneous pressure correction. The vertical velocity anomaly is significantly reduced in the case with the instantaneous pressure correction. Work is ongoing to investigate how this correction should be ramped down away from the equator and how it should be applied with cycling of the data assimilation system. Implementation of sea-ice data assimilation The assimilation of sea-ice concentration is currently carried out by CONCEPTS, TOPAZ, FOAM, GOFS and MOVE, and is now being introduced in the Mercator operational systems in order to extend the assimilation control to the sea-ice model component. As a first step and before an operational deployment in real time, this new ability is evaluated in the last release of the ¼ Mercator global ocean reanalysis simulation (GLORYS2V3, hereafter G2V3) covering the altimetric period (1992-present). In this simulation, oceanic and sea-ice analyses are performed separately. They also use the same operational tools and data assimilation schemes for the estimation of the model updates. However, sea-ice analysis assimilating only sea-ice concentration from CERSAT is restricted to a univariate correction on the sea-ice concentration. Despite its simplicity, this implementation demonstrates a clear benefit gained from a sea-ice control. Fig 10 shows results from the G2V3 reanalysis compared to a previous reanalysis (GLORYS2V1, hereafter G2V1) performed without constraint on the seaice model. G2V3 captures particularly well the two extreme summer events in 1996 and Linear de-trended correlations with the assimilated sea-ice fraction CERSAT products are and respectively for the G2V3 and G2V1 simulations. Improvement of high-frequency variability using 4DVar The Japan Meteorological Agency (JMA) plans to start operational use of a western North Pacific (WNP) four-dimensional variational (4DVar) data-assimilative model developed in the Meteorological Research Institute (MRI), as a part of a coastal monitoring and forecasting system in The grid spacing of the model is identical to the WNP part of NP MOVE: the horizontal resolution is 0.1º around Japan. This model applies a data assimilation scheme based on the 4DVar version of MOVE 29 (MOVE-4DVar). The model fields are exploited for monitoring and relatively short-term (-10 days) ocean forecasting, as well as to initialize a finer-resolution (2km) coastal model covering the area around the Seto Inland Sea 9 using IAU. The 4DVar scheme has the potential to improve reproducibility of high-frequency phenomena as demonstrated in Fig 11. Here, the assimilative model run with the MOVE- 4DVar scheme is compared with the run with the 3DVar version of MOVE (MOVE-3DVar), or the current operational scheme. The length of each assimilation period is set to 10 days in both runs. High frequency variability of the Kuroshio path is reproduced with MOVE-4DVar, which induces a substantial improvement in the sea level variation at Hachijo Island (HJ) as
10 illustrated in Fig 11a. Fig 11b indicates that reproduction of the development of the cold eddy at 138ºE causes the meandering of the Kuroshio path and the sea level rise close to the tide gauge observation at HJ in the 4DVar run. Improvements of high-frequency sea level variation appear not only in the open ocean area but also in the coastal areas, and increase the forecast accuracy 29. It also improves SSH fields in the coastal finer-resolution model initialized using the fields of the WNP assimilative model through IAU. Assessing error covariance specifications Differences between the observations and their model-estimated counterparts before and after assimilation (the innovations and analysis residuals, respectively) provide valuable information for assessing the performance of the data assimilation system. This information is also important for estimating error covariances, and for evaluating the consistency of the error covariances prescribed in the system 30. Fig 12 shows an example of a consistency check based on Desroziers diagnostics applied to the ECMWF ORAS4 reanalysis 12, 31. Shown are 40-year time series of the globally averaged observation-space representations of the specified and expected temperature background error standard deviations (BESD) in the upper 50 metres (dark and light blue curves, respectively). The specified BESD are parameterized in terms of the vertical density stratification of the background state. Discrepancies between the specified and expected BESD are an indication of sub-optimality in the error covariance specifications. Seasonal variations in the specified and expected BESD are reasonably consistent. However, there is a noticeable decreasing trend in the expected BESD that is not present in the specified BESD. This trend roughly mirrors the increasing trend in the number of observations (black curve) and reflects the fact that the background state is becoming steadily more accurate, especially in the final decade as a result of the assimilation of Argo data. This important influence of the observation network on background error is not captured by the state-dependent parameterization used in ORAS4 and suggests that improved background error estimation methods are necessary. Ensemble methods are promising in this regard as discussed in the following section. Longer term perspectives for ocean data assimilation A number of the operational groups are investigating improvements to the algorithms currently used. NRL, ECMWF and FOAM are developing the use of ensemble information within the variational framework using hybrid methods. The basic idea is to employ a perturbed model and perturbed data assimilation system to simulate the evolution of state errors in the system. The ensemble of states provides a flow-dependent estimate of analysis and forecast error, which can be used for initializing probabilistic forecasts and for estimating background error covariances on each data assimilation cycle. Due to the high cost of running high-resolution ocean models, only a small number of ensemble members will be affordable in practice. How to exploit limited ensemble information effectively and efficiently in the background error covariance formulation of variational assimilation is a particular challenge. One approach is to use the ensemble to estimate parameters, such as variances and correlation length scales, within existing error covariance models. Another approach is to use the ensemble to compute a sample estimate of the covariance matrix and to apply localization and filtering techniques to remove spurious covariances associated with sampling error. A third (hybrid) approach involves a weighted linear combination of these two covariance formulations, with the aim of improving robustness and flexibility. In order to produce the perturbations required to generate ensemble information, the deterministic forecast models can be transformed into stochastic models by including an explicit representation of model uncertainties in the discretized equations 36. These uncertainties can be simulated using random processes representing unresolved fluctuations of the state variables. A recent version of the NEMO code already includes an option for stochastic perturbations activated during the model integration. Following this idea, stochastic ensemble models will be useful to propagate the relevant information about the ocean state for both probabilistic prediction purposes and data assimilation using built-in ensemble model errors.
11 Another way to improve the specification of errors in the variational framework is to use 4DVar whereby the error covariances are implicitly evolved by the model during the assimilation time window. JMA plans to start operational use of a WNP 4DVar assimilative model in 2015, as described in the previous section. Estimation of the tidal component in the system will be introduced in 5 years. JMA also aims to introduce the 4DVar scheme in the global ocean assimilative model in the seasonal forecasting system around Mercator and CONCEPTS, who currently use a fixed-ensemble based approach, are planning to use ensemble information from the current cycle in the SEEK filter in order to make use of errors of the day. They also plan to develop schemes to improve the use of variables characterised by non-gaussian distributions, which break the assumptions of the linear analysis. It also limits the quality of the multivariate extrapolation by introducing spurious effects. To overcome this short-coming in the statistical description, local anamorphic transformations restoring the Gaussian properties are being explored. The objective is to apply these methods to non-gaussian variables such as sea-ice concentration 32. Keeping up with changes in the observing system 1,2 is essential to maintain and improve the performance of operational systems. Assimilating high-resolution observation data is essential to reproduce fine-scale variations in data assimilation systems. It is expected that wide-swath satellite altimetry data from Coastal and Ocean measurement Mission with Precise and Innovative Radar Altimeter (COMPIRA), and the Surface Water Ocean Topography (SWOT) missions, will offer effective information to better constrain the fine-scale ocean state in the GODAE OceanView systems. Assimilating sea surface salinity based on measurements from satellites (e.g. Aquarius and SMOS) may also have the potential to improve near-surface salinity fields of GODAE OceanView systems. In the near future, it is likely that new satellite missions will deliver a mix of state variable measurements at pixel level, and structure information about the flow by means of images. Wide-swath altimetry such as SWOT, or ocean colour imager missions placed on geostationary orbits will deliver such information. A key challenge for ocean and coastal prediction systems is therefore to develop image assimilation methods that will provide additional constraints on the flow at higher resolution, and produce more accurate and physically consistent fields. Summary and conclusions A description of the various operational ocean data assimilation systems contributing to GODAE OceanView has been provided. The components of the global ocean observing system available in near-real time are assimilated by all the systems with some differences in the way the data are accessed, and some differences in observation types for particular variables such as SST and sea-ice concentration. A variety of techniques are used to perform the data assimilation with different algorithms (3DVar, SEEK, EnOI, EnKF), different assimilation time-windows (from one day out to 10 days), and different procedures for applying the assimilation increments to the model. An example of the outputs of the data assimilation has been provided by showing the changes calculated by each of the assimilation systems (increments) for February This illustrates the types of structures that the assimilation systems are correcting in the models, as well as the multivariate nature of the assimilation systems and their ability to propagate information from sparse observations in space and time. In the EAC and Gulf Stream regions, a number of similar features are seen in the eddy-permitting GOV systems increments, indicating similar forecast errors are being corrected by each of the data assimilation systems. In the Kurshio region the forecast errors appear to be less systematic between the systems, although the scales of the structures are similar. The eddy resolving systems of GOFS and Mercator HR represent smaller-scale structures in the mid-latitude regions investigated and appear to have smaller biases, particularly in the Gulf Stream separation region. The ECMWF and MOVE systems, which have longer time-windows and lower resolution, have larger-scale increments everywhere.
12 Monthly average temperature increments show significant SST biases, particularly evident in GOFS and FOAM which assimilate swath satellite SST data, indicating systematic errors in the surface heat fluxes and the way in which they are propagated vertically by the ocean models. They also indicate that the ocean models are not fully representing a developing La Nina during the period investigated, and the assimilation acts to correct this model bias. The systems are continually being developed and some of the on-going developments have been described. Operational issues with observation timeliness are being addressed. Research issues currently being investigated include the assimilation of data to improve representation of the Atlantic Meridional Overturning Circulation, assessing the suitability of the error covariance specifications, and dealing with issues in the assimilation of data near the equator. Longer term developments to the systems are expected to include the implementation of more advanced algorithms (such as hybrid variational-ensemble schemes, or 4DVar schemes), improvements to the error covariance representations and assimilation of higher resolution data such as might become available from wide-swath altimetry missions. Many of these challenges are common to all the systems, which highlights the importance of a forum to discuss ideas and results, such as is provided by GODAE OceanView. References 1. Clarke C, et al Status & future of the in-situ ocean observing system. Journal of Operational Oceanography, this issue 2. Le Traon P-Y, et al Status & future of the remote sensing ocean observing system. Journal of Operational Oceanography, this issue 3. Tonani M et al Status and future of global and regional ocean prediction systems. Journal of Operational Oceanography, this issue 4. Balmaseda M et al Intercomparing ocean estimates during the last decades: new approaches & results in the framework of the joint CLIVAR/GSOP GOV effort. Journal of Operational Oceanography, this issue 5. Daley R Atmospheric data analysis. Cambridge University Press. 6. Evensen G Data Assimilation: The Ensemble Kalman Filter 2 nd Edition. Springer. 7. WMO data assimilation symposium proceedings. 8. Cummings J, Bertino L, Brasseur P, Fukumori I, Kamachi M, Martin MJ, Mogensen K, Oke P, Testut C-E, Verron J, Weaver A Ocean data assimilation systems for GODAE. Oceanography 22: Kourafalou et al Status and future of regional ocean forecasting systems. J. Operational Oceanogr., in this issue, Cummings JA, and Smedstad OM Variational Data Assimilation for the Global Ocean. S.K. Park and L. Xu (eds.), Data Assimilation for Atmospheric, Oceanic and Hydrologic Applications (Vol. II), DOI / Waters J, Martin M, While J, Lea D, Weaver A, Mirouze I Implementing a variational data assimilation system in an operational 1/4 degree global ocean model. Submitted to Quarterly.Journal of the.royal Meteorological Society. 12. Balmaseda, MA, Mogensen K, and Weaver AT Evaluation of the ECMWF ocean reanalysis system ORAS4. Quarterly.Journal of the.royal Meteorological Society, 139: doi: /qj Usui N, Ishizaki S, Fujii Y, Tsujino H, Yasuda T, and Kamachi M Meteorological Research Institute Multivariate Ocean Variational Estimation (MOVE) System: Some early results. Advances in Space Research, 37: Oke PR, Sakov P, Cahill ML, Dunn JR, Fiedler R, Griffin DA, Mansbridge JV, Ridgway KR, and Schiller A Towards a dynamically balanced eddy-resolving ocean reanalysis: BRAN3. Ocean Modelling, 67: Smith GC, Roy F, Reszka M, Surcel Colan D, He Z, Deacu D., Belanger J.-M., Skachko S., Liu Y., Dupont F, Lemieux J-F, Beaudoin C, Tranchant B, Drévillon M, Garric G, Testut C-E, Lellouche J-M, Pellerin P, Ritchie H, Lu Y, Davidson F, Buehner M, Lajoie M, and Caya A Sea ice Forecast Verification in the Canadian Global Ice Ocean Prediction System. QJRMS, submitted.
13 16. Lellouche J.-M, Le Galloudec O, Drévillon M, Régnier C, Greiner E, Garric G, Ferry N, Desportes C, Testut C.-E, Bricaud C, Bourdallé-Badie R, Tranchant B, Benkiran M, Drillet Y, Daudin A, and De Nicola C. Evaluation of global monitoring and forecasting systems at Mercator Océan. Ocean Science, 9: 57-81, doi: /os , Sakov P, Counillon F, Bertino L, Lisæter KA, Oke P, and Korablev A. TOPAZ4: an oceansea ice data assimilation system for the North Atlantic and Arctic. Ocean Science, 8: Bloom SC, Takacs LL, da Silva AM, and Ledvina D Data Assimilation Using Incremental Analysis Updates. Monthly Weather Review, 124: Benkiran M, and Greiner E Impact of the Incremental Analysis Updates on a Real- Time System of the North Atlantic Ocean. Journal of Atmospheric and Oceanic Technology, 25: Sandery PA, Brassington GB, and Freeman J Adaptive nonlinear dynamical initialization. Journal of Geophysical Research, 116: C Balmaseda MA., Dee D, Vidard A, and Anderson DLT A multivariate treatment of bias for sequential data assimilation: Application to the tropical oceans. Q.J.R. Meteorol. Soc., 133: doi: /qj Bell MJ, Martin MJ, and Nichols NK Assimilation of data into an ocean model with systematic errors near the equator. Q.J.R. Meteorol. Soc., 130: doi: /qj Fujii Y, and Kamachi M Three-dimensional analysis of temperature and salinity in the equatorial Pacific using a variational method with vertical coupled temperaturesalinity EOF modes. Journal of Geophysical Research, 108: Mirouze I, and Weaver AT Representation of correlation functions in variational assimilation using an implicit diffusion operator. Quarterly Journal of the Royal Meteorological Society, 136: Ricci, S., A. T. Weaver, J. Vialard, P. Rogel, Incorporating state-dependent temperaturesalinity constraints in the background error covariance of variational ocean data assimilation. Mon. Wea. Rev., 133, , Oke PR, and Sakov P Representation error of oceanic observations for data assimilation. Journal of Atmospheric and Oceanic Technology, 25: Brassington GB Multicycle ensemble forecasting of sea surface temperature. Geophys. Res. Lett., 40, , doi: /2013gl Tsujino H, Hirabara M, Nakano H, Yasuda T, Motoi T, and Yamanaka G Simulating present climate of the global ocean-ice system using the Meteorological Research Institute Community Ocean Model (MRI.COM): simulation characteristics and variability in the Pacific sector. J. Oceanogr., 67, , doi: /s Usui N, Fujii Y, Sakamoto K, and Kamchi M Improved representation of mesoscale and coastal variability with a four-dimensional variational assimilation system. To be submitted to Mon. Wea. Rev. 30. Desroziers G, Berre L., Chapnik B, and Poli P Diagnosis of observation, background and analysis-error statistics in observation space. Q.J.R. Meteorol. Soc., 131: doi: /qj Mogensen K, Alonso Balmaseda M, and Weaver A The NEMOVAR ocean data assimilation system as implemented in the ECMWF ocean analysis for System 4. ECMWF Tech Memo no 668, ECMWF, Reading, UK. 32. Brankart J-M, Testut C-E, Béal D, Doron M, Fontana C, Meinvielle M., Brasseur P., and Verron J Towards an improved description of ocean uncertainties: effect of local anamorphic transformations on spatial correlations. Ocean Sci., 8, , doi: /os , Oke PR, et al., Assessing the impact of observations on ocean forecasts and reanalyses : Part 2 : Regional applications. Journal of Operational Oceanography, this issue 34. Weaver A, and Courtier P Correlation modelling on the sphere using a generalized diffusion equation. Quarterly.Journal of the.royal Meteorological Society, 127, doi: /qj Stepanov V, Haines K, Smith GC Assimilation of RAPID array observations into an ocean model. Q. J. R. Meteorol. Soc. 138, DOI: /qj.1945
14 36. Brankart J-M Impact of uncertainties in the horizontal density gradient upon low resolution global ocean modeling. Ocean modelling, 66, Blockley EW, Martin MJ, McLaren AJ, Ryan AG, Waters J, Lea DJ, Mirouze I, Peterson KA, Sellar A, and Storkey D Recent development of the Met Office operational ocean forecasting system: an overview and assessment of the new Global FOAM forecasts. Geosci. Model Dev. Discuss., 6, , doi: /gmdd
15 Institute Bluelink (Australia) Bureau of Meteorology CONCEPTS (Canada) Environment Canada ECMWF FOAM (UK) GOFS (USA) Mercator MOVE (Japan) TOPAZ (Europe) (France) (Norway) ECMWF Met Office NAVOCEANO Mercator JMA/MRI MET Norway Satellite SST In situ SST Altimeter SLA data L2 GHRSST (AVHRR, WindSAT) L4 analysis (CMC) - Ships, drifting buoys, moored buoys, all from GTS Jason-2, Cryosat- 2, Altika, from RADS MDT Model mean (18- year average) In situ profiles (T and S) Sea-ice concentra tion Argo, XBT, moored buoys, consolidated from GTS, US GODAE, and Coriolis Jason-2, Cryosat- 2, Altika, from Aviso Rio and Hernandez, 2004 Argo, XBT, CTD, moored buoys, gliders, marine mammals from CORIOLIS - SSM/I, SSMIS, ASCAT, CIS charts, Radarsat, ship reports L4 analysis (OSTIA) Ships, drifting buoys, moored buoys, all from GTS Jason-2, Cryosat-2, Altika, from Aviso Model mean from a run assimilating only T/S data Argo, XBT, CTD, moored buoys, gliders, marine mammals, all from GTS SSM/I, from EUMETSAT OSI-SAF, via OSTIA product. L2 GHRSST (NOAA AVHRR, MetOp AVHRR) Ships, drifting buoys, moored buoys, all from GTS Jason-2, Cryosat-2, Altika, from MyOcean CNES-CLS09 with on-line bias correction Argo, XBT, CTD, moored buoys, gliders, marine mammals, all from GTS SSMIS, from EUMETSAT OSI-SAF L2 GHRSST (NOAA AVHRR, MetOp AVHRR, GOES-E, GOES-W, MSG, MTSAT-2, NPP- VIIRS) from NAVO Ships, drifting and moored buoys, CMAN stations, all from GTS Jason-2, Altika, Cryosat-2, from NAVO Model mean Argo, XBT, CTD, moored buoys, gliders, marine mammals, from GTS and US Navy sources SSM/I (F13, F14, F15), SSMIS (F16, F17, F18) from FNMOC L4 analysis (NOAA AVHRR) L4 analysis (COBE-SST for global, GHRSST L4 for regional). - Ships, drifting buoys, moored buoys, all from GTS Jason-2, Cryosat-2, Altika, from MyOcean CNES-CLS09, with off-line adjustments Argo, XBT, CTD, moored buoys, gliders, marine mammals from CORIOLIS Jason-2 IGDR/GDR from Aviso Monthly climatology generated using analysis system without model. Argo, XBT, CTD, moored buoys, marine mammals, all from GTS - SSMIS (F16, F17, JMA Product) for NP system L4 analysis (OSTIA) - Jason-2, Cryosat-2, Altika, from MyOcean Model mean. Argo, XBTs, moorings, icetethered profilers, all from MyOcean SSM/I, from EUMETSAT OSI-SAF
16 Sea-ice drift OSI-SAF at MET Norway Table 1: Observation types assimilated into each GODAE OceanView system
17 Configurations run operationally Analysis grid resolution Bluelink (Australia) Near-global 1/10 ; 51 z-levels. (scheduled for 2014) Australian region 1/10 ; 51 z-levels. Every second model (horizontal) grid point. CONCEPTS (Canada) Global 1/4 ; 50 z-levels Every third model (horizontal) grid point; more points within 150km of coast. Algorithm EnOI SEEK-FGAT (with fixed basis) (ocean) and 3DVar-FGAT (ice) Initialisation technique Adaptive nudging of 3D T, S, u, v over one day. Direct initialisation ECMWF (Europe) Global 1 ( 0.3 meridionally at equator); 42 z-levels Same as model grid. 3DVar-FGAT + bias correction IAU with constant weighting of SSH and 3D T,S, u,v over 10 days. FOAM (UK) Global 1/4 ; 75 z-levels N. Atlantic, Indian Ocean, Mediterranean, all 1/12 ; 50 z- levels Same as model grid. 3DVar-FGAT + bias correction IAU with constant weighting of SSH and 3D T,S, u,v over one day. Table 2: Overview of characteristics of the data assimilation used in each GODAE OceanView system GOFS (USA) Global 1/12.5 ; 32 hybrid layers 1/12.5 with 42 z-levels 3DVar-FGAT IAU with constant weighting of T, S, U, V, layer pressure (for isopycnal layers) over 6 hours. Mercator (France) Two global systems, 1/4 and 1/12 ; 50 z-levels Atlantic (20 S- 80 N) & Mediterranean 1/12 ; 50 z- levels Every fourth model (horizontal) grid point; more points within 150km of coast. SEEK-FGAT (with fixed basis); 3D- Var bias correction IAU with a non constant distribution function of SSH and 3D T, S, U, V over 7 days. MOVE (Japan) Near-Global 1 ( 0.3 meridionally at equator); 50 z-levels N. Pacific 1/2 (1/10 in Western N. Pacific), 54 z-levels. Same as model grid. 3DVar (ocean) and a simple least square method (ice) Ocean: IAU with constant weighting of 3D T, S over 10 days (Global)/ 5 days (NP). Ice: nudging TOPAZ (Norway) N. Atlantic & Arctic 1/8 ; 28 hybrid layers Same as model grid. EnKF with 100 members. Direct initialisation
 (d)")
 (h)")


18 (a) (b) (c) (d) (e) (f) (g) (h) (i) (j)
 (o) (p)")


 and (b)")


19 (k) (l) (m) (n) (o) (p) Fig 1. Normalised temperature increments in the EAC region for 19 th 25 th Feb (a) and (b) show the SLA and profile data coverage for reference. (c) (n): left column shows T


 (b) (c) (d) (e) th th Fig 2.")

20 increments at 100m depth; right column shows T increments cross section along 35S between 150E-180E for each system. (o) and (p) show the Bluelink analysis averaged over the same period. (a) (b) (c) (d) (e) th th Fig 2. Normalised velocity increments in the EAC region for Feb 2014 for the top analysis level. (a) (b)
 (f)")
 (j)")


21 (c) (d) (e) (f) (g) (h) (i) (j)


 and (b) show the SLA and")


22 (k) (l) (m) (n) Fig 3. Normalised temperature increments in the Kuroshio region for 19 th 25 th Feb 2014 (except NP MOVE which is the analysis for 20 th -24 th Feb 2014). (a) and (b) show the SLA and profile data coverage for reference. (c) (n): left column shows T increments at 100m depth; right column shows T increments cross section along 35N between 130E-165E for each system (a) (b)
 (f)")
 (j)")


23 (c) (d) (e) (f) (g) (h) (i) (j)


 and (b) show the")

 (n): left column")


24 (k) (l) (m) (n) th th Fig 4. Normalised temperature increments in the Gulf Stream region for Feb (a) and (b) show the SLA and profile data coverage for reference. (c) (n): left column shows T increments at 100m depth; right column shows T increments cross section along 38N between 78W-45W for each system. (a) (b)
 (f)")
 (j)")


25 (c) (d) (e) (f) (g) (h) (i) (j) (k) (l)


 and (b) show the SLA and profile")
 (p): left column shows T increments")

26 (m) (n) (o) (p) Fig 5. Normalised temperature increments in the Central and Eastern Equatorial Pacific region for 19 th 25 th Feb 2014 (16 th 24 th for global MOVE). (a) and (b) show the SLA and profile data coverage for reference. (c) (p): left column shows T increments at 100m depth; right column shows T increments cross section along the equator between 180E-70W for each system. (a) (b)
 (h) (i) (j)")
27 (c) (d) (e) (f) (g) (h) (i) (j)

28 (k) (l) (m) (n) Fig 6. Normalised global temperature increments, averaged for February Left column shows T increments at the top model level; right column shows T increments at 100m depth.


29 Fig 7. Receipt minus observed time for profile data types in 12-hour bins out to 5 days for Sep-Nov 2012, calculated at NRL. Fig 8. Atlantic Meriodional Overturning circulation from two sensitivity assimilation experiments conducted with the same system as that of OCEAN4, where the observation error is inflated for the observations within 800 Km (red) and 300 Km (black) of the coast.!
 a run with all data and (b) a run which uses an instantaneous pressure correction to balance the T/S increments. Fig 10.")
30 !! Fig 9. Vertical velocity differences (m/s) cross-section along the equator in the Atlantic after 22.5 hours of IAU compared to a run which assimilates no data for, (a) a run with all data and (b) a run which uses an instantaneous pressure correction to balance the T/S increments. Fig sea-ice fraction anomalies for the Arctic region for G2V3 reanalysis experiment assimilating sea-ice concentration (blue), for G2V1 reanalysis without sea-ice assimilation (black) and CERSAT satellite data (red).
 Horizontal distribution of SSH at 23 August 2001 in the model with MOVE-3DVar (left) and MOVE-4DVar (right). The position of HJ is indicated in the left panel. Fig 12.")
31 Fig 11. (a) Times series of the sea level at Hachijo Island (HJ) in the WNP assimilative model with MOVE-3DVar (blue line) and MOVE-4DVar (red line) schems and observed by the tide gauge (gray line). (b) Horizontal distribution of SSH at 23 August 2001 in the model with MOVE-3DVar (left) and MOVE-4DVar (right). The position of HJ is indicated in the left panel. Fig 12. Time series of monthly-averaged temperature background error standard deviations (BESD) in the ECMWF ORAS4 reanalysis: (1) the specified BESD in the assimilation system (dark blue curve); and (2) the expected BESD as determined using the Desroziers method 30 (light blue curve). The black curve shows the number of observations as function of time (right axis).
Status and future of data assimilation in operational oceanography
 Journal of Operational Oceanography, 2015 Vol. 8, No. S1, s28 s48, http://dx.doi.org/10.1080/1755876x.2015.1022055 Status and future of data assimilation in operational oceanography M.J. Martin a *, M.
Sea Ice Forecast Verification in the Canadian Global Ice Ocean Prediction System
 Sea Ice Forecast Verification in the Canadian Global Ice Ocean Prediction System G Smith 1, F Roy 2, M Reszka 2, D Surcel Colan, Z He 1, J-M Belanger 1, S Skachko 3, Y Liu 3, F Dupont 2, J-F Lemieux 1,
The CONCEPTS Global Ice-Ocean Prediction System Establishing an Environmental Prediction Capability in Canada
 The CONCEPTS Global Ice-Ocean Prediction System Establishing an Environmental Prediction Capability in Canada WWOSC 2014 Montreal, Quebec, Canada Dorina Surcel Colan 1, Gregory C. Smith 2, Francois Roy
Assimilation of SST data in the FOAM ocean forecasting system
 Assimilation of SST data in the FOAM ocean forecasting system Matt Martin, James While, Dan Lea, Rob King, Jennie Waters, Ana Aguiar, Chris Harris, Catherine Guiavarch Workshop on SST and Sea Ice analysis
Ocean data assimilation for reanalysis
 Ocean data assimilation for reanalysis Matt Martin. ERA-CLIM2 Symposium, University of Bern, 14 th December 2017. Contents Introduction. On-going developments to improve ocean data assimilation for reanalysis.
T2.2: Development of assimilation techniques for improved use of surface observations
 WP2 T2.2: Development of assimilation techniques for improved use of surface observations Matt Martin, Rob King, Dan Lea, James While, Charles-Emmanuel Testut November 2014, ECMWF, Reading, UK. Contents
Impact of Argo, SST, and altimeter data on an eddy-resolving ocean reanalysis
 Click Here for Full Article GEOPHYSICAL RESEARCH LETTERS, VOL. 34, L19601, doi:10.1029/2007gl031549, 2007 Impact of Argo, SST, and altimeter data on an eddy-resolving ocean reanalysis Peter R. Oke 1 and
On the relative importance of Argo, SST and altimetry for an ocean reanalysis
 Document prepared on February 20, 2007 for the Argo Steering Team Meeting (AST-8), Paris March 7-9 On the relative importance of Argo, SST and altimetry for an ocean reanalysis Peter R. Oke and Andreas
Development of a coastal monitoring and forecasting system at MRI/JMA
 COSS-TT and ARCOM Development of a coastal monitoring and forecasting system at MRI/JMA N. USUI, Y. Fujii, K, Sakamoto, H. Tsujino, T. Kuragano & Masa KAMACHI Meteorological Research Institute, Japan Sept
Update on Coupled Air-Sea-Ice Modelling
 Update on Coupled Air-Sea-Ice Modelling H. Ritchie 1,4, G. Smith 1, J.-M. Belanger 1, J-F Lemieux 1, C. Beaudoin 1, P. Pellerin 1, M. Buehner 1, A. Caya 1, L. Fillion 1, F. Roy 2, F. Dupont 2, M. Faucher
Ensemble-variational assimilation with NEMOVAR Part 2: experiments with the ECMWF system
 Ensemble-variational assimilation with NEMOVAR Part 2: experiments with the ECMWF system La Spezia, 12/10/2017 Marcin Chrust 1, Anthony Weaver 2 and Hao Zuo 1 1 ECMWF, UK 2 CERFACS, FR Marcin.chrust@ecmwf.int
O.M Smedstad 1, E.J. Metzger 2, R.A. Allard 2, R. Broome 1, D.S. Franklin 1 and A.J. Wallcraft 2. QinetiQ North America 2. Naval Research Laboratory
 An eddy-resolving ocean reanalysis using the 1/12 global HYbrid Coordinate Ocean Model (HYCOM) and the Navy Coupled Ocean Data Assimilation (NCODA) scheme O.M Smedstad 1, E.J. Metzger 2, R.A. Allard 2,
Improving the initialisation of our operational shelf-seas models
 Improving the initialisation of our operational shelf-seas models Robert King James While, Matt Martin, Dan Lean, Jennie Waters, Enda O Dea, Jenny Graham NPOP May 2018 Contents 1. Recent history developments
Assimilation of SWOT simulated observations in a regional ocean model: preliminary experiments
 Assimilation of SWOT simulated observations in a regional ocean model: preliminary experiments Benkiran M., Rémy E., Le Traon P.Y., Greiner E., Lellouche J.-M., Testut C.E., and the Mercator Ocean team.
How DBCP Data Contributes to Ocean Forecasting at the UK Met Office
 How DBCP Data Contributes to Ocean Forecasting at the UK Met Office Ed Blockley DBCP XXVI Science & Technical Workshop, 27 th September 2010 Contents This presentation covers the following areas Introduction
MERSEA IP WP 5 Integrated System Design and Assessment. Internal Metrics for the MERSEA Global Ocean: Specifications for Implementation
 MERSEA IP WP 5 Integrated System Design and Assessment Internal Metrics for the MERSEA Global Ocean: Specifications for Implementation Planning Workshop CSIRO Hobart, Australia 17-18 March 7 Participants
GODAE Ocean View Activities in JMA (and Japan)
") GOVST VIII, Nov. 6 th, 2017, Bergen, Norway GODAE Ocean View Activities in JMA (and Japan) Yosuke Fujii 1, Norihisa Usui 1, Takahiro Toyoda 1, Nariaki Hirose 1, Hiromichi Igarashi 2, and Japan GODAE group
GOVST VIII, Nov. 6 th, 2017, Bergen, Norway GODAE Ocean View Activities in JMA (and Japan) Yosuke Fujii 1, Norihisa Usui 1, Takahiro Toyoda 1, Nariaki Hirose 1, Hiromichi Igarashi 2, and Japan GODAE group
The ECMWF coupled data assimilation system
 The ECMWF coupled data assimilation system Patrick Laloyaux Acknowledgments: Magdalena Balmaseda, Kristian Mogensen, Peter Janssen, Dick Dee August 21, 214 Patrick Laloyaux (ECMWF) CERA August 21, 214
Comparison of of Assimilation Schemes for HYCOM
 Comparison of of Assimilation Schemes for HYCOM Ashwanth Srinivasan, C. Thacker, Z. Garraffo, E. P. Chassignet, O. M. Smedstad, J. Cummings, F. Counillon, L. Bertino, T. M. Chin, P. Brasseur and C. Lozano
Demonstration and Comparison of of Sequential Approaches for Altimeter Data Assimilation in in HYCOM
 Demonstration and Comparison of of Sequential Approaches for Altimeter Data Assimilation in in HYCOM A. Srinivasan, E. P. Chassignet, O. M. Smedstad, C. Thacker, L. Bertino, P. Brasseur, T. M. Chin,, F.
Ensemble-variational assimilation with NEMOVAR Part 2: experiments with the ECMWF system
 Ensemble-variational assimilation with NEMOVAR Part 2: experiments with the ECMWF system Toulouse, 20/06/2017 Marcin Chrust 1, Hao Zuo 1 and Anthony Weaver 2 1 ECMWF, UK 2 CERFACS, FR Marcin.chrust@ecmwf.int
The High Resolution Global Ocean Forecasting System in the NMEFC and its Intercomparison with the GODAE OceanView IV-TT Class 4 Metrics
 The High Resolution Global Ocean Forecasting System in the NMEFC and its Intercomparison with the GODAE OceanView IV-TT Class 4 Metrics Liying Wan (Group Leader) Yu Zhang, Huier Mo, Ziqing Zu, Yinghao
Applications of an ensemble Kalman Filter to regional ocean modeling associated with the western boundary currents variations
 Applications of an ensemble Kalman Filter to regional ocean modeling associated with the western boundary currents variations Miyazawa, Yasumasa (JAMSTEC) Collaboration with Princeton University AICS Data
OOPC-GODAE workshop on OSE/OSSEs Paris, IOCUNESCO, November 5-7, 2007
 OOPC-GODAE workshop on OSE/OSSEs Paris, IOCUNESCO, November 5-7, 2007 Design of ocean observing systems: strengths and weaknesses of approaches based on assimilative systems Pierre Brasseur CNRS / LEGI
Performance of a 23 years TOPAZ reanalysis
 Performance of a 23 years TOPAZ reanalysis L. Bertino, F. Counillon, J. Xie,, NERSC LOM meeting, Copenhagen, 2 nd -4 th June 2015 Outline Presentation of the TOPAZ4 system Choice of modeling and assimilation
Assimilation of satellite altimetry referenced to the new GRACE geoid estimate
 GEOPHYSICAL RESEARCH LETTERS, VOL. 32, L06601, doi:10.1029/2004gl021329, 2005 Assimilation of satellite altimetry referenced to the new GRACE geoid estimate F. Birol, 1 J. M. Brankart, 1 J. M. Lemoine,
Canadian contribution to the Year of Polar Prediction: deterministic and ensemble coupled atmosphere-ice-ocean forecasts
 Canadian contribution to the Year of Polar Prediction: deterministic and ensemble coupled atmosphere-ice-ocean forecasts G.C. Smith, F. Roy, J.-F. Lemieux, F. Dupont, J-M Belanger and the CONCEPTS team
STRONGLY COUPLED ENKF DATA ASSIMILATION
 STRONGLY COUPLED ENKF DATA ASSIMILATION WITH THE CFSV2 Travis Sluka Acknowledgements: Eugenia Kalnay, Steve Penny, Takemasa Miyoshi CDAW Toulouse Oct 19, 2016 Outline 1. Overview of strongly coupled DA
Ocean currents from altimetry
 Ocean currents from altimetry Pierre-Yves LE TRAON - CLS - Space Oceanography Division Gamble Workshop - Stavanger,, May 2003 Introduction Today: information mainly comes from in situ measurements ocean
Climate reanalysis and reforecast needs: An Ocean Perspective
 Climate reanalysis and reforecast needs: An Ocean Perspective Hao Zuo with M. Balmaseda, S. Tietsche, P. Browne, B. B. Sarojini, E. de Boisseson, P. de Rosnay ECMWF Hao.Zuo@ecmwf.int ECMWF January 23,
GFDL, NCEP, & SODA Upper Ocean Assimilation Systems
 GFDL, NCEP, & SODA Upper Ocean Assimilation Systems Jim Carton (UMD) With help from Gennady Chepurin, Ben Giese (TAMU), David Behringer (NCEP), Matt Harrison & Tony Rosati (GFDL) Description Goals Products
Combining ensemble and variational data assimilation
 DISTRIBUTION STATEMENT A. Approved for public release; distribution is unlimited. Combining ensemble and variational data assimilation Dr Peter R. Oke CSIRO Marine and Atmospheric Research and Wealth from
Model and observation bias correction in altimeter ocean data assimilation in FOAM
 Model and observation bias correction in altimeter ocean data assimilation in FOAM Daniel Lea 1, Keith Haines 2, Matt Martin 1 1 Met Office, Exeter, UK 2 ESSC, Reading University, UK Abstract We implement
Supplementary Figure 1 Trends of annual mean maximum ocean mixed layer depth. Trends from uninitialized simulations (a) and assimilation simulation
 and assimilation simulation") Supplementary Figure 1 Trends of annual mean maximum ocean mixed layer depth. Trends from uninitialized simulations (a) and assimilation simulation (b) from 1970-1995 (units: m yr -1 ). The dots show grids
Supplementary Figure 1 Trends of annual mean maximum ocean mixed layer depth. Trends from uninitialized simulations (a) and assimilation simulation (b) from 1970-1995 (units: m yr -1 ). The dots show grids
Ocean Forecasting for Australia & New Zealand and Mesoscale Oceanography
 Ocean Forecasting for Australia & New Zealand and Mesoscale Oceanography Andreas Schiller 1 Graham Rickard 2 Gary Brassington 3 1 Centre for Australian Weather and Climate Research; Wealth from Oceans
WP2 task 2.2 SST assimilation
 WP2 task 2.2 SST assimilation Matt Martin, Dan Lea, James While, Rob King ERA-CLIM2 General Assembly, Dec 2015. Contents Impact of SST assimilation in coupled DA SST bias correction developments Assimilation
The ECMWF prototype for coupled reanalysis. Patrick Laloyaux
 The ECMWF prototype for coupled reanalysis Patrick Laloyaux ECMWF July 10, 2015 Outline Current status and future plans for ECMWF operational reanalyses Extended climate reanalyses Coupled atmosphere-ocean
FORA-WNP30. FORA_WNP30_JAMSTEC_MRI DIAS en
 FORA-WNP30 1. TITLE Edition 1.0 Metadata Identifier 2. CONTACT FORA-WNP30 2.1 CONTACT on DATASET FORA_WNP30_JAMSTEC_MRI20160708144420-DIAS20160706142617-en Address JAMSTEC/CEIST 3173-25, Showa-machi, Kanazawa-ku,
Intercomparison of the Arctic sea ice cover in global ocean-sea ice reanalyses
 Intercomparison of the Arctic sea ice cover in global ocean-sea ice reanalyses Matthieu Chevallier (CNRM, Météo France/CNRS) Greg Smith, Frédéric Dupont, Jean-François Lemieux (ECC Canada), Gilles Garric
Feature resolution in OSTIA L4 analyses. Chongyuan Mao, Emma Fiedler, Simon Good, Jennie Waters, Matthew Martin
 Feature resolution in OSTIA L4 analyses Chongyuan Mao, Emma Fiedler, Simon Good, Jennie Waters, Matthew Martin GHRSST XVIII, Qingdao, China, 5-9 June 2017 Talk outline Introduction NEMOVAR in OSTIA Methods
Enhancing predictability of the Loop Current variability using Gulf of Mexico Hycom
 Enhancing predictability of the Loop Current variability using Gulf of Mexico Hycom Matthieu Le Hénaff (1) Villy Kourafalou (1) Ashwanth Srinivasan (1) Collaborators: O. M. Smedstad (2), P. Hogan (2),
E-AIMS. SST: synthesis of past use and design activities and plans for E-AIMS D4.432
 Research Project co-funded by the European Commission Research Directorate-General 7 th Framework Programme Project No. 312642 E-AIMS Euro-Argo Improvements for the GMES Marine Service SST: synthesis of
Preliminary Test of Glider Data Assimilation Along the Labrador Sea Shelf Break
 Preliminary Test of Glider Data Assimilation Along the Labrador Sea Shelf Break Third Annual VITALS Science Meeting October 19, 2015 Changheng Chen, K. Andrea Scott Department of Systems Design Engineering
Impact of frontal eddy dynamics on the Loop Current variability during free and data assimilative HYCOM simulations
 Impact of frontal eddy dynamics on the Loop Current variability during free and data assimilative HYCOM simulations Matthieu Le Hénaff (1) Villy H. Kourafalou (1) Ashwanth Srinivasan (1) George R. Halliwell
Ocean Reanalysis and its Application to Water Mass Analyses in the Pacific
 Ocean Reanalysis and its Application to Water Mass Analyses in the Pacific Masafumi Kamachi 1, Satoshi Matsumoto 1, Toshiya Nakano 1, Yosuke Fujii 1, Norihisa Usui 1, and Tamaki Yasuda 2 1 Oceanographic
FORA-WNP30. FORA_WNP30_JAMSTEC_MRI DIAS en
 FORA-WNP30 1. IDENTIFICATION INFORMATION Edition 1.0 Metadata Identifier 2. CONTACT FORA-WNP30 2.1 CONTACT on DATASET FORA_WNP30_JAMSTEC_MRI20170725130550-DIAS20170725102541-en Address JAMSTEC/CEIST 3173-25,
Coastal Data Assimilation: progress and challenges in state estimation for circulation and BGC models
 Coastal Data Assimilation: progress and challenges in state estimation for circulation and BGC models Emlyn Jones, Roger Scott, Mark Baird, Frank Colberg, Paul Sandery, Pavel Sakov, Gary Brassington, Mathieu
Overview of data assimilation in oceanography or how best to initialize the ocean?
 Overview of data assimilation in oceanography or how best to initialize the ocean? T. Janjic Alfred Wegener Institute for Polar and Marine Research Bremerhaven, Germany Outline Ocean observing system Ocean
Preparation of the SWOT Mission
 Preparation of the SWOT Mission M.Benkiran, E. Greiner, E. Rémy, P.Y. Le Traon and the Mercator Ocean team. Study done in the framework of a CNES/Mercator Ocean convention, in collaboration with CLS. GODAE
Evolution of the Mercator Océan system, main components for reanalysis and forecast
 Evolution of the Mercator Océan system, main components for reanalysis and forecast Y. Drillet, J.M. Lellouche, O. Le Galloudec, M. Drévillon, G. Garric, R. Bourdallé- Badie, C. Bricaud, J. Chanut, G.
Project of Strategic Interest NEXTDATA. Deliverables D1.3.B and 1.3.C. Final Report on the quality of Reconstruction/Reanalysis products
 Project of Strategic Interest NEXTDATA Deliverables D1.3.B and 1.3.C Final Report on the quality of Reconstruction/Reanalysis products WP Coordinator: Nadia Pinardi INGV, Bologna Deliverable authors Claudia
Background of Symposium/Workshop Yuhei Takaya Climate Prediction Division Japan Meteorological Agency
 Background of Symposium/Workshop Yuhei Takaya ytakaya@met.kishou.go.jp Climate Prediction Division Japan Meteorological Agency 1 Long-Range Forecast, Tokyo Japan, 8-10 December Outline Background of Dynamical
Ocean Observing System Evaluation
 Ocean Observing System Evaluation Peter R. Oke 1, Magdalena A. Balmaseda 2, Mounir Benkiran 3, James A. Cummings 4, Eric Dombrowsky 3, Yosuke Fujii 5, Stephanie Guinehut 6, Gilles Larnicol 6, Pierre-Yves
Modelling forecast error statistics in the Mercator ocean and sea-ice reanalysis system.
 Modelling forecast error statistics in the Mercator ocean and sea-ice reanalysis system. C.E Testut 1, G. Ruggiero 1, L. Parent 1, J.M. Lellouche 1, O. Legalloudec 1, C. Bricaud 1, J. Chanut 1, G. Smith
GOCINO GOCINO. Final Activity Report. GOCE in Ocean Modelling. Specific Support Action. Contract N o SSA5-CT
 GOCINO Contract N o SSA5-CT-2006-030756 GOCINO GOCE in Ocean Modelling Specific Support Action Final Activity Report Start date of project: 1 June 2007 Date of preparation: 14 March 2010 Project coordinator
OSSE OSE activities with Multivariate Ocean VariationalEstimation (MOVE)System. II:Impacts ofsalinity and TAO/TRITON.
System. II:Impacts ofsalinity and TAO/TRITON.") G ODAE/O O P O SSE O SE m eeting,nov.5 7th,2007 in IO,Paris OSSE OSE activities with Multivariate Ocean VariationalEstimation (MOVE)System. II:Impacts ofsalinity and TAO/TRITON. S.Matsumoto,Y.Fujii,T.Soga,T.Yasuda,S.Ishizaki,N.Usui,and
G ODAE/O O P O SSE O SE m eeting,nov.5 7th,2007 in IO,Paris OSSE OSE activities with Multivariate Ocean VariationalEstimation (MOVE)System. II:Impacts ofsalinity and TAO/TRITON. S.Matsumoto,Y.Fujii,T.Soga,T.Yasuda,S.Ishizaki,N.Usui,and
Strongly coupled data assimilation experiments with a full OGCM and an atmospheric boundary layer model: preliminary results
 Strongly coupled data assimilation experiments with a full OGCM and an atmospheric boundary layer model: preliminary results Andrea Storto CMCC, Bologna, Italy Coupled Data Assimilation Workshop Toulouse,
Recent Data Assimilation Activities at Environment Canada
 Recent Data Assimilation Activities at Environment Canada Major upgrade to global and regional deterministic prediction systems (now in parallel run) Sea ice data assimilation Mark Buehner Data Assimilation
Recent Development of Ocean Data Assimilation Systems and Recent Observing System Evaluation Studies in JMA/MRI
 GOV DA-TT & OSEval TT MT 2017, Oct. 13 th, 2017, La Spezia, Italy Recent Development of Ocean Data Assimilation Systems and Recent Observing System Evaluation Studies in JMA/MRI Yosue Fujii, Norihisa Usui,
North Pacific Climate Overview N. Bond (UW/JISAO), J. Overland (NOAA/PMEL) Contact: Last updated: September 2008
, J. Overland (NOAA/PMEL) Contact: Last updated: September 2008") North Pacific Climate Overview N. Bond (UW/JISAO), J. Overland (NOAA/PMEL) Contact: Nicholas.Bond@noaa.gov Last updated: September 2008 Summary. The North Pacific atmosphere-ocean system from fall 2007
North Pacific Climate Overview N. Bond (UW/JISAO), J. Overland (NOAA/PMEL) Contact: Nicholas.Bond@noaa.gov Last updated: September 2008 Summary. The North Pacific atmosphere-ocean system from fall 2007
Cold air outbreak over the Kuroshio Extension Region
 Cold air outbreak over the Kuroshio Extension Region Jensen, T. G. 1, T. Campbell 1, T. A. Smith 1, R. J. Small 2 and R. Allard 1 1 Naval Research Laboratory, 2 Jacobs Engineering NRL, Code 7320, Stennis
Ocean data assimilation systems in JMA and their representation of SST and sea ice fields
 SST-WS, Jan. 6 th, 2018, ECMWF, Reading, UK Ocean data assimilation systems in JMA and their representation of SST and sea ice fields Yosuke Fujii 1, Takahiro Toyoda 1, Norihisa Usui 1, Nariaki Hirose
GSOP Activities related to Ocean Reanalysis Intercomparison and Observing System Assessments
 GSOP-9 Panel Meeting, September 18 th, 2016, 青島, 中国 GSOP Activities related to Ocean Reanalysis Intercomparison and Observing System Assessments Yosuke Fujii JMA/MRI GSOP Member GODAE OCEAN VIEW OSEval
Developments to the assimilation of sea surface temperature
 Developments to the assimilation of sea surface temperature James While, Daniel Lea, Matthew Martin ERA-CLIM2 General Assembly, January 2017 Contents Introduction Improvements to SST bias correction Development
Early Successes El Nino Southern Oscillation and seasonal forecasting. David Anderson, With thanks to Magdalena Balmaseda, Tim Stockdale.
 Early Successes El Nino Southern Oscillation and seasonal forecasting David Anderson, With thanks to Magdalena Balmaseda, Tim Stockdale. Summary Pre TOGA, the 1982/3 El Nino was not well predicted. In
Operational systems for SST products. Prof. Chris Merchant University of Reading UK
 Operational systems for SST products Prof. Chris Merchant University of Reading UK Classic Images from ATSR The Gulf Stream ATSR-2 Image, ƛ = 3.7µm Review the steps to get SST using a physical retrieval
John Kindle. Sergio derada Igor Shulman Ole Martin Smedstad Stephanie Anderson. Data Assimilation in Coastal Modeing April
 John Kindle Sergio derada Igor Shulman Ole Martin Smedstad Stephanie Anderson Data Assimilation in Coastal Modeing April 3 2007 MODELS Motivation: Global->Coastal Real-Time Regional Coastal Models Global
PS4a: Real-time modelling platforms during SOP/EOP
 PS4a: Real-time modelling platforms during SOP/EOP Mistral Tramontane Bora Etesian Major sites of dense water formation Major sites of deep water formation influence of coastal waters Chairs: G. Boni,
Data assimilation for ocean climate studies
 Data assimilation for ocean climate studies James Carton, Gennady Chepurin, Steven Penny, and David Behringer (thanks Eugenia) University of Maryland, NOAA/NCEP, College Park, MD USA Chl concentration
Biogeochemical modelling and data assimilation: status in Australia
 Biogeochemical modelling and data assimilation: status in Australia Richard Matear, Andrew Lenton, Matt Chamberlain, Mathieu Mongin, Emlyn Jones, Mark Baird www.cmar.csiro.au/staff/oke/ Biogeochemical
GODAE Status. OSEs/OSSEs meeting objectives. P.Y. le Traon, A. Fischer, E. Harrison, K. Wilmer Becker
 GODAE Status OSEs/OSSEs meeting objectives P.Y. le Traon, A. Fischer, E. Harrison, K. Wilmer Becker Content 3. GODAE Status Achievements and successes Priorities GODAE in 2007/2008 5. Objectives of the
Initial Results of Altimetry Assimilation in POP2 Ocean Model
 Initial Results of Altimetry Assimilation in POP2 Ocean Model Svetlana Karol and Alicia R. Karspeck With thanks to the DART Group, CESM Software Development Group, Climate Modeling Development Group POP-DART
Atmosphere drives recent interannual variability of the Atlantic meridional overturning circulation at 26.5 N
 Atmosphere drives recent interannual variability of the Atlantic meridional overturning circulation at 26.5 N Article Supplemental Material Roberts, C. D., Waters, J., Peterson, K. A., Palmer, M., McCarthy,
Validation of sea ice concentration in the myocean Arctic Monitoring and Forecasting Centre 1
 Note No. 12/2010 oceanography, remote sensing Oslo, August 9, 2010 Validation of sea ice concentration in the myocean Arctic Monitoring and Forecasting Centre 1 Arne Melsom 1 This document contains hyperlinks
The Canadian approach to ensemble prediction
 The Canadian approach to ensemble prediction ECMWF 2017 Annual seminar: Ensemble prediction : past, present and future. Pieter Houtekamer Montreal, Canada Overview. The Canadian approach. What are the
MERSEA Marine Environment and Security for the European Area
 MERSEA Marine Environment and Security for the European Area Development of a European system for operational monitoring and forecasting of the ocean physics, biogeochemistry, and ecosystems, on global
South Asian Climate Outlook Forum (SASCOF-6)
") Sixth Session of South Asian Climate Outlook Forum (SASCOF-6) Dhaka, Bangladesh, 19-22 April 2015 Consensus Statement Summary Below normal rainfall is most likely during the 2015 southwest monsoon season
Sixth Session of South Asian Climate Outlook Forum (SASCOF-6) Dhaka, Bangladesh, 19-22 April 2015 Consensus Statement Summary Below normal rainfall is most likely during the 2015 southwest monsoon season
GODAE. Oceanography Vol. 22, No.3. Global HYCOM sea surface height (cm) valid March 26, 2009, 00Z
 valid March 26, 2009, 00Z") GODAE Special Issue Feature 96 Ocean Data Assimilation Systems for GODAE By James Cummings, Laurent Bertino, Pierre Brasseur, Ichiro Fukumori, Masafumi Kamachi, Matthew J. Martin, Kristian Mogensen, Peter
GODAE Special Issue Feature 96 Ocean Data Assimilation Systems for GODAE By James Cummings, Laurent Bertino, Pierre Brasseur, Ichiro Fukumori, Masafumi Kamachi, Matthew J. Martin, Kristian Mogensen, Peter
Coupled data assimilation for climate reanalysis
 Coupled data assimilation for climate reanalysis Dick Dee Climate reanalysis Coupled data assimilation CERA: Incremental 4D-Var ECMWF June 26, 2015 Tools from numerical weather prediction Weather prediction
Ocean Data Assimilation: a case for ensemble optimal interpolation
 Ocean Data Assimilation: a case for ensemble optimal interpolation Peter R. Oke 1,2, Gary B. Brassington 1,3, David A. Griffin 1,2, Andreas Schiller 1,2 1 Centre for Australian Weather and Climate Research
ECMWF: Weather and Climate Dynamical Forecasts
 ECMWF: Weather and Climate Dynamical Forecasts Medium-Range (0-day) Partial coupling Extended + Monthly Fully coupled Seasonal Forecasts Fully coupled Atmospheric model Atmospheric model Wave model Wave
Ensemble data assimilation for an eddy-resolving ocean model of the Australian region
 Q. J. R. Meteorol. Soc. (25), 131, pp. 331 3311 doi: 1.1256/qj.5.95 Ensemble data assimilation for an eddy-resolving ocean model of the Australian region By P. R. OKE 1, A. SCHILLER 1, D. A. GRIFFIN 1
An Introduction to Coupled Models of the Atmosphere Ocean System
 An Introduction to Coupled Models of the Atmosphere Ocean System Jonathon S. Wright jswright@tsinghua.edu.cn Atmosphere Ocean Coupling 1. Important to climate on a wide range of time scales Diurnal to
OCEAN WAVE FORECASTING AT E.C.M.W.F.
 OCEAN WAVE FORECASTING AT E.C.M.W.F. Jean-Raymond Bidlot Marine Prediction Section Predictability Division of the Research Department European Centre for Medium-range Weather Forecasts Slide 1 Ocean waves:
Alexander Barth, Aida Alvera-Azc. Azcárate, Robert H. Weisberg, University of South Florida. George Halliwell RSMAS, University of Miami
 Ensemble-based based Assimilation of HF-Radar Surface Currents in a West Florida Shelf ROMS Nested into HYCOM and filtering of spurious surface gravity waves. Alexander Barth, Aida Alvera-Azc Azcárate,
Dynamics of Atmospheres and Oceans
 Dynamics of Atmospheres and Oceans 48 (2009) 121 142 Contents lists available at ScienceDirect Dynamics of Atmospheres and Oceans journal homepage: www.elsevier.com/locate/dynatmoce A comparison of shelf
Relative Merits of 4D-Var and Ensemble Kalman Filter
 Relative Merits of 4D-Var and Ensemble Kalman Filter Andrew Lorenc Met Office, Exeter International summer school on Atmospheric and Oceanic Sciences (ISSAOS) "Atmospheric Data Assimilation". August 29
Overview of the NRL Coupled Ocean Data Assimilation System
 Overview of the NRL Coupled Ocean Data Assimilation System James Cummings and Rich Hodur Naval Research Laboratory, Monterey, CA HYCOM Ocean Model Workshop NCEP August 2003 Report Documentation Page Form
ERA-CLIM2 WP2. ERA-CLIM2 review, April 2016.
 ERA-CLIM2 WP2 M. Martin, A. Albert, X. Feng, M. Gehlen, K. Haines, R. King, P. Laloyaux, D. Lea, B. Lemieux-Dudon, I. Mirouze, D. Mulholland, P. Peylin, A. Storto, C.-E. Testut, A. Vidard, N. Vuichard,
The Bureau of Meteorology Coupled Data Assimilation System for ACCESS-S
 The Bureau of Meteorology Coupled Data Assimilation System for ACCESS-S Yonghong Yin, Angus Gray-Weale, Oscar Alves, Pavel Sakov, Debra Hudson, Xiaobing Zhou, Hailing Yan, Mei Zhao Research and Development
Introduction to Data Assimilation. Saroja Polavarapu Meteorological Service of Canada University of Toronto
 Introduction to Data Assimilation Saroja Polavarapu Meteorological Service of Canada University of Toronto GCC Summer School, Banff. May 22-28, 2004 Outline of lectures General idea Numerical weather prediction
E-AIMS. Global ocean analysis and forecasting: OSE/OSSEs results and recommandations
 Research Project co-funded by the European Commission Research Directorate-General 7 th Framework Programme Project No. 284391 E-AIMS Euro-Argo Improvements for the GMES Marine Service Global ocean analysis
South Asian Climate Outlook Forum (SASCOF-12)
") Twelfth Session of South Asian Climate Outlook Forum (SASCOF-12) Pune, India, 19-20 April 2018 Consensus Statement Summary Normal rainfall is most likely during the 2018 southwest monsoon season (June
Twelfth Session of South Asian Climate Outlook Forum (SASCOF-12) Pune, India, 19-20 April 2018 Consensus Statement Summary Normal rainfall is most likely during the 2018 southwest monsoon season (June
Developing Coastal Ocean Forecasting Systems and Their Applications
 Developing Coastal Ocean Forecasting Systems and Their Applications Xiaochun Wang a,b LASG/IAP, CAS, July 23, 2010 Contributions from: JPL Yi Chao, John Farrara, Peggy Li, Zhijin Li, Quoc Vu, Hongchun
Implementation of the SEEK filter in HYCOM
 Implementation of the SEEK filter in HYCOM P. Brasseur, J. Verron, J.M. Brankart LEGI/CNRS, Grenoble, France HYCOM model SST, SSH, ocean colour Assimilation SEEK filter Y H x f In situ, XBT K x a Real-time
EVALUATION OF THE GLOBAL OCEAN DATA ASSIMILATION SYSTEM AT NCEP: THE PACIFIC OCEAN
 2.3 Eighth Symposium on Integrated Observing and Assimilation Systems for Atmosphere, Oceans, and Land Surface, AMS 84th Annual Meeting, Washington State Convention and Trade Center, Seattle, Washington,
The TOPAZ3 forecasting system. L. Bertino, K.A. Lisæter, Mohn-Sverdrup Center/NERSC
 The TOPAZ3 forecasting system L. Bertino, K.A. Lisæter, Mohn-Sverdrup Center/NERSC LOM meeting, Bergen Beach, 20 th Aug. 2007 Introduction Main objective of data assimilation Estimate the most likely
EO Information Services in support of West Africa Coastal vulnerability Service 2 : Sea Level Height & currents. Vinca Rosmorduc, CLS
 EO Information Services in support of West Africa Coastal vulnerability Service 2 : Sea Level Height & currents Vinca Rosmorduc, CLS World Bank HQ, Washington DC Date : 23 February 2012 West Africa coastal
CONCEPTS Regional Ocean Forecast System Development
 CONCEPTS Regional Ocean Forecast System Development Fraser Davidson DFO, NAFC G. Smith, Y. Lu, D. Dumont, B. Tremblay, J-F Lemieux, H. Ritchie, F Roy,Y Liu, F Dupont,, C Beaudoin, Mathieu Chevalier, G
Eddy-resolving Simulation of the World Ocean Circulation by using MOM3-based OGCM Code (OFES) Optimized for the Earth Simulator
 Optimized for the Earth Simulator") Chapter 1 Atmospheric and Oceanic Simulation Eddy-resolving Simulation of the World Ocean Circulation by using MOM3-based OGCM Code (OFES) Optimized for the Earth Simulator Group Representative Hideharu
Chapter 1 Atmospheric and Oceanic Simulation Eddy-resolving Simulation of the World Ocean Circulation by using MOM3-based OGCM Code (OFES) Optimized for the Earth Simulator Group Representative Hideharu