STEP 8 - WEATHER MAPS, FORECASTS, CATALOG SHEETS
|
|
|
- Lawrence Watts
- 5 years ago
- Views:
Transcription
1 STEP 8 - WEATHER MAPS, FORECASTS, CATALOG SHEETS SailMail and WL2K users have two paths for retrieving weather information: copying synoptic weather maps, satellite pictures and printed information directly off the air via scheduled WEFAX broadcasts, or retrieving WEFAX from the Internet, WEFAX technology developed before WWII, is based upon the then state-of-the-art vacuum tube/photocell/ rotating-drum technology at the time. Still in use today, WEFAX is a relatively slow analog technology, susceptible to interference, noise. and signal fading. On the other hand it is relatively inexpensive to add WEFAX capability to an existing HF radio system. All that's required is a modest computer and some low-cost software. 8.1 Catalog Sheets What are they? The easiest way to download WEFAX documents through the SailMail and WL2K networks is by using Catalog Sheets. Catalog Sheets are listings of weather and Sailmail/WL2K related documents that can be fetched and downloaded to your PC as an . Weather forecasts downloaded using catalog sheets are identical to the forecast documents copied off-the-air using your HF radio. Speed and quality are the two main benefits for requesting WEFAX documents using Catalog Sheets as opposed to receiving them via WEFAX broadcasts. Downloading WEFAX documents is ten to twenty times faster than copying the same WEFAX off-the-air. Downloaded documents are retrieved digitally; therefore, they are an exact replica of the original. They do not suffer the image degradation from noise and signal fading typical of documents received via WEFAX broadcasts How to Request a Weather Document Access to the list of Catalog Sheets is through the Toolbar in the Message Index Screen. Click on WINDOW. CATALOGS, and then click on the + sign in front of Catalogs and the Saildocs Folder in Figure 4-1 above to open the document list in Figure 4-2 below.

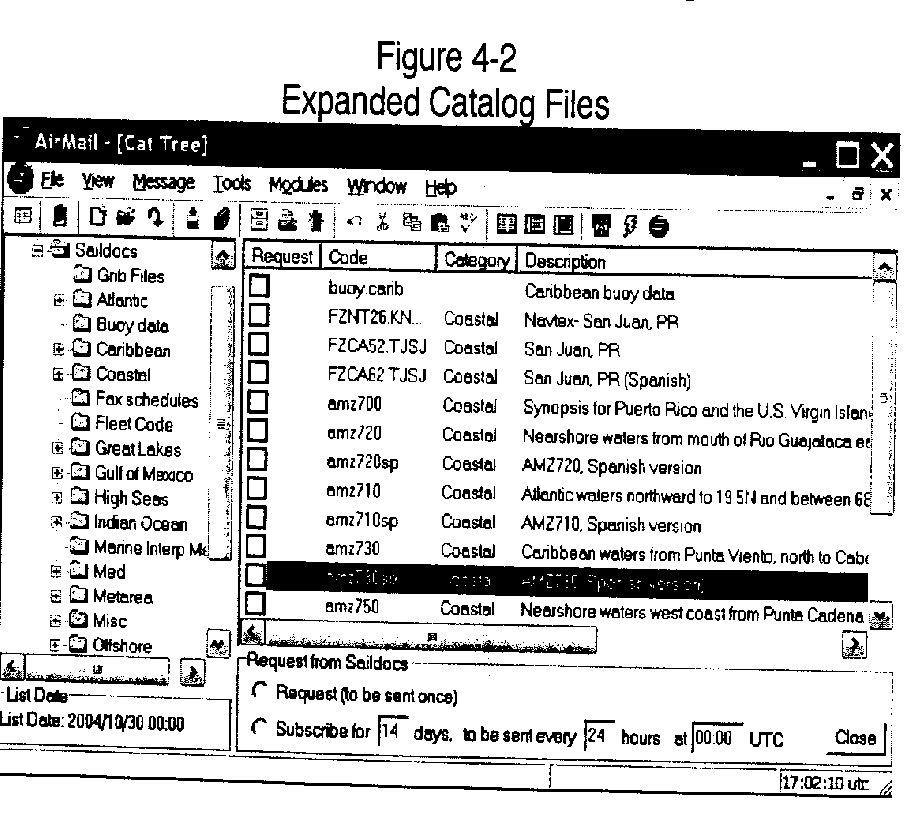
2

3 WL2K Network users have the added option of clicking on the + sign in front of the WL2K folder to access additional weather and WL2K-specific files and bulletins. To request a document click on the + sign in front of the relevant folder and place a check mark in the square in front of the document you want. You can request documents on a one time-only basis, or you can subscribe to them for a period of time. The example in Figure 4-3 two shows two selected documents: The Mid-Atlantic Offshore Forecast, and the Gulf of Mexico Offshore Forecast. The request for the Mid-Atlantic Offshore Forecast is a onetime request, and the network will deliver the forecast once. The request for the Gulf of Mexico Offshore Forecast however, is a subscription request. The system is being asked to have a copy of the Gulf of Mexico forecast available to download every day at 0600Z (UTC). Once subscribed to, a bulletin will continue to be delivered to your account until you cancel the subscription. To terminate a subscription go to the Catalog Sheets and request the subscribed-to document once. The next time you connect to the network your "once" request will be uploaded, changing your subscription to a onetime request. The next time you connect the network, the requested bulletin will be download for the last time (or until it's asked for again).
4 8.2 National Weather Service (NWS) FAX-Back (WL2K Only) The NWS provides a FAX-back service cruisers can use to retrieve weather documents. The system works by sending a command script to the NWS at ftpmail@ftpmail.nws.noaa.gov. The NWS FTP server executes the script, fetches the requested documents, and sends them to your WL2K mailbox. This example shown in Table 4-1 is asking the NWS WEFAX FTP server to fetch five different documents and send them to yourcall@winlink.org. The To: line contains the address of the NWS FTP FAX-Back server, the From: is your return address, and is where the requested documents will be sent, the Subject: line can contain anything you like, or be left blank, and the body of the message contains the executable script. The key to making the system work is to have an accurate listing of the file names for the NWS products, and to remember that the file names are case sensitive. The NWS produces an extensive list of weather products, with almost ninety documents covering the Pacific region, more than sixty covering the Atlantic region, and almost seventy covering the Gulf and Caribbean region. To request a copy of the latest product listing(s) for the area(s) of interest to you, send an to ftpmail@ftpmail.nws.noaa.gov following the format shown in Table 4.1 above. After the cd fax line type the weather products listing you need: get rfaxatl.txt for Atlantic area WEFAX products, get rfaxmex.txt for WEFAX products covering the Gulf and Southeastern Pacific region, and get rfaxpac.txt for WEFAX products covering the Northwestern Pacific These WEFAX listings are also available on the Internet as shown below.
5 1 2 3 Atlantic region WEFAX products broadcast by the USCG WEFAX station in Boston. { Mexico, the Caribbean, Tropical Atlantic and Tropical Pacific, broadcast by the USCG WEFAX station in New Orleans { Pacific products available from the USCG WEFAX station at Point Reyes (near San Francisco CA). { 8.3 Saildocs Ad hoc File Requests (WL2K Only) You can retrieve WEFAX documents directly from Saildocs.com without using the WL2K Catalog Sheets. Saildocs is an Internet-based service similar in nature to the NWS FAXback service, but much easier to use. Saildocs retrieves the same NWS WEFAX forecasts, maps, and satellite pictures that you get through the NWS FAX-back service without the cumbersome scripting. The advantages to requesting WEFAX documents through saildocs.com are: 1 2 Speed: Saildocs.com returns the requested files within in seconds, whereas the NWS FAX-Back service can take tens of minutes or longer. No finicky scripting: Simply send a request using plain English commands like send, subscribe (sub), unsubscribe (unsub).

6 To request a WEFAX document from Saildocs, address an to query@saildocs.com. Put anything you like in the Subject line, and in the body of the put your request. A request to Saildocs for the same documents requested in Table 4-1 of the NWS FAX-back section, is shown in Table 4-2 above. The request format is simple and easy to understand - it's simply the command send followed by a space and then the document file name. The documents returned in response to your request are the identical NWS documents returned by the NWS FAX-Back system. If you have a repeated need for a specific document(s), instead of using the one-time command send, you can subscribe to the document, and set the intervals when the documents will be fetched. For details on this and other features of saildocs.com send an to query@saildocs.com and in the body of the type "send help", and on the next line "send info" GRIB Files (Works with both Sailmail & WL2K) Both the SailMail and WL2K systems support Girded Binary (GRIB) wind prediction files. GRIB file information is based upon the NOAA GFS/AVN global computer model, not actual reported conditions. The GRIB wind prediction data predicts general wind flow, and is a useful tool when used in conjunction with other weather forecasting and analysis tools, but it should not be used as a standalone predictor. It's important to keep in mind that these GRIB data files are not reviewed by meteorologists and they do not allow for frontal, tropical, near-shore, geographical, or other local effects. As with most other SailMail and WL2K activities, requesting a GRIB file is accomplished from the Message Index Screen. Clicking on icon in the toolbar or selecting WINDOW,CATALOGS, brings up the Catalog Tree screen shown in Figure 4-4, Click on the plus sign in front of saildocs, then on the folder icon in front of grib FILES, to open a world map.

7 To select an area for which you want GRIB data, click on the icon to turn your cursor into a hand. Place the hand onto the map and while depressing the left mouse button position the map so that the area of interest is in view. Use the magnify tools as needed to enlarge the area of interest. When you're finished positioning the map, if you're interested in GRIB data for an area click on the and place the cursor at one corner of the desired area. While holding down the left mouse button draw the marquee diagonally across the map to the opposing boundary of the area of interest, dragging the marquee (blue square) to select the area for which you wish to receive GRIB data. If this is a one-time request, click the radio button in front of Request (to be sent once), or the Subscribe radio button if you wish to receive this data for a period of time, and then click the Request button. Airmail will format a request for these GRIB data and place the request into your Outbox. When you next connect to the SailMail or WL2K networks, your request will be automatically sent to query@saildocs.com. If vou want text data far a specific location, click on the spot forecast button, move the spot forecast button to the desired location on the map, and click the request button. Figure 4-5 shows a marquee selecting GRIB data for Florida and the Caribbean, and the "wind feather" map returned in response to the marquee-generated request.

8 Figure 4-6 below shows the text information returned for a "spot forecast". For a comprehensive discussion about GRIB ''Spot Forecast" send a blank to {spotforecasts@saildocs.com}.
 receiver. Beginning with Airmail V 3.4.")
9 8.4 GETFAX - Receiving Weather Map Broadcasts (WEFAX) The program GETFAX and its companion viewer and online weather data retrieving program ViewFAX are applets that turn your computer/hf radio /PTC-ll modem system into a high-quality Weather FAX (WEFAX) receiver. Beginning with Airmail V 3.4.xx GetFAX is integrated into Airmail, and can be accessed through the Modules Dropdown Menu or the rightmost icon on the Message Index Toolbar. Here are the steps for running GETFAX from within Airmail: Start GetFAX Make certain that the Airmail Terminal Screen is closed. Both GetFAX & the Airmail Terminal program use the same Com Port to communicate with your modem. If the Terminal Screen is running when you start GetFAX, GetFAX will be unable to access the modem's Com Port, you'll get a COM Port conflict error message, and GetFAX won't work. To start GetFAX double click on the GetFAX Icon located on the Airmail Message lndex Screen toolbar shown in Figure Initiate FAX Mode In the GetFAX Toolbar. Figure 4-8, select MODE, FAX, GeTFAX switch your modem to the FAX mode and activate the two adjacent drop-down menu windows. From the leftmost dropdown menu window click on the down arrow and choose the weather station from which you wish to receive a FAX, and from the adjacent dropdown menu window select a frequency.

10 Your PTC-ll/PTC-IIPro, or PTC-llusb will automatically tune your radio to the appropriate receive frequency. It the station is transmitting a FAX; you will see a signal waveform in the FAX Scope window located below the toolbar, and hear "FAX tones" on your radio. To begin receiving the weather FAX either click on the green button on the lower right side of the screen, or go the toolbar and select MODE, START. If you are using a PTC-lle/PTC-llex and your radio is not tuned by your computer, subtract 1. 9 khz from the number shown in the frequency dropdown window, and tune your radio to the resultant frequency. For example, if the frequency shown is khz. tune the radio to khz. To begin receiving a weather FAX, go back to the GetFAX Toolbar and select MODE, START, or click on the green start button.getfax will continue to receive Fax's as they are sent, filing each received FAX by date and time in the FAXFILES folder located under PROGRAM FILES. AIRMAIL. Weather FAX broadcasts are public broadcasts similar to AM or FM radio. They are totally separate from the Sailmail and WL2K networks, and have no impact on the amount of daily "connect" time you use. Receiving WEFAX broadcasts is a passive activity in that no information is transmitted by your station, and the power drain on your batteries is limited to the 1-2 amps it takes to operate your radio in the receive mode. 8.5 VIEWFAX Retrieving and Viewing GRIB and Other Weather Flies ViewFAX has two jobs; retrieve weather documents via the Internet, and display GRIB and WEFAX files stored in the Faxfilies subfolder. If you have an Internet connection ViewFax will almost instantly fetch any GRIB file or document listed on the Catalog Sheets. When you're connected to the Internet SailDocs fetches the requested document and delivers it to you within seconds. There's no waiting! There are several ways to open and view stored WEFAX files. One way is to start ViewFAX by double-clicking on the ViewFAX Desktop Icon, then from the ViewFAX toolbar click on FILE,OPEN. Then select any of the files listed as in Figure 4-9.

11 Another way to start ViewFAX is; 1 Start the Airmail program. 2 Open the Folder Tree by clicking on the leftmost icon in the Airmail toolbar 3 Navigate to the Faxfiles folder 4 Double-click on Faxfiles folder to open it. 5 Double-click on the file you want to view Retrieving Files Listed on Catalog Sheets To retrieve files from the Catalog List start ViewFAX by double-clicking on the ViewFAX icon. If all you see when ViewFAX starts running is the ViewFAX toolbar like the one on Figure 4-10 and a gray area beneath it, click on FILE/GET DATA. Next click on the + sign in front of Catalogs and Saildocs.Select any of the documents listed in the folder tree, or select GRIB and draw a marquee that captures your geographical area of interest.

12 8.6 WEFAX File Size and Pactor-III (P-III) WEFAX files are relatively large, averaging about 35KB in size, if you are proactively requesting and downloading WEFAX files from the NWS over the WL2K network, you need to be running Pactor-III. WEFAX files are large relative to the throughput speed of HF-based , and the 4x speed increase of P-III reduces what may take 12 minutes or so to download with pactor II to three minutes or so running pactor III, conserving both time and battery power.
Bloomsburg University Weather Viewer Quick Start Guide. Software Version 1.2 Date 4/7/2014
 Bloomsburg University Weather Viewer Quick Start Guide Software Version 1.2 Date 4/7/2014 Program Background / Objectives: The Bloomsburg Weather Viewer is a weather visualization program that is designed
Watershed Modeling Orange County Hydrology Using GIS Data
 v. 10.0 WMS 10.0 Tutorial Watershed Modeling Orange County Hydrology Using GIS Data Learn how to delineate sub-basins and compute soil losses for Orange County (California) hydrologic modeling Objectives
ADDING RCGEO BASEMAPS TO ARCMAP. Versions 10.0, 10.1 and 10.1 sp1
 ADDING RCGEO BASEMAPS TO ARCMAP Versions 10.0, 10.1 and 10.1 sp1 May, 2014 Contents Adding the Ortho and Carto Base Maps to ArcMap... 2 Richland County Base Maps... 2 Adding the Base Map Connections ArcMap
SuperCELL Data Programmer and ACTiSys IR Programmer User s Guide
 SuperCELL Data Programmer and ACTiSys IR Programmer User s Guide This page is intentionally left blank. SuperCELL Data Programmer and ACTiSys IR Programmer User s Guide The ACTiSys IR Programmer and SuperCELL
ON SITE SYSTEMS Chemical Safety Assistant
 ON SITE SYSTEMS Chemical Safety Assistant CS ASSISTANT WEB USERS MANUAL On Site Systems 23 N. Gore Ave. Suite 200 St. Louis, MO 63119 Phone 314-963-9934 Fax 314-963-9281 Table of Contents INTRODUCTION
LAB 2 - ONE DIMENSIONAL MOTION
 Name Date Partners L02-1 LAB 2 - ONE DIMENSIONAL MOTION OBJECTIVES Slow and steady wins the race. Aesop s fable: The Hare and the Tortoise To learn how to use a motion detector and gain more familiarity
Quick Start Guide New Mountain Visit our Website to Register Your Copy (weatherview32.com)
") Quick Start Guide New Mountain Visit our Website to Register Your Copy (weatherview32.com) Page 1 For the best results follow all of the instructions on the following pages to quickly access real-time
Quick Start Guide New Mountain Visit our Website to Register Your Copy (weatherview32.com) Page 1 For the best results follow all of the instructions on the following pages to quickly access real-time
HOW TO GUIDE. Loading climate data from online database
 HOW TO GUIDE Loading climate data from online database Copyright and publisher: EMD International A/S Niels Jernes vej 10 9220 Aalborg Ø Denmark Phone: +45 9635 44444 e-mail: emd@emd.dk web: www.emd.dk
M E R C E R W I N WA L K T H R O U G H
 H E A L T H W E A L T H C A R E E R WA L K T H R O U G H C L I E N T S O L U T I O N S T E A M T A B L E O F C O N T E N T 1. Login to the Tool 2 2. Published reports... 7 3. Select Results Criteria...
Instructions for using the Point Mass Ballistics Solver 2.0 Computer Program
 Instructions for using the Point Mass Ballistics Solver 2.0 Computer Program Overview This ballistics program was designed to be an educational tool, as well as a functional and accurate program for generating
: : User Manual: : - 10 December
 : : User Manual: : - 0 December 06 - : : User Manual: : Table of Contents. Map Control. How to move a map. How to zoom in and out a map 4. How to inquire Ocean Currents. How to inquire predicted current
ArcGIS 9 ArcGIS StreetMap Tutorial
 ArcGIS 9 ArcGIS StreetMap Tutorial Copyright 2001 2008 ESRI All Rights Reserved. Printed in the United States of America. The information contained in this document is the exclusive property of ESRI. This
Quality Measures Green Light Report Online Management Tool. Self Guided Tutorial
 Quality Measures Green Light Report Online Management Tool Self Guided Tutorial 1 Tutorial Contents Overview Access the QM Green Light Report Review the QM Green Light Report Tips for Success Contact PointRight
To display grib files as an overlay on your normal charts you have to first activate the grib icon
 2019/03/09 20:43 1/22 OpenCPN has a grib weather file viewer plugin, aimed at being useful while under way. The grib plugin is an Internal Plugin, always distributed with OpenCPN, no separate download is
Learning ArcGIS: Introduction to ArcCatalog 10.1
 Learning ArcGIS: Introduction to ArcCatalog 10.1 Estimated Time: 1 Hour Information systems help us to manage what we know by making it easier to organize, access, manipulate, and apply knowledge to the
New SPOT Program. Customer Tutorial. Tim Barry Fire Weather Program Leader National Weather Service Tallahassee
 New SPOT Program Customer Tutorial Tim Barry Fire Weather Program Leader National Weather Service Tallahassee tim.barry@noaa.gov Live Demonstration http://www.weather.gov/spot/ Live Demonstration http://www.weather.gov/spot/
1.6 Getting Started on Resources. Time for Trivial Pursuit!
 06, 12, and 18Z. Note this is easy to do if you are looking for data within the past 24 hours. It is doable but harder to sift through the archives to find older data. From a practical point of view this
Flight Utilities Metar Reader version 3.1 by Umberto Degli Esposti
 Flight Utilities http://www.flightutilities.com Metar Reader version 3.1 by Umberto Degli Esposti 1 Description The program allows inserting a Metar, to load it from a disk or from internet and to show
D.T.M: TRANSFER TEXTBOOKS FROM ONE SCHOOL TO ANOTHER
 Destiny Textbook Manager allows users with full access to transfer Textbooks from one school site to another and receive transfers from the warehouse In this tutorial you will learn how to: Requirements:
Assignment #0 Using Stellarium
 Name: Class: Date: Assignment #0 Using Stellarium The purpose of this exercise is to familiarize yourself with the Stellarium program and its many capabilities and features. Stellarium is a visually beautiful
TECDIS and TELchart ECS Weather Overlay Guide
 1 of 24 TECDIS and TELchart ECS provides a very advanced weather overlay feature, using top quality commercial maritime weather forecast data available as a subscription service from Jeppesen Marine. The
Lab 1 Uniform Motion - Graphing and Analyzing Motion
 Lab 1 Uniform Motion - Graphing and Analyzing Motion Objectives: < To observe the distance-time relation for motion at constant velocity. < To make a straight line fit to the distance-time data. < To interpret
(THIS IS AN OPTIONAL BUT WORTHWHILE EXERCISE)
") PART 2: Analysis in ArcGIS (THIS IS AN OPTIONAL BUT WORTHWHILE EXERCISE) Step 1: Start ArcCatalog and open a geodatabase If you have a shortcut icon for ArcCatalog on your desktop, double-click it to start
PART 2: Analysis in ArcGIS (THIS IS AN OPTIONAL BUT WORTHWHILE EXERCISE) Step 1: Start ArcCatalog and open a geodatabase If you have a shortcut icon for ArcCatalog on your desktop, double-click it to start
ISIS/Draw "Quick Start"
 ISIS/Draw "Quick Start" Click to print, or click Drawing Molecules * Basic Strategy 5.1 * Drawing Structures with Template tools and template pages 5.2 * Drawing bonds and chains 5.3 * Drawing atoms 5.4
Jasco V-670 absorption spectrometer
 Laser Spectroscopy Labs Jasco V-670 absorption spectrometer Operation instructions 1. Turn ON the power switch on the right side of the spectrophotometer. It takes about 5 minutes for the light source
Working with ArcGIS: Classification
 Working with ArcGIS: Classification 2 Abbreviations D-click R-click TOC Double Click Right Click Table of Content Introduction The benefit from the use of geographic information system (GIS) software is
Chemistry 14CL. Worksheet for the Molecular Modeling Workshop. (Revised FULL Version 2012 J.W. Pang) (Modified A. A. Russell)
 (Modified A. A. Russell)") Chemistry 14CL Worksheet for the Molecular Modeling Workshop (Revised FULL Version 2012 J.W. Pang) (Modified A. A. Russell) Structure of the Molecular Modeling Assignment The molecular modeling assignment
Chemistry 14CL Worksheet for the Molecular Modeling Workshop (Revised FULL Version 2012 J.W. Pang) (Modified A. A. Russell) Structure of the Molecular Modeling Assignment The molecular modeling assignment
William H. Bauman III * NASA Applied Meteorology Unit / ENSCO, Inc. / Cape Canaveral Air Force Station, Florida
 12.5 INTEGRATING WIND PROFILING RADARS AND RADIOSONDE OBSERVATIONS WITH MODEL POINT DATA TO DEVELOP A DECISION SUPPORT TOOL TO ASSESS UPPER-LEVEL WINDS FOR SPACE LAUNCH William H. Bauman III * NASA Applied
Hyper Borey User Guide
 METEO-GRAPHICS SYSTEMS IN C. Hyper Borey version 1.0 Meteo-Graphics Systems Inc. 5790 Rembrandt Avenue, suite 405. Montreal, Canada, H4B 2V2 T 514.262.5487 E info@meteograph.ca W www.meteograph.ca Table
The CSC Interface to Sky in Google Earth
 The CSC Interface to Sky in Google Earth CSC Threads The CSC Interface to Sky in Google Earth 1 Table of Contents The CSC Interface to Sky in Google Earth - CSC Introduction How to access CSC data with
Stellarium Walk-through for First Time Users
 Stellarium Walk-through for First Time Users Stellarium is the computer program often demonstrated during our planetarium shows at The MOST, Syracuse s science museum. It is our hope that visitors to our
Space Objects. Section. When you finish this section, you should understand the following:
 GOLDMC02_132283433X 8/24/06 2:21 PM Page 97 Section 2 Space Objects When you finish this section, you should understand the following: How to create a 2D Space Object and label it with a Space Tag. How
GIS Workshop UCLS_Fall Forum 2014 Sowmya Selvarajan, PhD TABLE OF CONTENTS
 TABLE OF CONTENTS TITLE PAGE NO. 1. ArcGIS Basics I 2 a. Open and Save a Map Document 2 b. Work with Map Layers 2 c. Navigate in a Map Document 4 d. Measure Distances 4 2. ArcGIS Basics II 5 a. Work with
Experiment 1: The Same or Not The Same?
 Experiment 1: The Same or Not The Same? Learning Goals After you finish this lab, you will be able to: 1. Use Logger Pro to collect data and calculate statistics (mean and standard deviation). 2. Explain
This tutorial is intended to familiarize you with the Geomatica Toolbar and describe the basics of viewing data using Geomatica Focus.
 PCI GEOMATICS GEOMATICA QUICKSTART 1. Introduction This tutorial is intended to familiarize you with the Geomatica Toolbar and describe the basics of viewing data using Geomatica Focus. All data used in
VELA. Getting started with the VELA Versatile Laboratory Aid. Paul Vernon
 VELA Getting started with the VELA Versatile Laboratory Aid Paul Vernon Contents Preface... 3 Setting up and using VELA... 4 Introduction... 4 Setting VELA up... 5 Programming VELA... 6 Uses of the Programs...
Studying Topography, Orographic Rainfall, and Ecosystems (STORE)
") Studying Topography, Orographic Rainfall, and Ecosystems (STORE) Introduction Basic Lesson 3: Using Microsoft Excel to Analyze Weather Data: Topography and Temperature This lesson uses NCDC data to compare
Studying Topography, Orographic Rainfall, and Ecosystems (STORE) Introduction Basic Lesson 3: Using Microsoft Excel to Analyze Weather Data: Topography and Temperature This lesson uses NCDC data to compare
O P E R A T I N G M A N U A L
 OPERATING MANUAL WeatherJack OPERATING MANUAL 1-800-645-1061 The baud rate is 2400 ( 8 bits, 1 stop bit, no parity. Flow control = none) To make sure the unit is on line, send an X. the machine will respond
LAB 6 SUPPLEMENT. G141 Earthquakes & Volcanoes
 G141 Earthquakes & Volcanoes Name LAB 6 SUPPLEMENT Using Earthquake Arrival Times to Locate Earthquakes In last week's lab, you used arrival times of P- and S-waves to locate earthquakes from a local seismograph
Studying Topography, Orographic Rainfall, and Ecosystems (STORE)
") Introduction Studying Topography, Orographic Rainfall, and Ecosystems (STORE) Lesson: Using ArcGIS Explorer to Analyze the Connection between Topography, Tectonics, and Rainfall GIS-intensive Lesson This
Introduction Studying Topography, Orographic Rainfall, and Ecosystems (STORE) Lesson: Using ArcGIS Explorer to Analyze the Connection between Topography, Tectonics, and Rainfall GIS-intensive Lesson This
1. Open IDV. There is a desktop link, choose version 3.0u1 or 3.0u2. It can take a few minutes to open.
 Page 1 Objectives: Become familiar with using a software package (IDV) to view satellite images Understand the differences between Visible, IR, and Microwave Imagery Observe the influence of dry air and
The Information System in ECDIS
 The Information System in ECDIS Bjørn Åge Hjøllo Product Manager Weather/Routing/Piracy Jeppesen, Norway Nordic Institute of Navigation (NNF); Seminar on enavigation Bergen, May 2011 19 May 2011-1 - enavigation
Electric Fields and Equipotentials
 OBJECTIVE Electric Fields and Equipotentials To study and describe the two-dimensional electric field. To map the location of the equipotential surfaces around charged electrodes. To study the relationship
Using the AmaSeis seismogram viewer and downloading seismograms from the Internet A Tutorial 1
 Using AmaSeis Page 1 of 69 Using the AmaSeis seismogram viewer and downloading seismograms from the Internet A Tutorial 1 (L. Braile, October, 2004; revised May, 2006) braile@purdue.edu http://web.ics.purdue.edu/~braile
Guide to Hydrologic Information on the Web
 NOAA s National Weather Service Guide to Hydrologic Information on the Web Colorado River at Lees Ferry Photo: courtesy Tim Helble Your gateway to web resources provided through NOAA s Advanced Hydrologic
MailASail Automatic Weather Responder
 MailASail Automatic Weather Responder As at November 2015. To get an up-to-date list, send a blank email to weather@mailasail.com with subject help-graphic. To use, click on a chart code below and send
Tropical Storm Tracking with Sailmail/Winlink (Revised )
") Page 1 of 7 Tropical Storm Tracking with Sailmail/Winlink (Revised 7-25-11) There s a hurricane out there. Is it likely to affect you?? In less than 30 seconds you can tell at a glance. If your boat is
Page 1 of 7 Tropical Storm Tracking with Sailmail/Winlink (Revised 7-25-11) There s a hurricane out there. Is it likely to affect you?? In less than 30 seconds you can tell at a glance. If your boat is
The Geodatabase Working with Spatial Analyst. Calculating Elevation and Slope Values for Forested Roads, Streams, and Stands.
 GIS LAB 7 The Geodatabase Working with Spatial Analyst. Calculating Elevation and Slope Values for Forested Roads, Streams, and Stands. This lab will ask you to work with the Spatial Analyst extension.
41. Sim Reactions Example
 HSC Chemistry 7.0 41-1(6) 41. Sim Reactions Example Figure 1: Sim Reactions Example, Run mode view after calculations. General This example contains instruction how to create a simple model. The example
Forecast.io Driver. Installation and Usage Guide. Revision: 1.0 Date: Tuesday, May 20, 2014 Authors: Alan Chow
 Forecast.io Driver Installation and Usage Guide Revision: 1.0 Date: Tuesday, May 20, 2014 Authors: Alan Chow Contents Overview... 2 Features... 3 Usage Scenarios... 4 Change Log... 4 Disclaimer... 4 Driver
Create Satellite Image, Draw Maps
 Create Satellite Image, Draw Maps 1. The goal Using Google Earth, we want to create and import a background file into our Adviser program. From there, we will be creating paddock boundaries. The accuracy
CHARTING THE HEAVENS USING A VIRTUAL PLANETARIUM
 Name Partner(s) Section Date CHARTING THE HEAVENS USING A VIRTUAL PLANETARIUM You have had the opportunity to look at two different tools to display the night sky, the celestial sphere and the star chart.
FTPMAIL INSTRUCTIONS
 FTPMAIL INSTRUCTIONS National Weather Service marine text forecasts, radiofax charts and buoy observations are available via e-mail. Further, FTPMAIL may be used to acquire any file on the tgftp.nws.noaa.gov
PiCUS Calliper Version 3
 Technology PiCUS Calliper Version 3 Digital calliper for precise geometry detection argus electronic GmbH Erich-Schlesinger-Straße 49d 18059 Rostock Germany Tel.: +49 (0) 381/49 68 14 40 www.argus-electronic.de
In this exercise we will learn how to use the analysis tools in ArcGIS with vector and raster data to further examine potential building sites.
 GIS Level 2 In the Introduction to GIS workshop we filtered data and visually examined it to determine where to potentially build a new mixed use facility. In order to get a low interest loan, the building
T R A I N I N G M A N U A L 1. 9 G H Z C D M A P C S 80 0 M H Z C D M A /A M P S ( T R I - M O D E ) PM325
 PM325") T R A I N I N G M A N U A L 1. 9 G H Z C D M A P C S 80 0 M H Z C D M A /A M P S ( T R I - M O D E ) PM325 Slide. Click. Send the pic O P E R AT I N G I N S T RU C T I O N S H e a d s e t Ja c k S e l
T R A I N I N G M A N U A L 1. 9 G H Z C D M A P C S 80 0 M H Z C D M A /A M P S ( T R I - M O D E ) PM325 Slide. Click. Send the pic O P E R AT I N G I N S T RU C T I O N S H e a d s e t Ja c k S e l
Exercises for Windows
 Exercises for Windows CAChe User Interface for Windows Select tool Application window Document window (workspace) Style bar Tool palette Select entire molecule Select Similar Group Select Atom tool Rotate
Learning to Use Scigress Wagner, Eugene P. (revised May 15, 2018)
") Learning to Use Scigress Wagner, Eugene P. (revised May 15, 2018) Abstract Students are introduced to basic features of Scigress by building molecules and performing calculations on them using semi-empirical
Learning to Use Scigress Wagner, Eugene P. (revised May 15, 2018) Abstract Students are introduced to basic features of Scigress by building molecules and performing calculations on them using semi-empirical
Lesson Plan 2 - Middle and High School Land Use and Land Cover Introduction. Understanding Land Use and Land Cover using Google Earth
 Understanding Land Use and Land Cover using Google Earth Image an image is a representation of reality. It can be a sketch, a painting, a photograph, or some other graphic representation such as satellite
1. Double-click the ArcMap icon on your computer s desktop. 2. When the ArcMap start-up dialog box appears, click An existing map and click OK.
 Module 2, Lesson 1 The earth moves In this activity, you will observe worldwide patterns of seismic activity (earthquakes) and volcanic activity (volcanoes). You will analyze the relationships of those
Stoichiometric Reactor Simulation Robert P. Hesketh and Concetta LaMarca Chemical Engineering, Rowan University (Revised 4/8/09)
") Stoichiometric Reactor Simulation Robert P. Hesketh and Concetta LaMarca Chemical Engineering, Rowan University (Revised 4/8/09) In this session you will learn how to create a stoichiometric reactor model
Stoichiometric Reactor Simulation Robert P. Hesketh and Concetta LaMarca Chemical Engineering, Rowan University (Revised 4/8/09) In this session you will learn how to create a stoichiometric reactor model
Manual Seatrack Web Brofjorden
 December 2011 Manual Seatrack Web Brofjorden A user-friendly system for forecasts and backtracking of drift and spreading of oil, chemicals and substances in water 1. Introduction and Background... 3 1.1
McIDAS-V Tutorial Displaying Point Observations from ADDE Datasets updated July 2016 (software version 1.6)
") McIDAS-V Tutorial Displaying Point Observations from ADDE Datasets updated July 2016 (software version 1.6) McIDAS-V is a free, open source, visualization and data analysis software package that is the
McIDAS-V Tutorial Displaying Point Observations from ADDE Datasets updated July 2016 (software version 1.6) McIDAS-V is a free, open source, visualization and data analysis software package that is the
Virtual Beach Making Nowcast Predictions
 Virtual Beach 3.0.6 Making Nowcast Predictions In this module you will learn how to: A. Create a real-time connection to Web data services through EnDDaT B. Download real-time data to make a Nowcast prediction
Planning Softproviding Meat User Documentation
 Great ideas are always simple Softproviding simply makes them happen. Planning Softproviding Meat User Documentation Version: 1.00 Date: 24 August 2017 Release: v5.50 Softproviding AG Riehenring 175 CH-4058
Orange Visualization Tool (OVT) Manual
 Manual") Orange Visualization Tool (OVT) Manual This manual describes the features of the tool and how to use it. 1. Contents of the OVT Once the OVT is open (the first time it may take some seconds), it should
Orange Visualization Tool (OVT) Manual This manual describes the features of the tool and how to use it. 1. Contents of the OVT Once the OVT is open (the first time it may take some seconds), it should
Overlaying GRIB data over NOAA APT weather satellite images using OpenCPN
 Overlaying GRIB data over NOAA APT weather satellite images using OpenCPN I receive NOAA weather satellite images which are quite useful when used alone but with GRIB wind and rain data overlaid they can
You w i ll f ol l ow these st eps : Before opening files, the S c e n e panel is active.
 You w i ll f ol l ow these st eps : A. O pen a n i m a g e s t a c k. B. Tr a c e t h e d e n d r i t e w i t h t h e user-guided m ode. C. D e t e c t t h e s p i n e s a u t o m a t i c a l l y. D. C
Lab Activity H4 It s Snow Big Deal
 Lab Activity H4 It s Snow Big Deal OUTCOMES After completing this lab activity, the student should be able to use computer-based data acquisition techniques to measure temperatures. draw appropriate conclusions
Molecular Modeling and Conformational Analysis with PC Spartan
 Molecular Modeling and Conformational Analysis with PC Spartan Introduction Molecular modeling can be done in a variety of ways, from using simple hand-held models to doing sophisticated calculations on
HSC Chemistry 7.0 User's Guide
 HSC Chemistry 7.0 47-1 HSC Chemistry 7.0 User's Guide Sim Flowsheet Module Experimental Mode Pertti Lamberg Outotec Research Oy Information Service P.O. Box 69 FIN - 28101 PORI, FINLAND Fax: +358-20 -
Downloading GPS Waypoints
 Downloading Data with DNR- GPS & Importing to ArcMap and Google Earth Written by Patrick Florance & Carolyn Talmadge, updated on 4/10/17 DOWNLOADING GPS WAYPOINTS... 1 VIEWING YOUR POINTS IN GOOGLE EARTH...
BUILDING BASICS WITH HYPERCHEM LITE
 BUILDING BASICS WITH HYPERCHEM LITE LAB MOD1.COMP From Gannon University SIM INTRODUCTION A chemical bond is a link between atoms resulting from the mutual attraction of their nuclei for electrons. There
NEW HOLLAND IH AUSTRALIA. Machinery Market Information and Forecasting Portal *** Dealer User Guide Released August 2013 ***
 NEW HOLLAND IH AUSTRALIA Machinery Market Information and Forecasting Portal *** Dealer User Guide Released August 2013 *** www.cnhportal.agriview.com.au Contents INTRODUCTION... 5 REQUIREMENTS... 6 NAVIGATION...
Trouble-Shooting Coordinate System Problems
 Trouble-Shooting Coordinate System Problems Written by Barbara M. Parmenter. Revised on October 2, 2018 OVERVIEW OF THE EXERCISE... 1 COPYING THE MAP PROJECTION EXERCISE FOLDER TO YOUR H: DRIVE OR DESKTOP...
Investigation 5: What happens when plates move sideways past each other?
 Tectonics Investigation 5: Teacher Guide Investigation 5: What happens when plates move sideways past each other? Plates move sideways past each other at transform boundaries. At these boundaries, the
Using the EartH2Observe data portal to analyse drought indicators. Lesson 4: Using Python Notebook to access and process data
 Using the EartH2Observe data portal to analyse drought indicators Lesson 4: Using Python Notebook to access and process data Preface In this fourth lesson you will again work with the Water Cycle Integrator
Virtual Beach Building a GBM Model
 Virtual Beach 3.0.6 Building a GBM Model Building, Evaluating and Validating Anytime Nowcast Models In this module you will learn how to: A. Build and evaluate an anytime GBM model B. Optimize a GBM model
v Prerequisite Tutorials GSSHA WMS Basics Watershed Delineation using DEMs and 2D Grid Generation Time minutes
 v. 10.1 WMS 10.1 Tutorial GSSHA WMS Basics Creating Feature Objects and Mapping Attributes to the 2D Grid Populate hydrologic parameters in a GSSHA model using land use and soil data Objectives This tutorial
User Guide. Affirmatively Furthering Fair Housing Data and Mapping Tool. U.S. Department of Housing and Urban Development
 User Guide Affirmatively Furthering Fair Housing Data and Mapping Tool U.S. Department of Housing and Urban Development December, 2015 1 Table of Contents 1. Getting Started... 5 1.1 Software Version...
Simulating Future Climate Change Using A Global Climate Model
 Simulating Future Climate Change Using A Global Climate Model Introduction: (EzGCM: Web-based Version) The objective of this abridged EzGCM exercise is for you to become familiar with the steps involved
Ocean Optics Red Tide UV-VIS Spectrometer (Order Code: SPRT-UV-VIS)
") Ocean Optics Red Tide UV-VIS Spectrometer (Order Code: SPRT-UV-VIS) The UV-VIS spectrometer is a portable ultraviolet light and visible light spectrophotometer, combining a spectrometer and a light source/cuvette
Ocean Optics Red Tide UV-VIS Spectrometer (Order Code: SPRT-UV-VIS) The UV-VIS spectrometer is a portable ultraviolet light and visible light spectrophotometer, combining a spectrometer and a light source/cuvette
TORO SENTINEL APPLICATION NOTE AN01: ET-BASED PROGRAMMING
 TORO SENTINEL APPLICATION NOTE AN01: ET-BASED PROGRAMMING Version: 12-17-2010 ET-BASED IRRIGATION IN SENTINEL Irrigating by ET: In order to irrigate by ET in Sentinel, the user has to perform a number
Investigating Weather and Climate with Google Earth Teacher Guide
 Google Earth Weather and Climate Teacher Guide In this activity, students will use Google Earth to explore global temperature changes. They will: 1. Use Google Earth to determine how the temperature of
Comparing whole genomes
 BioNumerics Tutorial: Comparing whole genomes 1 Aim The Chromosome Comparison window in BioNumerics has been designed for large-scale comparison of sequences of unlimited length. In this tutorial you will
Lightcloud Application
 Controlling Your Lightcloud System Lightcloud Application Lightcloud Application Navigating the Application Devices Device Settings Organize Control Energy Scenes Schedules Demand Response Power Up State
Calculating Bond Enthalpies of the Hydrides
 Proposed Exercise for the General Chemistry Section of the Teaching with Cache Workbook: Calculating Bond Enthalpies of the Hydrides Contributed by James Foresman, Rachel Fogle, and Jeremy Beck, York College
The Phase Change Lab: Freezing and Melting of Water
 The Phase Change Lab: Freezing and Melting of Water Experiment 3 Freezing temperature is the temperature at which a substance turns from a liquid to a solid. Melting temperature is the temperature at which
Relative Photometry with data from the Peter van de Kamp Observatory D. Cohen and E. Jensen (v.1.0 October 19, 2014)
") Relative Photometry with data from the Peter van de Kamp Observatory D. Cohen and E. Jensen (v.1.0 October 19, 2014) Context This document assumes familiarity with Image reduction and analysis at the Peter
Relative Photometry with data from the Peter van de Kamp Observatory D. Cohen and E. Jensen (v.1.0 October 19, 2014) Context This document assumes familiarity with Image reduction and analysis at the Peter
What are the Spatial Data Standards?
 What is SDSFIE? 1992 Army, Navy, Air Force and Marine Corps established the Tri- Service CADD/GIS Technology Center at the US Army Engineer Waterways Experiment Station in Vicksburg, Miss. 1999 name was
PHY221 Lab 2 - Experiencing Acceleration: Motion with constant acceleration; Logger Pro fits to displacement-time graphs
 Page 1 PHY221 Lab 2 - Experiencing Acceleration: Motion with constant acceleration; Logger Pro fits to displacement-time graphs Print Your Name Print Your Partners' Names You will return this handout to
Physics 208 Fall 2008 Lab 4: Electric Fields and Electric Potentials
 Name Section Physics 208 Fall 2008 Lab 4: Electric Fields and Electric Potentials Your TA will use this sheet to score your lab. It is to be turned in at the end of lab. You must use complete sentences
module, with the exception that the vials are larger and you only use one initial population size.
 Population Dynamics and Space Availability (http://web.as.uky.edu/biology/faculty/cooper/population%20dynamics%20examples%2 0with%20fruit%20flies/TheAmericanBiologyTeacher- PopulationDynamicsWebpage.html
OpenWeatherMap Module
 OpenWeatherMap Module Installation and Usage Guide Revision: Date: Author(s): 1.0 Friday, October 13, 2017 Richard Mullins Contents Overview 2 Installation 3 Import the TCM in to accelerator 3 Add the
let s examine pupation rates. With the conclusion of that data collection, we will go on to explore the rate at which new adults appear, a process
 Population Dynamics and Initial Population Size (Module website: http://web.as.uky.edu/biology/faculty/cooper/population%20dynamics%20examples%20 with%20fruit%20flies/theamericanbiologyteacher-populationdynamicswebpage.html
ncounter PlexSet Data Analysis Guidelines
 ncounter PlexSet Data Analysis Guidelines NanoString Technologies, Inc. 530 airview Ave North Seattle, Washington 98109 USA Telephone: 206.378.6266 888.358.6266 E-mail: info@nanostring.com Molecules That
ES205 Analysis and Design of Engineering Systems: Lab 1: An Introductory Tutorial: Getting Started with SIMULINK
 ES205 Analysis and Design of Engineering Systems: Lab 1: An Introductory Tutorial: Getting Started with SIMULINK What is SIMULINK? SIMULINK is a software package for modeling, simulating, and analyzing
Introduction to Coastal GIS
 Introduction to Coastal GIS Event was held on Tues, 1/8/13 - Thurs, 1/10/13 Time: 9:00 am to 5:00 pm Location: Roger Williams University, Bristol, RI Audience: The intended audiences for this course are
CREATING A REPORT ON FIRE (April 2011)
") CREATING A REPORT ON FIRE (April 2011) The Fire Report feature on the NAFI website lets you create simple summaries of fire activity for areas of land in far northern Australia (north of 20 degrees where
CREATING A REPORT ON FIRE (April 2011) The Fire Report feature on the NAFI website lets you create simple summaries of fire activity for areas of land in far northern Australia (north of 20 degrees where
The Word Art features of Word allows the user to create stylized text with various special effects such as textures, outlines and shapes.
 Overview: During this lesson, students use Word Art and the text box tool in Microsoft Word to describe a word related to weather. After printing the page they illustrate the weather word. Objectives: