4-5 Scatter Plots Plots and and Trend Lines
|
|
|
- Rudolf Harmon
- 6 years ago
- Views:
Transcription


1 4-5 Scatter Plots Plots and and Trend Lines Warm Up Lesson Presentation Lesson Quiz Holt Holt Algebra Algebra 1 1
2 The image cannot be displayed. Your computer may not have enough memory to open the image, or the image may have been corrupted. Restart your computer, and then open the file again. If the red x still appears, you may have to delete the image and then insert it again. 4-5 Scatter Plots and Trend Lines Bell Quiz 4-5 Graph each point. 1. A(3, 2) 2 pts 2 pts 2 pts 2 pts 3. C( 2, 1) 5. E(1, 0) 2 pts 2. B( 3, 3) 4. D(0, 3) 10 pts possible
3 Questions on 4-4
4 Objectives Create and interpret scatter plots. Use trend lines to make predictions.
5 Vocabulary scatter plot correlation positive correlation negative correlation no correlation trend line
6 In this chapter you have examined relationships between sets of ordered pairs or data. Displaying data visually can help you see relationships. A scatter plot is a graph with points plotted to show a possible relationship between two sets of data. A scatter plot is an effective way to display some types of data.


7 Example 1A: Graphing a Scatter Plot from Given Data The table shows the number of cookies in a jar from the time since they were baked. Graph a scatter plot using the given data. Use the table to make ordered pairs for the scatter plot. The x-value represents the time since the cookies were baked and the y-value represents the number of cookies left in the jar. Plot the ordered pairs.

8 Check It Out! Example 1a The table shows the number of points scored by a high school football team in the first four games of a season. Graph a scatter plot using the given data. Game Score Use the table to make ordered pairs for the scatter plot. The x-value represents the individual games and the y-value represents the points scored in each game. Plot the ordered pairs.
9 A correlation describes a relationship between two data sets. A graph may show the correlation between data. The correlation can help you analyze trends and make predictions. There are three types of correlations between data.
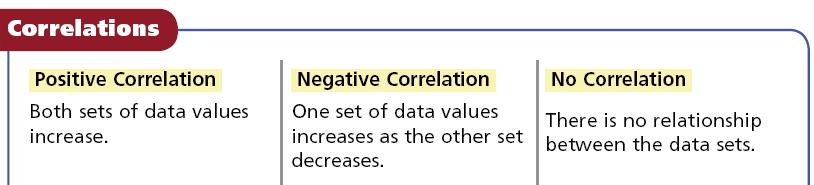
10

11 Example 2A: Describing Correlations from Scatter Plots Describe the correlation illustrated by the scatter plot. As the average daily temperature increased, the number of visitor increased. There is a positive correlation between the two data sets.


12 Check It Out! Example 2a Describe the correlation illustrated by the scatter plot. As the years passed, the number of participants in the snowboarding competition increased. There is a positive correlation between the two data sets.
13 Example 3A: Identifying Correlations Identify the correlation you would expect to see between the pair of data sets. Explain. The average temperature in a city and the number of speeding tickets given in the city. You would expect to see no correlation. The number of speeding tickets has nothing to do with the temperature.
14 Example 3B: Identifying Correlations Identify the correlation you would expect to see between the pair of data sets. Explain. The number of people in an audience and ticket sales. You would expect to see a positive correlation. As the number of people in the audience increases, ticket sales increase.
15 Example 3C: Identifying Correlations Identify the correlation you would expect to see between the pair of data sets. Explain. A runner s time and the distance to the finish line. You would expect to see a negative correlation. As a runner s time increases, the distance to the finish line decreases.
16 Check It Out! Example 3a Identify the type of correlation you would expect to see between the pair of data sets. Explain. The temperature in Houston and the number of cars sold in Boston. You would except to see no correlation. The temperature in Houston has nothing to do with the number of cars sold in Boston.
17 Check It Out! Example 3b Identify the type of correlation you would expect to see between the pair of data sets. Explain. The number of members in a family and the size of the family s grocery bill. You would expect to see positive correlation. As the number of members in a family increases, the size of the grocery bill increases.
18 Check It Out! Example 3c Identify the type of correlation you would expect to see between the pair of data sets. Explain. The number of times you sharpen your pencil and the length of your pencil. You would expect to see a negative correlation. As the number of times you sharpen your pencil increases, the length of your pencil decreases.
19 Example 4A: Matching Scatter Plots to Situations Choose the scatter plot that best represents the relationship between the age of a car and the amount of money spent each year on repairs. Explain. Graph A Graph B Graph C
20 Example 4A Continued Choose the scatter plot that best represents the relationship between the age of a car and the amount of money spent each year on repairs. Explain. Graph A The age of the car cannot be negative.
21 Graph B Example 4A Continued Choose the scatter plot that best represents the relationship between the age of a car and the amount of money spent each year on repairs. Explain. This graph shows all positive values and a positive correlation, so it could represent the data set.
22 Graph C Example 4A Continued Choose the scatter plot that best represents the relationship between the age of a car and the amount of money spent each year on repairs. Explain. There will be a positive correlation between the amount spent on repairs and the age of the car.

23 Example 4A Continued Choose the scatter plot that best represents the relationship between the age of a car and the amount of money spent each year on repairs. Explain. Graph A Graph A shows negative values, so it is incorrect. Graph C shows negative correlation, so it is incorrect. Graph B is the correct scatter plot. Graph B Graph C
24 Check It Out! Example 4a Choose the scatter plot that best represents the relationship between the number of minutes since a pie has been taken out of the oven and the temperature of the pie. Explain. Graph A Graph B Graph C
25 Check It Out! Example 4a Continued Choose the scatter plot that best represents the relationship between the number of minutes since a pie has been taken out of the oven and the temperature of the pie. Explain. Graph A The pie is cooling steadily after it is take from the oven.
26 Check It Out! Example 4a Continued Choose the scatter plot that best represents the relationship between the number of minutes since a pie has been taken out of the oven and the temperature of the pie. Explain. Graph B The pie has started cooling before it is taken from the oven.
27 Check It Out! Example 4a Continued Choose the scatter plot that best represents the relationship between the number of minutes since a pie has been taken out of the oven and the temperature of the pie. Explain. Graph C The temperature of the pie is increasing after it is taken from the oven.
28 Check It Out! Example 4a Choose the scatter plot that best represents the relationship between the number of minutes since a pie has been taken out of the oven and the temperature of the pie. Explain. Graph A Graph B Graph C Graph B shows the pie cooling while it is in the oven, so it is incorrect. Graph C shows the temperature of the pie increasing, so it is incorrect. Graph A is the correct answer.
29 You can graph a function on a scatter plot to help show a relationship in the data. Sometimes the function is a straight line. This line, called a trend line. A trend line, helps show the correlation between data sets more clearly. It can also be helpful when making predictions based on the data.
30 Example 5A: Fund-Raising Application The scatter plot shows a relationship between the total amount of money collected at the concession stand and the total number of tickets sold at a movie theater. Based on this relationship, predict how much money will be collected at the concession stand when 150 tickets have been sold. Draw a trend line and use it to make a prediction. Draw a line that has about the same number of points above and below it. Your line may or may not go through data points. Find the point on the line whose x-value is 150. The corresponding y-value is 750. Based on the data, $750 is a reasonable prediction of how much money will be collected when 150 tickets have been sold.


31 Check It Out! Example 5a Based on the trend line, predict how many wrapping paper rolls need to be sold to raise $500. Find the point on the line whose y-value is 500. The corresponding x-value is about 75. Based on the data, about 75 wrapping paper rolls is a reasonable prediction of how many rolls need to be sold to raise $500.
32 HOMEWORK Sec 4-5 (pg 266) 1-12, 14-20, 24, 25, 26, 29-31, 36, 37, 39, 40
33 HOMEWORK
34 HOMEWORK
3-1 Graphing and Writing Inequalities. Warm Up Lesson Presentation Lesson Quiz
 3-1 Graphing and Writing Inequalities Warm Up Lesson Presentation Lesson Quiz Holt Holt Algebra Algebra 1 1 Bell Quiz 3-1 Compare. Write , or =. 2 pts 1. 3 2 2 pts 2. 6.5 6.3 1 pt for putting your
6-6 Solving Systems of Linear Inequalities 6-6. Solving Systems of Linear Inequalities
 6-6 Solving Systems of Linear Inequalities Warm Up Lesson Presentation Lesson Quiz 1 2 pts 3 pts 5 pts Bell Quiz 6-6 Solve each inequality for y. 1. 8x + y < 6 2. 3x 2y > 10 3. Graph the solutions of 4x
Lesson 12: Systems of Linear Equations
 Our final lesson involves the study of systems of linear equations. In this lesson, we examine the relationship between two distinct linear equations. Specifically, we are looking for the point where the
Solving Equations by Multiplying or Dividing
 2-2 Warm Up Lesson Presentation Lesson Quiz Bell Quiz 2-2 3 pts Solve each equation. Check your answer. 1. u -15 = -8 3 pts 3 pts 2. 19 + a = 19 3. -12 + f = 3 10 pts possible 1 pt for putting your name
H l o t lol t M t c M D gc o ed u o g u al a 1 g A al lg Al e g b e r r 1 a
 Holt Algebra McDougal 1 Algebra 1 Warm Up Line of Best Fit Identify the slope and the y-intercept. 1. y = -2x + 1 m = -2, b = 1 2. y = 2 2 x - 4 m=, b = -4 3 3 Identify the correlation (positive, negative,
6-4 Solving Special Systems
 6-4 Solving Special Systems Warm Up Lesson Presentation Lesson Quiz 1 2 pts Bell Quiz 6-4 Solve the equation. 1. 2(x + 1) = 2x + 2 3 pts Solve by using any method. 2. y = 3x + 2 2x + y = 7 5 pts possible
Solving Equations with Variables on Both Sides
 2-4 Warm Up Lesson Presentation Lesson Quiz Bell Quiz 2-4 2 pts Simplify. 1. 4x 10x 2 pts 2. -7(x 3) 3 pts 3. 15 (x 2) 10 pts possible 3 pts Solve the equation. 4. 3x + 2 = 8 Questions on 2-3 Objective
8-1 Factors and Greatest Common Factors 8-1. Factors and Greatest Common Factors
 8-1 Factors and Greatest Common Factors Warm Up Lesson Presentation Lesson Quiz 1 2 pts 2 pts Bell Quiz 8-1 Tell whether the second number is a factor of the first number 1. 50, 6 2 pts no 2. 105, 7 3.
Samples and Surveys pp
 LESSON 4-1 Samples and Surveys pp. 174 175 Vocabulary population (p. 174) sample (p. 174) biased sample (p. 174) random sample (p. 175) systematic sample (p. 175) stratified sample (p. 175) Additional
1. Graph the system of equations and tell the solution. 1. Solution
 Algebra Reporting Strand 4: Systems of Equations & Inequalities Subunit 4a: Solving Systems of Equations Review Name: Period: Date: Read all the directions carefully, put your answers in the blanks provided,
Frequency and Histograms
 Warm Up Lesson Presentation Lesson Quiz Algebra 1 Create stem-and-leaf plots. Objectives Create frequency tables and histograms. Vocabulary stem-and-leaf plot frequency frequency table histogram cumulative
Scatter plots. 2) Students predict correlation of linear regression through word problems, graphs, and calculator
 Students predict correlation of linear regression through word problems, graphs, and calculator") Scatter plots 1) Students graph scatter plots 2) Students predict correlation of linear regression through word problems, graphs, and calculator Susan Blakely EPISD Coronado High School (use granted for
Scatter plots 1) Students graph scatter plots 2) Students predict correlation of linear regression through word problems, graphs, and calculator Susan Blakely EPISD Coronado High School (use granted for
Algebra 1 Midterm Review
 Name Block Algebra 1 Midterm Review MULTIPLE CHOICE Write the letter for the correct answer at the left of each question. 1. Solve: A. 8 C. 2. Solve: A. 43 C. 42 3. Solve the compound inequality and graph
6 which of the following equations would give you a system of equations with the same line and infinitely many solutions?
 Algebra 1 4 1 Worksheet Name: Per: Part I: Solve each system of equations using the graphing method. 1) y = x 5 ) -x + y = 6 y = x + 1 y = -x 3) y = 1 x 3 4) 4x y = 8 y = 1 x + 1 y = x + 3 5) x + y = 6
Measures of the Location of the Data
 Measures of the Location of the Data 1. 5. Mark has 51 films in his collection. Each movie comes with a rating on a scale from 0.0 to 10.0. The following table displays the ratings of the aforementioned
Unit 5 Review Systems of Linear Equations and Inequalities
 Unit 5 Review Systems of Linear Equations and Inequalities Name: Algebra 1B Day 1: Solutions to Systems and Solving by Graphing Warm Up: Determine if the point (2,5) is a solution to each of the systems
When a graph on a coordinate plane is a straight line that goes through the origin it is called a direct
 DIRECT VARIATION TABLES AND SLOPE LESSON 3-B When a graph on a coordinate plane is a straight line that goes through the origin it is called a direct variation graph. In this lesson you will investigate
Name Class Date. 3. Write an equation for the following description: y is three times the value of x.
 Name Class Date Practice 5-2 Linear Equations: y = mx 5-2 Linear Equations: y = mx 1. The variable y has a proportional relationship with x as suggested by the graph. Use the graph to write an equation
Solving Equations with Variables on Both Sides
 2-4 Warm Up Lesson Presentation Lesson Quiz Bell Quiz 2-4 1 pt Simplify. 1. 4x 10x 4 pts Solve the equation. 2. 3x + 2 = 8 5 pts possible Questions on 2-3 Objective Solve equations in one variable that
Unit 12: Systems of Equations
 Section 12.1: Systems of Linear Equations Section 12.2: The Substitution Method Section 12.3: The Addition (Elimination) Method Section 12.4: Applications KEY TERMS AND CONCEPTS Look for the following
Intensive Math-Algebra I Mini-Lesson MA.912.A.3.1
 Intensive Math-Algebra I Mini-Lesson MA.912.A.3.1 Summer 2013 Solving Linear Equations Student Packet Day 3 Name: Date: Benchmark MA.912.A.3.1 Solve linear equations in one variable that include simplifying
Rate of Change and slope. Objective: To find rates of change from tables. To find slope.
 Linear Functions Rate of Change and slope Objective: To find rates of change from tables. To find slope. Objectives I can find the rate of change using a table. I can find the slope of an equation using
2-4. Warm Up Lesson Presentation Lesson Quiz
 Warm Up Lesson Presentation Lesson Quiz Holt Algebra McDougal 1 Algebra 1 Warm Up Solve each equation. 1. 2x 5 = 17 6 2. 14 Solve each inequality and graph the solutions. 3. 5 < t + 9 t > 4 4. a 8 Objective
Final Exam Study Guide
 Algebra 2 Alei - Desert Academy 2011-12 Name: Date: Block: Final Exam Study Guide 1. Which of the properties of real numbers is illustrated below? a + b = b + a 2. Convert 6 yards to inches. 3. How long
Pre-Algebra Chapter 8 Linear Functions and Graphing
 Pre-Algebra Chapter 8 Linear Functions and Graphing SOME NUMBERED QUESTIONS HAVE BEEN DELETED OR REMOVED. YOU WILL NOT BE USING A CALCULATOR FOR PART I MULTIPLE-CHOICE QUESTIONS, AND THEREFORE YOU SHOULD
Chapter 9 Solving Systems of Linear Equations Algebraically
 Name: Chapter 9 Solving Systems of Linear Equations Algebraically 9.1 Solving Systems of Linear Equations by Substitution Outcomes: 1. Interpret algebraic reasoning through the study of relations 9. Solve
a. Yes, it is consistent. a. Positive c. Near Zero
 Chapter 4 Test B Multiple Choice Section 4.1 (Visualizing Variability with a Scatterplot) 1. [Objective: Analyze a scatter plot and recognize trends] Doctors believe that smoking cigarettes lowers lung
2-5 Solving Equations Containing Integers. Warm Up Problem of the Day Lesson Presentation Lesson Quizzes
 Warm Up Problem of the Day Lesson Presentation Lesson Quizzes Warm Up Use mental math to find each solution. 1. 7 + y = 15 2. x 9 = 9 3. 6x = 24 4. x 12 = 30 Problem of the Day Zelda sold her wet suit
Pre-Algebra Practice Exam Semester One
 Pre-Algebra Practice Exam Semester One Remember! Take a deep breath and relax while you go through the problems Do not assume on the exam that if your first answer choice is there, it is automatically
Grade 8. Functions 8.F.1-3. Student Pages
 THE NEWARK PUBLIC SCHOOLS THE OFFICE OF MATHEMATICS Grade 8 Functions 8.F.1-3 Student Pages 2012 2012 COMMON CORE CORE STATE STATE STANDARDS ALIGNED ALIGNED MODULES Grade 8 - Lesson 1 Introductory Task
6th Grade. Dependent & Independent Variables
 Slide 1 / 68 Slide 2 / 68 6th Grade Dependent & Independent Variables 2014-10-28 www.njctl.org Slide 3 / 68 Table of Contents Translating to Equations Dependent and Independent Variables Click on a topic
Algebra 1: Spring Semester Review
 Class: Date: Algebra 1: Spring Semester Review What is the solution of the system? Use a graph. 1. y = x + 2 y = 3x 1 a. c. b. d. 2. 4x + 3y = 12 2x + 3y = 18 3. y = x + 5 y = 5x 1 4. 5x + 4y = 9 4x +
Algebra 1 PAP Fall Exam Review
 Name: Pd: 2016-2017 Algebra 1 PAP Fall Exam Review 1. A collection of nickels and quarters has a value of $7.30. The value of the quarters is $0.80 less than triple the value of the nickels. Which system
October 5 th October 9 th. Unit 2: Equations & Inequalities
 Algebra I: Week 6 Math Packet October 5 th October 9 th Unit 2: Equations & Inequalities Jump Start Directions: Answer the Regents question below to the best of your ability. Solve the inequality below
NAME: DATE: SECTION: MRS. KEINATH
 1 Vocabulary and Formulas: Correlation coefficient The correlation coefficient, r, measures the direction and strength of a linear relationship between two variables. Formula: = 1 x i x y i y r. n 1 s
LESSON 2.1 ALGEBRAIC EXPRESSIONS
 LESSON 2.1 ALGEBRAIC EXPRESSIONS LESSON 2.1 ALGEBRAIC EXPRESSIONS 83 OVERVIEW Here s what you ll learn in this lesson: Simplifying Expressions a. Constants and variables b. Terms and coefficients c. Combining
Evaluate and Simplify Algebraic Expressions
 TEKS 1.2 a.1, a.2, 2A.2.A, A.4.B Evaluate and Simplify Algebraic Expressions Before You studied properties of real numbers. Now You will evaluate and simplify expressions involving real numbers. Why? So
Chapter Start Thinking! For use before Activity 6.1. For use before Activity Start Thinking! For use before Lesson
 . Enrichment and Etension. a =, b =. a =, b =. a =, b =. a =, b =. a =, b is an number ecept.. a =, b =. a =, b =. a =, b =. Check students work.. Puzzle PAY HIM Etension. Start Thinking! For use before
Keystone Exam Practice Test # 6
 Keystone Review Practice Test 6 Name: Date: Period: Keystone Exam Practice Test # 6 Part 1 Multiple Choice 1) When x = 2, which expression can be completely simplified to 4 5? A) 2 5x B) 2 10x C) 5 2x
12-1 Graphing Linear Equations. Warm Up Problem of the Day Lesson Presentation. Course 3
 Warm Up Problem of the Day Lesson Presentation Warm Up Solve each equation for y. 1. 6y 1x = 4. y 4x = 0 3. y 5x = 16 4. 3y + 6x = 18 y = x + 4 y = x 10 y = 5 x + 8 y = x + 6 Problem of the Day The same
4. Based on the table below, what is the joint relative frequency of the people surveyed who do not have a job and have a savings account?
 Name: Period: Date: Algebra 1 Common Semester 1 Final Review 1. How many surveyed do not like PS4 and do not like X-Box? 2. What percent of people surveyed like the X-Box, but not the PS4? 3. What is the
KS3 Scatter Diagrams. Levels 6 to 7.
 KS3 Scatter Diagrams. Levels 6 to 7. 1. Steve records the time taken and the average speed for several different journeys. This information is shown on the scatter graph. 5 4 Average speed (mph) 3 2 1.5
8 th Grade Algebra 5 Day Lesson Plan. *Computer* *Pan Scale* *Algebra Tiles* *Equation Mat* *TI-83 Plus/ TI-73* Karen Kmiotek
 8 th Grade Algebra 5 Day Lesson Plan *Computer* *Pan Scale* *Algebra Tiles* *Equation Mat* *TI-83 Plus/ TI-73* Karen Kmiotek Objectives Students will be able to solve equations by using algebra and the
You solved systems of equations algebraically and represented data using matrices. (Lessons 0-5 and 0-6)
") You solved systems of equations algebraically and represented data using matrices. (Lessons 0-5 and 0-6) Solve systems of linear equations using matrices and Gaussian elimination. Solve systems of linear
You solved systems of equations algebraically and represented data using matrices. (Lessons 0-5 and 0-6) Solve systems of linear equations using matrices and Gaussian elimination. Solve systems of linear
5.2.3 Systems of Equations (Substitution Method)
") Lesson: 5.2.3 Systems of Equations (Substitution Method) 5.2.3 Alternate Systems of Equations (Substitution Method) Teacher Lesson Plan CC Standards 8.EE.8b 8.EE.8c Solve systems of two linear equations
Lesson: 5.2.3 Systems of Equations (Substitution Method) 5.2.3 Alternate Systems of Equations (Substitution Method) Teacher Lesson Plan CC Standards 8.EE.8b 8.EE.8c Solve systems of two linear equations
6 th Grade - TNREADY REVIEW Q3 Expressions, Equations, Functions, and Inequalities
 6 th Grade - TNREADY REVIEW Q3 Expressions, Equations, Functions, and Inequalities INSTRUCTIONS: Read through the following notes. Fill in shaded areas and highlight important reminders. Then complete
4. Based on the table below, what is the joint relative frequency of the people surveyed who do not have a job and have a savings account?
 Name: Period: Date: Algebra 1 Common Semester 1 Final Review Like PS4 1. How many surveyed do not like PS4 and do not like X-Box? 2. What percent of people surveyed like the X-Box, but not the PS4? 3.
Equations. 2 3 x 1 4 = 2 3 (x 1 4 ) 4. Four times a number is two less than six times the same number minus ten. What is the number?
 4. Four times a number is two less than six times the same number minus ten. What is the number?") Semester Exam Review Packet *This packet is not necessarily comprehensive. In other words, this packet is not a promise in terms of level of difficulty or full scope of material. Equations 1. 9 2(n 1)
Semester Exam Review Packet *This packet is not necessarily comprehensive. In other words, this packet is not a promise in terms of level of difficulty or full scope of material. Equations 1. 9 2(n 1)
Analyzing Lines of Fit
 4.5 Analyzing Lines of Fit Essential Question How can you analytically find a line of best fit for a scatter plot? Finding a Line of Best Fit Work with a partner. The scatter plot shows the median ages
Intensive Math-Algebra I Mini-Lesson MA.912.A.2.3
 Intensive Math-Algebra I Mini-Lesson MA.912.A.2.3 Summer 2013 Functions and Relations Student Packet Day 1 Name: Date: Benchmark MA.912.A.2.3 Describe the concept of a function, use function notation,
New Vocabulary equivalent inequalities. x 1 4, 7 and x, 3 are equivalent inequalities.
 -. Plan - Solving Inequalities Using Addition and Subtraction Objectives To use addition to solve To use subtraction to solve Eamples Using the Addition Property of Inequality Solving and Checking Solutions
Functions. 4A Function Concepts. 4B Applying Functions
 Functions 4A Function Concepts 4-1 Graphing Relationships 4-2 Relations and Functions 4-3 Writing and Graphing Functions Lab Connect Equations, Tables, and Graphs 4B Applying Functions 4-4 Scatter Plots
Ready To Go On? Skills Intervention 2-1 Solving Equations by Adding or Subtracting
 Ready To Go On? Skills Intervention 2-1 Solving Equations by Adding or Subtracting Find these vocabulary words in Lesson 2-1 and the Multilingual Glossary. Vocabulary equation solution of an equation Solve
e. 0(4) f. 8/0 g. 0/15 h. (8/5)(6/4) 48 0 undefined 0
 f. 8/0 g. 0/15 h. (8/5)(6/4) 48 0 undefined 0") 1-1 Variables and Expressions 1. Approximately 85 20-ounce plastic bottles must be recycled to produce the fiberfill for a sleeping bag. a. Write an expression for the number of bottles needed to make
1-1 Variables and Expressions 1. Approximately 85 20-ounce plastic bottles must be recycled to produce the fiberfill for a sleeping bag. a. Write an expression for the number of bottles needed to make
Algebra 1 Fall Review
 Name Algebra 1 Fall Review 2013-2014 Date 1. Write an inequality to best represent the graph shown at right. (A.1.D.) m: b: inequality: 2. Write an inequality to best describe the graph shown at right.
Chapter 7 Summary. Key Terms. Representing Daily Life Situations Using Picture Algebra. Example
 Chapter 7 Summary Key Terms equation (7.1) Properties of Equality (7.2) solve an inequality (7.) Representing Daily Life Situations Using Picture Algebra Drawing a picture can be used to model a situation.
Name Date Class. 9. Simplify (8 + 1) 3 4. A 9 C A y = 1 2 x C y = x Solve d = 1 4. F 1 H 1 2 G 1 J 1 G 13
 3 4. A 9 C A y = 1 2 x C y = x Solve d = 1 4. F 1 H 1 2 G 1 J 1 G 13") Name Date Class Select the best answer. 1. Add 4.2 + ( 6.8). A 11 C 2.6 B 2.6 D 11 2. Subtract ( 2). F 7 H 3 G 3 J 7 4. A new park opened on Monday with 4 visitors. The manager estimates that the number
Name Date Class Select the best answer. 1. Add 4.2 + ( 6.8). A 11 C 2.6 B 2.6 D 11 2. Subtract ( 2). F 7 H 3 G 3 J 7 4. A new park opened on Monday with 4 visitors. The manager estimates that the number
Analyze Geometric Sequences and Series
 23 a4, 2A2A; P4A, P4B TEKS Analyze Geometric Sequences and Series Before You studied arithmetic sequences and series Now You will study geometric sequences and series Why? So you can solve problems about
5-3B Systems Review Puzzle
 5-3B Systems Review Puzzle x + y = 4 x y = -2 2x + y = -4 2x + 3y = 4 2x + y = 1 4x 2y = 6 2x + y = 1 x + y = 1 3x 2y = 4-2x + 2y = -1 x = -2y + 1 4 = x + y y = 2 2x x = y 5 y = 4 + 3x 2x + 1 = y x y =
Algebra 2 and Trigonometry
 Algebra 2 and Trigonometry Chapter 7: Exponential Functions Name: Teacher: Pd: 1 Table of Contents Day 1: Chapter 7-1/7-2: Laws of Exponents SWBAT: Simplify positive, negative, and zero exponents. Pgs.
6.2b Homework: Fit a Linear Model to Bivariate Data
 6.2b Homework: Fit a Linear Model to Bivariate Data Directions: For the following problems, draw a line of best fit, write a prediction function, and use your function to make predictions. Prior to drawing
2-2. Warm Up Lesson Presentation Lesson Quiz
 Warm Up Lesson Presentation Lesson Quiz Holt Algebra McDougal 1 Algebra 1 Warm Up Graph each inequality. Write an inequality for each situation. 1. The temperature must be at least 10 F. x 10 10 0 10 2.
ALGEBRA 1 UNIT 3 WORKBOOK CHAPTER 6
 ALGEBRA 1 UNIT 3 WORKBOOK CHAPTER 6 FALL 2014 0 1 Algebra 1 Section 6.1 Notes: Graphing Systems of Equations System of Equations: a set of two or more equations with the same variables, graphed in the
Interpreting Function Graphs
 Interpreting Function Graphs Algebra Understanding and interpreting graphs can be difficult. Uderstanding the relationship between the and y-ais is very important. Eample: The following graph shows the
Lesson 3. f(n) = 1 + 4(n 1) or f(n) = n. f(20) = 77. f(n) = 4-7(n 1) or f(n) = 11-7n. f(8) = -45. Exit Ticket Sample Solutions. a.
 = 1 + 4(n 1) or f(n) = n. f(20) = 77. f(n) = 4-7(n 1) or f(n) = 11-7n. f(8) = -45. Exit Ticket Sample Solutions. a.") Exit Ticket Sample Solutions 1. Write the first three terms in the following sequence. Write the explicit formula. a. for and,, f(n) = 9 5(n 1) or f(n) = 14 5n 2. Write an explicit formula for each sequence.
Exit Ticket Sample Solutions 1. Write the first three terms in the following sequence. Write the explicit formula. a. for and,, f(n) = 9 5(n 1) or f(n) = 14 5n 2. Write an explicit formula for each sequence.
Algebra 1, Chapter 4 Post Test
 Class: Date: Algebra 1, Chapter 4 Post Test Review 4.1.1: I can represent mathematical relationships using graphs. 1. (2 points) Sketch a graph of the speed of a city bus on a daily route. Label each section.
Name: Class: Date: ID: A. Find the mean, median, and mode of the data set. Round to the nearest tenth. c. mean = 8.2, median = 8, mode =7
 Class: Date: Unit 2 Test Review Find the mean, median, and mode of the data set. Round to the nearest tenth. 1. 4, 7, 8, 15, 1, 7, 8, 14, 7, 15, 4 a. mean = 7.5, median = 7, mode = 7 b. mean = 8.2, median
Grade 7 Mathematics Test Booklet
 Student Name P Grade Test Booklet Practice Test TEST BOOKLET SECURITY BARCODE Unit 1 Unit 1 Directions: Today, you will take Unit 1 of the Grade Practice Test. Unit 1 has two sections. In the first section,
Algebra I System of Linear Equations
 1 Algebra I System of Linear Equations 2015-11-12 www.njctl.org 2 Table of Contents Click on the topic to go to that section Solving Systems by Graphing Solving Systems by Substitution Solving Systems
Review: Expressions and Equations
 Review: Expressions and Equations Expressions Order of Operations Combine Like Terms Distributive Property Equations & Inequalities Graphs and Tables Independent/Dependent Variables Constant: a number
Pearson Learning Solutions
 Answers to Selected Exercises CHAPTER REVIEW OF REAL NUMBERS Section.. a. b. c.. a. True b. False c. True d. True. a. b. Ú c.. -0. a. b. c., -, - d.,, -, -, -.,., - e. f.,, -, -,, -.,., -. a. b. c. =.
Patterns and Functions. Write an algebraic expression for each phrase more than twice a number 2. a number divided by 4
 - Patterns and Functions -. Plan What You ll Learn To write a function rule To understand relationships of quantities in a function... And Why To find reasonable domain and range for real-world situations,
Algebra I. Systems of Linear Equations and Inequalities. Slide 1 / 179. Slide 2 / 179. Slide 3 / 179. Table of Contents
 Slide 1 / 179 Algebra I Slide 2 / 179 Systems of Linear Equations and Inequalities 2015-04-23 www.njctl.org Table of Contents Slide 3 / 179 Click on the topic to go to that section 8th Grade Review of
proportion, p. 163 cross product, p. 168 scale drawing, p. 170
 REVIEW KEY VOCABULARY classzone.com Multi-Language Glossary Vocabulary practice inverse operations, p. 14 equivalent equations, p. 14 identity, p. 156 ratio, p. 162 proportion, p. 16 cross product, p.
Algebra Semester 1 Final Exam Review Name: Hour: Date:
 Algebra Semester Final Exam Review Name: Hour: Date: CHAPTER Learning Target: I can appl the order of operations to evaluate expressions. Simplif the following expressions (combine like terms). x + x +
Lesson Lesson Tutorials
 7.4 Lesson Lesson Tutorials An equation in two variables represents two quantities that change in relationship to one another. A solution of an equation in two variables is an ordered pair that makes the
2-1 Integers and Absolute Value
 Write an integer for each situation. Identify its opposite and describe its meaning. 1. a bank withdrawal of $500 500; +500 or 500; a deposit of $500 2. a gain of 4 pounds +4 or 4; 4; a loss of 4 pounds
Systems of Equations Unit Five ONE NONE INFINITE
 Systems of Equations Unit Five ONE NONE INFINITE Standards: 8.EE.8 Analyze and solve pairs of simultaneous linear equations. a. Understand that solutions to a system of two linear equations in two variables
A function is a rule that establishes a relationship between two quantities, called
 1.7 An Introduction to Functions What you should learn GOAL 1 Identify a function and make an input-output table for a function. GOAL 2 Write an equation for a real-life function, such as the relationship
Linear Relations and Functions
 Linear Relations and Functions Why? You analyzed relations and functions. (Lesson 2-1) Now Identify linear relations and functions. Write linear equations in standard form. New Vocabulary linear relations
Based on the line of best fit, how many pizzas were sold if $ was earned in sales? A. 120 B. 160 C. 80 D. 40
 1. The graph below shows a line of best fit for data collected on the number of medium pizzas sold at local pizza shops and the amount of money earned in sales. Based on the line of best fit, how many
3.4 Solve Equations with Variables
 3.4 Solve Equations with Variables on Both Sides Goal p Solve equations with variables on both sides. Your Notes VOCABULARY Identity Example 1 Solve 15 1 4a 5 9a 2 5. Solve an equation with variables on
Exam III Review Math-132 (Sections 7.1, 7.2, 7.3, 7.4, 7.5, 7.6, 8.1, 8.2, 8.3)
") 1 Exam III Review Math-132 (Sections 7.1, 7.2, 7.3, 7.4, 7.5, 7.6, 8.1, 8.2, 8.3) On this exam, questions may come from any of the following topic areas: - Union and intersection of sets - Complement of
1 Exam III Review Math-132 (Sections 7.1, 7.2, 7.3, 7.4, 7.5, 7.6, 8.1, 8.2, 8.3) On this exam, questions may come from any of the following topic areas: - Union and intersection of sets - Complement of
1-4 Powers and Exponents
 Warm Up Lesson Presentation Lesson Quiz Warm Up Simplify. 1. 2(2) 4 2. ( 2)( 2) 4 3. ( 2)( 2)( 2) 8 4. 3(3)(3) 5. 27 4 9 Objective Evaluate expressions containing exponents. power base exponent Vocabulary
Test 3 Practice. 1) Solve the following equations. A)! " #$"% 24) = + ( x) Date Class
 Solve the following equations. A)! #$% 24) = + ( x) Date Class") Test 3 Practice Name 1) Solve the following equations. A)! " #$"% 24) = + ( 16 + 4x)!!, Date Class B) $ (32 40x) 5x = 11 ( 14 + 20x) + 9, C) 2(5x 7) + 15 = 2(4 8x) + 7 2) Write an algebraic equation for
Test 3 Practice Name 1) Solve the following equations. A)! " #$"% 24) = + ( 16 + 4x)!!, Date Class B) $ (32 40x) 5x = 11 ( 14 + 20x) + 9, C) 2(5x 7) + 15 = 2(4 8x) + 7 2) Write an algebraic equation for
0815AI Common Core State Standards
 0815AI Common Core State Standards 1 Given the graph of the line represented by the equation f(x) = 2x + b, if b is increased by 4 units, the graph of the new line would be shifted 4 units 1) right 2)
6th Grade. Translating to Equations. Slide 1 / 65 Slide 2 / 65. Slide 4 / 65. Slide 3 / 65. Slide 5 / 65. Slide 6 / 65
 Slide 1 / 65 Slide 2 / 65 6th Grade Dependent & Independent Variables 15-11-25 www.njctl.org Slide 3 / 65 Slide 4 / 65 Table of Contents Translating to Equations Dependent and Independent Variables Equations
Midterm Review Packet
 Algebra 1 CHAPTER 1 Midterm Review Packet Name Date Match the following with the appropriate property. 1. x y y x A. Distributive Property. 6 u v 6u 1v B. Commutative Property of Multiplication. m n 5
EOC FSA Practice Test. Algebra 1. Calculator Portion
 EOC FSA Practice Test Algebra 1 Calculator Portion FSA Mathematics Reference Sheets Packet Algebra 1 EOC FSA Mathematics Reference Sheet Customary Conversions 1 foot = 12 inches 1 yard = 3 feet 1 mile
Unit 1: Introduction to Variables
 Section 1.1: Writing Algebraic Expressions Section 1.2: The Story of x Section 1.3: Evaluating Algebraic Expressions Section 1.4: Applications Section 1.5: Geometric Formulas KEY TERMS AND CONCEPTS Look
Math 11 - Systems of Equations and Inequalities
 Name: Period: /30 ID: A Math 11 - Systems of Equations and Inequalities Multiple Choice Identify the choice that best completes the statement or answers the question. 1. (1 point) What system of equations
28 (Late Start) 7.2a Substitution. 7.1b Graphing with technology Feb 2. 4 (Late Start) Applications/ Choosing a method
 7.2a Substitution. 7.1b Graphing with technology Feb 2. 4 (Late Start) Applications/ Choosing a method") Unit 7: Systems of Linear Equations NAME: The calendar and all assignments are subject to change. Students will be notified of any changes during class, so it is their responsibility to pay attention and
Unit 7: Systems of Linear Equations NAME: The calendar and all assignments are subject to change. Students will be notified of any changes during class, so it is their responsibility to pay attention and
Solve Quadratic Equations by Completing the Square
 10.5 Solve Quadratic Equations by Completing the Square Before You solved quadratic equations by finding square roots. Now You will solve quadratic equations by completing the square. Why? So you can solve
{ y 4. Cumulative Test. 221 Holt Algebra 2. Name Date Class. Select the best answer. 1. Find the multiplicative inverse of
 Select the best answer. 1. Find the multiplicative inverse of 7. A C B D 7 7 2. The plan for a garden is shown below. What is the simplified expression for the perimeter of the garden? F 10a 2b G 10 a
Materials for assessing adult numeracy
 Materials for assessing adult numeracy Number Task Write this number in figures. Two hundred and seventy two thousand four hundred and twenty nine. In which of these numbers is the 7 worth seventy? Write
Grade Common Core Math
 th 5 Grade Common Core Math Operations and Algebraic Thinking Printable Review Problems Standards Included: -Use parentheses, brackets, or braces in numerical expressions, and evaluate expressions with
Systems of Linear Equations
 HW Mark: 10 9 8 7 6 RE-Submit Systems of Linear Equations This booklet belongs to: Period LESSON # DATE QUESTIONS FROM NOTES Questions that I find difficult Pg. Pg. Pg. Pg. Pg. Pg. Pg. Pg. Pg. Pg. REVIEW
Name Date Teacher Practice A
 Practice A Scatter Plots 1. Use the given data to make a scatter plot. Calories and Fat Per Portion of Meat & Fish Fat (grams) Calories Fish sticks (breaded) 3 50 Shrimp (fried) 9 190 Tuna (canned in oil)
MATHEMATICAL PROCESSES
 ? Name 8.3 Essential Question Multiplication and Division Equations How can you model and solve multiplication and division equations? Algebraic Reasoning 5.4.B MATHEMATICAL PROCESSES 5.1.F, 5.1.G Unlock
Today s Date: Finished by: 7 th Grade Math Final Exam Study Guide Exams: May 27-29
 NAME: Today s Date: Finished by: 7 th Grade Math Final Exam Study Guide Unit 7.1: Operations with Rational Numbers 1. Which number property describes the number sentence (17 x 3) x 20 = 17 x (3 x 20)?