ABSTRACT. Assistant Professor Elizabeth North Marine, Estuarine, and Environmental Sciences
|
|
|
- Shauna Flynn
- 5 years ago
- Views:
Transcription
1 ABSTRACT Title of Document: THE DISTRIBUTION OF CALLINECTES SAPIDUS MEGALOPAE AT THE MOUTHS OF CHESAPEAKE AND DELAWARE BAYS: IMPLICATIONS FOR LARVAL INGRESS. Jeffery Lee Biermann, Master of Science, 2008 Directed By: Assistant Professor Elizabeth North Marine, Estuarine, and Environmental Sciences Transport of Callinectes sapidus (blue crab) megalopae from the continental shelf into estuaries may influence recruitment variability of this economically important species. This research seeks to determine the vertical distribution of C. sapidus megalopae near the mouths of Chesapeake and Delaware Bays, and thereby infer swimming behaviors that may influence ingress to these estuaries. Megalopae and physical conditions were sampled at locations from ~10 km inshore of the estuary mouths to ~40 km offshore in coastal shelf waters in September 2005 and Megalopae were present in greater abundance and at shallower depths during night compared to day at all locations, suggesting a diurnal effect on distribution within the estuary and on the continental shelf. Unlike previous studies, offshore distributions did not indicate surface oriented behavior. Within the mouth of Delaware Bay, limited evidence suggests that megalopae presence in the upper portion of the water column increases in response to nocturnal flood tides. Results suggest photoinhibited swimming near the mouths of Chesapeake and Delaware Bays. In context of previous laboratory studies, these findings indicate that estuarine chemical cues at very low
2 concentrations may induce changes in megalopae behaviors and stimulate molting at least 40 km offshore of estuarine mouths. Results suggest wind-forcing and densityinduced subtidal flow are more likely mechanisms for ingress to Chesapeake and Delaware Bays than tidal-transport.
3 THE DISTRIBUTION OF CALLINECTES SAPIDUS MEGALOPAE AT THE MOUTHS OF CHESAPEAKE AND DELAWARE BAYS: IMPLICATIONS FOR LARVAL INGRESS. By Jeffery Lee Biermann Thesis submitted to the Faculty of the Graduate School of the University of Maryland, College Park, in partial fulfillment of the requirements for the degree of Master of Science 2009 Advisory Committee: Assistant Professor Elizabeth North, Chair Professor William Boicourt Professor Charles Epifanio Professor Michael Roman
4 Copyright by Jeffery Lee Biermann 2009
5 Acknowledgements I would like to thank my advisor Elizabeth North for all her assistance, guidance, and support throughout my graduate career. I am especially grateful for her help educating me in statistics and SAS software and for providing opportunities for me to gain experience in field operations, laboratory analyses, and computerized models. Her criticism of my work has been a valuable tool to guide me to improve as a scientist. I would like to thank Michael Roman for lending his laboratory and equipment in early operations as well his expertise throughout my graduate career. I would like to thank William Boicourt for providing valuable education and resources regarding physical processes and analytical techniques and his incredible patience with a seemingly endless onslaught of questions. And I would like to thank Charles Epifanio who has been an extraordinary resource of crab post larvae information. His expertise has helped tremendously in the design of this study, and his advice helped keep my analysis on track. In addition, I am especially grateful to Ana Dittel for taking the time to teach me sample enumeration methods and identification techniques of Callinectes sapidus larvae, and for all her and Dave Martel s work identifying and counting larvae in the time series samples. I am very grateful that I was aided in my own laboratory identification and enumeration by Tom Wazniak and Ginger Jahn, who provided great friendship as well. I thank Carole Derry for processing Scanfish data and helping me with ADCP data analysis techniques, and I thank Dave Kimmel and Jamie Pierson for listening to analysis ideas and providing feedback and help with statistical questions as well as zooplankton behavior. ii
6 I would also like to thank all the above mentioned people as well as Felipe Pimenta, J.T. Reager, and Krista Hozyash for help in field operations. I am also grateful for the hard work and dedication of the captains and crews of the RV Cape Henlopen and the RV Hugh R. Sharp. I thank Arnoldo-Valle Levinson and the late Richard Garvine for providing and processing data. Also, I thank Zack Schlag for his assistance in any analysis that required Fortran programming, and Jack Seabrease for fabricating equipment used in the field and in the lab. I thank Maggie Sexton for help with S Plus and plots in Microsoft Office 2007, proofreading early drafts, providing encouragement, and much more. I am grateful for my family that provides unwavering support. I have been lucky to have my older brother Nick to help me with academic questions throughout my entire life. My mother s enthusiasm and excitement for learning and science has surely motivated the careers of her sons. My brother and I seem to have inherited our father s stubbornness and analytical mind, both of which are crucial for success as a scientist. Lastly, I thank all my friends and colleagues at Horn Point Laboratory. Regardless of whether you re faculty or staff, work in science, the business office, or the maintenance department, your help and friendship was greatly appreciated and a vital part of this work. This research was funded by the National Oceanic and Atmospheric Administration SeaGrant, the National Science Foundation, a Maryland SeaGrant fellowship, and a Horn Point Laboratory education fellowship. iii
7 Table of Contents Acknowledgements... ii Table of Contents... iv List of Tables... v List of Figures... vi Chapter The distribution of Callinectes sapidus megalopae at the mouths of Chesapeake and Delaware Bays: implications for larval ingress... 1 Introduction... 1 Methods Megalopae collection Physical and Chemical Measurements Megalopae enumeration and analysis Statistical analysis Results Physical and chemical conditions Megalopae concentrations C. sapidus megalopae distribution in coastal waters C. sapidus megalopae distribution inshore of the bay mouth C. sapidus megalopae distributions from within bay mouth to coastal waters Discussion Conclusions Appendix I Figure AI Figure AI Appendix II Figure AII Appendix III Table AIII Table AIII Table AIII References iv
8 List of Tables Table 1. Mean concentration of C. sapidus megalopae found in studies with comparable sampling techniques, locations, and times of year as well as means for this study pooled by bay and year Table 2. Results of Kruskal-Wallis nonparametric test to determine if C. sapidus megalopae abundances (no. m -2 ) were significantly different during day versus night for time series and transect stations. Bold and starred P values (*) indicate significance at = Table 3. Results of ANOVA test to determine if C. sapidus megalopae standardized mean depths of occurrence were significantly different during day versus night for Delaware Bay time series and transect stations. An autoregressive model with temporal covariance is used for time series and a standard ANOVA is used for transect stations. Bold and starred P values (*) indicate significance at = Table 4. Results of Kruskal-Wallis nonparametric test to determine if C. sapidus megalopae abundances (no. m -2 ) were significantly different during nocturnal flood tide versus other conditions for time series and transect stations. Bold and starred P values (*) indicate significance at = Table 5. Results of ANOVA test to determine if C. sapidus megalopae standardized mean depths of occurrence were significantly different during nocturnal flood tide versus other conditions. An autoregressive model with temporal covariance is used for time series and a standard ANOVA is used for transect stations. Bold and starred P values (*) indicate significance at = v
9 List of Figures Figure 1. Locations of C. sapidus megalopae collections and Scanfish surveys in Chesapeake (a,c,e,g) and Delaware (b,d,f,h) Bays, USA, during a-d) September 2005 and e-f) Sepetmber Upper panels: locations where megalopae were collected with a MOCNESS at stations along a transect ( ) and in time series at fixed stations. CTD casts were conducted at each MOCNESS station. Lower panels: location of the Scanfish chemical and physical survey (black lines) Figure 2. CDOM and salinity from Scanfish surveys in Chesapeake Bay. a) CDOM (mg m -3 ) and b) salinity on September 12, c) CDOM (mg m -3 ) and d) salinity from September (Note: Zero indicates the location of the Chesapeake Bay mouth which was defined as the narrowest across the mouth. Negative values are landward of zero, positive values are seaward.) Figure 3. CDOM and salinity from Scanfish surveys in Delaware Bay. a) CDOM (mg m -3 ) and b) salinity on September 8, c) CDOM (mg m -3 ) and d) salinity from September (Note: Zero indicates the location of the Delaware Bay mouth which was defined as the narrowest point across the mouth. Negative values are landward of zero, positive values are seaward.) Figure 4. Mean temperature and salinity recorded during MOCNESS net tows, as measured with sensors attached to the MOCNESS. The size of the symbols corresponds to the concentration of megalopae (no. m -3 ) in each sample. Concentrations of zero are indicated ( ). Symbols are color-coded by estuary and year: Chesapeake Bay 2005 ( ), Chesapeake Bay 2006 ( ), Delaware Bay 2005 ( ), Delaware Bay 2006 ( ). (One sample with high concentrations (33.9 m -3 ) was not plotted due to missing temperature and salinity measurements.) Figure 5. Time series of megalopae concentrations (no. m -3 ), current velocities (cm s -1 ), and salinity at inshore (right panels a,b) and offshore stations (left panels c,d) near the mouth of Chesapeake Bay in Upper panels (a,c) show current velocities in the flood tide direction. Positive values indicate flood (i.e., into the estuary). Lower panels (b,d) contain plots of C. sapidus megalopae concentrations (round symbols with key to right) and salinity contour lines with intervals of 1. Night is indicated with shaded background, day is indicated by white background. Symbols for megalopae occur at the median depth of the net tow. An indicates that zero megalopae were collected in that tow. The maximum depth that the bottom net sampled is indicated ( - ). Time on the x-axis is local time (Eastern Standard Time).74 vi
10 Figure 6. Time series of megalopae concentrations (no. m -3 ), current velocities (cm s -1 ), and salinity at inshore (right panels a,b) and offshore stations (left panels c,d) near the mouth of Delaware Bay in Upper panels (a,c) show current velocities in the flood tide direction. Positive values indicate flood (i.e., into the estuary). The dashed line indicates estimated current velocities. Lower panels (b,d) contain plots of C. sapidus megalopae concentrations (round symbols with key to right) and salinity contour lines with intervals of 0.5. Night is indicated with shaded background, day is indicated by white background. Symbols for megalopae occur at the median depth of the net tow. An indicates that zero megalopae were collected in that tow. The maximum depth that the bottom net sampled is indicated ( - ). Time on the x-axis is local time (Eastern Standard Time) Figure 7. Chesapeake Bay. Time series plots of a,e) current velocity (solid line, cm s -1 ) and current acceleration (dashed line, cm s -2 ) in the flood tide direction, b,f) bottom salinity, c,g) C. sapidus megalopae abundance (no. m -2 ), and d,h) standardized mean depth of occurrence of megalopae. Left panels (a-d) include data from the inshore time series station. Right panels (e-h) include data from the offshore time series station. Night is indicated with shaded background, day is indicated by white background. Time is local Eastern Standard Time Figure 8. Delaware Bay. Time series plots of a,e) current velocity (solid line, cm s -1 ) and current acceleration (dashed line, cm s -2 ) in the flood tide direction, b,f) bottom salinity, c,g) C. sapidus megalopae abundance (no. m -2 ), and d,h) standardized mean depth of occurrence of megalopae. Left panels (a-d) include data from the inshore time series station. Right panels (e-h) include data from the offshore time series station. Night is indicated with shaded background, day is indicated by white background. Time is local Eastern Standard Time Figure 9. a) Mean abundance of C. sapidus megalopae (no. m -2 ) during day (white bars) and night (gray bars) at time series stations and at transect stations. Time series or transects in which abundance was significantly different ( = 0.05, Table 2) during day versus night are indicated ( * ). Error bars are one standard error of the mean. b) Box plot showing standardized mean depth of occurrence ( SMD ) of C. sapidus megalopae at Delaware Bay time series station and at transect station during day (white boxes) and night (gray boxes). Time series or transects in which depth was significantly different ( = 0.05, Table 3) during day versus night at are indicated (*). The center line in each box corresponds to the median and the upper and lower boundaries indicate 25 th and 75 th percentiles. Whiskers indicate minimum and maximum values. N.D.: no data vii
11 Figure 10. a) Mean abundance of C. sapidus megalopae (no. m -2 ) at nocturnal flood tide (NFT) and non-nft conditions at time series and transect stations. NFT abundance is indicated by gray bars and non-nft abundance is indicated by white bars. Time series or transects in which abundance was significantly different ( = 0.05, Table 4) during NFT versus non-nft are indicated ( * ). Error bars are one standard error of the mean. b) Box plot showing standardized mean depth of occurrence ( SMD ) of C. sapidus megalopae at time series stations and at transects stations during nocturnal flood tide (NFT; gray boxes) and non-nft (white boxes). The center line in each box corresponds to the median; the upper and lower boundaries indicate the 25 th and 75 th percentiles; whiskers show minimum and maximum values. Time series or transects in which abundance was significantly different ( = 0.05, Table 5) during NFT versus non-nft are indicated ( * ). N.D.: no data Figure 11. Chesapeake Bay transect stations sampled in September Left panels show results from sampling the transect during the day; right panels show results from sampling the transect during the night. Upper panels (a,c) show current velocities in the flood tide direction. Positive values indicate flood (i.e., into the estuary). Lower panels (b,d) contain plots of C. sapidus megalopae concentrations (round symbols with key to right) and salinity contour lines with intervals of 1. Night is indicated with shaded background, day is indicated by white background. Symbols for megalopae occur at the median depth of the net tow. An indicates that zero megalopae were collected in that tow. The maximum depth that the bottom net sampled is indicated ( - ). Time on the x-axis is local time (Eastern Standard Time). The location of the Chesapeake Bay mouth is 0 and is defined as the narrowest point between Cape Henry and Cape Charles (negative values are landward, positive values are seaward) Figure 12. Chesapeake Bay transect stations sampled in September Left panels show results from sampling the transect during the day; right panels show results from sampling the transect during the night. Upper panels (a,c) show current velocities in the flood tide direction. Positive values indicate flood (i.e., into the estuary). Lower panels (b,d) contain plots of C. sapidus megalopae concentrations (round symbols with key to right) and salinity contour lines with intervals of 1. Night is indicated with shaded background, day is indicated by white background. Symbols for megalopae occur at the median depth of the net tow. An indicates that zero megalopae were collected in that tow. The maximum depth that the bottom net sampled is indicated ( - ). Time on the x-axis is local time (Eastern Standard Time). The location of the Chesapeake Bay mouth is 0 and is defined as the narrowest point between Cape Henry and Cape Charles (negative values are landward, positive values are seaward) viii
12 Figure 13. Delaware Bay transect stations sampled in September Left panels show results from sampling the transect during the day; right panels show results from sampling the transect during the night. Upper panels (a,c) show current velocities in the flood tide direction. Positive values indicate flood (i.e., into the estuary). Lower panels (b,d) contain plots of C. sapidus megalopae concentrations (round symbols with key to right) and salinity contour lines with intervals of 0.5. Night is indicated with shaded background, day is indicated by white background. Symbols for megalopae occur at the median depth of the net tow. An indicates that zero megalopae were collected in that tow. The maximum depth that the bottom net sampled is indicated ( - ). Time on the x-axis is local time (Eastern Standard Time). The location of the Delaware Bay mouth is 0 and is defined as the narrowest point between Cape May and Cape Henlopen (negative values are landward, positive values are seaward) Figure 14. Delaware Bay transect stations sampled in September Left panels show results from sampling the transect during the day; right panels show results from sampling the transect during the night. Upper panels (a,c) show current velocities in the flood tide direction. Positive values indicate flood (i.e., into the estuary). Lower panels (b,d) contain plots of C. sapidus megalopae concentrations (round symbols with key to right) and salinity contour lines with intervals of 0.5. Night is indicated with shaded background, day is indicated by white background. Symbols for megalopae occur at the median depth of the net tow. An indicates that zero megalopae were collected in that tow. The maximum depth that the bottom net sampled is indicated ( - ). Time on the x-axis is local time (Eastern Standard Time) The location of the Delaware Bay mouth is 0 and is defined as the narrowest point between Cape May and Cape Henlopen (negative values are landward, positive values are seaward) ix
13 Chapter 1 The distribution of Callinectes sapidus megalopae at the mouths of Chesapeake and Delaware Bays: implications for larval ingress Introduction Callinectes sapidus (blue crab) is a commercially and recreationally important species in the Chesapeake and Delaware Bays and supports the highest value fisheries in the states of Delaware, Maryland, and Virginia (Kahn and Hessler 2005). Because of the fishery s dependency on recruitment of juvenile crabs (Miller et al. 2005), factors and processes that affect recruitment dynamics are of great interest to fishery managers and stakeholders of the C. sapidus fishery. One factor that may play a significant role in recruitment dynamics is the transport of megalopae (post-larvae) from the continental shelf into the estuary. The behaviors that megalopae exhibit at the mouth of an estuary may have a direct effect on their transport and the success of their ingress. The goal of this research is to determine the vertical distribution of C. sapidus megalopae near the mouths of Chesapeake and Delaware Bays, and thereby infer swimming behaviors that may influence their ingress. C. sapidus population trends and abundance levels differ between Chesapeake and Delaware Bay stocks during the 1990s to 2000s. Chesapeake Bay stock size decreased from , after which it stabilized at a below average level compared to average stock sizes prior to 1993 (CBSAC 2007). This decline is likely the consequence of overfishing (Miller et al. 2005). In contrast, estimates of Delaware 1
14 Bay stock size have shown a positive trend with slight increases since 1979 (Kahn and Hessler 2005). In addition to differences in trends, the absolute abundances differ between estuaries, with Chesapeake Bay populations approximately 1.5 times larger than Delaware Bay populations. The estimated abundance of adults was 122 million during in Chesapeake Bay (CBSAC 2007) and 70 million during 2002 in Delaware Bay (Kahn and Hessler 2005). Differences in trends and abundances between bays may be due to habitat availability, over-winter mortality, fishing pressure (Kahn and Hessler 2005, Miller et al. 2005), and, relevant to this study, the number of larvae that enter each estuary from the coastal ocean (Kahn and Hessler 2005) Because larvae require high salinities for development, C. sapidus populations in Chesapeake and Delaware Bays are dependent on larval exchange between the continental shelf waters and the estuary. Following mating, mature females store sperm in seminal receptacles and migrate to higher salinity waters near the bay mouth to spawn, producing 1,750,000 to 2,000,000 eggs (Van Engel 1958, Millikin and Williams 1984). Eggs hatch within days of fertilization, depending on temperature (Millikin and Williams 1984) and require salinities greater than for successful hatching (Costlow and Bookhout 1959, Davis 1965). Larvae also need salinities greater than 20 to develop through the seven stages of zoea, which takes days (Costlow and Bookhout 1959). Larvae then progress to the megalopae stage, which has duration of 6-12 days, depending on temperature and salinity (Costlow 1967, Sulkin and Van Heukelem 1986). Although survival and metamorphosis to juvenile stage is most successful at salinities near (Costlow 1967), C. sapidus 2
15 megalopae are capable of moderate hyperosmotic regulation and survival when acclimated at salinities ranging from (Ogburn 2008). After metamorphosis to the juvenile stage, individuals are capable of strong hypo- and hyperosmotic regulation (Guerin and Stickle 1997) and occur in waters ranging from polyhaline (salinity 18-30) to mesohaline (salinity 5-18; Hines 2007). After hatching near the estuary mouths, a combination of larval behavior and net flow of water out of the estuary result in transport of larvae into coastal waters. In the laboratory, early stage zoea exhibit negative geotaxis, increased swimming activity with increasing salinity, barokinesis, and positive phototaxis (Sulkin et al. 1980, Sulkin and Van Heukelem 1982). These behaviors would result in a near surface aggregation and transport of early larvae out of the estuary with surface currents. Field investigations confirm laboratory inferences: high abundances of early stage zoea have been found in surface waters of the inner continental shelf near Chesapeake and Delaware Bays (Smyth 1980, Dittel and Epifanio 1982, McConaugha 1988, Roman and Boicourt 1999). Once C. sapidus larvae enter coastal waters, physical mechanisms likely retain larvae near parent estuaries in the Middle Atlantic Bight (MAB) (Boicourt 1982, Johnson et al.1984, Epifanio et al. 1989, Roman and Boicourt 1999, Steppe and Epifanio 2006, Epifanio 2007, Tilburg et al. 2007). Surface water flow on the continental shelf in this region slowly transports water from north to south (Beardsley et al. 1976, Pape and Garvine 1982) and would therefore carry C. sapidus larvae away from parent estuaries (Epifanio 2007). However, seasonal, wind-driven, reversals of flow (Bumpus 1969) result in northward flowing surface water along the 3
16 inner shelf near Chesapeake and Delaware Bays (Boicourt 1982, Johnson et al.1984, Epifanio et al. 1989) that would transport larvae in the estuarine plumes seaward via Ekman transport (Roman and Boicourt 1999) and, once entrained in northward flowing inner shelf water, potentially north of parent estuaries (Boicourt 1982). After developing to megalopae, larvae must reenter the estuary to become part of the estuarine population; those that do not reenter the estuary are likely lost from the estuarine population. Because horizontal swimming speeds are much less than the horizontal current velocities (Epifanio 1988), megalopae ingress to estuaries likely occurs in conjunction with physical processes at the estuary mouth and may be related to the vertical swimming behavior of megalopae. Megalopae vertical swimming behaviors could influence dispersal and transport at the estuary mouth and, consequently, influence estuarine ingress by enabling larvae to take advantage of horizontal flows that could enhance transport into the estuary. C. sapidus megalopae can vertically swim to attain or maintain depths (Sulkin 1984) with average sustained swimming speeds of 5 cm s -1 (Luckenbach and Orth 1992). Vertical swimming behavior of other invertebrate larvae with weaker swimming speeds (<3 mm s -1 ) significantly influences dispersal in Chesapeake Bay according to biophysical model predictions (North et al. 2008). It is possible that C. sapidus megalope, with complex vertical swimming behaviors found in laboratory studies, could also influence their transport and dispersal. Because vertical position in the water column can have a significant influence on the horizontal transport of larvae (Norcross and Shaw 1984), understanding C. sapidus megalopae distributions at estuary mouths is important for determining how 4
17 transport mechanisms could facilitate ingress. Laboratory studies suggest that C. sapidus megalopae may remain near surface during the day in waters on the continental shelf but switch to diurnally and tidally timed vertical swimming within the estuary (Forward and Rittschof 1994, Tanskersley and Forward 1994, Forward et al. 1997). This near surface orientation of megalopae in coastal waters would place individuals in a position to be transported by wind-driven processes at offshore locations, which, if persisting into the estuary mouth, may allow for transport and ingress of megalopae (Goodrich et al. 1989). It should be noted that waters in the lower layers, and megalopae within them, can also move during wind-events. However, if C. sapidus megalopae vertical distribution changes near the mouth of Chesapeake and Delaware Bays, megalopae in lower layers could be influenced by other processes such as density induced sub-tidal flow (Roman and Boicourt 1999) or tidal transport (De Vries et al. 1994, Welch and Forward 2001). Describing the vertical distribution of megalopae at the estuary mouth will help determine which transport mechanisms are important for ingress and therefore help identify the physical factors that that control ingress and contribute to variability in C. sapidus juvenile recruitment. Laboratory studies indicate that C. sapidus megalopae have endogenous rhythms of vertical swimming but their response to light may differ between estuarine and coastal waters. Under constant dark conditions, megalopae were found higher in the laboratory chamber during the day and were found near bottom during the night (Tankersley and Forward 1994, Forward et al. 1997). This suggests that C. sapidus megalopae maintain an endogenous vertical swimming rhythm with peak activity 5
18 occurring during the day (Tankersley and Forward 2007). When exposed to light, C. sapidus megalopae that were collected and held in water from offshore were found near the surface of the laboratory chamber. When placed in estuarine water, megalopae exhibited a negative photoresponse (Forward and Rittschof 1994). This reduced swimming during the day in estuarine water is consistent with observations that C. sapidus megalopae are most abundant in the water column within estuaries during the night (McConaugha 1988, Mense and Wenner 1989, Little and Epifanio 1991). Results of laboratory studies also suggest that within estuaries C. sapidus megalopae may initiate vertical swimming in response to changes in salinity and turbulence that occur over the tidal cycle. Salinity increases greater than s -1 result in upward vertical swimming (Tankersley et al. 1995). Because salinity rates of change during estuarine flood tides can exceed this threshold, megalopae positioned on the bottom in estuaries may be cued to ascend in response to flood tides (Tankersley and Forward 2007). Decreases in salinity can inhibit swimming (Welch and Forward 2001). Changes in pressure can elicit response from megalopae. Increases exceeding mbar s -1 result in upward swimming (Tankersley et al. 1995); however, the pressure change during flood tides is less than this threshold (and therefore would not result in upward swimming), but pressure cues could be instrumental in maintaining depth near surface (Tankersley and Forward 2007). Turbulence is another physical factor that can cue megalopae swimming behavior. Megalopae ascend in response to increasing turbulence and descend in response to decreasing turbulence (Welch et al. 1999, Welch and Forward 6
19 2001). Continued turbulence maintains vertical swimming activity (Welch and Forward 2001). If appropriate salinity changes and turbulence occur with tidal cycle beyond estuary mouths, C. sapidus megalopae vertical distribution, and hence transport, may be influenced. Molt stage may also influence vertical swimming of C. sapidus megalopae. Immediately prior to metamorphosis to the juvenile phase, swimming behavior of premolt C. sapidus megalopae appears to change from peak activity during the day to peak activity during the night in laboratory studies (Forward et al. 2005; Forward et al. 2007). When placed in estuarine water, the time to metamorphosis is accelerated compared to megalopae in offshore water, and most larvae switch from activity during the day as premolt megalopae to activity during the night shortly after metamorphosis. When placed in offshore water, metamorpohosis may be delayed (Forward et al. 1994) and can be preceded by either a period of inactivity or activity during the night (Forward et al. 2007). The inactivity of some C. sapidus megalopae may cause them to remain on the bottom during the premolt stage in offshore waters (Forward et al. 2007). Some premolt C. sapidus megalopae can be active during night when placed in either estuarine or offshore water (Forward et al. 2005; Forward et al. 2007), suggesting that some portion of megalopae in the field may display diel vertical migration at locations within and offshore of estuary mouths. Wind-driven transport is one of the physical mechanisms that can return megalopae from offshore locations to settlement sites within estuaries (Epifanio and Garvine 2001, Epifanio 2007). In early autumn, when megalopae are common in shelf waters, the intensity of low pressure systems passing over the Middle Atlantic 7
20 region increases, creating southward wind events. Surface water is pushed by winds from NE to SW and as a result moves towards shore via Ekman transport (Roman and Boicourt 1999, Blanton et al. 1995, Epifanio 2007). Some studies have suggested that wind-driven events are a likely mode of C. sapidus megalopae ingress in the MAB (Goodrich et al. 1989, Little and Epifanio 1991, Jones and Epifanio 1995), and that the year-to-year variation in blue crab recruitment may be in large part due to physical inflow events (Sulkin and Epifanio 1986). In contrast, studies in Pamlico Sound have not found a correlation between wind and large scale recruitment, although episodic wind transport does appear to be correlated with small scale juvenile settlement patterns, (Etherington and Eggleston 2003). Vertical swimming behavior of megalopae could enhance ingress to estuaries because wind-driven transport would be most effective if megalopae occurred in surface layers (Goodrich et al. 1989). Density-induced subtidal flow may provide another transport mechanism for C. sapidus megalopae ingress (Sulkin and Epifanio 1986). Two layer estuarine circulation can be present 40 km seaward of the Chesapeake Bay mouth (Boicourt 1982), and net subtidal flow into the estuary can occur within 20 km of the Chesapeake Bay mouth (Roman and Boicourt 1999). Delaware Bay also has a two layer circulation and as a consequence has a residual flow that is landward at depth (Boicourt 1982, Sulkin and Epifanio 1986). During upwelling conditions, landward bottom flows can be enhanced, and with it the potential to transport organisms that occur in the lower layer is enhanced. Megalopae in the lower layer could be transported with the inflow and potentially use this mechanism for larval ingress. 8
21 Once within estuaries, nocturnal flood tide transport (NFTT) is believed to be the dominant mode of up-estuary transport for C. sapidus megalopae (Tankersley and Forward 2007), but may serve as a mode of ingress if it occurs far enough off the estuary mouth. NFTT may be the result of megalopae swimming responses to the combination of light, salinity, and turbulence as deduced by the laboratory studies described above. When undergoing NFTT, megalopae ascend in the water column in response to an increase in salinity during nocturnal flood tides (Tankersley et al. 1995), and turbulent kinetic energy during flood tide cues them to maintain swimming activity (Welch et al. 1999, Welch and Forward 2001). As turbulent energy decreases with slack tide, megalopae descend to the bottom (Tankersley et al. 2002). Ebb tides do not result in the appropriate increase in salinity that would cue their ascent, and light inhibits swimming during the day (Forward and Rittschof 1994, Tankersley et al. 1995). The combination of environmental cues could result in increased vertical swimming during nocturnal flood tides, which presumably results in a shallower depth of occurrence of megalopae and transport up-estuary during nocturnal flood tides. Previous field studies in the Middle Atlantic region indicate that megalopae vertical distribution differs between locations offshore and within estuaries. Collections from locations offshore of the Chesapeake Bay confirm laboratory predictions that megalopae occur in greatest abundance near the surface (Smyth 1980, McConaugha 1988). Although abundances could be higher during the night than during the day (Smyth 1980), both studies indicated that megalopae were located in surface waters on the continental shelf throughout the diurnal cycle. Within estuaries, 9
22 most megalopae were captured during nocturnal flood tides (Little and Epifanio 1991, De Vries et al. 1994). This result is consistent with the NFTT mechanism. However, a study within the Chesapeake Bay mouth suggested that megalopae may undergo a diel vertical migration pattern, occurring near the surface during night and near the bottom during day, with no relation to tidal phase (McConaugha 1988). C. sapidus megalopae behavior at estuary mouths is still uncertain, and as such the mechanisms of megalopae ingress are still unclear. Understanding the mechanism of C. sapidus megalopae ingress is an important factor for understanding inter-annual variability of recruitment. The overall goal of this study was to describe the vertical distribution of C. sapidus megalopae at the mouth of Chesapeake and Delaware Bays, and thereby infer which behavior patterns influence the ingress of megalopae at the mouths of these estuaries. Three main objectives and hypotheses structured this research program. The first objective of this study was to describe the abundance and vertical distribution of megalopae in coastal waters outside of Chesapeake and Delaware Bays during day and night and flood and ebb tides. It was hypothesized that C. sapidus megalopae would occur near the surface at all times in these locations The second objective of this study was to describe abundance and vertical distribution patterns of C. sapidus megalopae at locations within the mouth of Chesapeake and Delaware Bays. It was hypothesized that at these locations, C. sapidus megalopae would occur in greatest abundance and at shallowest depths during nocturnal flood tides, consistent with NFTT. The third objective of this research was to determine the vertical distribution of megalopae at stations along a transect that extended from inshore to offshore. It was hypothesized 10
23 that an abrupt change in vertical distribution would occur near the plume front where there is a strong gradient in estuarine chemical cues, such that vertical distributions that were consistent with NFTT would be found inshore of the plume front, and surface-oriented distributions would be found offshore. Methods To address these hypotheses, two major types of sampling strategies were employed: 1) a time series of repeated sampling at fixed stations in continental shelf waters and within the mouths of Chesapeake and Delaware Bays, and 2) transects of stations that extended between the inshore and offshore locations. High-speed physical surface mapping of salinity was used to determine the location of the estuarine plume so that each transect included both plume and shelf waters. Fixed time series stations were located at the ends of the transects. The inshore locations of the transect and time series stations were located where inflow to the estuary was expected to be highest. The offshore locations of the transect and offshore time series stations were located in shelf waters where salinity values ranged between Sampling for this study included collections of C. sapidus megalopae as well as physical and chemical measurements at the mouths of Chesapeake and Delaware Bays. Delaware Bay was sampled September 7, 2005 September 11, 2005 (Fig. 1b,d), on the 120 ft RV Cape Henlopen, and September 6, 2006 September 7, 2006, (Fig. 1f,h) on the 146 ft RV Hugh R. Sharp. Chesapeake Bay was sampled September 12, 2005 September 13, 2005 (Fig. 1a,c) and September 3, 2006 September 6, 2006 (Fig. 1e,g) on the RV Cape Henlopen and RV Hugh R. Sharp, respectively. 11
24 Megalopae collection Megalopae were collected using a 0.25 m 2 Multiple Open Closing Nekton Environmental Sampling System (MOCNESS) equipped with 333- m plankton nets. The MOCNESS sampled 3-5 depth intervals depending upon the depth of the station. Most stratified oblique tows were 5 minutes in duration, fished 2-7 m in depth, and filtered an average of m 3. Collections conducted in 2006 contained an additional net that sampled only the neuston layer in addition to the 3-5 depths sampled. Samples collected with the MOCNESS were preserved in 4% formaldehyde and returned to the laboratory for analysis. Megalopae were collected every 1.25 hrs for 26 hours at a time series station that was 5.5 km inshore of the Delaware Bay mouth on September 8-9, 2005 (Fig. 1b). For the purposes of this study the location of Delaware Bay mouth is defined as the narrowest distance between across the bay mouth. In addition, megalopae were collected every 1.25 hrs for 26 hrs at a time series station located 13 km offshore of the Delaware Bay mouth on September 9-10, 2005 (Fig. 1b). The Chesapeake Bay time series stations were sampled in Megalopae were collected every 1.25 hrs for 22 hrs at time series stations that were located 25 km offshore and 6 km inshore of the Chesapeake Bay mouth on September 3-4 and 4-5, respectively (Fig. 1e). The location of the Chesapeake Bay mouth is defined as the narrowest distance across the bay mouth. Megalopae were collected at stations along a transect that extended from inshore to offshore (Fig. 1a,b,e,f). In the Delaware Bay, stations were located every 2-4 km along two sampling transects that extended from 6 km inshore to 10 km 12
25 offshore of Delaware Bay mouth in 2005 (Fig. 1b). In 2006, Delaware Bay stations were located every 4-8 km along two transects that extended from 10 km inshore and 30 km offshore of the mouth (Fig. 1f). In the Chesapeake Bay in 2005, megalopae were collected every 4-7 km at stations along two transects that extended from 6 km inshore to 18 km offshore the Chesapeake Bay mouth (Fig. 1a). In 2006, the first sampling transect extended from 5 km inshore to 25 km offshore the Chesapeake Bay mouth. The second extended 5 km inshore to 42 km offshore to ensure that the offshore station was located outside of the plume which had moved offshore. Sampling stations were located every 4-7 km along the transects (Fig. 1e). Physical and Chemical Measurements Salinity, temperature and CDOM. Information on the physical and chemical properties of the water was collected to help identify the physical factors that could cue megalopae behavior and result in differences in vertical distributions between stations. Measurements of physical conditions were conducted concurrent with megalopae collections at the time series and transect stations. The MOCNESS was equipped with sensors that measured temperature and salinity at the depth of the net tows. Also, a conductivity temperature depth (CTD) profile cast was conducted before each megalopae collection (Fig. 1a,b,e,f). CTD data was bin averaged every 0.5 meters and compared to MOCNESS temperature and salinity values to ensure compatibility between instruments. High-resolution measurements of salinity and colored dissolved organic matter (CDOM) were taken along the transects using a towed undulating CTD (Scanfish) equipped with a Wet Labs CDOM sensor (Fig. 1c,d,g,h). CDOM was 13
26 chosen as an indicator of estuarine chemicals because it displays an inverse relationship with salinity and, as such, is indicative of a terrestrial source (Hernes and Benner 2003). CDOM values were calculated from voltage measurements and converted to mg m -3 using provided conversion factors (Wet Labs user manual). The Chesapeake Bay Scanfish surveys conducted in 2005 and 2006, and the Delaware Bay Scanfish survey conducted in 2006, occurred immediately following the first MOCNESS transect and immediately before the second MOCNESS transect. In Delaware Bay in 2005, the Scanfish survey occurred immediately before the first transect. In most cases, megalopae collections at the transect stations occurred between 30 min and 10 hrs of the Scanfish surveys. However, in Delaware Bay in 2005, megalopae collections in the second transect occurred hrs after the Scanfish survey. Salinity and temperature measured with the CTD as well as CDOM and salinity measured with the Scanfish were contoured using a kriging gridding method with an isotropic linear variogram model (Surfer Software). Grid-line geometry for contour plots of CTD data from time series stations was 1 m in the depth direction and 1 hour in the time direction. Grid-line geometry for contour plots of CTD data from transect stations was 1 m in the depth direction and half of the mean distance between MOCNESS/CTD stations in the along-transect direction. Grid-line geometry for contour plots of Scanfish data was 1-m in depth direction and 1 km in the along-transect direction. Current velocity. Current velocities were measured with a 600 khz hull mounted Acoustic Doppler Current Profiler (ADCP). First, the direction of flood tide 14
27 was calculated. ADCP data was bin averaged in1 meter depth-intervals and every 2 min. Shallowest ADCP bins were meters below the surface. The principle axis direction of flood tide ( ) was calculated using vertically averaged current velocities (north =V, east =U ) and the following equation (Boicourt personal communication June 15, 2007): 2 2 [1] 0.5 arctan 2 UV / U V For both Chesapeake and Delaware Bays, the mean of the inshore and offshore time series was used to define the flood tide direction for the entire bay mouth. The direction of flood tide was used to calculate current velocities in the flood tide direction at each MOCNESS sampling station. ADCP measurements at middepth and concurrent with the MOCNESS collections were averaged at 6 min intervals and in1 m bins. Missing ADCP measurements due to a rating less than 100% good or equipment error were estimated using existing ADCP values (Appendix I). The mid level bin was considered an adequate representation of current velocities because the time lag between peak tidal currents at the surface and bottom was less than the time duration between MOCNESS samples (Appendix I). The instantaneous rate of current acceleration was obtained from the derivative of a sinusoidal function fit to the current velocity. Flood tides were defined as current velocities that were at or exceeded 5 cm s -1. This value was selected to ensure that estuarine inflow current velocities exceeded swimming speeds of C. sapidus megalopae, which have a mean sustained swimming speed of 5 cm s -1 in still water and can actively swim against velocities <4.8 cm s -1 (Luckenbach and Orth 1992). 15
28 Light. Light at the water s surface was measured with a photosynthetically active radiation meter as part of the surface mapping system on board the RV Cape Henlopen in 2005 and with a Li-Cor light sensor (model LI-190SA) on board the RV Hugh R. Sharp in Day and night classification was conducted using the US Naval Observatory predicted sunrise and sunset times at the latitude and longitude of sample collection and was verified using onboard light measurements. Day was defined as 20 minutes post-sunrise to 20 minutes pre-sunset. Night was defined as 20 minutes post-sunset to 20 minutes pre-sunrise. 20 minutes pre-sunrise to 20 minutes post-sunrise was defined as dawn, and 20 minutes pre-sunset to 20 minutes post sunset was defined as dusk. To compare the light available to megalopae at the bottom in Chesapeake and Delaware Bays in 2006, first light attenuation coefficients ( k ) were calculated using the following equation (Kirk 1994): [2] k I ln I z o z 1 where I z = light intensity at depth z, I o = light intensity at surface. Data for calculating k was measured with a profiling reflectance radiometer system (Biospherical Instruments Inc. PRR-600) that was deployed just before MOCNESS collections at the inshore and offshore stations in Chesapeake and Delaware Bays. Calculations for k were conducted using readings at a wavelength of 510 nm because it was closest available to the C. sapidus maximum wavelength for visual absorbance (505 nm, Cronin and Forward 1988). To calculate the light available to C. sapidus megalopae in Chesapeake and Delaware Bays, I z was calculated by rearranging 16
29 Equation 2 and setting z equal to the maximum depth sampled at the inshore and offshore time series stations and setting I o equal to the maximum light intensity at the surface measured in Megalopae enumeration and analysis C. sapidus megalopae were identified using a key for decapod larvae (Sandifer 1972) and a description of megalopae morphology (Costlow and Bookhout 1959). Due to preservation in formaldehyde, no attempt was made to classify megalopae stage as intermolt or premolt. Megalopae in transect samples were enumerated at University of Maryland Center for Environmental Science Horn Point Laboratory using a complete census of the sample. The concentration of megalopae ( C i, no. m -3 ) in each sample was calculated by simply dividing by the volume filtered. Time series samples were processed at the University of Delaware College of Marine and Earth Studies using a Folsom plankton splitter to subdivide samples and a table of random numbers to select the subsample that was analyzed (Dittel and Epifanio 1982). Concentrations were calculated by multiplying megalopae numbers by the split fraction and dividing by the volume filtered. Megalopae concentrations were plotted to identify how their vertical distributions changed over the tidal and day/night cycles and along transects. In addition, megalopae abundances were calculated at each station to determine how the total number of megalopae in the water column changed over time and along the length of the transects. Megalopae abundance (no. m -2 ) at each time series and 17
30 transect station ( ABUND ) was calculated using the station and the depth interval ( ) of each sample (eqn. 3): [3] ABUND C i i i C i from depth stratified samples at Volume filtered measurements were derived from the MOCNESS flowmeter. Due to equipment failure in 2005, 78 of 273 of the volume filtered measurements were estimated using a regression equation. This equation was fit to 246 measurements of volume filtered (R 2 = 0.56) and included variables for boat speed and current velocities in the net tow interval (Appendix II). Current velocity measurements were not available for an additional 15 sample nets with missing volume filtered measurements. For these nets, values were estimated as the mean of the volume filtered values measured in the other nets at the same station (Appendix II). To compare the vertical distribution of megalopae at stations with different depths, a standardized mean depth of occurrence ( SMD ) for C. sapidus megalopae was calculated for each station using (eqn. 4): where 1 [4] Ci id i SMD h C i i C i is megalopae concentration (no. m -3 ) of each net tow, i is the depth interval (m) of each net tow, d i is the midpoint depth (m) for each net tow, and h is the total water depth (m) that was sampled at the station. 18
31 Statistical analysis Exploratory analyses were conducted to investigate whether physical factors (light, current velocity, salinity, temperature, and CDOM) could influence megalopae abundance and vertical distribution. Examination of megalopae concentration post maps, contour plots, and scatter plots revealed no clear association with salinity, temperature and CDOM. Further in-depth statistical analyses focused on light and current velocity because megalopae concentrations and abundances appeared to vary in relation to these variables. Two main statistical analyses were conducted to test if 1) day/night patterns and 2) nocturnal flood tides explained a significant amount of variability in megalopae abundances and standardized mean depth of occurrence. Preliminary analyses of day/night variability in the time series of megalopae abundances (no. m -2 ) indicated that data for one of the four time series did not pass ANOVA assumptions (Appendix III). However, for three time series, an ANOVA model that included a temporal covariance structure (PROC MIXED, SAS v. 9.1) did pass the assumptions and the results agreed with the non-parameteric Kruskal-Wallis test (Table AIII.1). The Kruskal-Wallis test was then assumed to be valid for all time series analyses of day and night abundances. For consistency, the Kruskal-Wallis test also was used to compare abundances of megalopae found at day and night in transects (SAS 9.1 PROC NPAR1WAY). Transect data was pooled for each bay and independence was assumed because transect stations were located further apart than the size of C. sapidus larval patches which range from 0.5 to 2.5 km in size (Natunewicz and Epifanio 2001). For both time series and transect data, day and night were coded as a 19
32 dichotomous variables (1=day, 0=night), and dawn and dusk stations were not considered in this analysis. Significance test were conducted at the =0.05 level. Statistical tests were also conducted to determine if day versus night explained a significant amount of variability in the vertical distribution of megalopae. For time series data from Delaware Bay, an ANOVA model of SMD versus day/night with a simple temporal covariance structure passed model assumptions (Appendix III). Delaware Bay transect stations were pooled, and because they were considered independent, a non-autoregressive ANOVA was used (SAS 9.1 PROC MIXED). Dawn and dusk stations were excluded from this analysis and day and night were coded as a dichotomous variable (1=day, 0=night). Because megalopae were not captured at most (n = 20 of 23) Chesapeake Bay stations during the day, no day-night comparison of vertical distributions was possible for the Chesapeake Bay time series or transects. A second set of statistical analyses were conducted to determine if nocturnal flood tides accounted for a significant amount of variability in the abundances and vertical distributions of megalopae. For these tests, NFT was coded as a dichotomous variable. Stations classified as both night and flood were coded as 1 and all other stations were coded as 0. The Chesapeake offshore time series was not included in these analyses because sampling did not occur during NFT. For abundance data, preliminary parametric ANOVA analyses indicated that 2 of the 3 time series data sets did not pass ANOVA assumptions (Appendix III). The results of the one parametric ANOVA analysis that included temporal autocorrelation structures and passed ANOVA assumptions agreed with the results of a Kruskal- 20
33 Wallis non-parametric test of the same data (PROC MIXED, SAS v. 9.1). Kruskal- Wallis tests were used to determine if megalopae abundances were significantly higher during NFT than during other times at the three times series stations. Transect stations were pooled by bay, and a Kruskal-Wallis test also was applied (SAS 9.1 PROC NPAR1WAY). Differences in the SMD of megalopae between NFT and other times at time series stations were tested using an ANOVA model fit with a simple temporal covariance structure (SAS 9.1 PROC MIXED). For transect stations, a nonautoregressive ANOVA model was used for data from transect stations pooled for each bay. All models passed ANOVA assumptions (heterogeneity of variance and Shapiro-Wilk tests) except for the model with Chesapeake Bay transects which passed the heterogeneity test but not normality (PROC UNIVARIATE, SAS v.9.1). Additional statistical analyses were conducted to determine if there was a difference between light attenuation coefficients between bays and if there was a difference between megalopae concentrations in the neuston and in other depth intervals in coastal waters. Means of the light attenuation coefficients from 2006 in Chesapeake Bay and Delaware Bay inshore time series were compared using a twosample t-test (SAS 9.1 PROC TTEST). This procedure was repeated for offshore time series light attenuation coefficient values. Data passed model assumptions. Megalopae concentrations C i (no. m -3 ) from the Chesapeake offshore time series in 2006 (the only offshore time series of this study with neuston-specific sample nets) were tested to determine if concentrations were higher in the neuston than other depth intervals. Depth intervals were coded as a dichotomous variable (1=Neuston, 0 = 21
34 other net tow depths). Surface net tow concentrations were excluded from this analysis because the surface net was fished in the neuston for part of the tow. Because data did not pass parameteric model assumptions, a Kruskal-Wallis test was used (SAS 9.1 NPAR1WAY). Results Physical and chemical conditions Scanfish surveys indicate that the water column was highly stratified at the time of sampling in the Chesapeake Bay in 2005 and 2006, with lowest salinities occurring in surface waters of the deep channel, which focuses outflow from the Chesapeake (Fig. 2b,d). Salinity and CDOM contours had the same spatial pattern with highest CDOM values occurring at lowest salinities. The plume was more extensive in 2006 than in In 2005, salinity and CDOM concentrations of ~27 and ~ 6 mg m -3, respectively, were located ~8 km from the Bay mouth. In 2006, these same salinities and CDOM values were found ~25 km seaward of the bay mouth, likely due to more in freshwater flow in summer 2006 compared to summer 2005 (U. S. Geological Survey, In Delaware Bay, Scanfish surveys indicated that the water column was less stratified and salinities were higher in 2005 and 2006 (Fig. 3) compared to Chesapeake Bay. During both surveys in Delaware Bay, contours of salinity and CDOM were similar, and the highest CDOM values occurred at the lowest salinities. Conditions were more stratified at the Delaware Bay mouth in 2005 compared to 2006, and salinities in offshore waters were higher. In 2005, maximum CDOM and 22
35 minimum salinities occurred at the surface from ~ 0 to 2 km landward of the bay mouth. In 2006, similar values were found ~ 10 km landward of the bay mouth. Light extinction coefficients ( k ) were calculated and compared between Delaware and Chesapeake Bays to determine if C. sapidus megalopae at similar depths were exposed to different levels of light. There was no significant difference in k values at inshore time series stations between Chesapeake (mean = m -1, std = 0.15) and Delaware Bays (mean = m -1, std = 0) (Two sample t-test, P = 0.963, n = 7 SAS 9.1 PROC TTEST). There was no significant difference in k values at offshore time series stations between Chesapeake (mean = m -1,std = 0.054) and Delaware Bays (mean = m -1, std = 0.087) (Two-sample t-test, P = 0.277, n = 7; SAS 9.1 PROC TTEST; Figure 4). There was a marked difference in depth between the two estuaries which resulted in different light levels at the deepest depths where megalopae were collected. Using the maximum light intensity at the surface in 2006 ( mol s -1 m -2 ) and mean k values, the intensity of light of 510 nm wavelength was calculated at the mean maximum depth sampled for C. sapidus megalopae. The maximum possible light intensities at the deepest depths were 8.71 mol s -1 m -2 at 9.5 m, mol s -1 m -2 at 10.9 m, mol s -1 m -2 at 18.9 m, and mol s -1 m -2 at 37.7 m for the Chesapeake inshore, Chesapeake offshore, Delaware inshore, and Delaware offshore time series, respectively. In summary, water depths were shallower in Chesapeake Bay, and light levels were orders of magnitude higher at the locations of the deepest megalopae collections compared to light levels where the deepest megalopae were collected in Delaware Bay. 23
36 Megalopae concentrations Concentrations of C. sapidus megalopae generally ranged from 0 to ~ 10 (no. m -3 ), with maximum values of 33.9 and 34.4 no. m -3. Mean concentrations were slightly lower than mean concentrations from previous studies (Table 1). There was a significant difference in concentrations between Chesapeake and Delaware Bays (Kruskal-Wallis, 2 (1) = 10.40, P = 0.001; SAS 9.1 PROC NPAR1WAY), with mean concentration greater in Chesapeake Bay (0.80 no. m -3 ) than Delaware Bay (0.52 no. m -3 ). No pattern in concentrations was apparent with respect to temperature or salinity (Fig. 4). C. sapidus megalopae distribution in coastal waters Megalopae abundances and vertical distribution patterns varied over the daynight and tidal cycles in coastal waters at the offshore time series locations (Figs. 5d and 6d). No C. sapidus megalopae were found in day samples at the Chesapeake offshore time series station (Fig. 5d); few were found in day collections at the Delaware offshore station (Fig. 6d). The highest concentrations of C. sapidus megalopae occurred during the night in both Chesapeake and Delaware Bay offshore time series. Peak concentrations at night occurred at different stages in the tidal cycle and at different depths. In Chesapeake Bay, peak concentration occurred near surface at ebb tide (Fig. 5c). In the Delaware Bay, highest megalopae concentrations occurred in bottom samples (Fig. 6d) during slack to ebb tide (Fig. 6c). The depth of maximum concentrations changed throughout the night at the offshore station of both estuaries. At the Chesapeake offshore station, megalopae concentrations occurred at greater depth several hours after sunset (Fig. 5d), 24
37 coinciding with slack and flood tide (Fig. 5c). At the Delaware Bay offshore station, a change in depth of maximum concentration occurred between the hours of 0:00 and 06:00 (local time) (Fig. 6d), corresponding to the time of the shift from slack to ebb tide (Fig. 6c). In addition, the depth of maximum concentration increased from sunset to the end of the time series at 02:00. This corresponds to transition from slack to flood tide (Fig. 6c). The Chesapeake Bay offshore time series was the only offshore time series that included a net tow specifically to sample neuston. Concentrations found in the neuston were not significantly greater than concentrations found in the middle and lower layers (Kruskal-Wallis; 2 (1) = 0.441, P = 0.507, n = 30; SAS 9.1 PROC NPAR1WAY). C. sapidus megalopae were significantly more abundant (no. m -2 ) during the night than during the day at the offshore stations in both Chesapeake (Fig. 7g) and Delaware (Fig. 8g) Bays (Fig. 9a, Table 2). Notably, no megalopae were collected during day at the offshore Chesapeake Bay time series station. Day-night differences in the vertical distribution of megalopae at the offshore station were not apparent. At the Delaware Bay station, there was no significant difference in SMD between day and night (ANOVA; Table 3, Fig. 9b). This test could not be conducted for the collections in the Chesapeake Bay offshore time series because no megalopae were captured during day. C. sapidus abundance and SMD were examined in relation to physical variables associated with tides at the offshore time series locations of Chesapeake and Delaware Bays. In Chesapeake Bay, a peak in abundance (Fig. 7g) and shallow SMD 25
38 (Fig. 7h) occurred immediately following sunset during the time of minimum current acceleration (Fig. 7e). In Delaware Bay, the peak in abundance in mid-morning (8:45 local time) corresponds with maximum positive current acceleration (Fig. 8e). Bottom salinity values did not fluctuate with the tides at offshore station of either bay (Fig. 7e,f, Fig. 8e,f) nor was there was an association between peaks in abundance or SMD and near-bottom salinity values (Fig. 7f,g,h, Fig. 8f,g,h). At the Delaware Bay offshore station, SMD is highly variable during day and shows little relationship to physical variables (Fig. 8h). However, during the night, SMD shows less variability and could correspond to current velocities, occurring shallowest near peak flood tide and deeper during slower and ebbing current velocities (Fig. 8e,h). Statistical analyses were conducted to test if abundances and SMD were significantly different during nocturnal flood tides (NFT) versus during other times. No collections of megalopae occurred during NFT conditions in the Chesapeake offshore time series, and as such, it was not included in these analyses. Megalopae abundances were significantly higher during nocturnal flood tide at the Delaware Bay offshore time series station (Kruskal-Wallis; Table 4, Fig. 10a), but SMD at the Delaware Bay station was not different during NFT compared to other times (ANOVA; Table 5, Fig.10b). C. sapidus megalopae distribution inshore of the bay mouth Megalopae abundances and vertical distribution patterns varied over the daynight and tidal cycles at the inshore time series locations. (Figs. 5b and 6b). At the Chesapeake Bay inshore time series location, higher concentrations of C. sapidus megalopae were observed during the night than during the day. During the night, 26
39 peak concentrations in Chesapeake Bay occurred at slack tide after flood just after sunset and during flood tide just prior to sunrise (Fig. 5a,b). In the Delaware Bay, C. sapidus megalopae were largely absent from day samples except at four stations, where relatively high concentrations were found in the lower half of the water column (Fig. 6b). During the night, peak concentrations shifted from shallow to deep as the current velocities changed from flood to ebb tide (Fig. 6a). Abundance (no. m -2 ) of C. sapidus megalopae in the Chesapeake Bay inshore time series collections was significantly higher during the night than during the day (Kruskal-Wallis; Table 2, Fig. 7c, 9a). Although 73% of daytime net tow samples did not contain megalopae compared to 37.5% of nighttime tows, there was no statistically significant difference in abundances between night and day at the Delaware Bay inshore time series (Kruskal-Wallis; Table 2, Fig. 8c, 9a), likely due to the high concentrations in the lower half of the water column at mid-day (Fig. 6b). Although there was no clear signal of diurnal differences in abundance at the Delaware Bay inshore location, standardized mean depth of occurrence ( SMD ) was significantly deeper during the day than at night (ANOVA; Table 3, Fig. 8d,9b). The analysis of SMD data for the inshore location in Chesapeake Bay was not conducted because too few samples contained megalopae during the day. Abundance and SMD of C. sapidus megalopae at inshore locations were examined in relation to physical variables associated with tidal cycle. Positive peaks in abundance for the Chesapeake Bay inshore time series corresponded with flood tides (Fig. 7a,c), however SMD did not display any particular pattern in relation to tidal cycle or associated physical variables (Fig. 7a,b,d). There was no relationship 27
40 between peaks in abundance or SMD and salinity values at the bottom of the water column in Chesapeake Bay inshore time series (Fig. 7b,c,d), and bottom salinity values did not correspond with tidal stage (Fig. 7a,b). In contrast, bottom salinities did change in accordance with tidal current velocities at the Delaware Bay inshore time series location (Figure 8a,b) and relatively high megalopae abundances were observed when bottom salinity values were increasing. During the day, SMD was highly variable and showed little relationship to physical variables (Figure 8a,b,d). During the night, SMD showed less variability and may have corresponded with the tidal cycle, occurring shallowest near peak flood tide and deeper during slack and ebb tide (Figure 8a,d), with one notable exception around midnight. Abundances observed during NFT were significantly higher at the Chesapeake Bay inshore time series compared with other abundances (Kruskal- Wallis; Table 4, Fig. 10a). The NFT abundance in the Delaware Bay inshore time series was not significantly different than at other times. There was a significant difference in SMD at NFT for the Delaware Bay inshore time series (ANOVA; Table 5, Fig. 10b), in which C. sapidus megalopae occurred shallower at NFT and deeper at non-nft. There was no significant difference in SMD at nocturnal flood tide at the Chesapeake inshore time series (ANOVA; Table 5, Fig. 10b). C. sapidus megalopae distributions from within bay mouth to coastal waters Concentrations of megalopae were analyzed from transects of stations that extended from inshore to offshore to identify whether vertical distributions changed along the transect in relation to physical and chemical variables and the diurnal and tidal cycles. These results were compared to results from the inshore and offshore 28
41 time series station to identify the presence, or absence of, changes in vertical distributions. Consistent with results from the inshore and offshore time series locations, C. sapidus megalopae were generally absent from samples during the day and present during the night for the entire length of the transects in Chesapeake Bay. During the day, no megalopae were collected in 30 of 35 net tows (Figs. 11b,12b). When megalopae were present, concentrations were low (< 0.4 no. m -3 ). During the night, megalopae were present in all samples in relatively low concentrations except in the deep channel ~ 2 km seaward of the bay mouth in 2005 (Fig. 11d). A Kruskal-Wallis ANOVA indicates the C. sapidus megalopae occurred in significantly greater abundance at night than during the day in the Chesapeake Bay transects (Table 2, Fig. 9a). In contrast with the near absence of megalopae in Chesapeake Bay, megalopae were present in Delaware Bay transect collections during day, and their concentrations tended to increase with depth (Fig. 13d, 14d). Megalopae were present in all samples collected during the night and in 77% of samples collected during the day. In 2005, highest concentrations occurred during night seaward of the bay mouth (Fig. 13d), whereas they occurred landward of the bay mouth in 2006 (Fig. 14d). When combined in a statistical analysis, the abundance of C. sapidus megalopae was not significantly different during day compared to night at the Delaware Bay transect stations (Kruskal-Wallis; Table 2, Fig. 9a). Although abundances were not different at these stations, SMD was significantly deeper during day that during night (ANOVA; Table 3, Fig. 9b). 29
42 C. sapidus megalopae abundances and vertical distributions at the transect stations did not appear to change systematically in relation to the tidal cycle. In the Chesapeake Bay transect samples, peak concentrations of megalopae occurred during ebb in 2005 (Fig. 11) and during flood in 2006 (Fig. 12). At the Delaware Bay transect stations, high concentrations of megalopae were found at different stages of the tide, from flood (Fig. 13) to ebb (Fig. 14). When analyzed in relation to NFT, abundances observed during NFT were not significantly different in the Chesapeake Bay or Delaware Bay transects than abundances during other conditions (Kruskal- Wallis; Table 4, Fig.10a). In addition, there was no significant difference in SMD at NFT in the Chesapeake Bay and the Delaware Bay transect stations (ANOVA; Table 5, Fig. 10b). Discussion Results of this research suggest that abundances and vertical distributions of C. sapidus megalopae can vary in relation to the diurnal cycle at the mouths of Chesapeake and Delaware Bays. When the diurnal pattern was evident, abundances tended to be higher, and vertical distributions tended to be deeper during the day than at night. Although these patterns were not present in all time series and transect collections, they did occur from the most inshore stations (~10 km inside the mouths) to those furthest offshore (~40 km outside the mouth). In addition, there is some evidence for a tidal effect on vertical distribution within the mouth of Delaware Bay that is consistent with nocturnal flood tide transport. Contrary to previous field studies and laboratory predictions, C. sapidus megalopae were not found to be most abundant in the neuston in coastal waters. 30
43 Mean megalopae concentrations collected during this study tended to be lower than were generally observed in previous studies of Chesapeake Bay (Smyth 1980, McConaugha 1988) and Delaware Bay (Little and Epifanio 1991; Table 1). The extremely low concentrations of megalopae in the Chesapeake Bay during the day are due to the high number of samples in which no megalopae were present. The concentrations observed in Chesapeake Bay during night and in Delaware Bay during day and night more closely resemble the lowest concentrations observed by previous studies (Table 1). It is apparent that this study did not sample dense patches of C. sapidus megalopae that have been previously reported (Smyth 1980, McConaugha 1988, Little and Epifanio 1991). However, in this study, megalopae were collected from a large portion of the water column rather than at one discrete depth as in Smyth s (1980) and Little and Epifanio s (1991). In the presence of vertical migration, sampling at multiple depths may increase the amount of water sampled that did not contain high concentrations of megalopae and thereby reduce the overall mean concentration compared to the mean of samples taken at a discrete depth. The concentrations are nevertheless low and may reflect differences in sampling gear, sampling strategies, and/or a real decline in the numbers of megalopae in coastal waters that could be related to the decline in blue crab populations in Chesapeake Bay (Miller et al. 2005). This study assumes that behaviors and processes governing vertical distributions observed in these low concentrations are the same as those that would be observed for high concentrations of C. sapidus megalopae. Results suggest that megalopae undergo diurnal vertical migration at the mouths of both Chesapeake and Delaware Bays, although the signature of this 31
44 migration differs between bays. In the Chesapeake Bay, C. sapidus megalopae were found to be more abundant during the night than during the day. In the Delaware Bay, abundance either differed with the diurnal cycle (offshore stations) or the depth at which megalopae occurred was deeper during day than night (inshore and transect stations). Low abundances and deeper mean depths of occurrence of C. sapidus megalopae during the day is likely an effect of individuals occurring at depths deeper than were sampled, or descending out of the water column and settling on the bottom. Light is known to inhibit C. sapidus megalopae swimming in the presence of estuarine chemicals and induce megalopae to rest on the bottom of the experimental chamber (Forward and Rittchoff 1994). The more consistent diurnal signal in abundance at the mouth of Chesapeake Bay compared to Delaware Bay may have resulted because light levels were much higher near bottom in Chesapeake Bay than in Delaware Bay. Although light attenuation is similar in Chesapeake Bay and Delaware Bay, the depths encountered in Chesapeake Bay were generally shallower, and as a result, the light levels were higher where the deepest net tows were located. Although the differences observed between C. sapidus megalopae abundances during the day compared to night are likely real, net avoidance due to visual detection during day could result in similar patterns and cannot be completely ruled out. Megalopae use visual cues for predator avoidance (Diaz et al. 1999) and swim with C. sapidus megalopae can swim an average sustained speed of 5 cm s -1 with short bursts in excess of 20 cm s -1 (Luckenback and Orth 1992). It may be within their power to avoid the opening of a 0.25 m 2 net if they displayed directed swimming to avoid the net. However, the because MOCNESS was towed at speeds much faster 32
45 (mean: 139 cm s -1 ) than megalopae burst speeds, it is unlikely that net avoidance could account for the entire day/night pattern in the data. In addition, if megalopae were actively avoiding nets, nets towed with higher speeds should be more successful in capturing them, but no relationship between net tow velocity and megalopae concentrations was found (F=0.44, P=0.5093, n=223). Finally, C. sapidus megalopae were present in samples collected during the day in the Delaware Bay and showed no difference in abundance during the day and night at the Delaware Bay inshore time series and the Delaware Bay transects. Because there was no significant difference in light extinction coefficients in Chesapeake Bay and Delaware Bay, light availability was similar between estuaries, and therefore light-related predator avoidance responses should also be similar. Relatively high concentrations of C. sapidus megalopae were collected at depths of 7-10 m during the day in Delaware Bay (Fig. 14b), suggesting that the gear was effective at catching megalopae at depths >7 m in both estuaries because light levels were the similar between estuaries. Although the possibility of gear escapement at shallower depths cannot be ruled out, the fact that megalopae were captured near the surface in similar low concentrations during both day and night at stations > 10 km offshore in Delaware Bay (Fig. 14b) suggests that changes in megalopae distributions and abundances were not an artifact of the sampling techniques that was used. Diel vertical migration patterns have been found in previous field studies at the mouths of Chesapeake and Delaware Bays that used different modes of collection at discrete depths (e.g., 30.5 cm Clarke-Bumpus open-closing plankton samplers, 60 cm bongo nets, pumps). McConaugha (1988) found that C. sapidus megalopae 33
46 occurred deeper during the day than at night at stations within the Chesapake Bay mouth. Little and Epifanio (1991) found greater abundances during the night than during the day within the Delaware Bay. In addition, Smyth (1980) reported higher concentrations in the neuston at night than at day on all but one research cruise, during which cruise concentrations were greater during daylight in shelf waters off of Chesapeake Bay. Although changes in C. sapidus megalopae abundance and vertical distributions appeared to coincide with nocturnal flood tides in some cases, evidence does not strongly support NFTT. The abundance of C. sapidus megalopae was greater during NFT than during other conditions at the Chesapeake inshore time series location and at the Delaware offshore time series location. Also, C. sapidus megalopae occurred at shallower depths during NFT at the Delaware Bay inshore time series. Although these findings suggest that megalopae could utilize nocturnal flood tide transport for ingress to the estuary, the clear diurnal effect combined with the inherent variability in megalopae concentrations (i.e., patchiness) makes it difficult to detect a combined tidal and diurnal cycle effect. In addition, bottom salinities, a presumed cue for NFTT (Tankersley et al. 1995), were not present at locations where NFT patterns in abundance existed (Figs. 7b, 8f). However, changes in SMD at the Delaware Bay inshore time series location could be linked to salinity cues that could induce activity during nocturnal flood tides. The bottom salinity at this station tracked the tidal cycle (Fig. 8b), the salinity changes exceeded the threshold required to induce swimming ascent (Tankersley et al. 1995), and C. sapidus megalopae were significantly shallower during NFT than at other times. 34
47 Although the overall result may be more indicative of a diurnal effect, results at this station are consistent with NFT, and as such, the NFTT ingress mechanism cannot be ruled out for inshore locations of Delaware Bay. Previous studies in continental shelf waters reported that C. sapidus megalopae were found most frequently in the neuston (McConaugha 1988, Smyth 1980). In this study, C. sapidus megalopae were not more abundant in neuston in coastal waters off of Chesapeake Bay in Previous studies reporting C. sapidus megalopae concentration distributions in continental shelf waters sampled km offshore (Smyth 1980, McConaugha 1988), whereas the furthest offshore time series stations in this study were 25 km (Chesapeake) and 13 km (Delaware). Sample locations confined closer to the bay mouth in this study may have higher concentrations of estuarine chemicals than the previous studies which could have resulted in the differences in megalopae vertical distributions between this and previous studies. When interpreting results in the context of laboratory studies, C. sapidus megalopae collected in this study could have been 1) intermolt megalopae that were recently exposed to estuarine cues and display swimming suppression in response to sunlight (Forward and Rittchoff 1994), 2) premolt megalopae that have already changed swimming rhythm (Forward et al. 2005), or 3) some combination of premolt megalopae and intermolt megalopae exposed to chemical cues. CDOM was considered a proxy for the estuarine chemicals that may cue changes in megalopae behavior. Salinity and CDOM are closely associated in Chesapeake and Delaware Bay, as has been shown in other aquatic environments (Hernes and Benner 2003). It is apparent that the estuarine chemical influence at the 35
48 mouth of Chesapeake Bay can extend far out on the continental shelf with large freshwater plumes, as was the case during sampling in 2006 when CDOM in excess of 8 mg m -3 was present at the surface 24 km seaward of the bay mouth (Figure 2c,d). Similar CDOM values, and thus similar estuarine chemical influences, were found no more than 4 km seaward of the Delaware Bay mouth (Figure 3c). If estuarine chemicals are causing intermolt megalopae to exhibit photoinhibited swimming behavior, then the occurrence of a diurnal pattern in megalopae distributions that was generally consistent from inshore to offshore suggests that the threshold required to induce this change in behavior could be lower than the concentrations that were observed in this study. In other words, the most offshore stations may not have been located in waters without sufficient estuarine chemicals to influence behavior. Salinities sampled at offshore time series stations were lower than salinity (34.5) from which offshore megalopae were collected for laboratory work examining the influence of estuarine chemicals (Forward and Rittschof 1994, Forward et al. 1994). Alternatively, samples collected in this study may have contained a large amount of premolt C. sapidus megalopae in which swimming behavior had ontologically shifted from a diurnal cycle with most active swimming during day to a diurnal cycle with most active swimming at night. Different molt stages sampled might partially explain why Smyth (1980) found high concentrations of C. sapidus megalopae in the neuston in most years, but found the reverse in one year of his study. The presence of premolt megalopae may also explain why a small portion of C. sapidus megalopae were found at depth at night in McConaugha s (1988) study. 36
49 However, it is not clear if premolt megalopae could make up a significant proportion of the plankton because estuarine chemical cues that cue a change in their behavior also rapidly induce molting to the juvenile instar stage. Nevertheless, identifying megalopae molt stage should be considered an important part of future research into C. sapidus megalopae distribution, behavior, and recruitment. This study suggests that C. sapidus swimming behavior at the mouths of Chesapeake and Delaware Bays could result from either an endogenous rhythm with a diurnal cycle of premolt megalopae or exogenous photoinhibition of intermolt megalopae. Laboratory results indicate that endogenous swimming rhythms of C. sapidus megalopae vary according to the diurnal cycle (Tankersley and Forward 1994) in contrast to other crab megalopae such as Uca spp. (Tankersley and Forward 1994) and Carcinus maenas (Zeng and Naylor 1996a,b), which display endogenous swimming rhythms associated with the tidal cycle. However, upon exposure to exogenous tidal cues (De Vries et al. 1994) within estuaries, C. sapidus megalopae distribution is related to the tidal cycle (Olmi 1994) indicating flood tides are used for transport up estuary. This suggests that at offshore locations without strong salinity cues, C. sapidus megalopae may be more reliant on wind-driven or density driven processes to facilitate ingress to estuaries instead of NFTT. Once C. sapidus megalopae have entered the estuary and encountered a sufficient salinity signal, exogenous cues may facilitate tidal transport. Although C. sapidus megalopae do not appear to undergo NFTT outside the estuary, species in which megalopae have endogenous swimming rhythms in relation to the tidal cycle may benefit from weak 37
50 offshore tidal rhythms augmenting ingress, as exemplified by Carcinus maenas (Zeng and Naylor 1996a) and Uca spp. (Epifanio et al. 1988). Because a clear NFT signal was not found in vertical distributions, results of this study indicate that C. sapidus recruitment to Chesapeake and Delaware Bays may be facilitated by wind-driven or density-driven processes instead of tidal transport. This result is consistent with inferred recruitment mechanisms for C. sapidus in the Mississippi Bight (Perry et al. 1995, 2003). In Mississippi sound, settlement of C. sapidus megalopae has been correlated with onshore wind-forcing events as well as spring tide events (Perry et al. 1995). In addition, wind forcing has been identified as an important factor for returning C. sapidus megalopae to near shore habitats in the Mississippi Bight (Perry et al. 2003). The present study does not support flood tide transport for estuarine ingress as was suggested for C. sapidus megalopae which recruit through a narrow inlet into Pamlico Sound in North Carolina (Forward et al. 2004). Conclusions The first hypothesis of this study stated that C. sapidus megalopae would occur near the surface at all times at offshore locations on the continental shelf and show no evidence of differing vertical distribution between day and night. Evidence from this study does not support this hypothesis. C. sapidus megalopae were not found at higher concentrations in the neuston offshore of the Chesapeake Bay and were more abundant during day than at night (implying vertical migration) at offshore locations of the Delaware and Chesapeake Bays. 38
51 The second hypothesis of this study stated that C. sapidus megalopae would exhibit distributions consistent with nocturnal flood tide transport at locations within the estuary. Results of this study do not refute this hypothesis; however, the results do not lend strong support either. Abundances (Chesapeake) and vertical distributions (Delware) at inshore locations were consistent with NFTT; however, this may be indistinguishable from diurnal effect. Also, physical variables observed at inshore stations in Chesapeake Bay indicate that changes in salinity with tidal cycle may not be adequate to induce vertical swimming behavior in accordance with NFTT at the landward extent of study transects in the Chesapeake Bay. The final hypothesis of this study stated that vertical distributions of C. sapidus megalopae would indicate that a switch in behavior from surface oriented to NFTT behavior would occur in association with the freshwater plume of the estuary and estuarine chemicals contained within. The results of this study do not support this hypothesis. A diurnal effect on C. sapidus megalopae distribution was found to extend for the entire length of the study area from within the bay to the continental shelf. No change in distribution indicative of a behavior shift was observed. This suggests that estuarine chemical concentrations necessary to induce photoinhibition could be quite dilute, as would occur at the furthest offshore stations, or that premolt megalopae may make up a significant portion of the samples. This study has demonstrated that a diurnal effect on distributions of C. sapidus megalopae occurs at the mouths of Chesapeake and Delaware Bays, in which megalopae are found to be more abundant and at shallower depths during the night compared to the day. This diel vertical migration pattern was observed from 6 km 39
52 inshore of the Delaware Bay mouth to 13 km offshore and from 6 km inshore of the Chesapeake Bay mouth to beyond 25 km offshore. Distributions observed may be indicative of C. sapidus megalopae molt stage or an extremely low threshold of estuarine cues required to induce a photoinhibited swimming response. Future work should consider molt stage of C. sapidus megalopae to resolve the mechanisms underlying megalopae swimming behavior. 40
53 Appendix I Methods for calculating: estimates of current velocities for missing ADCP values, instantaneous rate of current acceleration, and tidal phase lag between the shallowest and deepest ADCP readings in Chesapeake and Delaware Bays. Estimates of missing Acoustic Doppler Current Profiler (ADCP) values and current accelerations at time series locations were calculated from mid level bin ADCP measurements rotated to flood tide direction ( ). Measurements were fit to a sinusoidal function for each time series location in Chesapeake and Delaware Bays (S-Plus 8; Figure AI.1). Generally, the sinusoidal functions fit the data well: r 2 = 0.96 for the inshore Chesapeake Bay location (n = 177) (Fig. AI. 1a), r 2 = 0.81 for the Chesapeake Bay offshore time series (n = 192) (Fig. AI. 1b), r 2 = 0.99 for the Delaware Bay inshore time series (n = 161) (Fig. AI. 1c), and r 2 = 0.95 for the Delaware Bay offshore time series (n = 259) (Fig. AI. 1d). Estimates for missing ADCP values were obtained by solving the sinusoidal function at the time (t ) of the missing value. Instantaneous rates of current acceleration were obtained from the derivative of the fit current velocity sinusoidal function at appropriate t. The tidal phase lag between surface and bottom currents was calculated to determine if the use of mid-depth currents was an adequate representation of current velocities throughout the water column for the purposes of analysis of megalopae concentrations. ADCP measurements were analyzed for a tidal phase lag between the shallowest and the deepest measurement using the Chesapeake Bay inshore time series and the Delaware Bay inshore time series. In the Chesapeake Bay inshore time series, the shallowest bin was at 5.1 meter depth and the deepest bin was at 11.1 meter depth. The shallowest bin in the Delaware Bay inshore time series was at
54 meter depth and the deepest bin was at 16.1 meter depth. Data rated 100% good were rotated to. Data below this rating were not considered. Measurements were fit to a sinusoidal function for surface bin and for bottom bin (S-Plus 8; Fig. AI.2). Chesapeake inshore time series most shallow bin (n = 160) was fit to a function with r 2 = (Fig. AI.2a), and Chesapeake inshore time series deepest bin (n = 150) was fit a to a function with r 2 = Delaware Bay inshore time series shallowest bin (n = 160) was fit to function r 2 = (Fig. AI. 2b), and the deepest bin from Delaware Bay inshore time series (n = 148) was fit to a function r 2 = The differences in time of local relative extrema, indicative of tidal phase, between shallowest and deepest bins were calculated from the fitted equations. There was a phase lag of 28.6 minutes between shallowest and deepest bins in Chesapeake Bay and a phase lag of 21.6 minutes between surface and bottom bins in Delaware Bay. Because the temporal resolution of MOCNESS collections was ~75 minutes, which was much longer than the phase lags observed, the phase lag was not considered in further analysis and the mid-depth layer bins were considered an adequate representation of current velocities. 42
55 Figure AI.1. Sinusoidal functions fit to existing current velocity (cm s -1 ) measurements from ADCP ( ). Measurements are from a mid-depth layer bin and have been rotated to flood tide current direction. (Positive values indicate current vector into or up estuary, negative values indicate current vector out of or away from the estuary.) Gray line is the function that was fit to the data. Time is local Eastern Standard Time. a) Chesapeake Bay inshore time series. b) Chesapeake Bay offshore time series. c) Delaware Bay inshore time series. d) Delaware Bay offshore time series. 43
56 Figure AI. 2. Sinusoidal functions fit to current velocities (cm s -1 ) from ADCP measurements. Measurements from top bin are indicated ( ) with fitted function (gray line). Measurements from bottom bin are indicated ( ) with the fitted function (black line). Measurements have been rotated to flood tide current direction. (Positive values indicate current vector into or up estuary, negative values indicate current vector out of or away from the estuary.) a) Chesapeake Bay inshore time series. b) Delaware Bay inshore time series. 44
57 Appendix II Methods for estimating volume filtered for missing values from 2005 MOCNESS collections Of the samples collected in 2005, 93 net tows out of 273 did not have an associated volume filtered measurement due to failure of the MOCNESS flowmeter. Acoustic Doppler Current Profiler (ADCP) data was available for 248 of the 273 net tows. Net tow locations, ADCP measurements, and values from net tows with valid volume filtered measurements were used to estimate volume filtered for nets with no measurement available. Distance traveled in each net tow ( D ) was calculated using the start and end location of each net tow. Displacement of the ship ( D ) was calculated from ADCP current velocity vector and the time duration of net tow. Displacement of the ship by the currents was subtracted from the distance the ship traveled to calculate an index of volume filtered ( I vf ), (eqn AII.1). s a [AII.1] I vf D s D a A linear regression of I vf values to values from net tows with valid volume filtered measurements in 2005 provided a significant model (n=169, P < , F = 89.20) with r 2 = (SAS 9.1 PROC REG; Figure AII.1a). Cook s D statistic of 0.5 was used to identify and remove 2 outliers, resulting in a significant model with a greater coefficient of determination (n =167, P <0.0001, F=209.00, r 2 =0.5588; SAS 9.1 PROC REG; Figure AII.1b). The resultant linear regression equation was used to estimate volume filtered values for 77 net tows with no flowmeter volume filtered values but for which I vf could be calculated. 45
58 The index of volume filtered estimation procedure could not be applied to 15 net tows because ADCP data was not available for these net tows. For these 15 tows, the duration of the net tow was calculated and multiplied by the mean volume filtered per net tow duration of the other net tows at the same station. This mean value provided an estimate of the volume of water filtered per time at the same tidal stage and ship speed as the net tow with missing flowmeter readings. 46
59 Figure AII. 1. a) Linear regression of the Index of Volume Filtered and volume filtered calculated from the existing flowmeter measurements. b) Linear regression of the Index of Volume Filtered and volume filtered calculated from the existing flowmeter measurements with two outliers removed. 47
60 Appendix III Methods for choosing and applying non-parametric tests to compare means of time series The assumption of sample independence may not be valid for analysis of data from time series stations, yet in some cases, parametric models that include temporal covariance structures that account for the lack of independence did not fit the data. The following comparison of parametric and nonparametric models is conducted to determine if the use of nonparametric models (that do not account for temporal covariance) could bias analysis results A preliminary comparison of the abundances of megalopae found in day and night at each time series location was conducted, in each bay, with an ANOVA autoregressive model with simple covariance structure for time (SAS 9.1 PROC MIXED). Day and night were coded as a dichotomous variable (1=day, 0=night). Dawn and dusk stations were not considered in this analysis. Abundance data was log e transformed to provide best fit to assumptions of Gaussian distribution and heterogeneity of variance of residuals, which was checked using Shapiro-Wilk and Pearson s Correlation respectively (SAS 9.1). Even with the transformed abundance, no fit was achieved for the Chesapeake offshore time series. Best fit was achieved for Delaware inshore time series. Because no fit was found for the Chesapeake offshore station, Wilcoxon two-sided and Kruskal Wallis non-parametric tests were used to assess the abundance at day and night (SAS 9.1 PROC NPAR1WAY). Kruskal-Wallis significance results at = 0.05 agree for the ANOVA autoregressive model with simple structure 48
61 covariance for time and the non-parametric tests with fit models (Table AIII.1). Because tests accounting for temporal autocorrelation agree with Kruskal-Wallis tests when model fit is best, non-parametric tests were considered valid assessments of day and night for time series data. Preliminary analysis with an ANOVA autoregressive model with simple temporal covariance structure was conducted to compare SMD of day and night for time series stations in Delaware Bay (SAS 9.1 PROC MIXED). Again, day and night were coded as a dichotomous variable (1=day, 0=night,) and dawn and dusk stations were excluded from this analysis. Inshore and offshore time series passed Pearson s correlation test for homogeneity of variance, but offshore time series did not conform to Gaussian distribution (Shapiro-Wilk test, W = 0.88, P = 0.017; SAS 9.1). Nonparametric test results of time series stations (Wilcoxon two-sided and Kruskal- Wallis; SAS 9.1 PROC NPAR1WAY) at = 0.5, were compared to the parametric results (Table AIII.2). Because non-parametric and parametric test results did not agree, non-parametric test results were not considered valid for time series SMD daynight comparisons. Because the homogeneity of variance assumption was fulfilled for both inshore and offshore time series and distribution of residuals did not appear highly skewed in the offshore times series, the parametric test was considered adequate, and the parametric test was used for Delaware Bay time series. A preliminary analysis of C. sapidus megalopae abundance in NFT and under other conditions was conducted using an autoregressive model with simple temporal covariance structure for Chesapeake Bay inshore, Delaware Bay inshore, and Delaware Bay offshore time series stations (SAS 9.1 PROC MIXED). For this test, 49
62 NFT was treated and coded as a dichotomous variable with stations classified as both night and flood coded 1, all other stations were coded 0. To pass model assumptions, a square root transformation of time series abundance was necessary. All time series and pooled transects passed a Pearson s correlation test for heterogeneity of variance, Delaware Bay inshore time series did not pass tests for normality (Shapiro-Wilk test W = , P = 0.004; SAS 9.1). Kruskal-Wallis significance tests agreed with the results of the autoregressive ANOVA for the parametric models that fit the data (SAS 9.1 NPAR1WAY; Table AIII. 3). Because parametric and nonparametric test results agreed, Kruskal-Wallis was deemed the most appropriate test to compare megalopae abundance in NFT and under other conditions. 50
63 Table AIII.1. Results of ANOVA autoregressive model with time covariance and non-parametric comparisons of C. sapidus megalopae abundances (no. m -2 ) at day and night for time series. Parameter estimates indicated ( t ) have been log e transformed for parametric tests. Bold and starred P values (*) indicate significance at = Table AIII. 2. Results of ANOVA autoregressive model with time covariance and non-parametric comparisons standardized mean depth of C. sapidus megalopae at day and night for Delaware Bay time series. Bold and starred P values (*) indicate significance at =
64 Table AIII. 3. Result of ANOVA autoregressive model with time covariance and nonparametric comparisons of C. sapidus megalopae abundances (no. m -2 ) at nocturnal flood tide and non-nocturnal flood tide conditions for time series and pooled transects. Parameter estimates indicated ( t ) have been square root transformed for parametric tests. Bold and starred P values (*) indicate significance at =
65 References Beardsley, R.C., W. C. Boicourt, and D. V. Hansen Physical oceanography of the Middle Atlantic Bight. Limnology and Oceanography Special Symposium 2: Blanton, J. O., E. Wenner, F. Werner, and D. Knott Effects of wind-generated coastal currents on the transport of blue crab megalopae on a shallow continental shelf. Bulletin of Marine Research 57: Boicourt, W. C Estuarine larval retention mechanisms on two scales. P In V. S. Kennedy (ed.). Estuarine Comparisons. Academic Press, New York. Bumpus, D. R Reversals in the surface drift in the Middle Atlantic Bight area. Deep-Sea Research Supplement 16: Chesapeake Bay Stock Assessment Committee (CBSAC) Chesapeake Bay blue crab advisory report. A report to the NOAA Fisheries Steering Committee. Costlow, J. D The effect of salinity and temperature on survival and metamorphosis of megalops of the blue crab Callinectes sapidus. Helgoländer wiss. Meeresunters 15: Costlow, J. D. and C. G. Bookhout The larval development of Callinectes sapidus Rathbun reared in the laboratory. The Biological Bulletin Marine Biological Laboratory., Woods Hole 163: Cronin, T. W. and R. B. Forward The visual pigments of crabs. Journal of Comparative Physiology A 162:
66 Davis, C. C A study of the hatching process in aquatic invertebrates: XX. The blue crab, Callinectes sapidus, Rathbun, XXI. The nemertean, Carcinonemertes carcinophila, (Kölliker). Chesapeake Science 6: De Vries, M. C., R. A. Tankersley, R. B. Forward, Jr., W. W. Kirby-Smith, and R. A. Luettich, Jr Abundance of estuarine crab larvae is associated with tidal hydrological variables. Marine Biology 118: Diaz, H., B. Orihuela, R. B. Forward, Jr., and D. Rittscoff Orientation of blue crab, Callinectes sapidus (Rathbun), megalopae: responses to visual and chemical cues. Journal of Experimental Marine Biology and Ecology 233: Dittel, A. T. and C. E. Epifanio Seasonal abundance and distribution of crab larvae in Delaware Bay. Estuaries 5: Epifanio, C. E Transport of invertebrate larvae between estuaries and the continental shelf. American Fisheries Society Symposium 3: Epifanio, C. E Biology of Larvae. P In V.S. Kennedy and L. E. Cronin (eds.), The blue crab Callinectes sapidus. Maryland Sea Grant College, College Park, MD. Epifanio, C. E. and R. W. Garvine Larval transport on the Atlantic continental shelf of North America: A review. Estuarine, Coastal and Shelf Science 52: Epifanio, C. E., K. T. Little, and P. M. Rowe Dispersal and recruitment of fiddler crab larvae in the Delaware River estuary. Marine Ecology Progress Series 43:
67 Epifanio, C. E., A. K. Masse, and R. W. Garvine Transport of blue crab larvae by surface currents off Delaware Bay, U.S.A. Marine Ecology Progress Series 54: Etherington, L. L. and D. B. Eggleston Spatial dynamics of large-scale, multistage (Callinectes sapidus) dispersal: determinants and consequences for recruitment. Canadian Journal of Fisheries and Aquatic Science 60: Forward, Jr., R. B., J. H. Cohen, R. D. Irvine, J. L. Lax, R. Mitchell, A. M. Schick, M. M. Smith, J. M. Thompson, and J. I. Venezia Settlement of blue crab Callinectes sapidus megalopae in a North Carolina estuary. Marine Ecology Progress Series 269: Forward, Jr., R. B., H. Diaz, and M. B. Ogburn The ontogeny of the endogenous rhythm in vertical migration of the blue crab Callinectes sapidus at metamorphosis. Journal of Experimental Marine Biology and Ecology 348: Forward, Jr., R. B., D. A. Z. Frankel, and D. Rittschof Molting of megalopae from the blue crab Callinectes sapidus: effects of offshore and estuarine cues. Marine Ecology Progress Series 113: Forward, Jr., R. B., N. B. Reyns, H. Diaz, J. H. Cohen, and D. B. Eggleston Endogenous swimming rhythms underlying secondary dispersal of juvenile blue crabs, Callinectes sapidus. Journal of Experimental Marine Biology and Ecology 316:
68 Forward, Jr., R. B. and D. Rittschof Photoresponses of crab megalopae in offshore and estuarine waters: implications for transport. Journal of Experimental Marine Biology and Ecology 182: Forward, Jr., R. B., J. Swanson, R. A. Tankerseley, and J. M. Welch Endogenous swimming rhythms of blue crab, Callinectes sapidus, megalopae: effects of offshore and estuarine cues. Marine Biology 127: Goodrich, D. M., J. van Montfrans, and R. J. Orth Blue crab megalopal influx to Chesapeake Bay: evidence for a wind-driven mechanism. Estuarine, Coastal and Shelf Science 29: Guerin, J. L. and W. B. Stickle A comparative study of two sympatric species within the genus Callinectes: osmoregulation, long-term acclimation to salinity and the effects of salinity of growth and molting. Journal of Experimental Marine Biology and Ecology 218: Hernes, P. J. and R. Benner Photochemical and microbial degradation of dissolved lignin phenols: Implications for the fate of terrigenous dissolved organic matter in marine environements. Journal of Geophysical Research 108: Hines, A. H Ecology of juvenile and adult blue crabs. P In: V.S. Kennedy and L. E. Cronin (eds.), The blue crab Callinectes sapidus. Maryland Sea Grant College, College Park, MD. Johnson, D. R., B. S. Hester and J. R. McConaugha Studies of a wind mechanism influencing the recruitment of blue crabs in the Middles Atlantic Bight. Continental Shelf Research 3:
69 Jones, M. B. and C. E. Epifanio Settlement of brachyuran megalopae in Delaware Bay: an analysis of time series data 125: Kahn, D. M. and T. E. Hessler Abundance, dynamics and mortality rates of the Delaware Bay stock of blue crabs, Callinectes sapidus. Journal of Shellfish Research 24: Kirk, J. T. O Light and photosynthesis in aquatic ecosystems, 2 nd edition. Cambridge University Press, Cambridge U.K. Little, K. T. and C. E. Epifanio Mechanism for the re-invasion of the estuary by two species of brachyuran megalopae. Marine Ecology Progress Series 68: Luckenbach, M. W. and R. J. Orth Swimming velocities and behavior of blue crab (Callinectes sapidus Rathbun) megalopae in still and flowing water. Estuaries 15: McConaugha, J. R Export and reinvasion of larvae as regulators of estuarine decapod populations. American Fisheries Society Symposium 3: Mense, D. J. and E. L. Wenner Distribution and abundance of early life history stages of the blue crab, Callinectes sapidus, in tidal marsh creeks near Charleston, South Carolina. Estuaries 12: Miller, T. J., S. J. D. Martell, D. B. Bunnell, G. Davis, L. Fegley, A. Sharov, C. Bonzek, D Hewitt, J. Hoenig, and R. N. Lipcius Stock assessment of blue crab in the Chesapeake Bay. NOAA Technical Report Series. No. TS
70 Millikin, M. R., and A. B. Williams Synopsis of biological data on the blue crab, Callinectes sapidus. FAO Fisheries. Synoposium Natunewicz, C. C. and C. E. Epifanio Spatial and temporal scale of patches of crab larvae in coastal waters. Marine Ecology Progress Series 212: Norcross, B. L., and R. F. Shaw Oceanic and estuarine transport of fish eggs and larvae: a review. Transactions of the American Fisheries Society 133: North, E. W., Z. Schlag, R. R. Hood, M. Li, L. Zhong, T. Gross, V. S. Kennedy Vertical swimming behavior influences the dispersal of simulated oyster larvae in a coupled hydrodynamic model of Chesapeake Bay. Marine Ecology Progress Series 359: Olmi, E. J. III Vertical migration of blue crab Callinectes sapidus megalopae: implications for transport in estuaries. Marine Ecology Progress Series 113: Ogburn, M. B Estuarine ingress of the blue crab Callinectes sapidus. Doctoral dissertation, Duke University. Pape, E. H. and R. W. Garviine The subtidal circulation in Delaware Bay and adjacent shelf waters. Journal of Geophysical Research 87: Perry, H. M., C. K. Eleuterius, C. B. Trigg, and J. R. Warren Settlement patterns of Callinectes sapidus megalopae in the Mississippi Sound: 1991,1992. Bulletin of Marine Science 57:
71 Perry, H., D. R. Johnson, K. Larsen, C. Trigg, and F. Vukovich Blue crab larval dispersion and retention in the Mississippi Bight: testing the hypothesis. Bulletin of Marine Science 72: Roman, M. R. and W. C. Boicourt Dispersion and recruitment of crab larvae in the Chesapeake Bay plume: physical and biological controls. Estuaries 22: Sandifer, P. A Morphology and ecology of Chesapeake Bay decapod crustacean larvae. Doctoral dissertation, University of Virginia, Charlottesville. Smyth, P. O Callinectes (Decapoda: Portunidae) larvae in the Middle Atlantic Bight, Fishery Bulletin 78: Sokal, R. R. and F. J. Rohlf Biometery 2 nd edition. New York: W. H. Freeman and Co. Steppe, C. N. and C. E. Epifanio Synoptic distribution of crab larvae near the mouth of Chesapeake Bay: Influence of nearshore hydrographic regimes. Estuarine, Coastal, and Shelf Science 70: Sulkin, S. D Behavioral basis of depth regulation in the larvae of brachyuran crabs. Marine Ecology Progress Series 15: Sulkin, S. D. and C. E. Epifanio A conceptual model for recruitment of the blue crab, Callinectes sapidus Rathbun, to estuaries of the Middle Atlantic Bight. In G. S. Jamieson and N. Bourne (eds.), North Pacific Workshop on Stock Assessment and Management of the Invertebrates. Canadian Special Publication on Fisheries and Aquatic Science 92:
72 Sulkin, S. D. and W. F. Van Heukelem Larval recruitment in the crab Callinectes sapidus Rathbun: an amendment to the concept of larval retention in estuaries. P In In V. S. Kennedy (ed.). Estuarine Comparisons. Academic Press, New York. Sulkin, S. D. and W. F. Van Heukelem Variability in the length of the megalopal stage and its consequence to dispersal and recruitment in the portunid crab Callinectes sapidus Rathbun. Bulletin of Marine Science 39: Sulkin, S. D., W. F. Van Heukelem, P. Kelly, and L. Van Heukelem The behavioral basis of larval recruitment in the crab Callinectes sapidus Rathbun: A laboratory investigation of ontogenic changes in geotaxis and barokinesis. Biological Bulletin 159: Tankersley, R. A. and R. B. Forward, Jr Endogenous swimming rhythms in estuarine crab megalopae: implications for flood tide transport. Marine Biology 118: Tankersley, R. A. and R. B. Forward, Jr Environmental Physiology. P In V.S. Kennedy and L. E. Cronin (eds.), The blue crab Callinectes sapidus. Maryland Sea Grant College, College Park, MD. Tankersley, R. A., L. M. McKelvey, and R. B. Forward, Jr Responses of estuarine crab megalopae to pressure, salinity, and light: implications for flood tide transport. Marine Biology 122:
73 Tankersley, R. A., J. M. Welch, and R. B. Forward, Jr Settlement times of blue crab megalopae during flood tide transport. Marine Biology 141: Tilburg, C. E., A. I. Dittel, and C. E. Epifanio Retention of crab larvae in a coastal null zone. Estuarine, Coastal, and Shelf Science 72: Van Engel, W. A The blue crab and its fishery in Chesapeake Bay. Part I. Reproduction, early development, growth, and migration. Commercial Fisheries Review. 20:6-17. Welch, J. M. and R. B. Forward, Jr Flood tide transport of blue crab, Callinectes sapidus, postlarvae: behavioral responses to salinity and turbulence. Marine Biology 139: Welch, J. M., R. B. Forward, Jr., and P. A. Howd Behavioral responses of blue crab Callinectes sapidus postlarvae to turbulence: implications for selective tidal stream transport. Marine Ecology Progress Series 179: Zeng, C. and E. Naylor. 1996a. Occurrence in coastal waters and endogenous tidal swimming rhythms of late stage megalopae of the shore crabs Carcinus maenus: implications for onshore recruitment. Marine Ecology Progress Series 136: Zeng, C. and E. Naylor. 1996b. Synchronization of endogenous vertical migration rhythms in laboratory-hatched larvae of the crab Carcinus maenus. Journal of Experimental Marine Biology 198:
74 Table 1. Mean concentration of C. sapidus megalopae found in studies with comparable sampling techniques, locations, and times of year as well as means for this study pooled by bay and year. Study megs m -3 Sample Gear notes Smyth McConaugha km offshore km offshore 1 80km offshore 5 Little and Epifanio 1991 flood tide 14.9 ebb tide 1.6 day 1.2 night 8.3 This Study Chesapeake Bay day 5.5E -3 Chesapeake Bay night 1.4 Delaware Bay day 0.4 Delaware Bay night 0.7 bongo nets and neuston nets nueston and plankton nets Pump 1m below surface MOCNESS mean concentration in neuston at station offshore Chesapeake Bay August 1977 concentrations near to Chesapeake Bay August 10, 1982 mean concentrations, Broadkill River, DE, September mean of all depths and nets, transects and time series 62
75 Table 2. Results of Kruskal-Wallis nonparametric test to determine if C. sapidus megalopae abundances (no. m -2 ) were significantly different during day versus night for time series and transect stations. Bold and starred P values (*) indicate significance at = n Kruskal-Wallis Day Night 2 DF P Time Series Chesapeake Inshore * Chesapeake Offshore * Delaware Inshore Transects Delaware Offshore * Chesapeake * Delaware
76 Table 3. Results of ANOVA test to determine if C. sapidus megalopae standardized mean depths of occurrence were significantly different during day versus night for Delaware Bay time series and transect stations. An autoregressive model with temporal covariance is used for time series and a standard ANOVA is used for transect stations. Bold and starred P values (*) indicate significance at = Time Series ANOVA autoregressive model w/simple structure n covariance Day Night Parameter Est. F P Delaware Inshore ± * Delaware Offshore ± Transects non-autoregressive model Delaware ± < 0.001* 64
77 Table 4. Results of Kruskal-Wallis nonparametric test to determine if C. sapidus megalopae abundances (no. m -2 ) were significantly different during nocturnal flood tide versus other conditions for time series and transect stations. Bold and starred P values (*) indicate significance at = n Kruskal-Wallis NFT Other 2 DF P Time Series Chesapeake Inshore * Chesapeake Offshore No Data... Delaware Inshore Delaware Offshore * Transects Chesapeake Delaware
78 Table 5. Results of ANOVA test to determine if C. sapidus megalopae standardized mean depths of occurrence were significantly different during nocturnal flood tide versus other conditions. An autoregressive model with temporal covariance is used for time series and a standard ANOVA is used for transect stations. Bold and starred P values (*) indicate significance at = Parametric Test autoregressive model w/simple structure n covariance NFT Other Parameter Est. F P Time Series Chesapeake Inshore ± Chesapeake Offshore No Data... Delaware Inshore ± * Delaware Offshore ± Transects non-autoregressive model Chesapeake ± Delaware ±
79 Figure 1. Locations of C. sapidus megalopae collections and Scanfish surveys in Chesapeake (a,c,e,g) and Delaware (b,d,f,h) Bays, USA, during a-d) September 2005 and e-f) Sepetmber Upper panels: locations where megalopae were collected with a MOCNESS at stations along a transect ( ) and in time series at fixed stations. CTD casts were conducted at each MOCNESS station. Lower panels: location of the Scanfish chemical and physical survey (black lines). 67

80 68
81 Figure 2. CDOM and salinity from Scanfish surveys in Chesapeake Bay. a) CDOM (mg m -3 ) and b) salinity on September 12, c) CDOM (mg m -3 ) and d) salinity from September (Note: Zero indicates the location of the Chesapeake Bay mouth which was defined as the narrowest across the mouth. Negative values are landward of zero, positive values are seaward.) 69

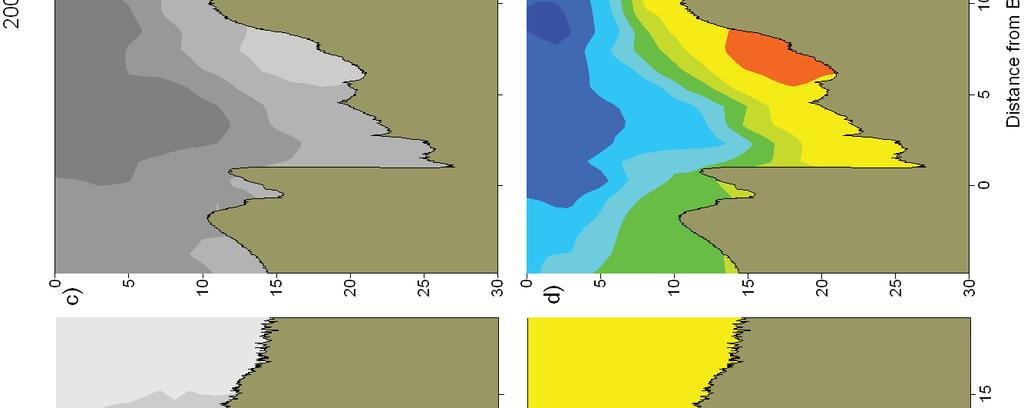

82 70
83 Figure 3. CDOM and salinity from Scanfish surveys in Delaware Bay. a) CDOM (mg m -3 ) and b) salinity on September 8, c) CDOM (mg m -3 ) and d) salinity from September (Note: Zero indicates the location of the Delaware Bay mouth which was defined as the narrowest point across the mouth. Negative values are landward of zero, positive values are seaward.) 71
84 a) Salinity Distance from Bay Mouth (km) Distance from Bay Mouth (km) Depth (m) Depth (m) b) c) CDOM (mg m -3 ) d) 72
85 Megalopae Concentration (no. m -3) 29 Salinity Temperature ( C ) Figure 4. Mean temperature and salinity recorded during MOCNESS net tows, as measured with sensors attached to the MOCNESS. The size of the symbols corresponds to the concentration of megalopae (no. m -3 ) in each sample. Concentrations of zero are indicated ( ). Symbols are color-coded by estuary and year: Chesapeake Bay 2005 ( ), Chesapeake Bay 2006 ( ), Delaware Bay 2005 ( ), Delaware Bay 2006 ( ). (One sample with high concentrations (33.9 m -3 ) was not plotted due to missing temperature and salinity measurements.) 73
86 Figure 5. Time series of megalopae concentrations (no. m -3 ), current velocities (cm s -1 ), and salinity at inshore (right panels a,b) and offshore stations (left panels c,d) near the mouth of Chesapeake Bay in Upper panels (a,c) show current velocities in the flood tide direction. Positive values indicate flood (i.e., into the estuary). Lower panels (b,d) contain plots of C. sapidus megalopae concentrations (round symbols with key to right) and salinity contour lines with intervals of 1. Night is indicated with shaded background, day is indicated by white background. Symbols for megalopae occur at the median depth of the net tow. An indicates that zero megalopae were collected in that tow. The maximum depth that the bottom net sampled is indicated ( - ). Time on the x-axis is local time (Eastern Standard Time). 74


87 75
88 Figure 6. Time series of megalopae concentrations (no. m -3 ), current velocities (cm s -1 ), and salinity at inshore (right panels a,b) and offshore stations (left panels c,d) near the mouth of Delaware Bay in Upper panels (a,c) show current velocities in the flood tide direction. Positive values indicate flood (i.e., into the estuary). The dashed line indicates estimated current velocities. Lower panels (b,d) contain plots of C. sapidus megalopae concentrations (round symbols with key to right) and salinity contour lines with intervals of 0.5. Night is indicated with shaded background, day is indicated by white background. Symbols for megalopae occur at the median depth of the net tow. An indicates that zero megalopae were collected in that tow. The maximum depth that the bottom net sampled is indicated ( - ). Time on the x-axis is local time (Eastern Standard Time). 76


89 77
90 Figure 7. Chesapeake Bay. Time series plots of a,e) current velocity (solid line, cm s -1 ) and current acceleration (dashed line, cm s -2 ) in the flood tide direction, b,f) bottom salinity, c,g) C. sapidus megalopae abundance (no. m -2 ), and d,h) standardized mean depth of occurrence of megalopae. Left panels (a-d) include data from the inshore time series station. Right panels (e-h) include data from the offshore time series station. Night is indicated with shaded background, day is indicated by white background. Time is local Eastern Standard Time. 78

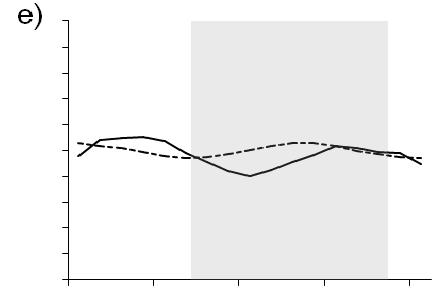

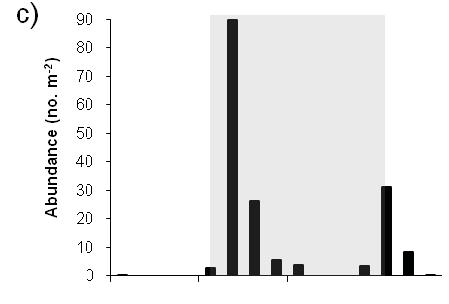

91 79
92 . Figure 8. Delaware Bay. Time series plots of a,e) current velocity (solid line, cm s -1 ) and current acceleration (dashed line, cm s -2 ) in the flood tide direction, b,f) bottom salinity, c,g) C. sapidus megalopae abundance (no. m -2 ), and d,h) standardized mean depth of occurrence of megalopae. Left panels (a-d) include data from the inshore time series station. Right panels (e-h) include data from the offshore time series station. Night is indicated with shaded background, day is indicated by white background. Time is local Eastern Standard Time. 80

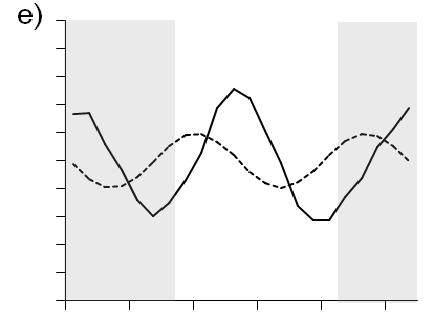
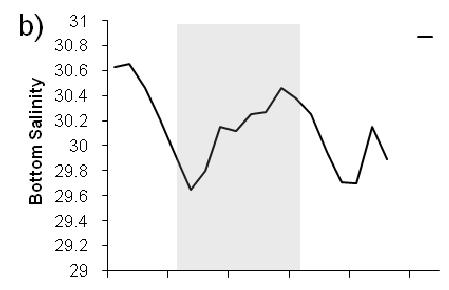
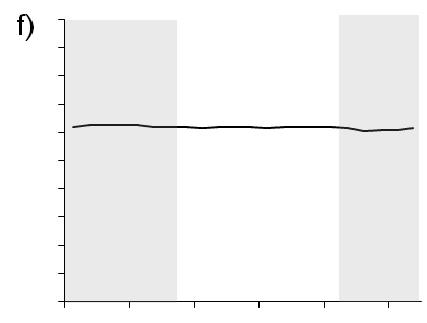


93 81
94 Figure 9. a) Mean abundance of C. sapidus megalopae (no. m -2 ) during day (white bars) and night (gray bars) at time series stations and at transect stations. Time series or transects in which abundance was significantly different ( = 0.05, Table 2) during day versus night are indicated ( * ). Error bars are one standard error of the mean. b) Box plot showing standardized mean depth of occurrence ( SMD ) of C. sapidus megalopae at Delaware Bay time series station and at transect station during day (white boxes) and night (gray boxes). Time series or transects in which depth was significantly different ( = 0.05, Table 3) during day versus night at are indicated ( * ). The center line in each box corresponds to the median and the upper and lower boundaries indicate 25 th and 75 th percentiles. Whiskers indicate minimum and maximum values. N.D.: no data. 82
95 Figure 10. a) Mean abundance of C. sapidus megalopae (no. m -2 ) at nocturnal flood tide (NFT) and non-nft conditions at time series and transect stations. NFT abundance is indicated by gray bars and non-nft abundance is indicated by white bars. Time series or transects in which abundance was significantly different ( = 0.05, Table 4) during NFT versus non-nft are indicated ( * ). Error bars are one standard error of the mean. b) Box plot showing standardized mean depth of occurrence ( SMD ) of C. sapidus megalopae at time series stations and at transects stations during nocturnal flood tide (NFT; gray boxes) and non-nft (white boxes). The center line in each box corresponds to the median; the upper and lower boundaries indicate the 25 th and 75 th percentiles; whiskers show minimum and maximum values. Time series or transects in which abundance was significantly different ( = 0.05, Table 5) during NFT versus non-nft are indicated ( * ). N.D.: no data. 83
96 Figure 11. Chesapeake Bay transect stations sampled in September Left panels show results from sampling the transect during the day; right panels show results from sampling the transect during the night. Upper panels (a,c) show current velocities in the flood tide direction. Positive values indicate flood (i.e., into the estuary). Lower panels (b,d) contain plots of C. sapidus megalopae concentrations (round symbols with key to right) and salinity contour lines with intervals of 1. Night is indicated with shaded background, day is indicated by white background. Symbols for megalopae occur at the median depth of the net tow. An indicates that zero megalopae were collected in that tow. The maximum depth that the bottom net sampled is indicated ( - ). Time on the x-axis is local time (Eastern Standard Time). The location of the Chesapeake Bay mouth is 0 and is defined as the narrowest point between Cape Henry and Cape Charles (negative values are landward, positive values are seaward). 84

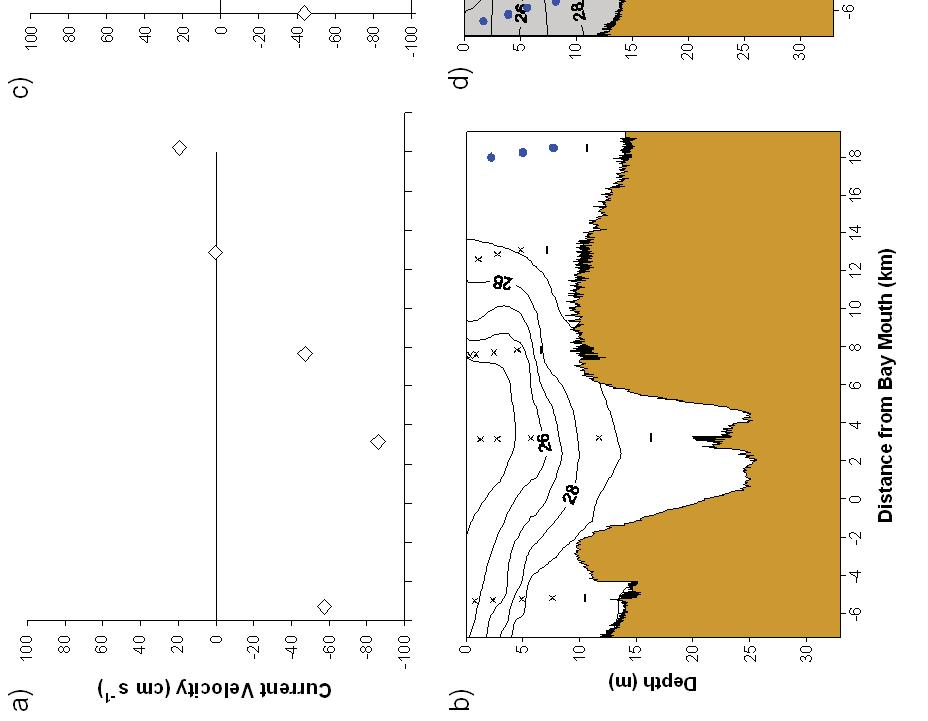
97 85
98 Figure 12. Chesapeake Bay transect stations sampled in September Left panels show results from sampling the transect during the day; right panels show results from sampling the transect during the night. Upper panels (a,c) show current velocities in the flood tide direction. Positive values indicate flood (i.e., into the estuary). Lower panels (b,d) contain plots of C. sapidus megalopae concentrations (round symbols with key to right) and salinity contour lines with intervals of 1. Night is indicated with shaded background, day is indicated by white background. Symbols for megalopae occur at the median depth of the net tow. An indicates that zero megalopae were collected in that tow. The maximum depth that the bottom net sampled is indicated ( - ). Time on the x-axis is local time (Eastern Standard Time). The location of the Chesapeake Bay mouth is 0 and is defined as the narrowest point between Cape Henry and Cape Charles (negative values are landward, positive values are seaward). 86

99 87
100 Figure 13. Delaware Bay transect stations sampled in September Left panels show results from sampling the transect during the day; right panels show results from sampling the transect during the night. Upper panels (a,c) show current velocities in the flood tide direction. Positive values indicate flood (i.e., into the estuary). Lower panels (b,d) contain plots of C. sapidus megalopae concentrations (round symbols with key to right) and salinity contour lines with intervals of 0.5. Night is indicated with shaded background, day is indicated by white background. Symbols for megalopae occur at the median depth of the net tow. An indicates that zero megalopae were collected in that tow. The maximum depth that the bottom net sampled is indicated ( - ). Time on the x-axis is local time (Eastern Standard Time). The location of the Delaware Bay mouth is 0 and is defined as the narrowest point between Cape May and Cape Henlopen (negative values are landward, positive values are seaward). 88

101 89
102 Figure 14. Delaware Bay transect stations sampled in September Left panels show results from sampling the transect during the day; right panels show results from sampling the transect during the night. Upper panels (a,c) show current velocities in the flood tide direction. Positive values indicate flood (i.e., into the estuary). Lower panels (b,d) contain plots of C. sapidus megalopae concentrations (round symbols with key to right) and salinity contour lines with intervals of 0.5. Night is indicated with shaded background, day is indicated by white background. Symbols for megalopae occur at the median depth of the net tow. An indicates that zero megalopae were collected in that tow. The maximum depth that the bottom net sampled is indicated ( - ). Time on the x-axis is local time (Eastern Standard Time) The location of the Delaware Bay mouth is 0 and is defined as the narrowest point between Cape May and Cape Henlopen (negative values are landward, positive values are seaward). 90


103 91
Dispersal strategies of two species of swimming crab on the continental shelf adjacent to Delaware Bay
 Vol. 49: 243-248, 1988 MARINE ECOLOGY - PROGRESS SERIES Mar. Ecol. Prog. Ser. Published November 30 Dispersal strategies of two species of swimming crab on the continental shelf adjacent to Delaware Bay
Mechanism for the re-invasion of an estuary by two species of brachyuran megalopae
 Vol. 68: 235-242, 1991 MARINE ECOLOGY PROGRESS SERIES Mar. Ecol. Prog. Ser. l Published January 3 Mechanism for the re-invasion of an estuary by two species of brachyuran megalopae K. T. Little, C. E.
MARINE ECOLOGY PROGRESS SERIES Mar. Ecol. hog. Ser. Transport of blue crab larvae by surface currents off Delaware Bay, USA
 Vol. 54: 35-41, 1989 l MARINE ECOLOGY PROGRESS SERIES Mar. Ecol. hog. Ser. I Published June 8 Transport of blue crab larvae by surface currents off Delaware Bay, USA C. E. Epifanio, A. K. Masse, R. W.
5. Reproduction and Recruitment
 5. Reproduction and Recruitment Sexual vs Asexual Reproduction Reproductive effort Developmental types Developmental trends What is recruitment Factors affecting recruitment Process of larval habitat selection
Fine-scale Survey of Right and Humpback Whale Prey Abundance and Distribution
 DISTRIBUTION STATEMENT A: Approved for public release; distribution is unlimited. Fine-scale Survey of Right and Humpback Whale Prey Abundance and Distribution Joseph D. Warren School of Marine and Atmospheric
Analysis of Physical Oceanographic Data from Bonne Bay, September 2002 September 2004
 Physics and Physical Oceanography Data Report -1 Analysis of Physical Oceanographic Data from Bonne Bay, September September Clark Richards and Brad deyoung Nov. 9 Department of Physics and Physical Oceanography
Novel Acoustic Techniques for Assessing Fish Schooling in the Context of an Operational Ocean Observatory
 Novel Acoustic Techniques for Assessing Fish Schooling in the Context of an Operational Ocean Observatory Christopher Jones Applied Physics Laboratory, University of Washington 1013 NE 40 th Street Seattle,
CRUISE REPORT. Spring 2014 SEAMAP Plankton Survey Cruise RV Blazing Seven
 CRUISE REPORT Spring 2014 SEAMAP Plankton Survey Cruise 1401 RV Blazing Seven Louisiana Department of Wildlife and Fisheries Fisheries Research Laboratory 195 Ludwig Annex Grand Isle, LA 70358 Chief Scientist
Numerical Experiment on the Fortnight Variation of the Residual Current in the Ariake Sea
 Coastal Environmental and Ecosystem Issues of the East China Sea, Eds., A. Ishimatsu and H.-J. Lie, pp. 41 48. by TERRAPUB and Nagasaki University, 2010. Numerical Experiment on the Fortnight Variation
A Comparison of Predicted Along-channel Eulerian Flows at Cross- Channel Transects from an EFDC-based Model to ADCP Data in South Puget Sound
 A Comparison of Predicted Along-channel Eulerian Flows at Cross- Channel Transects from an EFDC-based Model to ADCP Data in South Puget Sound Skip Albertson, J. A. Newton and N. Larson Washington State
Population Dynamics of Gulf Blue Crabs. Caz Taylor & Erin Grey Department of Ecology & Evolutionary Biology Tulane University
 Population Dynamics of Gulf Blue Crabs Caz Taylor & Erin Grey Department of Ecology & Evolutionary Biology Tulane University Blue Crab Callinectes sapidus Economically important in the Atlantic and the
HYDROGRAPHIC AND FLOW STRUCTURE IN THE CHESAPEAKE BAY MOUTH AND PLUME REGION UNDER HIGH FRESHWATER DISCHARGE CONDITIONS. Kristine Holderied *
 HYDROGRAPHIC AND FLOW STRUCTURE IN THE CHESAPEAKE BAY MOUTH AND PLUME REGION UNDER HIGH FRESHWATER DISCHARGE CONDITIONS Kristine Holderied * Arnoldo Valle-Levinson Center for Coastal Physical Oceanography
The Behavioral Basis For Blue Crab Recruitment In Mid-Atlantic Estuaries
 The Behavioral Basis For Blue Crab Recruitment In Mid-Atlantic Estuaries Stephen D. Sulkin - - -- -- ------- - -- ------ - - --- -- -- - -.. -.-------- - ------- -- Technical Report Maryland Sea Grant
Post-Graduation Plans stock assessment scientist (NOAA, hopefully)
") Update Report Period 3/1/2013-2/28/2014 Project E/I-20 - NMFS Population Dynamics Sea Grant Graduate Fellowship An evaluation of the stock assessment method for eastern Bering Sea snow crab incorporating
Update Report Period 3/1/2013-2/28/2014 Project E/I-20 - NMFS Population Dynamics Sea Grant Graduate Fellowship An evaluation of the stock assessment method for eastern Bering Sea snow crab incorporating
Identifying risks of geoduck aquaculture: the role of larval transport
 Material intended for presentation only. Please do not cite, copy or distribute Bivalve life cycle: a simplified view however: High fecundities (female geoduck 50 million eggs/year) High larval mortalities
Physics and Physical Oceanography Data Report Analysis of Physical Oceanographic Data from Funk Island Bank, August 2004
 Physics and Physical Oceanography Data Report 2004-2 Analysis of Physical Oceanographic Data from Funk Island Bank, August 2004 Nicholas Record, Brad de Young, and Jack Foley 2004 Department of Physics
Red Sea - Dead Sea Water Conveyance Study Program Additional Studies
 Red Sea - Dead Sea Water Conveyance Study Program Additional Studies Red Sea Study Final Report Annex 1 Field and laboratory activities carried out during the study and their results July 213 TABLE OF
Settlement behavior in shore crabs Carcinus maenas: why do postlarvae emigrate from nursery habitats?
 MARINE ECOLOGY PROGRESS SERIES Vol. 250: 215 230, 2003 Published March 26 Mar Ecol Prog Ser Settlement behavior in shore crabs Carcinus maenas: why do postlarvae emigrate from nursery habitats? Per-Olav
Estimating the Mean Temperature and Salinity of the Chesapeake Bay Mouth
 Estuaries Vol. 25, No. 1, p. 1 5 February 2002 Estimating the Mean Temperature and Salinity of the Chesapeake Bay Mouth RICARDO A. LOCARNINI,LARRY P. ATKINSON*, and ARNOLDO VALLE-LEVINSON Center for Coastal
Authors of abstract. Pat Fitzpatrick Jessie Kastler Frank Hernandez Carla Culpepper Candace Bright. But whole CONCORDE team contributed to results
 Authors of abstract Pat Fitzpatrick Jessie Kastler Frank Hernandez Carla Culpepper Candace Bright MSU USM USM USM USM But whole CONCORDE team contributed to results Outline of talk Field program information
HIGH RESOLUTION SEDIMENT DYNAMICS IN SALT-WEDGE ESTUARIES
 HIGH RESOLUTION SEDIMENT DYNAMICS IN SALT-WEDGE ESTUARIES Philip Orton, Dept. of Environmental Science and Engineering, Oregon Graduate Institute Douglas Wilson, Dept. of Environmental Science and Engineering,
Ocean Dynamics. The Great Wave off Kanagawa Hokusai
 Ocean Dynamics The Great Wave off Kanagawa Hokusai LO: integrate relevant oceanographic processes with factors influencing survival and growth of fish larvae Physics Determining Ocean Dynamics 1. Conservation
What Maintains the Western Gulf of Maine Cod Stock?
 What Maintains the Western Gulf of Maine Cod Stock? James Churchill Woods Hole Oceanographic Inst.; Woods Hole MA, jchurchill@whoi.edu, Jeffrey Runge School of Marine Sciences, University of Maine, Gulf
Review of Anemometer Calibration Standards
 Review of Anemometer Calibration Standards Rachael V. Coquilla rvcoquilla@otechwind.com Otech Engineering, Inc., Davis, CA Anemometer calibration defines a relationship between the measured signals from
Sediment Transport at Density Fronts in Shallow Water: a Continuation of N
 DISTRIBUTION STATEMENT A. Approved for public release; distribution is unlimited. Sediment Transport at Density Fronts in Shallow Water: a Continuation of N00014-08-1-0846 David K. Ralston Applied Ocean
UC Berkeley Technical Completion Reports
 UC Berkeley Technical Completion Reports Title Hydrodynamics of shallow water habitats in the Sacramento-San Joaquin Delta Permalink https://escholarship.org/uc/item/3j77h7t6 Author Stacey, Mark T Publication
Climate change, ocean acidification and individual-based models: Why the little things matter
 Climate change, ocean acidification and individual-based models: Why the little things matter Author Richards, Russell, Meynecke, Olaf, Chaloupka, M, Tomlinson, Rodger Benson Published 2012 Conference
Interannual Variability of Wind Induced Onshore Transport over the Northern West Florida Shelf
 Interannual Variability of Wind Induced Onshore Transport over the Northern West Florida Shelf Steve Morey Austin Todd Mark Bourassa COAPS/FSU Motivation Understand the physical controls on regional Gag
Gear data report from Atlantic plankton cruises for the R/V Pathfinder, March March 1962
 College of William and Mary W&M ScholarWorks Reports 1962 Gear data report from Atlantic plankton cruises for the R/V Pathfinder, March 1961 - March 1962 Woodrow L. Wilson Virginia Institute of Marine
by Claudio DiBacco 1,2 and D. Bart Chadwick 3 ABSTRACT
 Journal of Marine Research, 59, 53 78, 2001 Assessing the dispersal and exchange of brachyuran larvae between regions of San Diego Bay, California and nearshore coastal habitats using elemental ngerprinting
The Physical Context for Thin Layers in the Coastal Ocean
 The Physical Context for Thin Layers in the Coastal Ocean David M. Fratantoni Physical Oceanography Department Woods Hole Oceanographic Institution Woods Hole, MA 02543 phone: (508) 289-2908 fax: (508)
Background Field program information Examples of measurements Wind validation for synthetic modeling effort
 Background Field program information Examples of measurements Wind validation for synthetic modeling effort How do complex fine-scale structure and processes in coastal waters dominated by pulsed-river
Advice September 2012
 9.4.23 Advice September 2012 ECOREGION STOCK Widely distributed and migratory stocks European seabass in the Northeast Atlantic Advice for 2013 ICES advises on the basis of the approach to data-limited
Standard Practices for Air Speed Calibration Testing
 Standard Practices for Air Speed Calibration Testing Rachael V. Coquilla Bryza Wind Lab, Fairfield, California Air speed calibration is a test process where the output from a wind measuring instrument
Continuous Monitoring of Fish Population and Behavior by Instantaneous Continental-Shelf-Scale Imaging with Ocean-Waveguide Acoustics
 Continuous Monitoring of Fish Population and Behavior by Instantaneous Continental-Shelf-Scale Imaging with Ocean-Waveguide Acoustics PI: Prof. Nicholas C. Makris Massachusetts Institute of Technology
FRICTION-DOMINATED WATER EXCHANGE IN A FLORIDA ESTUARY
 FRICTION-DOMINATED WATER EXCHANGE IN A FLORIDA ESTUARY By KIMBERLY ARNOTT A THESIS PRESENTED TO THE GRADUATE SCHOOL OF THE UNIVERSITY OF FLORIDA IN PARTIAL FULFILLMENT OF THE REQUIREMENTS FOR THE DEGREE
The mechanisms influencing the timing, success and failure of spawning in natural populations of the sea urchin Strongylocentrotus intermedius
 The mechanisms influencing the timing, success and failure of spawning in natural populations of the sea urchin Strongylocentrotus intermedius in the northwestern Sea of Japan P. M. Zhadan 1, M. A. Vaschenko
Modeling the Columbia River Plume on the Oregon Shelf during Summer Upwelling. 2 Model
 Modeling the Columbia River Plume on the Oregon Shelf during Summer Upwelling D. P. Fulton August 15, 2007 Abstract The effects of the Columbia River plume on circulation on the Oregon shelf are analyzed
Marine biologists have identified over 250,000 marine species. This number is constantly increasing as new organisms are discovered.
 A wide variety of organisms inhabit the marine environment. These organisms range in size from microscopic bacteria and algae to the largest organisms alive today blue whales, which are as long as three
Spatial-Temporal Patchiness. Patchiness Defined
 Spatial-Temporal Patchiness Steady State vs. Non-Steady State Box Models Chaos, Non-linearity Spectral Analysis Small-Scale Variability Medium-Scale Variability Large-Scale Variability The Paradox of the
Spatial variation in the abundance of eelgrass (Zostera marina) at eight sites in western Newfoundland, Canada 5/5/2015 V2.0
 at eight sites in western Newfoundland, Canada 5/5/2015 V2.0") Spatial variation in the abundance of eelgrass (Zostera marina) at eight sites in western Newfoundland, Canada 5/5/2015 V2.0 1 Summary The abundance of eelgrass (Zostera marina) was quantified at eight
Spatial variation in the abundance of eelgrass (Zostera marina) at eight sites in western Newfoundland, Canada 5/5/2015 V2.0 1 Summary The abundance of eelgrass (Zostera marina) was quantified at eight
On the influence of downwelling winds on the Chesapeake Bay outflow
 On the influence of downwelling winds on the Chesapeake Bay outflow Arnoldo Valle-Levinson Center for Coastal Physical Oceanography, Old Dominion University, Norfolk, Virginia, USA Kamazima M.M. Lwiza
Tidal and subtidal currents influence deep copepod aggregations along a shelf-basin margin
 The following supplement accompanies the article Tidal and subtidal currents influence deep copepod aggregations along a shelf-basin margin Kimberley T. A. Davies*, Tetjana Ross, Christopher T. Taggart
Individual-Based modeling of Copepods MAR524 Unit 11
 Individual-Based modeling of Copepods MAR524 Unit 11 Geoffrey Cowles Department of Fisheries Oceanography School for Marine Science and Technology University of Massachusetts-Dartmouth Outline Copepod
Reference Model #1 Tidal Energy: Resource
 Northwest National Marine Renewable Energy Center niversity of Washington, Seattle, WA 9895 Reference Model # Tidal Energy: Resource Technical Report: W 20 02 December 20 Dr. Brian Polagye, Department
Numerical studies focusing on the early life stage of Pacific bluefin tuna (Thunnus orientalis)
") 水研センター研報, 第 38 号,121 125, 平成 26 年 Bull. Fish. Res. Agen. No. 38, 51-55, 2014 121 Numerical studies focusing on the early life stage of Pacific bluefin tuna (Thunnus orientalis) Masachika MASUJIMA *1, Yoshiki
水研センター研報, 第 38 号,121 125, 平成 26 年 Bull. Fish. Res. Agen. No. 38, 51-55, 2014 121 Numerical studies focusing on the early life stage of Pacific bluefin tuna (Thunnus orientalis) Masachika MASUJIMA *1, Yoshiki
CHAPTER 4 CRITICAL GROWTH SEASONS AND THE CRITICAL INFLOW PERIOD. The numbers of trawl and by bag seine samples collected by year over the study
 CHAPTER 4 CRITICAL GROWTH SEASONS AND THE CRITICAL INFLOW PERIOD The numbers of trawl and by bag seine samples collected by year over the study period are shown in table 4. Over the 18-year study period,
Recruitment patterns of decapod crustacean megalopae in a shallow inlet (SW Spain) related to life history strategies
 related to life history strategies") Estuarine, Coastal and Shelf Science 56 (2003) 593 607 Recruitment patterns of decapod crustacean megalopae in a shallow inlet (SW Spain) related to life history strategies J.I. Gonza lez-gordillo a, *,
Estuarine, Coastal and Shelf Science 56 (2003) 593 607 Recruitment patterns of decapod crustacean megalopae in a shallow inlet (SW Spain) related to life history strategies J.I. Gonza lez-gordillo a, *,
Larvae. Juvenile. Adult. Bipartite life cycle of benthic marine fishes with pelagic larvae. Pelagic Environment. settlement.
 13 - Marine Ecology Bipartite life cycle of benthic marine fishes with pelagic larvae Larvae survive, grow, develop, disperse reproduce Pelagic Environment Benthic Environment settlement Adult Juvenile
Dispersal dynamics of post-larval blue crabs, Callinectes sapidus, within a wind-driven estuary
 FISHERIES OCEANOGRAPHY Fish. Oceanogr. 16:3, 257 272, 2007 Dispersal dynamics of post-larval blue crabs, Callinectes sapidus, within a wind-driven estuary NATHALIE B. REYNS, 1,2, * DAVID B. EGGLESTON 2
the requirements for the degree of Doctor of Philosophy Lance P. Garrison Romuald N. Lipcius, Ph. D. Committee Co-Chair/ Co-advisor
 This dissertation is submitted in partial fulfillment of the requirements for the degree of Doctor of Philosophy Lance P. Garrison Approved September, 1997 Romuald N. Lipcius, Ph. D. Committee Co-Chair/
CERTAIN ASPECTS OF THE NUMERICAL SIMULATION OF CIRCULATION IN THE BAY OF BENGAL AND THE ARABIAN SEA
 CERTAIN ASPECTS OF THE NUMERICAL SIMULATION OF CIRCULATION IN THE BAY OF BENGAL AND THE ARABIAN SEA by INDU JAIN A THESIS SUBMITTED IN FULFILMENT OF THE REQUIREMENTS FOR THE DEGREE OF DOCTOR OF PHILOSOPHY
Individual-Based modeling of Copepods
 Individual-Based modeling of Copepods Geoffrey Cowles Department of Fisheries Oceanography School for Marine Science and Technology University of Massachusetts-Dartmouth May 4, 2008 Outline Copepod Life
Characterizing the Physical Oceanography of Coastal Waters Off Rhode Island
 Characterizing the Physical Oceanography of Coastal Waters Off Rhode Island Dan Codiga and Dave Ullman Graduate School of Oceanography University of Rhode Island RI OSAMP Stakeholder Meeting January 5,
MONITORING SUSPENDED SEDIMENT PLUME FORMED DURING DREDGING USING ADCP, OBS, AND BOTTLE SAMPLES
 MONITORING SUSPENDED SEDIMENT PLUME FORMED DURING DREDGING USING ADCP, OBS, AND BOTTLE SAMPLES Grace M. Battisto 1 and Carl T. Friedrichs 2 Abstract: In this study three independent measures of suspended
Field Observations on Selective Tidal-Stream Transport for Postlarval and Juvenile Pink Shrimp in Florida Bay
 Field Observations on Selective Tidal-Stream Transport for Postlarval and Juvenile Pink Shrimp in Florida Bay Author(s) :Maria M. Criales, Michael B. Robblee, Joan A. Browder, Hernando Cardenas, and Thomas
A Study on Residual Flow in the Gulf of Tongking
 Journal of Oceanography, Vol. 56, pp. 59 to 68. 2000 A Study on Residual Flow in the Gulf of Tongking DINH-VAN MANH 1 and TETSUO YANAGI 2 1 Department of Civil and Environmental Engineering, Ehime University,
Earth Moon Motions A B1
 Earth Moon Motions A B1 1. The Coriolis effect provides evidence that Earth (1) rotates on its axis (2) revolves around the Sun (3) undergoes cyclic tidal changes (4) has a slightly eccentric orbit 9.
Heavy Rainfall Event of June 2013
 Heavy Rainfall Event of 10-11 June 2013 By Richard H. Grumm National Weather Service State College, PA 1. Overview A 500 hpa short-wave moved over the eastern United States (Fig. 1) brought a surge of
This file is part of the following reference: Access to this file is available from:
 This file is part of the following reference: Page, Geoff () Mass Transport Evaluation using consolidated VHF Radar and Acoustic Doppler Current Profiler data. Masters (Research) thesis, James Cook University.
Variations of Kuroshio Intrusion and Internal Waves at Southern East China Sea
 Variations of Kuroshio Intrusion and Internal Waves at Southern East China Sea Ren-Chieh Lien Applied Physics Laboratory University of Washington Seattle, Washington 98105 phone: (206) 685-1079 fax: (206)
Performance of the Nortek Aquadopp Z-Cell Profiler on a NOAA Surface Buoy
 Performance of the Nortek Aquadopp Z-Cell Profiler on a NOAA Surface Buoy Eric Siegel NortekUSA Annapolis, USA Rodney Riley & Karen Grissom NOAA National Data Buoy Center Stennis Space Center, USA Abstract-Observations
CASCO BAY ESTUARY PARTNERSHIP. R. Michael Doan FRIENDS OF CASCO BAY. May 2007
 Final Report 26 Dissolved Oxygen Monitoring Project Prepared for the CASCO BAY ESTUARY PARTNERSHIP By R. Michael Doan FRIENDS OF CASCO BAY May 27 Introduction Quahog Bay has experienced reduced water quality,
Bifurcation Current along the Southwest Coast of the Kii Peninsula
 Journal of Oceanography, Vol. 54, pp. 45 to 52. 1998 Bifurcation Current along the Southwest Coast of the Kii Peninsula JUNICHI TAKEUCHI 1, NAOTO HONDA 2, YOSHITAKA MORIKAWA 2, TAKASHI KOIKE 2 and YUTAKA
Coastal Oceanography. Coastal Oceanography. Coastal Waters
 Coastal Oceanography Coastal Oceanography 95% of ocean life is in coastal waters (320 km from shore) Estuaries and wetlands are among most productive ecosystems on Earth Major shipping routes, oil and
Competition-induced starvation drives large-scale population cycles in Antarctic krill
 In the format provided by the authors and unedited. SUPPLEMENTARY INFORMATION VOLUME: 1 ARTICLE NUMBER: 0177 Competition-induced starvation drives large-scale population cycles in Antarctic krill Alexey
The World Ocean. Pacific Ocean 181 x 10 6 km 2. Indian Ocean 74 x 10 6 km 2. Atlantic Ocean 106 x 10 6 km 2
 The World Ocean The ocean and adjacent seas cover 70.8% of the surface of Earth, an area of 361,254,000 km 2 Pacific Ocean 181 x 10 6 km 2 Indian Ocean 74 x 10 6 km 2 Atlantic Ocean 106 x 10 6 km 2 Oceanic
Ecological and Economic Effects of Derelict Fishing Gear in the Chesapeake Bay. Amy V. Uhrin Chief Scientist NOAA Marine Debris Program
 Ecological and Economic Effects of Derelict Fishing Gear in the Chesapeake Bay Amy V. Uhrin Chief Scientist NOAA Marine Debris Program Briefing for: Chesapeake Bay Program Management Board October 13,
MISA. Maryland Integrated Science Assessment Sample Items
 MISA Maryland Integrated Science Assessment 2018 Sample Items Developed and published under contract with the Maryland State Department of Education by Measured Progress. Copyright 2019 by the Maryland
Critical Issues in Assessment of Offshore Wind Farm Development on Dispersion and Settling of Scallop Larvae in the Northeast U.S.
 Critical Issues in Assessment of Offshore Wind Farm Development on Dispersion and Settling of Scallop Larvae in the Northeast U.S. Coastal Ocean Changsheng Chen School for Marine Science and Technology
Wave Propagation Across Muddy Seafloors
 Wave Propagation Across Muddy Seafloors Steve Elgar Woods Hole Oceanographic Institution Woods Hole, MA 02543 phone: (508) 289-3614 fax: (508) 457-2194 email: elgar@whoi.edu Grant numbers: N00014-07-10461,
TRANSPORT MECHANISMS OF DECAPOD LARVAE TO THE NEARSHORE AND ESTUARINE ENVIRONMENT JEREMIAH JOHNSON A THESIS
 TRANSPORT MECHANISMS OF DECAPOD LARVAE TO THE NEARSHORE AND ESTUARINE ENVIRONMENT by JEREMIAH JOHNSON A THESIS Presented to the Department of Biology and the Graduate School of the University of Oregon
Sediment impacts on coral communities: gametogenesis, spawning, recruitment and early post-recruitment survival Dr Luke Smith
 Sediment impacts on coral communities: gametogenesis, spawning, recruitment and early post-recruitment survival Dr Luke Smith AIMS, Fremantle, Western Australia 83 Overview Survival of the different early
53 contributors for 35 individual reports in 2009 show 5% of figures today
 A Group Approach to Understanding Ecosystem Dynamics in the Northeast Pacific Ocean William Crawford and James Irvine, Fisheries and Oceans Canada (DFO) * * * 53 contributors for 35 individual reports
ASSESSING AND EVALUATING RECREATION RESOURCE IMPACTS: SPATIAL ANALYTICAL APPROACHES. Yu-Fai Leung
 ASSESSING AND EVALUATING RECREATION RESOURCE IMPACTS: SPATIAL ANALYTICAL APPROACHES by Yu-Fai Leung Dissertation submitted to the Faculty of the Virginia Polytechnic Institute and State University in partial
Coastal Ocean Circulation Experiment off Senegal (COCES)
") DISTRIBUTION STATEMENT A. Approved for public release; distribution is unlimited. Coastal Ocean Circulation Experiment off Senegal (COCES) Pierre-Marie Poulain Istituto Nazionale di Oceanografia e di Geofisica
DISTRIBUTION STATEMENT A. Approved for public release; distribution is unlimited. Coastal Ocean Circulation Experiment off Senegal (COCES) Pierre-Marie Poulain Istituto Nazionale di Oceanografia e di Geofisica
Coupled Ocean-Atmosphere Modeling of the Coastal Zone
 Coupled Ocean-Atmosphere Modeling of the Coastal Zone Eric D. Skyllingstad College of Oceanic and Atmospheric Sciences, Oregon State University 14 Ocean Admin. Bldg., Corvallis, OR 97331 Phone: (541) 737-5697
2001 State of the Ocean: Chemical and Biological Oceanographic Conditions in the Newfoundland Region
 Stock Status Report G2-2 (2) 1 State of the Ocean: Chemical and Biological Oceanographic Conditions in the Background The Altantic Zone Monitoring Program (AZMP) was implemented in 1998 with the aim of
Exploring the Temporal and Spatial Dynamics of UV Attenuation and CDOM in the Surface Ocean using New Algorithms
 Exploring the Temporal and Spatial Dynamics of UV Attenuation and CDOM in the Surface Ocean using New Algorithms William L. Miller Department of Marine Sciences University of Georgia Athens, Georgia 30602
Marta-Almeida M, Mauro Cirano, Lessa, GC, Aguiar, AL, Amorim FN
 EXCHANGE PROCESSES BETWEEN THE BAÍA DE TODOS OS SANTOS AND THE EASTERN BRAZILIAN SHELF: THE IMPACT OF DOWNSCALING FROM A 1/12 OCEAN FORECASTING SYSTEM TO A BAY/COASTAL REGIONAL SYSTEM Marta-Almeida M,
Preliminary cruise report: Acoustic assessment of the Iceland-Greenland-Jan Mayen capelin stock in January 2018.
 Preliminary cruise report: Acoustic assessment of the Iceland-Greenland-Jan Mayen capelin stock in January 2018. Cruise: A02-2018 Period: 16.01.-31.01. 2018. Cruise: PA01-2018 Period: 18.01-31.01. 2018.
Understanding the role of the YS Bottom Cold Water ( 10 C) on the survival strategy of Euphausia pacifica throughout the hot summer
 on the survival strategy of Euphausia pacifica throughout the hot summer") Understanding the role of the YS Bottom Cold Water ( 10 C) on the survival strategy of Euphausia pacifica throughout the hot summer Euphausia pacifica Se-J. Ju, H.S. Kim, W.S. Kim, D.H. Kang and A.R. Ko
Understanding the role of the YS Bottom Cold Water ( 10 C) on the survival strategy of Euphausia pacifica throughout the hot summer Euphausia pacifica Se-J. Ju, H.S. Kim, W.S. Kim, D.H. Kang and A.R. Ko
Appendix G.19 Hatch Report Pacific NorthWest LNG Lelu Island LNG Maintenance Dredging at the Materials Offloading Facility
 Appendix G.19 Hatch Report Pacific NorthWest LNG Lelu Island LNG Maintenance Dredging at the Materials Offloading Facility Project Memo H345670 To: Capt. David Kyle From: O. Sayao/L. Absalonsen December
Marine Ecology Pacing Guide
 Marine Ecology Pacing Guide Course Description: The focus of the course is the interrelationships among marine organisms and the physical, chemical, geological and biological factors. North Carolina coastal
Offshore Video Survey and Oceanographic Analysis: Georges Bank to the Chesapeake project
 Non-Technical Synopsis of the Offshore Video Survey and Oceanographic Analysis: Georges Bank to the Chesapeake project Executive Summary Dave Bethoney Kristin Kleisner Mark Anderson Changsheng Chen Bradley
W. R. Bowering and D. Power Northwest Atlantic Fisheries Centre, P. O. Box 5667 St. John s, Newfoundland, Canada A1C 5X1. Abstract
 NAFO Sci. Coun. Studies, 22: 51 61 Spatial Distribution of Greenland Halibut (Reinhardtius hippoglossoides (Walbaum)) in the Labrador-Eastern Newfoundland Area of the Canadian Northwest Atlantic W. R.
Appendix B. Contents. Elliston instrument deployment data report. Olympic Dam Expansion Supplementary Environmental Impact Statement 2010
 Project Alternatives Appendix B Contents B1 Elliston instrument deployment data report 1 Olympic Dam Expansion Supplementary Environmental Impact Statement 2010 Appendix B1 Elliston instrument deployment
Modeling the dispersal of eastern oyster (Crassostrea virginica) larvae in Delaware Bay
 larvae in Delaware Bay") Journal of Marine Research, 70, 381 409, 2012 Modeling the dispersal of eastern oyster (Crassostrea virginica) larvae in Delaware Bay by Diego A. Narváez 1,2, John M. Klinck 1, Eric N. Powell 3, Eileen
Journal of Marine Research, 70, 381 409, 2012 Modeling the dispersal of eastern oyster (Crassostrea virginica) larvae in Delaware Bay by Diego A. Narváez 1,2, John M. Klinck 1, Eric N. Powell 3, Eileen
A Structure of the Kuroshio and Its Related Upwelling on the East China Sea Shelf Slope
 Journal of Oceanography Vol. 51, pp. 267 to 278. 1995 A Structure of the Kuroshio and Its Related Upwelling on the East China Sea Shelf Slope TOSHIMICHI ITO 1 *, ARATA KANEKO 2, HIROHITO FURUKAWA 3 **,
Geoduck Floating Nursery Monitoring Plan, Quarterly Reporting
 December 23, 2014 Mason County Department of Community Development Attn: Grace Miller, Senior Planner 411 N. Fifth Street PO Box 279 Shelton, WA 98584 Re: Geoduck Floating Nursery Monitoring Plan, Quarterly
ROLE OF CLOUD RADIATION INTERACTION IN THE DIURNAL VARIATION OF PRECIPITATION
 ROLE OF CLOUD RADIATION INTERACTION IN THE DIURNAL VARIATION OF PRECIPITATION SETHU RAMAN AND ADRIENNE WOOTTEN DEPARTMENT OF MARINE, EARTH AND ATMOSPHERIC SCIENCES NORTH CAROLINA STATE UNIVERSITY, RALEIGH,
Spectrophotometric titrations to characterize and monitor chromophoric dissolved organic matter (CDOM) in natural waters
 in natural waters") Spectrophotometric titrations to characterize and monitor chromophoric dissolved organic matter (CDOM) in natural waters Carmen Cartisano*, Rossana Del Vecchio, and Neil Blough* * Department of Chemistry
Spectrophotometric titrations to characterize and monitor chromophoric dissolved organic matter (CDOM) in natural waters Carmen Cartisano*, Rossana Del Vecchio, and Neil Blough* * Department of Chemistry
A Study of Vertical Patterns and Mechanisms of Along-channel Estuarine Circulation. A Thesis. Presented to
 A Study of Vertical Patterns and Mechanisms of Along-channel Estuarine Circulation A Thesis Presented to The Faculty of the School of Marine Science The College of William and Mary in Virginia In Partial
Larvae survive, grow, develop, disperse. Adult. Juvenile. Rocky Intertidal Ecology
 Rocky Intertidal Ecology Bipartite life cycle of benthic marine organisms with pelagic larvae review I. Population Structure (review) II. Settlement & Recruitment III. Zonation IV. Experiments that changed
Characterization of Flow Rates in an In-Water Algal Harvesting Flume
 COLLEGE OF WILLIAM AND MARY PHYSICS DEPARTMENT Characterization of Flow Rates in an In-Water Algal Harvesting Flume By Kristin Rhodes Advisor: Dr. William Cooke May 2012 A report submitted in partial fulfillment
Multivariate time-series forecasting of the NE Arabian Sea Oil Sardine fishery using satellite covariates
 Multivariate time-series forecasting of the NE Arabian Sea Oil Sardine fishery using satellite covariates Eli Holmes 1, Nimit Kumar 2, Sourav Maity 2, B.R Smitha 3, Sherine Cubelio 3, Cara Wilson 4, Narayanane
APPENDIX B PHYSICAL BASELINE STUDY: NORTHEAST BAFFIN BAY 1
 APPENDIX B PHYSICAL BASELINE STUDY: NORTHEAST BAFFIN BAY 1 1 By David B. Fissel, Mar Martínez de Saavedra Álvarez, and Randy C. Kerr, ASL Environmental Sciences Inc. (Feb. 2012) West Greenland Seismic
Observing the ice-covered oceans around Antarctica by profiling floats
 Observing the ice-covered oceans around Antarctica by profiling floats Annie Wong, Stephen Riser School of Oceanography University of Washington, USA Aug 1 2007 Since 2007, UW has deployed 83 profiling
Novel Acoustic Techniques for Assessing Fish Schooling in the Context of an Operational Ocean Observatory
 Novel Acoustic Techniques for Assessing Fish Schooling in the Context of an Operational Ocean Observatory Kelly J. Benoit-Bird College of Oceanic and Atmospheric Sciences, Oregon State University 104 COAS
Modeling the Circulation in Penobscot Bay, Maine
 Modeling the Circulation in Penobscot Bay, Maine Huijie Xue 1, Yu Xu 1, David Brooks 2, Neal Pettigrew 1, John Wallinga 1 1. School of Marine Sciences, University of Maine, Orono, ME 4469-5741. 2. Department