The SDSS - data & how to get it Jarle Brinchmann Leiden,
|
|
|
- Colin Benson
- 5 years ago
- Views:
Transcription

1 The SDSS - data & how to get it Jarle Brinchmann Leiden,
 The general characteristics of the survey The data obtained and the quantities measured Gotcha s Navigation of the SDSS online data")
2 An outline Galaxy bimodality The AGN population Environment - does it matter? The M-Z relation. Large-scale structure stuff The Sloan Digital Sky Survey (SDSS) The general characteristics of the survey The data obtained and the quantities measured Gotcha s Navigation of the SDSS online data Databases - a slight detour SQL - clever searching Extracting data from the SDSS and making use of it all Going further - web services, matches to other surveys etc.
3 What might it be useful for during your research? You might be able to use the SDSS to create a comparison sample for your analysis. E.g. find similar stars, galaxy clusters and extract these to put your results in context. You might learn a bit of SQL, doesn t hurt. Quick way to create finding charts. You may simply have need for the data!... Hopefully you ll have ideas of your own after this presentation!


4 The SDSS The most ambitious survey of the sky ever undertaken. Imaging survey of 8600 square degrees. Redshifts of more than 1,000,000 galaxies & QSOs. Robotic 2.5m telescope - imaging & Spectrscopy


5 Parts of the RC3 NGC 1068 NGC 3718 NGC 2782 NGC 3310 Plans exist to create a Gunn Atlas of Galaxies NGC 1068


6 The SDSS DR7 - (Autumn 2008) Legacy 5 band imaging over 8423 deg 2 down to r~21.5 ~230 million objects Spectra covering 3800Å-9200Å with R~ ,567 galaxy spectra, 109,862 QSO spectra with z<2.3 and 8,802 high-z QSOs Median seeing SEGUE 5 band imaging over 3240 deg 2 ~127 million objects. 229,466 spectra of stars of type K and earlier, and 7,922 M stars and later. log g, Teff, [Fe/H] and And: Supernova survey, M 31 and other special scans & low galactic latitude runs
7 DR5
8 DR5

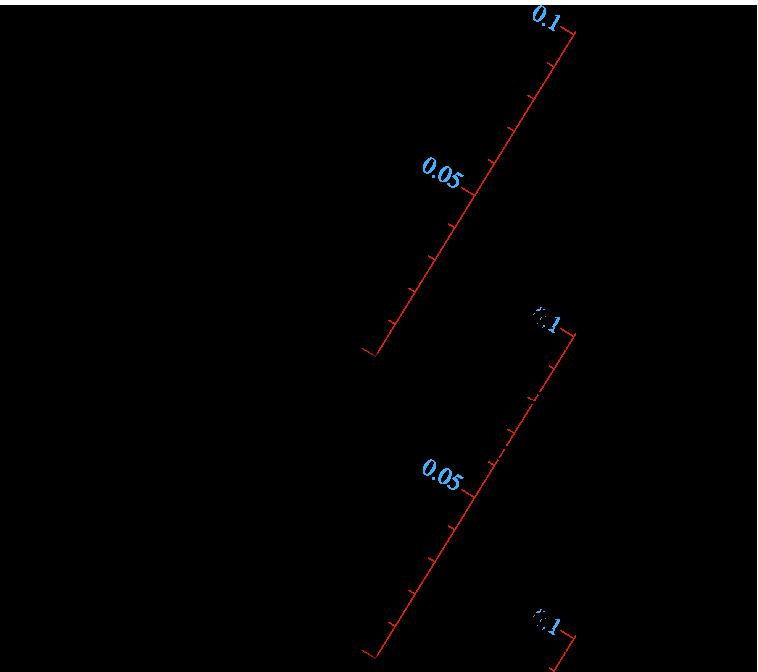
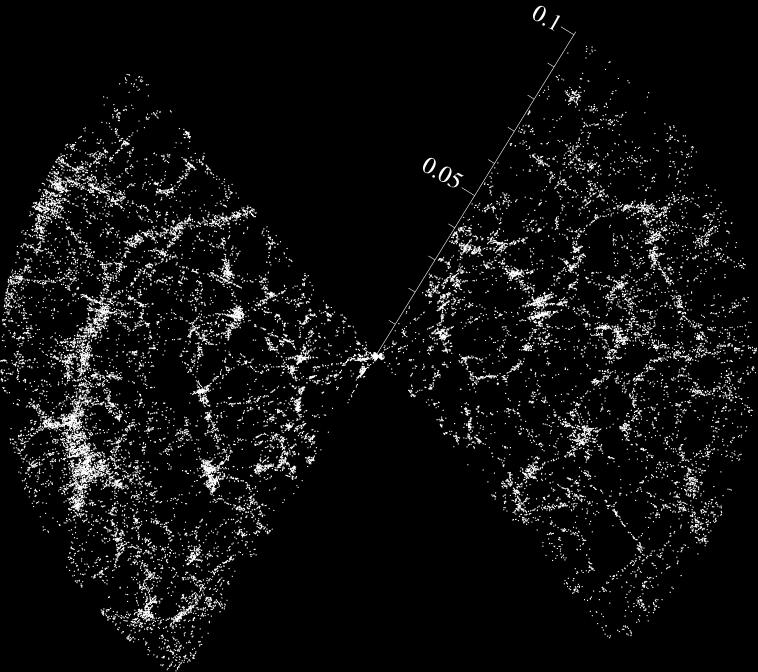
9 DR5 Sloan Great Wall
10 The Workings Images are taken in a drift-scan using a mosaic camera with five filters. Each scan is called a strip, but to cover gaps a second scan is made and the combination is called a stripe. The exposure time is ~54s with ~73s between each filter. The images are then analysed using a code called Photo and based on the measurements objects are selected for spectroscopy. Spectroscopy is carried out the following season using a fibre spectrograph with 3 fibres covering 3800Å-9000Å. Spectroscopic data are analysed using two pipelines and imaging & spectroscopy is released to the public.
11 Advantages/ Disadvantages Very uniform and well-characterised photometry & spectroscopy and automatic pipeline. Very large dataset & advanced data base interface allow (relatively) simple access. Decent spectral resolution & S/N. r-band selection. Images have mediocre seeing & relatively shallow. Limited amount of matching data (radio, X-ray, submm, HST etc.) Automatic data reduction not ideal for all types of objects.
12 Did the SDSS find anything new? The low-z universe has been well studied up through the years - was there anything new to be found? Tully-Fisher Faber-Jackson Luminosity functions Mg 2 -σ Colour-Magnitude etc.
13 Did the SDSS find anything new? The low-z universe has been well studied up through the years - was there anything new to be found? Main progress areas: Yes! Tully-Fisher Faber-Jackson Luminosity functions Mg 2 -σ Colour-Magnitude etc. Well-understood selection function allows the construction of distribution functions. The vastness of the sample provides large samples of extreme objects. Well-known trends can be studied with very high precision.
14 Luminosity function Is it a Schechter function?
15 Luminosity function Is it a Schechter function?
16 Luminosity function Not quite. But quite close... Is it a Schechter function?
17 Luminosity function Not quite. But quite close... Is it a Schechter function? And remember: z= is 2.5 Gyr Evolution is important
18 Mass Function Panter et al (2004)
19 Mass Function Panter et al (2004) Note excess at large mass/luminosity - likely either to be cd galaxies or photometric problems.
20 Bi-modality A key result from the SDSS was to show how ubiquitous bi-modality is in the local universe
21 Bi-modality A key result from the SDSS was to show how ubiquitous bi-modality is in the local universe In colour. (Baldry et al 2004; Blanton et al 2003; Hogg et al ) Baldry et al (2004) >50% of all galaxies M r < -22 are on the red sequence u-r
22 Bi-modality A key result from the SDSS was to show how ubiquitous bi-modality is in the local universe In D4000 & HδA (SFH) (Kauffmann et al 2003ab)
 (Kauffmann et al 2003ab) Characteristic mass: ~3x10 10 M Also characteristic µ * =3x10 8")
23 Bi-modality A key result from the SDSS was to show how ubiquitous bi-modality is in the local universe In D4000 & HδA (SFH) (Kauffmann et al 2003ab) Characteristic mass: ~3x10 10 M Also characteristic µ * =3x10 8 M
24 Bi-modality A key result from the SDSS was to show how ubiquitous bi-modality is in the local universe And in SFR/M* (Brinchmann et al 2004) Again a transition around M* ~ 3x10 10 M Fraction Log SFR/M * [yr -1 ]
25 Galaxy-Galaxy lensing The SDSS is not ideal for lensing because the image quality is rather mediocre, but there is plenty of galaxies! This has been used by Mandelbaum et al in a series of papers to study shape correlations, halo mass vs stellar mass etc. Here is the halo mass vs stellar mass comparison:
26 Galaxy-Quasar lensing and dust in galaxy halos QSOs Lensing Observer
27 Galaxy-Quasar lensing and dust in galaxy halos QSOs Lensing + reddening Observer

28 Galaxy-Quasar lensing and dust in galaxy halos QSOs Lensing + reddening Observer Gravitational lensing is achromatic, so if you correlate QSOs with galaxies and look at magnification and the dependence on wavelength you might find signs of dust in galaxy halos.
29 Galaxy-Quasar lensing and dust in galaxy halos Ménard et al (2009)
30 Galaxy-Quasar lensing and dust in galaxy halos Ménard et al (2009) E(B-V) ~ 1.4x10⁻³ (θ/1 ) They argue that the main contribution of dust is from L ~ 0.5L * galaxies and this gives a typical dust mass in the halo of ~10 7 M The mean opacity of the Universe is A V ~ 0.05 mag to z~1

31 So, how do you do these studies using the imaging data?
32 Magnitude System(s) Normal magnitudes: m=-2.5 Log 10 f + zp asinh magnitudes (luptitudes): m=-2.5/ln(10) [asinh((f/f0)/(2b)) + ln(b)] The difference is small (irrelevant) for bright objects but is very important at faint flux levels! nano-maggies: A linear flux measurement such that 1 nmgy corresponds to a conventional magnitude of Widely used in NYU VAGC & Princeton data.
33 Magnitude System(s)
34 Magnitude System(s) Relationship to other photometric calibrations: The SDSS is a near AB magnitude system. Thus conversion to Janskys is fairly easy: AB=2.5 ( 23 - log 10 F [Jy] ) But there are some small offsets, such that: u AB = u SDSS & z AB = z SDSS To convert to Johnson etc systems: An example (for stars, from Robert Lupton): B = g *(g - r) V = g *(g - r) R = r *(r - i) I = i *(i - z)
35 Magnitude System(s) Relationship to other photometric calibrations: The SDSS is a near AB magnitude system. Thus conversion to Janskys is fairly easy: AB=2.5 Be aware ( 23 that - log 10 there F [Jy] now ) - is 48.6 Ubercalibration: Reduced systematic effects across the entire survey (~1%). But there are some small offsets, such that: u AB = u SDSS & z AB = z SDSS To convert to Johnson etc systems: (Padmanabhan et al 2007) An example (for stars, from Robert Lupton): B = g *(g - r) V = g *(g - r) R = r *(r - i) I = i *(i - z)
36 The offerings: Photometry Photometric data comes from Photo:
37 The offerings: Photometry Photometric data comes from Photo: Magnitudes [ugriz, Petrosian, Model, Apertures, PSF]
38 The offerings: Photometry Photometric data comes from Photo: Magnitudes [ugriz, Petrosian, Model, Apertures, PSF] Sizes [Petrosian radii, Image moments]
39 The offerings: Photometry Photometric data comes from Photo: Magnitudes [ugriz, Petrosian, Model, Apertures, PSF] Sizes [Petrosian radii, Image moments] Positions [better than 0.1, often multiple observations]
40 The offerings: Photometry Photometric data comes from Photo: Magnitudes [ugriz, Petrosian, Model, Apertures, PSF] Sizes [Petrosian radii, Image moments] Positions [better than 0.1, often multiple observations] Shapes, orientations [image moments]
41 The offerings: Photometry Photometric data comes from Photo: Magnitudes [ugriz, Petrosian, Model, Apertures, PSF] Sizes [Petrosian radii, Image moments] Positions [better than 0.1, often multiple observations] Shapes, orientations [image moments] Images [full field, JPGs, objects only - atlas images ]
42 The offerings: Photometry Photometric data comes from Photo: Magnitudes [ugriz, Petrosian, Model, Apertures, PSF] Sizes [Petrosian radii, Image moments] Positions [better than 0.1, often multiple observations] Shapes, orientations [image moments] Images [full field, JPGs, objects only - atlas images ] Image quality [position dependent PSF as PCAs]
43 The offerings: Photometry - Advice Reliability:
44 The offerings: Photometry - Advice Reliability: The r-band is in general the most reliable - u & z might be poor quality.
45 The offerings: Photometry - Advice Reliability: The r-band is in general the most reliable - u & z might be poor quality. r<21.5 should in general be fine, but be aware of singleband detections (typical detection limit rab ~ 22.5).
46 The offerings: Photometry - Advice Reliability: The r-band is in general the most reliable - u & z might be poor quality. r<21.5 should in general be fine, but be aware of singleband detections (typical detection limit rab ~ 22.5). r<14.5 requires care and sky estimates for very large galaxies are often poor. See e.g. Blanton et al (2005) for details.
47 The offerings: Photometry - Advice Reliability: The r-band is in general the most reliable - u & z might be poor quality. r<21.5 should in general be fine, but be aware of singleband detections (typical detection limit rab ~ 22.5). r<14.5 requires care and sky estimates for very large galaxies are often poor. See e.g. Blanton et al (2005) for details. Large, actively star forming galaxies are sometimes shredded with multiple spectroscopic targets.
48 The offerings: Photometry - Advice Reliability: The r-band is in general the most reliable - u & z might be poor quality. r<21.5 should in general be fine, but be aware of singleband detections (typical detection limit rab ~ 22.5). r<14.5 requires care and sky estimates for very large galaxies are often poor. See e.g. Blanton et al (2005) for details. Large, actively star forming galaxies are sometimes shredded with multiple spectroscopic targets. Take care to check imaging flags.
49 The offerings: Photometry - Advice Reliability: The r-band is in general the most reliable - u & z might be poor quality. r<21.5 should in general be fine, but be aware of singleband detections (typical detection limit rab ~ 22.5). r<14.5 requires care and sky estimates for very large galaxies are often poor. See e.g. Blanton et al (2005) for details. Large, actively star forming galaxies are sometimes shredded with multiple spectroscopic targets. Take care to check imaging flags. What should I use? For colours: Model magnitudes or aperture magnitudes. For total flux: Petrosian or optimal model magnitudes. Fiber magnitudes are useful to check spectrophotometry.
. r<14.5 requires care and sky estimates for very large galaxies are often poor. See e.g. Blanton et al (2005) for details.")
50 The offerings: Photometry - Advice Reliability: The r-band is in general the most reliable - u & z might be poor quality. r<21.5 should in general be fine, but be aware of singleband detections (typical detection limit rab ~ 22.5). r<14.5 requires care and sky estimates for very large galaxies are often poor. See e.g. Blanton et al (2005) for details. Large, actively star forming galaxies are sometimes shredded with multiple spectroscopic targets. Take care to check imaging flags. What should I use? For colours: Model magnitudes or aperture magnitudes. For total flux: Petrosian or optimal model magnitudes. Fiber magnitudes are useful to check spectrophotometry.
51 Imaging Flags... These are set as individual bits in a long integer to indicate whether all was well with the photometric analysis. It is crucial to check these when doing accurate work! Some examples: SATURATED: Tells you whether the image of an object was saturated. EDGE: Is the object on the edge (commonly the case for large galaxies). CHILD: Is this object part of a larger object that was split? MOVED: Did the object move? etc. etc. See catalogs/flags.html for details.

52 Databases & SQL
53 The need for Databases Very large data sets require advanced techniques for analysis. Most researchers lack the skills to do e.g. correlation functions for >10 8 objects. Normal files (e.g. text files, FITS files) are inconvenient when >1000 properties are measured for each object. The indexing properties of databases make searches in general very fast and flexible and allow for powerful combinations of tables. It is even useful outside of astronomy... :)
54 Interplay Web server HTML pages (typically) Browser User XML Data base server Often SQL User interface Efficient data transfer Data store (local or anywhere on the net)
55 A simple version of the SDSS model Object ID Image Position u,g,r,i,z Profiles Object ID Object ID SpecObjID Redshift Spectra Via SpecLine Emission line flux SpecObj
56 A simple version of the SDSS model Object ID Image SpecObjID Spectra Position u,g,r,i,z Profiles Redshift Via SpecLine Emission line flux SpecObj Object ID Object ID Note that a given position can pay host to different objects! Note also that the photometric objects really live in a separate data base table from the spectroscopic objects - the keys connect the two. Note also that there is a lot of information outside this structure e.g.:
57 A simple version of the SDSS model Object ID Image SpecObjID Spectra Position u,g,r,i,z Profiles Redshift Via SpecLine Emission line flux SpecObj Object ID Object ID Note that a given position can pay host to different objects! Note also that the photometric objects really live in a separate data base table from the spectroscopic objects - the keys connect the two. Note also that there is a lot of information outside this structure e.g.: X-ray data, common names ++
58 The SDSS Database Tables PhotoObjAll, SpecObjAll, Photoz, RC3, etc... These contain the different sets of data and form the backbone Views PhotoObj, SpecObj, Galaxy, Star, Sky etc... These are provide convenient interfaces to Tables. This is often what you want to use! Functions fdistanceeq, ffield, fgetnearbyobjeq etc... Functions that might be very useful in queries and can also save you quite a bit of work. They are particularly powerful when combined with iteration To find out exactly what is available: Look at the Schema
59 Tables The SDSS Database PhotoObjAll, SpecObjAll, Photoz, RC3, etc... These contain the different sets of data and form the backbone Important: Views Best vs. Target PhotoObj, SpecObj, Galaxy, Star, Sky etc... These are provide convenient interfaces to Tables. This is often what you want to use! The photometry that was used when deciding spectroscopic targets is stored in Target - this is often different from the Functions fdistanceeq, ffield, fgetnearbyobjeq etc... Functions that might be very useful in queries and can also save you quite a bit of work. They are particularly powerful when combined currently with iteration Best reductions. You have to choose one of these two contexts. To find Normally out exactly you what want is available: to use Best. Look at the Schema
60 Tables The SDSS Database Important: Primary & SciencePrimary PhotoObjAll, SpecObjAll, Photoz, RC3, etc... These contain the different sets of data and form the backbone Important: Views Best vs. Target PhotoObj, SpecObj, Galaxy, Star, Sky etc... Each real object on the sky should have one Primary object These are associated provide convenient with it. interfaces They might to Tables. also This have is often Secondary what you want to use! objects associated but you will often only need primary The photometry that was used when deciding spectroscopic targets is stored in Target - this is often different from the Functions objects. fdistanceeq, ffield, fgetnearbyobjeq etc... Functions that might be very useful in queries and can also save you quite a bit of work. They are particularly powerful when combined currently with iteration Best reductions. You have to For spectra there is a similar sounding quantity called SciencePrimary - this indicates whether the spectrum is choose one of these two contexts. considered good enough quality AND that this is not a reobservation. To find Normally out exactly you what want is available: to use Best. Look at the Schema For SEGUE this distinction is not very useful

61 Look for keys Access to various parts of the database The view, table or function
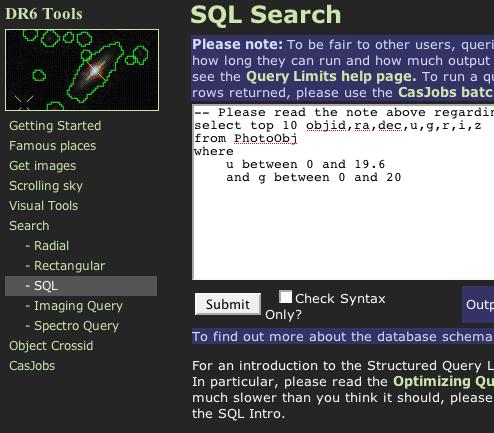
62 Structured Query Language - SQL A computer language designed for efficient query of databases. It is used both to create tables/databases and to search these. In our work we are often only concerned with the search aspect: SELECT specifies what is to be returned FROM specifies what table to use WHERE is an optional clause that specifies a subset of the full data. But be aware that for advanced searches it is often necessary/convenient to be able to CREATE temporary tables. Combinations of tables can be done using JOINs. These require that there are entries in each table that are in common.
63 Structured Query Language - SQL SELECT objid, u, g, r, FROM PhotoPrimary WHERE u - g < 0.4 and g - r < 0.7
64 Structured Query Language - SQL SELECT objid, u, g, r, Select something FROM PhotoPrimary WHERE u - g < 0.4 and g - r < 0.7
65 Structured Query Language - SQL SELECT objid, u, g, r, FROM PhotoPrimary WHERE u - g < 0.4 and g - r < 0.7 Select something From a table/view
66 Structured Query Language - SQL SELECT objid, u, g, r, FROM PhotoPrimary WHERE u - g < 0.4 and g - r < 0.7 Select something From a table/view According to a criterion
67 Count galaxies: Some examples: SELECT COUNT(*) AS "Low redshift galaxies" FROM SpecObj WHERE z BETWEEN AND 0.2
68 Count galaxies: Some examples: SELECT COUNT(*) AS "Low redshift galaxies" FROM SpecObj WHERE z BETWEEN AND 0.2 SELECT COUNT(*) AS "Low redshift galaxies"
69 Count galaxies: Some examples: SELECT COUNT(*) AS "Low redshift galaxies" FROM SpecObj WHERE z BETWEEN AND 0.2 SELECT COUNT(*) AS "Low redshift galaxies" SQL Statement: we want the following returned
70 Count galaxies: Some examples: SELECT COUNT(*) AS "Low redshift galaxies" FROM SpecObj WHERE z BETWEEN AND 0.2 SELECT COUNT(*) AS "Low redshift galaxies" SQL Statement: we want the following returned Count all matches to the WHERE statement below.
71 Count galaxies: Some examples: SELECT COUNT(*) AS "Low redshift galaxies" FROM SpecObj WHERE z BETWEEN AND 0.2 SELECT COUNT(*) AS "Low redshift galaxies" SQL Statement: we want the following returned Count all matches to the WHERE statement below. Alias for the result - in some systems the return data would be named according to this.
72 Count galaxies: Some examples: SELECT COUNT(*) AS "Low redshift galaxies" FROM SpecObj WHERE z BETWEEN AND 0.2
73 Count galaxies: Some examples: SELECT COUNT(*) AS "Low redshift galaxies" FROM SpecObj WHERE z BETWEEN AND 0.2 FROM SpecObj
74 Count galaxies: Some examples: SELECT COUNT(*) AS "Low redshift galaxies" FROM SpecObj WHERE z BETWEEN AND 0.2 FROM SpecObj SQL Statement: use the following table or view.
75 Count galaxies: Some examples: SELECT COUNT(*) AS "Low redshift galaxies" FROM SpecObj WHERE z BETWEEN AND 0.2 FROM SpecObj SQL Statement: use the following table or view. The table to carry out the search within.
76 Count galaxies: Some examples: SELECT COUNT(*) AS "Low redshift galaxies" FROM SpecObj WHERE z BETWEEN AND 0.2
77 Count galaxies: Some examples: SELECT COUNT(*) AS "Low redshift galaxies" FROM SpecObj WHERE z BETWEEN AND 0.2 WHERE z BETWEEN AND 0.2
78 Count galaxies: Some examples: SELECT COUNT(*) AS "Low redshift galaxies" FROM SpecObj WHERE z BETWEEN AND 0.2 WHERE z BETWEEN AND 0.2 SQL Statement: Only include the objects satisfying the following constraints
79 Count galaxies: Some examples: SELECT COUNT(*) AS "Low redshift galaxies" FROM SpecObj WHERE z BETWEEN AND 0.2 WHERE z BETWEEN AND 0.2 SQL Statement: Only include the objects satisfying the following constraints Only objects with redshifts between and 0.2
80 Bimodality search select top 5000 modelmag_u-extinction_u as u, modelmag_r-extinction_r as r, z, dbo.fcosmoabsmag(petromag_r-extinction_r, z) as AbsMag_R FROM SpecPhoto Where z between 0.05 and 0.07

81 Classifying emission line galaxies: The BPT diagram Metal content Hardness of ionization Baldwin, Phillips & Terlevich (1981)
82 SFR Inventory (I) Size Type Brinchmann et al (2004) Kauffmann et al 2003; Blanton et al 2003
 Kauffmann et al 2003; Blanton et al")
83 SFR Inventory (I) So the SFR density in the local universe is dominated by disk galaxies similar to the Milky Way in size Size Type Brinchmann et al (2004) Kauffmann et al 2003; Blanton et al 2003
84 SFR Inventory (II) SFH Dust Metals Brinchmann et al (2004)

85 SFR Inventory (II) Most new stars in the low-z universe have ~solar abundance and while most galaxies show little attenuation, most of the stars are extincted by ~1 magnitude at H-alpha. SFH Dust Metals Brinchmann et al (2004)
86 The Mass- Metallicity Relation Tremonti et al (2004): Clear turn-over in the relation between stellar mass and gas metallicity. 12+Log O H= Log M * Log M * 2 Turn-over around Log M=10.5. Again that mass Log M=10.5! Note that the absolute metal abundance is uncertain and quite likely too high by ~0.3 dex.
87 Star Formation Histories Galaxy spectra are records of the past history of star formation in galaxies - so one can aim to invert the galaxy spectra to get their star formation history (e.g. using MOPED, STECMAP etc.) Heavens et al (2004) Downsizing very clear - without looking back in time! The method loses resolution as one looks back in time. See also Mathis et al (2006) Heavens et al 2004; Panter et al 2004; Mathis et al 2006

88 Working with spectra
89 The offerings: Spectroscopy Spectroscopic data comes from spectro1d:
90 The offerings: Spectroscopy Spectroscopic data comes from spectro1d: Absorption line indices [Lick + a few more]
91 The offerings: Spectroscopy Spectroscopic data comes from spectro1d: Absorption line indices [Lick + a few more] Emission lines [Fluxes, EWs, widths]
92 The offerings: Spectroscopy Spectroscopic data comes from spectro1d: Absorption line indices [Lick + a few more] Emission lines [Fluxes, EWs, widths] Velocity dispersions [Two pipelines, Elodie PCA]
93 The offerings: Spectroscopy Spectroscopic data comes from spectro1d: Absorption line indices [Lick + a few more] Emission lines [Fluxes, EWs, widths] Velocity dispersions [Two pipelines, Elodie PCA] Probably the area where using Value-Added Catalogues is a useful alternative! In particular the MPA-JHU database with more careful continuum subtraction and the NYU VAGC which has more matching and is an excellent base sample for further work.
94 The offerings: Spectroscopy - Advice Reliability:
95 The offerings: Spectroscopy - Advice Reliability: [O II]3727Å is not measured for low-z galaxies.
96 The offerings: Spectroscopy - Advice Reliability: [O II]3727Å is not measured for low-z galaxies. Very strong emission lines are sometimes clipped.
97 The offerings: Spectroscopy - Advice Reliability: [O II]3727Å is not measured for low-z galaxies. Very strong emission lines are sometimes clipped. Bright sky and/or CCD defects might cause some lines not to be measured.
98 The offerings: Spectroscopy - Advice Reliability: [O II]3727Å is not measured for low-z galaxies. Very strong emission lines are sometimes clipped. Bright sky and/or CCD defects might cause some lines not to be measured. Sky subtraction is not very good in the red [c.f. Wild et al 2005]
99 The offerings: Spectroscopy - Advice Reliability: [O II]3727Å is not measured for low-z galaxies. Very strong emission lines are sometimes clipped. Bright sky and/or CCD defects might cause some lines not to be measured. Sky subtraction is not very good in the red [c.f. Wild et al 2005] The spectrophotometric calibration for DR6 is tied to PSF magnitudes - watch out for galaxies!
100 The offerings: Spectroscopy - Advice Reliability: [O II]3727Å is not measured for low-z galaxies. Very strong emission lines are sometimes clipped. Bright sky and/or CCD defects might cause some lines not to be measured. Sky subtraction is not very good in the red [c.f. Wild et al 2005] The spectrophotometric calibration for DR6 is tied to PSF magnitudes - watch out for galaxies! The slope of the spectrum in the blue is only good to the ~few % level.
![The offerings: Spectroscopy - Advice Reliability: [O II]3727Å is not measured for low-z galaxies. Very strong emission lines are sometimes clipped.](/docs-images/85/92944737/images/101-1.jpg "Bright sky and/or CCD defects might cause some lines not to be measured. Sky subtraction is not very good in the red [c.f. Wild et al 2005] The spectrophotometric calibration for DR6 is tied to PSF magnitudes - watch out for galaxies!")
101 The offerings: Spectroscopy - Advice Reliability: [O II]3727Å is not measured for low-z galaxies. Very strong emission lines are sometimes clipped. Bright sky and/or CCD defects might cause some lines not to be measured. Sky subtraction is not very good in the red [c.f. Wild et al 2005] The spectrophotometric calibration for DR6 is tied to PSF magnitudes - watch out for galaxies! The slope of the spectrum in the blue is only good to the ~few % level.
102 The offerings: SEGUE Stellar analysis from SEGUE
103 The offerings: SEGUE Stellar analysis from SEGUE Absorption line indices [Lick + a few more]
104 The offerings: SEGUE Stellar analysis from SEGUE Absorption line indices [Lick + a few more] Stellar parameters [Teff, log g, [Fe/H], R V ]
105 The offerings: SEGUE Stellar analysis from SEGUE Absorption line indices [Lick + a few more] Stellar parameters [Teff, log g, [Fe/H], R V ] The stellar parameters are derived from a number of different pipelines. Since the spectra in the SDSS are not optimal to derive stellar parameters it is necessary to compare these estimates to assess the quality of the results! And also to get external data with better resolution. ([Fe/H] ~ 0 show noticeable systematic offset). SEGUE in general targets lower Galactic latitudes and crowded fields and go outside the normal SDSS footprint. Thus much of the data is not in the normal CAS context!
106 The offerings: Some Others The SDSS Supernova search - repeat observations of Stripe 82. These are sometimes taken in poor conditions and are therefore provided in uncalibrated form.
107 The offerings: Some Others The SDSS Supernova search - repeat observations of Stripe 82. These are sometimes taken in poor conditions and are therefore provided in uncalibrated form. Moving objects [from repeat observations]
108 The offerings: Some Others The SDSS Supernova search - repeat observations of Stripe 82. These are sometimes taken in poor conditions and are therefore provided in uncalibrated form. Moving objects [from repeat observations] Variability [from repeat observations]
109 The offerings: Some Others The SDSS Supernova search - repeat observations of Stripe 82. These are sometimes taken in poor conditions and are therefore provided in uncalibrated form. Moving objects [from repeat observations] Variability [from repeat observations] Observing conditions [extinction, seeing etc.]
110 The offerings: Some Others The SDSS Supernova search - repeat observations of Stripe 82. These are sometimes taken in poor conditions and are therefore provided in uncalibrated form. Moving objects [from repeat observations] Variability [from repeat observations] Observing conditions [extinction, seeing etc.] Raw data [raw counts etc.]
111 Value-Added Data Very important! When people have done some careful job they might offer this as a value-added catalogue. Using these, rather than the official SDSS data might save you a lot of time and effort! Finding out about these: Read papers!! Check the SDSS VAC page: Listen carefully - as I will say this only once
112 Value-Added Data The NYU VAGC Large-Scale Structure samples with well characterised selection functions. Cross-matches of SDSS to other surveys. MPA-JHU VAGC Improved spectroscopic data reduction, line fluxes and indices. Derived quantities such as SFR, O/H and stellar masses etc. QSO catalogues (Schneider et al) & BAL-QSOs. White Dwarf catalogues (Eisenstein et al) Variable star catalogues from Stripe 82 & CV catalogues Moving objects catalogues Galaxy cluster catalogues (MaxBCG, cut & enhance) & more!
113 See: Blanton et al (2005) The NYU VAGC Large-scale structure sample. Careful characterisation of the survey geometry. Low-z galaxy sample (this is non-trivial to construct). SDSS data sweeps - files with a useful subset of all the data with manageable size (~100 Gb). Sersic fits & a number of other quantities. Various pieces of software - in particular kcorrect which is the most widely used software to calculate k- corrections for SDSS data. Anyone wanting a complete sample of galaxies with photometry & spectroscopy should consider this sample!
114 The MPA-JHU VAGC See e.g: Tremonti et al (2004); Brinchmann et al (2004); Improved continuum subtraction. Pipeline optimised to measure emission lines and absorption line indices on galaxy spectra. Emission lines, absorption line indices. Star formation rates, oxygen abundances, stellar masses, emission line classification of galaxies and stellar metallicities. All the photometric information available in tsobj files for spectroscopic targets. Data organised in a set of FITS files and presently only complete for DR4 but most quantities are present for DR7 as well.
115 Navigating it all
116 Navigating it all
117 The Web Interfaces The web site: Interactive browsing of the sky, finding charts, generic entry point etc. The DAS (Data Archive Server) Access to individual files - flatfiles. For large sets of files and for automatic download The CAS (Catalog Archive Server) Access to the database interfaces Google Earth & Sky
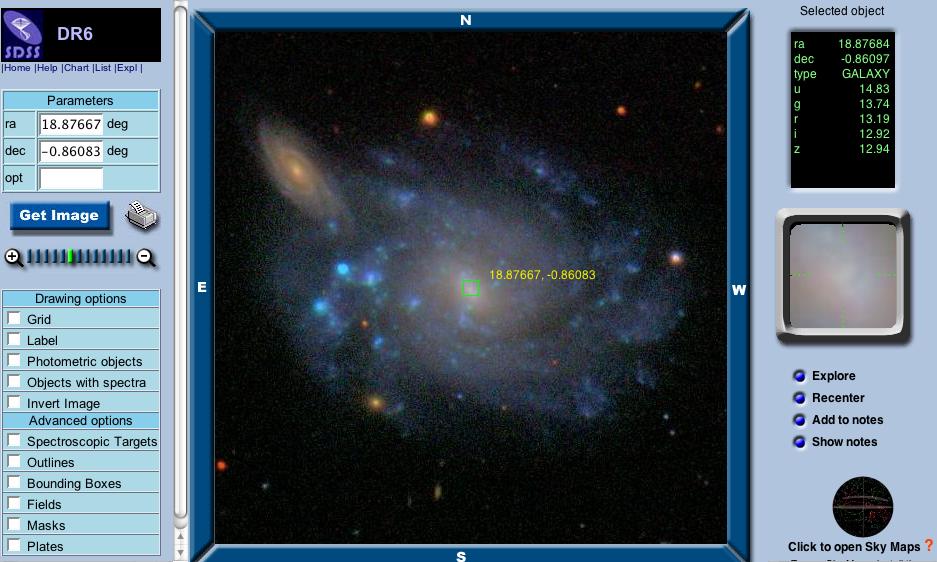
118 Navigate Point and click interface to browsing the sky. Intuitive and with useful overlays of spectroscopic/photometric targets etc. Inspection of individual objects provides much more information and direct access to flat files and NED/Simbad etc. Extremely useful for checking individual objects, problems & spectroscopic targeting.
119 Image Lists Allows the submission of a list of objects to get access to their images and provides links to navigate further. Very useful when matching to old catalogues with moderately good astrometry for instance.

120 Image Lists Allows the submission of a list of objects to get access to their images and provides links to navigate further. Very useful when matching to old catalogues with moderately good astrometry for instance.
121 A small worked example Scientific Question: How does the metal content of stars vary as a function of Galactic latitude? Step 1: Decide what data you require. We need positions & metallicity. Ra, Dec & [Fe/H] (+ quality, flags etc) Step 2: Determine what tables you can get this from. Do you need VACs? sppparams contains what we want (and more) Step 3: Write an appropriate SQL statement & download data Step 4: Read in data & carry out post-processing to visualize the results.
122 A small example Question: How does the metal content of stars vary as a function of Galactic latitude? Step 3: Write an appropriate SQL statement & download data SELECT fehw, ra, dec FROM sppparams WHERE fehwn > 3
123 A small example Question: How does the metal content of stars vary as a function of Galactic latitude? Step 3: Write an appropriate SQL statement & download data SELECT fehw, ra, dec FROM sppparams WHERE fehwn > 3 This is a weighted average of [Fe/H] estimates.
124 A small example Question: How does the metal content of stars vary as a function of Galactic latitude? Step 3: Write an appropriate SQL statement & download data SELECT fehw, ra, dec FROM sppparams WHERE fehwn > 3 This is a weighted average of [Fe/H] estimates. This ensures that only stars with at least 4 different estimates of [Fe/H] are chosen. (In practice I did this within CASJobs and then published the resulting catalogue and downloaded it as a FITS file)
125 A small example Question: How does the metal content of stars vary as a function of Galactic latitude? Step 4: Read in data & carry out post-processing to visualize the results. Convert Ra, Dec to l, b Plot [Fe/H] as a function of l, b and b alone.

126 A small example Question: How does the metal content of stars vary as a function of Galactic latitude? Step 4: Read in data & carry out post-processing to visualize the results. Convert Ra, Dec to l, b Plot [Fe/H] as a function of l, b and b alone.
127 Joins - Combining Tables Table A (e.g. PhotoAll) ID1 u g... Table B (e.g. SpecObjAll) ID1 ID2 Hα z Normal language: Get z from Table B and g from Table A for the same object. SQL: Need a quantity that is common between two tables. Here ID1. Then create a join - where A
128 Joins - Combining Tables Table A (e.g. PhotoAll) ID1 u Table B (e.g. SpecObjAll) ID1 ID2 SELECT A.u, A.g, B.z FROM PhotoAll as A, SpecObjAll as B WHERE A.ID1=B.ID1 g... Hα z Notice that we here use the as construct to give tables a nickname. Note also that this will only get objects that are in both A & B! If you need to combine tables including all elements in A and B you need to do an OUTER JOIN.
129 Joins - Combining Tables Table A (e.g. PhotoAll) ID1 u g... Table B (e.g. SpecObjAll) ID1 ID2 Hα z SELECT A.u, A.g, B.z FROM PhotoAll as A LEFT OUTER JOIN SpecObjAll as B ON A.ID1=B.ID1 The most common left outer join is between photometry and spectroscopy - for this reason there is a view called SpecPhoto which contains this join pre-computed. Use this when you want both spectroscopic info and photometry.
130 Looking at an SDSS Join Find galaxies with EW(Ha) > 40Å SELECT G.ObjID -- we want the photometric ObjID FROM Galaxy as G, SpecObj as S, SpecLine as L WHERE G.ObjID = S.bestObjID -- the spectroscopic object should -- be (photometrically) a galaxy and S.SpecObjID = L.SpecObjID -- and spectral line L is detected in spectrum and L.LineId = 6565 and L.ew > and line L is the H alpha line -- and H alpha is at least angstroms wide

131 Looking at an SDSS Outer Join Find stars with & without spectra in a range: SELECT TOP 20 S.ra, S.dec, S.objID, S.specObjID FROM Star as S LEFT OUTER JOIN SpecObj as Sp ON S.ObjID = Sp.bestObjID WHERE S.ra > 180 AND S.ra < 181 AND abs(s.dec) < 1
132 And a more complex one select fld.run, fld.avg_sky_mujy, fld.runarea as area, isnull(fp.nfirstmatch,0) from ( select run, sum(stripearea) as runarea, 3631e6*avg(power(cast(10. as float),-0.4*sky_r)) as avg_sky_mujy from field group by run ) as fld left outer join ( select p.run, sum(fm.match) as nfirstmatch from First as fm inner join photoprimary as p on p.objid=fm.objid group by p.run ) as fp on fld.run=fp.run order by fld.run

133 Other ways of getting data
134 Flat-Files The SDSS data are kept in a set of FITS files stored at Fermilab - in the DAS. This the reference set of data and is a superset of the CAS. Advantages: Can be analysed off-line using your own code All data available You will be able to measure quantities that have not been measured by the SDSS pipelines. Provided in a manner that matches the observing strategy Disadvantages: Contains often a lot more than what you want Requires some understanding of the survey observing strategy Requires a lot of disk space to store in full - searching the data subsequently requires significant effort.
135 When do you need them? Flat-Files You want to analyse everything You need/prefer to work off-line SQL makes the hair on your back stand up You need data that is not in the database (e.g. images, spectra) You have a specialized analysis pipeline you prefer to use. e.g: Spectroscopic analysis pipeline with better continuum subtraction (Tremonti et al 2004; Brinchmann et al 2004) Improved/specialised image analysis - improved treatment of large galaxies for instance.
136 Flat-Files How do you get them? The Data Archive Server (DAS) You can either browse the file system or create a file containing the necessary information to identify your required files and then upload this to the DAS. Some time later you will be told where to get your data.
137 Flat-Files How do you get them? The Data Archive Server (DAS) What can you get? fpc - calibrated image frames tsobj - One file per fpc with all detected objects spplate - 2D spectra for one plate with 640 fibres spspec - 1D spectra for a plate with measurements psfield - Extinction, PSFs etc. +++ Many more +++

138 Going Further
139 VO access Many key players in SDSS are involved in the Virtual Observatory so this can be used to access the data. Direct access to images in Aladin. Sky search services like OpenSkyQuery ( Spectrum services (Hungary, Baltimore) A number of web services are currently available. The JHU developer website is a good start: skyservice.pha.jhu.edu/develop/vo/
140 Some Hints CASJobs allows the creation of your own tables. This allows complex queries to be made. You need to know how to create tables. You might also need to use Procedures. You can then create a table and loop over this to put final results in a CASJobs table. Google Sky allows you to create KML files to overlay your own information on the sky. Can be useful for matching. And you can write your own scripts to interact with the SDSS - personally I often run these via the casjobs.jar Java library provided by JHU.
The SDSS, Databases and SQL Just another day in database land
 The SDSS, Databases and SQL Just another day in database land Overview of the day A more in-depth discussion of how data bases are put together. Searching data - why databases are useful. The Structured
Introduction to the Sloan Survey
 Introduction to the Sloan Survey Title Rita Sinha IUCAA SDSS The SDSS uses a dedicated, 2.5-meter telescope on Apache Point, NM, equipped with two powerful special-purpose instruments. The 120-megapixel
Introduction to SDSS -instruments, survey strategy, etc
 Introduction to SDSS -instruments, survey strategy, etc (materials from http://www.sdss.org/) Shan Huang 17 February 2010 Survey type Status Imaging and Spectroscopy Basic Facts SDSS-II completed, SDSS-III
Studying galaxies with the Sloan Digital Sky Survey
 Studying galaxies with the Sloan Digital Sky Survey Laboratory exercise, Physics of Galaxies, Spring 2017 (Uppsala Universitet) by Beatriz Villarroel *** The Sloan Digital Sky Survey (SDSS) is the largest
SDSS Data Management and Photometric Quality Assessment
 SDSS Data Management and Photometric Quality Assessment Željko Ivezić Princeton University / University of Washington (and SDSS Collaboration) Thinkshop Robotic Astronomy, Potsdam, July 12-15, 2004 1 Outline
Quasars in the SDSS. Rich Kron NGC June 2006 START CI-Team: Variable Quasars Research Workshop Yerkes Observatory
 Quasars in the SDSS Rich Kron 28 June 2006 START CI-Team: Variable Quasars Research Workshop Yerkes Observatory NGC 1068 About 10% of all of the spectra in the SDSS database are of quasars (as opposed
The SDSS Data. Processing the Data
 The SDSS Data Processing the Data On a clear, dark night, light that has traveled through space for a billion years touches a mountaintop in southern New Mexico and enters the sophisticated instrumentation
ROSAT Roentgen Satellite. Chandra X-ray Observatory
 ROSAT Roentgen Satellite Joint facility: US, Germany, UK Operated 1990 1999 All-sky survey + pointed observations Chandra X-ray Observatory US Mission Operating 1999 present Pointed observations How do
The Sloan Digital Sky Survey
 The Sloan Digital Sky Survey Robert Lupton Xiaohui Fan Jim Gunn Željko Ivezić Jill Knapp Michael Strauss University of Chicago, Fermilab, Institute for Advanced Study, Japanese Participation Group, Johns
Searching for Needles in the Sloan Digital Haystack
 Searching for Needles in the Sloan Digital Haystack Robert Lupton Željko Ivezić Jim Gunn Jill Knapp Michael Strauss University of Chicago, Fermilab, Institute for Advanced Study, Japanese Participation
JINA Observations, Now and in the Near Future
 JINA Observations, Now and in the Near Future Timothy C. Beers Department of Physics & Astronomy Michigan State University & JINA: Joint Institute for Nuclear Astrophysics Examples SDSS-I, II, and III
Design and implementation of the spectra reduction and analysis software for LAMOST telescope
 Design and implementation of the spectra reduction and analysis software for LAMOST telescope A-Li Luo *a, Yan-Xia Zhang a and Yong-Heng Zhao a *a National Astronomical Observatories, Chinese Academy of
Excerpts from previous presentations. Lauren Nicholson CWRU Departments of Astronomy and Physics
 Excerpts from previous presentations Lauren Nicholson CWRU Departments of Astronomy and Physics Part 1: Review of Sloan Digital Sky Survey and the Galaxy Zoo Project Part 2: Putting it all together Part
Real Astronomy from Virtual Observatories
 THE US NATIONAL VIRTUAL OBSERVATORY Real Astronomy from Virtual Observatories Robert Hanisch Space Telescope Science Institute US National Virtual Observatory About this presentation What is a Virtual
(Present and) Future Surveys for Metal-Poor Stars
 Future Surveys for Metal-Poor Stars") (Present and) Future Surveys for Metal-Poor Stars Timothy C. Beers Department of Physics & Astronomy Michigan State University & JINA: Joint Institute for Nuclear Astrophysics SDSS 1 Why the Fascination
(Present and) Future Surveys for Metal-Poor Stars Timothy C. Beers Department of Physics & Astronomy Michigan State University & JINA: Joint Institute for Nuclear Astrophysics SDSS 1 Why the Fascination
AstroBITS: Open Cluster Project
 AstroBITS: Open Cluster Project I. Introduction The observational data that astronomers have gathered over many years indicate that all stars form in clusters. In a cloud of hydrogen gas, laced with helium
Deriving stellar masses from SDSS
 Deriving stellar masses from SDSS Reference: Bruzual and Charlot 2003MNRAS.344.1000B Kauffmann et al. 2003MNRAS.341.33 Salim et al. 2007ApJS..173..267S Bell et al. 2003ApJS..149..289B Outline! Basic idea!
arxiv:astro-ph/ v1 30 Aug 2001
 TRACING LUMINOUS AND DARK MATTER WITH THE SLOAN DIGITAL SKY SURVEY J. LOVEDAY 1, for the SDSS collaboration 1 Astronomy Centre, University of Sussex, Falmer, Brighton, BN1 9QJ, England arxiv:astro-ph/18488v1
Modern Image Processing Techniques in Astronomical Sky Surveys
 Modern Image Processing Techniques in Astronomical Sky Surveys Items of the PhD thesis József Varga Astronomy MSc Eötvös Loránd University, Faculty of Science PhD School of Physics, Programme of Particle
Open Cluster Research Project
 Open Cluster Research Project I. Introduction The observational data indicate that all stars form in clusters. In a cloud of hydrogen gas, laced with helium and a trace of other elements, something triggers
Exploring Data. Keck LRIS spectra. Handbook of CCD Astronomy by Steve Howell Chap. 4, parts of 6
 Exploring Data Keck LRIS spectra Handbook of CCD Astronomy by Steve Howell Chap. 4, parts of 6 FITS: Flexible Image Transport System Digital file format used to store astronomical images, data, and catalogs.
The Stellar to Baryonic Mass Function of Galaxies: from SDSS to GAMA with ASKAP
 The Stellar to Baryonic Mass Function of Galaxies: from SDSS to GAMA with ASKAP SDSS: Sloan Digital Sky Survey GAMA: Galaxy And Mass Assembly survey ASKAP: Australian Square Kilometer Array Pathfinder
The SDSS is Two Surveys
 The SDSS is Two Surveys The Fuzzy Blob Survey The Squiggly Line Survey The Site The telescope 2.5 m mirror Digital Cameras 1.3 MegaPixels $150 4.3 Megapixels $850 100 GigaPixels $10,000,000 CCDs CCDs:
Intro to SQL. Two components. Data Definition Language (DDL): create table, etc. Data Manipulation Language (DML):
: create table, etc. Data Manipulation Language (DML):") Intro to SQL Two components Data Definition Language (DDL): create table, etc. Data Manipulation Language (DML): select, insert, delete, update, etc. The basic SELECT statement: Select From Where A1, A2,...AN
Intro to SQL Two components Data Definition Language (DDL): create table, etc. Data Manipulation Language (DML): select, insert, delete, update, etc. The basic SELECT statement: Select From Where A1, A2,...AN
SDSS-IV MaStar: a Large, Comprehensive, and High Quality Empirical Stellar Library
 3rd International Workshop on Spectral Stellar Libraries ASI Conference Series, 2017, Vol. 14, pp 99 103 Editors: P. Coelho, L. Martins & E. Griffin SDSS-IV MaStar: a Large, Comprehensive, and High Quality
Active Galaxies & Quasars
 Active Galaxies & Quasars Normal Galaxy Active Galaxy Galactic Nuclei Bright Active Galaxy NGC 5548 Galaxy Nucleus: Exact center of a galaxy and its immediate surroundings. If a spiral galaxy, it is the
Life Cycle of Stars. Photometry of star clusters with SalsaJ. Authors: Daniel Duggan & Sarah Roberts
 Photometry of star clusters with SalsaJ Authors: Daniel Duggan & Sarah Roberts Photometry of star clusters with SalsaJ Introduction Photometry is the measurement of the intensity or brightness of an astronomical
Virtual Observatory Tools
 Virtual Observatory Tools The Astronomer Annual Meeting 2009 John Murrell Croydon Astronomical Society 1 Introduction What is the Virtual Observatory? Two VO Tools Blind Astrometry - where is your image
D4.2. First release of on-line science-oriented tutorials
 EuroVO-AIDA Euro-VO Astronomical Infrastructure for Data Access D4.2 First release of on-line science-oriented tutorials Final version Grant agreement no: 212104 Combination of Collaborative Projects &
Flagging Bad Data in Imaging
 Flagging Bad Data Flagging Bad Data in Imaging Observations are never perfect, due to observing conditions e.g., bad seeing, moonlight, the solar wind, clouds, airplanes, cosmic rays, telescope malfunctions
The Formation of Galaxies: connecting theory to data
 Venice, October 2003 The Formation of Galaxies: connecting theory to data Simon D.M. White Max Planck Institute for Astrophysics The Emergence of the Cosmic Initial Conditions > 105 independent ~ 5 measurements
9. Evolution with redshift - z > 1.5. Selection in the rest-frame UV
 11-5-10see http://www.strw.leidenuniv.nl/ franx/college/galaxies10 10-c09-1 11-5-10see http://www.strw.leidenuniv.nl/ franx/college/galaxies10 10-c09-2 9. Evolution with redshift - z > 1.5 Selection in
The Dark Energy Survey Public Data Release 1
 The Dark Energy Survey Public Data Release 1 Matias Carrasco Kind (NCSA/UIUC) and the DR1 Release Team https://des.ncsa.illinois.edu/ Near-Field Cosmology with DES DR1 and Beyond Workshop, June 27-29th,
Characterizing the Gigahertz radio sky
 THE US NATIONAL VIRTUAL OBSERVATORY Mining multi-wavelength data in large area surveys with VO tools Yogesh Wadadekar STScI This work is partly supported by a NVO Research Initiative award. Collaborator:
Data Release 5. Sky coverage of imaging data in the DR5
 Data Release 5 The Sloan Digital Sky Survey has released its fifth Data Release (DR5). The spatial coverage of DR5 is about 20% larger than that of DR4. The photometric data in DR5 are based on five band
A SPEctra Clustering Tool for the exploration of large spectroscopic surveys. Philipp Schalldach (HU Berlin & TLS Tautenburg, Germany)
") A SPEctra Clustering Tool for the exploration of large spectroscopic surveys Philipp Schalldach (HU Berlin & TLS Tautenburg, Germany) Working Group Helmut Meusinger (Tautenburg, Germany) Philipp Schalldach
A SPEctra Clustering Tool for the exploration of large spectroscopic surveys Philipp Schalldach (HU Berlin & TLS Tautenburg, Germany) Working Group Helmut Meusinger (Tautenburg, Germany) Philipp Schalldach
SkyMapper and the Southern Sky Survey
 SkyMapper and the Southern Sky Survey Stefan Keller Mt. Stromlo Observatory Brian Schmidt, Mike Bessell and Patrick Tisserand SkyMapper 1.35m telescope with a 5.7 sq. degree field of view located at Siding
Galaxy Metallicity: What Oxygen Tells Us About The Lifecycles of Galaxies Designed by Prof Jess Werk, modified by Marie Wingyee Lau
 Introduction Galaxy Metallicity: What Oxygen Tells Us About The Lifecycles of Galaxies Designed by Prof Jess Werk, modified by Marie Wingyee Lau Before stars and galaxies came into existence, the very
Stellar Populations: Resolved vs. unresolved
 Outline Stellar Populations: Resolved vs. unresolved Individual stars can be analyzed Applicable for Milky Way star clusters and the most nearby galaxies Integrated spectroscopy / photometry only The most
PDF hosted at the Radboud Repository of the Radboud University Nijmegen
 PDF hosted at the Radboud Repository of the Radboud University Nijmegen The following full text is a publisher's version. For additional information about this publication click this link. http://hdl.handle.net/2066/84153
EUCLID Spectroscopy. Andrea Cimatti. & the EUCLID-NIS Team. University of Bologna Department of Astronomy
 EUCLID Spectroscopy Andrea Cimatti University of Bologna Department of Astronomy & the EUCLID-NIS Team Observing the Dark Universe with EUCLID, ESA ESTEC, 17 November 2009 DARK Universe (73% Dark Energy
RLW paper titles:
 RLW paper titles: http://www.wordle.net Astronomical Surveys and Data Archives Richard L. White Space Telescope Science Institute HiPACC Summer School, July 2012 Overview Surveys & catalogs: Fundamental
CHEMICAL ABUNDANCE ANALYSIS OF RC CANDIDATE STAR HD (46 LMi) : PRELIMINARY RESULTS
 : PRELIMINARY RESULTS") Dig Sites of Stellar Archeology: Giant Stars in the Milky Way Ege Uni. J. of Faculty of Sci., Special Issue, 2014, 145-150 CHEMICAL ABUNDANCE ANALYSIS OF RC CANDIDATE STAR HD 94264 (46 LMi) : PRELIMINARY
Dig Sites of Stellar Archeology: Giant Stars in the Milky Way Ege Uni. J. of Faculty of Sci., Special Issue, 2014, 145-150 CHEMICAL ABUNDANCE ANALYSIS OF RC CANDIDATE STAR HD 94264 (46 LMi) : PRELIMINARY
Quantifying correlations between galaxy emission lines and stellar continua
 Quantifying correlations between galaxy emission lines and stellar continua R. Beck, L. Dobos, C.W. Yip, A.S. Szalay and I. Csabai 2016 astro-ph: 1601.0241 1 Introduction / Technique Data Emission line
From quasars to dark energy Adventures with the clustering of luminous red galaxies
 From quasars to dark energy Adventures with the clustering of luminous red galaxies Nikhil Padmanabhan 1 1 Lawrence Berkeley Labs 04-15-2008 / OSU CCAPP seminar N. Padmanabhan (LBL) Cosmology with LRGs
Lecture 11: SDSS Sources at Other Wavelengths: From X rays to radio. Astr 598: Astronomy with SDSS
 Astr 598: Astronomy with SDSS Spring Quarter 4, University of Washington, Željko Ivezić Lecture : SDSS Sources at Other Wavelengths: From X rays to radio Large Surveys at Many Wavelengths SDSS: UV-IR five-band
Astr 511: Galactic Astronomy. Winter Quarter 2015, University of Washington, Željko Ivezić. Lecture 1:
 Astr 511: Galactic Astronomy Winter Quarter 2015, University of Washington, Željko Ivezić Lecture 1: Review of Stellar Astrophysics (and other useful stuff) 1 Understanding Galaxy Properties and the Milky
Exploiting Virtual Observatory and Information Technology: Techniques for Astronomy
 Exploiting Virtual Observatory and Information Technology: Techniques for Astronomy Lecture #6 Goal: VO Workflows Science Usage Nicholas Walton AstroGrid Project Scientist Institute of Astronomy, The University
Chapter 6: Transforming your data
 Why is transformation necessary? Chapter 6: Transforming your data The AAVSO International Database is composed of data collected from many different observers, at different times, from around the globe.
Data Reduction - Optical / NIR Imaging. Chian-Chou Chen Ph319
 Data Reduction - Optical / NIR Imaging Chian-Chou Chen (T.C.) @ Ph319 Images at different wavelengths... Images at different wavelengths... However, the raw data are always not as pretty Why? The total
The Gaia Mission. Coryn Bailer-Jones Max Planck Institute for Astronomy Heidelberg, Germany. ISYA 2016, Tehran
 The Gaia Mission Coryn Bailer-Jones Max Planck Institute for Astronomy Heidelberg, Germany ISYA 2016, Tehran What Gaia should ultimately achieve high accuracy positions, parallaxes, proper motions e.g.
Star Formation Indicators
 Star Formation Indicators Calzetti 2007 astro-ph/0707.0467 Brinchmann et al. 2004 MNRAS 351, 1151 SFR indicators in general! SFR indicators are defined from the X ray to the radio! All probe the MASSIVE
Mapping the oxygen abundance in an elliptical galaxy (NGC 5128)
") Mapping the oxygen abundance in an elliptical galaxy (NGC 5128) Jeremy R. Walsh, ESO Collaborators: George H. Jacoby, GMT Observatory, Carnegie; Reynier Peletier, Kapteyn Lab., Groningen; Nicholas A. Walton,
Mapping the oxygen abundance in an elliptical galaxy (NGC 5128) Jeremy R. Walsh, ESO Collaborators: George H. Jacoby, GMT Observatory, Carnegie; Reynier Peletier, Kapteyn Lab., Groningen; Nicholas A. Walton,
LePhare Download Install Syntax Examples Acknowledgement Le Phare
 LePhare Download Install Syntax Examples Acknowledgement http://www.lam.fr/lephare.html Le Phare A Photometric software to measure redshifts & galaxy properties Arnouts S. & Ilbert O. Basic concept SED
ABSTRACT. Title: The Accuracy of the Photometric Redshift of Galaxy Clusters
 ABSTRACT Name: Elizabeth A. Holden Department: Physics Title: The Accuracy of the Photometric Redshift of Galaxy Clusters Major: Physics Degree: Master of Science Approved by: Date: Thesis Director NORTHERN
Galaxies 626. Lecture 9 Metals (2) and the history of star formation from optical/uv observations
 and the history of star formation from optical/uv observations") Galaxies 626 Lecture 9 Metals (2) and the history of star formation from optical/uv observations Measuring metals at high redshift Metals at 6 How can we measure the ultra high z star formation? One robust
Galaxies 626 Lecture 9 Metals (2) and the history of star formation from optical/uv observations Measuring metals at high redshift Metals at 6 How can we measure the ultra high z star formation? One robust
Data Management Plan Extended Baryon Oscillation Spectroscopic Survey
 Data Management Plan Extended Baryon Oscillation Spectroscopic Survey Experiment description: eboss is the cosmological component of the fourth generation of the Sloan Digital Sky Survey (SDSS-IV) located
How Do I Create a Hubble Diagram to show the expanding universe?
 How Do I Create a Hubble Diagram to show the expanding universe? An extremely important topic in astronomy is the expansion of the universe. Although the expanding universe is nearly always discussed in
Techniques for measuring astronomical distances generally come in two variates, absolute and relative.
 Chapter 6 Distances 6.1 Preliminaries Techniques for measuring astronomical distances generally come in two variates, absolute and relative. Absolute distance measurements involve objects possibly unique
Present and Future Large Optical Transient Surveys. Supernovae Rates and Expectations
 Present and Future Large Optical Transient Surveys Supernovae Rates and Expectations Phil Marshall, Lars Bildsten, Mansi Kasliwal Transients Seminar Weds 12th December 2007 Many surveys designed to find
The statistical applications on the galaxies and AGNs in SDSS
 The statistical applications on the galaxies and AGNs in SDSS Shiyin Shen 沈世银 2015/05/27 NAOC Colluquim Shanghai Astronomical Observatory Collaborators: Zhengyi Shao, Xiaohu Yang, Xiaoyi Xie, Houjun Mo
Surveys at z 1. Petchara Pattarakijwanich 20 February 2013
 Surveys at z 1 Petchara Pattarakijwanich 20 February 2013 Outline Context & Motivation. Basics of Galaxy Survey. SDSS COMBO-17 DEEP2 COSMOS Scientific Results and Implications. Properties of z 1 galaxies.
Astronomical image reduction using the Tractor
 the Tractor DECaLS Fin Astronomical image reduction using the Tractor Dustin Lang McWilliams Postdoc Fellow Carnegie Mellon University visiting University of Waterloo UW / 2015-03-31 1 Astronomical image
VISTA HEMISPHERE SURVEY DATA RELEASE 1
 Release date (will be set by ESO) VISTA HEMISPHERE SURVEY DATA RELEASE 1 PROPOSAL ESO No.: 179.A-2010 PRINCIPAL INVESTIGATOR: Richard McMahon Authors: R. McMahon, M. Banerji, N. Lodieu for the VHS Collaboration
The Milky Way Galaxy (ch. 23)
") The Milky Way Galaxy (ch. 23) [Exceptions: We won t discuss sec. 23.7 (Galactic Center) much in class, but read it there will probably be a question or a few on it. In following lecture outline, numbers
The Milky Way Galaxy (ch. 23) [Exceptions: We won t discuss sec. 23.7 (Galactic Center) much in class, but read it there will probably be a question or a few on it. In following lecture outline, numbers
Mario Juric Institute for Advanced Study, Princeton
 Mapping Galactic density, metallicity and kinematics. Mario Juric Institute for Advanced Study, Princeton with Zeljko Ivezic, Nick Bond, Branimir Sesar, Robert Lupton and the SDSS Collaboration Dissecting
Automated Classification of HETDEX Spectra. Ted von Hippel (U Texas, Siena, ERAU)
") Automated Classification of HETDEX Spectra Ted von Hippel (U Texas, Siena, ERAU) Penn State HETDEX Meeting May 19-20, 2011 Outline HETDEX with stable instrumentation and lots of data ideally suited to
Automated Classification of HETDEX Spectra Ted von Hippel (U Texas, Siena, ERAU) Penn State HETDEX Meeting May 19-20, 2011 Outline HETDEX with stable instrumentation and lots of data ideally suited to
Calibration of ACS Prism Slitless Spectroscopy Modes
 The 2005 HST Calibration Workshop Space Telescope Science Institute, 2005 A. M. Koekemoer, P. Goudfrooij, and L. L. Dressel, eds. Calibration of ACS Prism Slitless Spectroscopy Modes S. S. Larsen, M. Kümmel
FIA0221: Taller de Astronomía II. Lecture 14 Spectral Classification of Stars
 FIA0221: Taller de Astronomía II Lecture 14 Spectral Classification of Stars Spectral types along the stellar CMD. Oh, Be A Fine Girl Kiss Me! Classification of Stellar spectra: The MK system: strong He+
Performance of the NICMOS ETC Against Archived Data
 Performance of the NICMOS ETC Against Archived Data M. Sosey June 19, 2001 ABSTRACT A robust test of the newest version of the NICMOS Exposure Time Calculator (ETC) was conducted in order to assess its
Determination of [α/fe] and its Application to SEGUE F/G Stars. Young Sun Lee
![Determination of [α/fe] and its Application to SEGUE F/G Stars. Young Sun Lee](/thumbs/83/87302303.jpg "Determination of [α/fe] and its Application to SEGUE F/G Stars. Young Sun Lee") Determination of [α/fe] and its Application to SEGUE F/G Stars Young Sun Lee Research Group Meeting on June 16, 2010 Outline Introduction Why [α/fe]? Determination of [α/fe] Validation of estimate of [α/fe]
Determination of [α/fe] and its Application to SEGUE F/G Stars Young Sun Lee Research Group Meeting on June 16, 2010 Outline Introduction Why [α/fe]? Determination of [α/fe] Validation of estimate of [α/fe]
NEW YORK UNIVERSITY VALUE-ADDED GALAXY CATALOG: A GALAXY CATALOG BASED ON NEW PUBLIC SURVEYS 1
 The Astronomical Journal, 129:2562 2578, 2005 June # 2005. The American Astronomical Society. All rights reserved. Printed in U.S.A. NEW YORK UNIVERSITY VALUE-ADDED GALAXY CATALOG: A GALAXY CATALOG BASED
Photometry of Messier 34
 Photometry of Messier 34 J. Kielkopf November 12, 2012 1 Messier 34 The open cluster Messier 34 (M34) is in the solar neighborhood, lying roughly in the plane of the Milky Way galaxy in the direction of
GOODS/FORS2 Final Data Release: Version 3.0
 ESO Phase 3 Data Release Description Data Collection GOODS_FORS2 Release Number 1 Data Provider C. Cesarsky Date 30.10.2007 update 11.07.2014 GOODS/FORS2 Final Data Release: Version 3.0 As part of the
High Redshift Universe
 High Redshift Universe Finding high z galaxies Lyman break galaxies (LBGs) Photometric redshifts Deep fields Starburst galaxies Extremely red objects (EROs) Sub-mm galaxies Lyman α systems Finding high
Radial Velocity Surveys. Matthias Steinmetz (AIP)
") Radial Velocity Surveys Matthias Steinmetz (AIP) The Galactic case for RV surveys Information on how galaxies form is locked in n the phase-space (position,velocities) Information is locked in stars (abundances)
Radial Velocity Surveys Matthias Steinmetz (AIP) The Galactic case for RV surveys Information on how galaxies form is locked in n the phase-space (position,velocities) Information is locked in stars (abundances)
SkyMapper and the Southern Sky Survey
 and the Southern Sky Survey, Brian Schmidt and Mike Bessell Slide 1 What is? 1.35m telescope with a 5.7 sq. degree field of view To reside at Siding Spring Observatory, NSW To conduct the Southern Sky
NICMOS Status and Plans
 1997 HST Calibration Workshop Space Telescope Science Institute, 1997 S. Casertano, et al., eds. NICMOS Status and Plans Rodger I. Thompson Steward Observatory, University of Arizona, Tucson, AZ 85721
The star-formation history of mass-selected galaxies in the VIDEO survey
 The star-formation history of mass-selected galaxies in the VIDEO survey Jonathan Zwart jz@uwcastro.org 18 September, 2013 OVERVIEW Measuring Star-Formation Rates (SFRs) The VISTA Deep Extragalactic Observations
Galaxy Growth and Classification
 Observational Astronomy Lab: I-1FS Objectives: First Name: Last Name: Galaxy Growth and Classification To understand the concept of color in astronomy. To be able to classify galaxies based on their morphology
The Cornell Atlas of Spitzer Spectra (CASSIS) and recent advances in the extraction of complex sources
 and recent advances in the extraction of complex sources") The Cornell Atlas of Spitzer Spectra (CASSIS) and recent advances in the extraction of complex sources V. Lebouteiller (CEA & Cornell University) D.J. Barry, G.C. Sloan, H.W.W. Spoon, D.W. Weedman, J.R.
The Cornell Atlas of Spitzer Spectra (CASSIS) and recent advances in the extraction of complex sources V. Lebouteiller (CEA & Cornell University) D.J. Barry, G.C. Sloan, H.W.W. Spoon, D.W. Weedman, J.R.
First results from the Stockholm VIMOS Supernova Survey
 First results from the Stockholm VIMOS Supernova Survey - Detection efficiencies and photometric accuracy in supernova surveys Outline The Stockholm VIMOS Supernova Survey, SVISS. First results from the
Lecture 15: Galaxy morphology and environment
 GALAXIES 626 Lecture 15: Galaxy morphology and environment Why classify galaxies? The Hubble system gives us our basic description of galaxies. The sequence of galaxy types may reflect an underlying physical
Outline. c.f. Zhao et al. 2006, ChJA&A, 6, 265. Stellar Abundance and Galactic Chemical Evolution through LAMOST Spectroscopic Survey
 KIAA-CambridgeJoint Workshop on Near-Field Cosmology and Galactic Archeology ZHAO Gang National Astronomical Observatories, Chinese Academy of Sciences Dec 1-5, 2008 Beijing Outline LAMOST stellar spectroscopic
Active Galactic Nuclei OIII
 Active Galactic Nuclei In 1908, Edward Fath (1880-1959) observed NGC 1068 with his spectroscope, which displayed odd (and very strong) emission lines. In 1926 Hubble recorded emission lines of this and
AUTOMATIC MORPHOLOGICAL CLASSIFICATION OF GALAXIES. 1. Introduction
 AUTOMATIC MORPHOLOGICAL CLASSIFICATION OF GALAXIES ZSOLT FREI Institute of Physics, Eötvös University, Budapest, Pázmány P. s. 1/A, H-1117, Hungary; E-mail: frei@alcyone.elte.hu Abstract. Sky-survey projects
Rest-frame Optical Spectra: A Window into Galaxy Formation at z~2
 Rest-frame Optical Spectra: A Window into Galaxy Formation at z~2 Alice Shapley (UCLA) Collaborators: Mariska Kriek, Naveen Reddy, Brian Siana, Alison Coil, Bahram Mobasher, Bill Freeman, Ryan Sanders,
COLOR SEPARATION OF GALAXY TYPES IN THE SLOAN DIGITAL SKY SURVEY IMAGING DATA
 COLOR SEPARATION OF GALAXY TYPES IN THE SLOAN DIGITAL SKY SURVEY IMAGING DATA Strateva et al. 2001, AJ, 122, 1861 Presenter: Ken Mawatari Date: 2011 October 31 2011/10/31 1 Outline Abstruct : roughly Introduction
Science in the Virtual Observatory
 Mem. S.A.It. Vol. 80, 352 c SAIt 2009 Memorie della Science in the Virtual Observatory M.G. Allen Observatoire de Strasbourg UMR 7550 11 Rue de l Universite, F-67000 Strasbourg, France e-mail: allen@astro.u-strasbg.fr
arxiv: v2 [astro-ph.im] 13 Sep 2011
![arxiv: v2 [astro-ph.im] 13 Sep 2011](/thumbs/85/92416885.jpg "arxiv: v2 [astro-ph.im] 13 Sep 2011") Draft version September 4, 2018 Preprint typeset using L A TEX style emulateapj v. 11/10/09 PRECISION SPECTROPHOTOMETRY AT THE LEVEL OF 0.1% Renbin Yan Center for Cosmology and Particle Physics, Department
Draft version September 4, 2018 Preprint typeset using L A TEX style emulateapj v. 11/10/09 PRECISION SPECTROPHOTOMETRY AT THE LEVEL OF 0.1% Renbin Yan Center for Cosmology and Particle Physics, Department
A Random Walk Through Astrometry
 A Random Walk Through Astrometry Astrometry: The Second Oldest Profession George H. Kaplan Astronomical Applications Department Astrometry Department U.S. Naval Observatory Random Topics to be Covered
Precision cosmology with Type Ia Supernovae?
 Precision cosmology with Type Ia Supernovae? Reynald Pain LPNHE, CNRS/IN2P3 & Universités Paris 6 and Paris 7 Outline I will used the SNLS 1st year data and analysis to try answer the following questions
Gaia Photometric Data Analysis Overview
 Gaia Photometric Data Analysis Overview Gaia photometric system Paola Marrese Sterrewacht Leiden marrese@strw.leidenuniv.nl Role of photometry in overall Gaia data analysis Photometric data analysis goals
The J-PAS Survey. Silvia Bonoli
 The J-PAS Survey The Javalambre-PAU Astrophysical Survey A Spanish-Brazilian collaboration, the J-PAS survey will scan ~8500 deg2 of the northern sky with 54 narrow-band filters covering the whole optical
Spectroscopy in Astronomy
 Spectroscopy in Astronomy History 1814 German optician Joseph von Fraunhofer sun with 600+ spectral lines; now we know more than 3000 lines 1860 German chemists Gustav Kirchhoff and Robert W. Bunsen Chemical
Weak lensing measurements of Dark Matter Halos around galaxies
 Weak lensing measurements of Dark Matter Halos around galaxies Rachel Mandelbaum Carnegie Mellon University 1 Image credits: NASA, ESA, S. Beckwith (STScI), the HUDF Team 2 Image credit: ESA/Planck 3 The
There are three main ways to derive q 0 :
 Measuring q 0 Measuring the deceleration parameter, q 0, is much more difficult than measuring H 0. In order to measure the Hubble Constant, one needs to derive distances to objects at 100 Mpc; this corresponds
Supplementary Information for SNLS-03D3bb a super- Chandrasekhar mass Type Ia supernova
 1 Supplementary Information for SNLS-03D3bb a super- Chandrasekhar mass Type Ia supernova SN Location SNLS-03D3bb is located at RA: 14:16:18.920 Dec: +52:14:53.66 (J2000) in the D3 (extended Groth Strip)
Galaxy formation and evolution I. (Some) observational facts
 observational facts") Galaxy formation and evolution I. (Some) observational facts Gabriella De Lucia Astronomical Observatory of Trieste Outline: ü Observational properties of galaxies ü Galaxies and Cosmology ü Gas accretion
Galaxy formation and evolution I. (Some) observational facts Gabriella De Lucia Astronomical Observatory of Trieste Outline: ü Observational properties of galaxies ü Galaxies and Cosmology ü Gas accretion
On the calibration of WFCAM data from 2MASS
 On the calibration of WFCAM data from 2MASS Authors: Simon Hodgkin, Mike Irwin Draft: September 28 th 2006 Modifications: ID: VDF-TRE-IOA-00011-0000* 1 Introduction The requirement on VDFS is to photometrically