The Bright SHARC Survey: The Cluster Catalog
|
|
|
- Brent Carter
- 5 years ago
- Views:
Transcription
 The Bright SHARC Survey: The Cluster Catalog. Astrophysical Journal Supplement Series, 126 (2). pp. 209-269.")
1 The Bright SHARC Survey: The Cluster Catalog Article (Published Version) Romer, A K, Nichol, R C, Holden, B P, Ulmer, M P, Pildis, R A, Merrelli, A J, Adami, C, Burke, D J, Collins, C A, Metevier, A J, Kron, R G and Commons, K (2000) The Bright SHARC Survey: The Cluster Catalog. Astrophysical Journal Supplement Series, 126 (2). pp ISSN This version is available from Sussex Research Online: This document is made available in accordance with publisher policies and may differ from the published version or from the version of record. If you wish to cite this item you are advised to consult the publisher s version. Please see the URL above for details on accessing the published version. Copyright and reuse: Sussex Research Online is a digital repository of the research output of the University. Copyright and all moral rights to the version of the paper presented here belong to the individual author(s) and/or other copyright owners. To the extent reasonable and practicable, the material made available in SRO has been checked for eligibility before being made available. Copies of full text items generally can be reproduced, displayed or performed and given to third parties in any format or medium for personal research or study, educational, or not-for-profit purposes without prior permission or charge, provided that the authors, title and full bibliographic details are credited, a hyperlink and/or URL is given for the original metadata page and the content is not changed in any way.
2 THE ASTROPHYSICAL JOURNAL SUPPLEMENT SERIES, 126:209È269, 2000 February ( The American Astronomical Society. All rights reserved. Printed in U.S.A. THE BRIGHT SHARC SURVEY: THE CLUSTER CATALOG1 A. K. ROMER2 AND R. C. NICHOL3,4 Department of Physics, Carnegie Mellon University, 5000 Forbes Avenue, Pittsburgh, PA 15213; romer=cmu.edu, nichol=cmu.edu B. P. HOLDEN2,3 Department of Astronomy and Astrophysics, University of Chicago, 5640 South Ellis Avenue, Chicago, IL 60637; holden=oddjob.uchicago.edu M. P. ULMER AND R. A. PILDIS Department of Physics and Astronomy, Northwestern University, 2131 North Sheridan Road, Evanston, IL 60207; ulmer=ossenu.astro.nwu.edu A. J. MERRELLI2 Department of Physics, Carnegie Mellon University, Forbes Avenue, Pittsburgh, PA 15213; merrelli=andrew.cmu.edu C. ADAMI4 Department of Physics and Astronomy, Northwestern University, 2131 North Sheridan Road, Evanston, IL 60207; adami=lilith.astro.nwu.edu; and Laboratoire d Astronomie Spatiale, Traverse du Siphon, Marseille, France D. J. BURKE3 AND C. A. COLLINS3 Astrophysics Research Institute, Liverpool John Moores University, Twelve Quays House, Egerton Wharf, Birkenhead, L41 1LD, UK; djb=astro.livjm.ac.uk, cac=astro.livjm.ac.uk A. J. METEVIER UCO/Lick Observatory, University of California, Santa Cruz, CA 95064; anne=ucolick.org R. G. KRON Department of Astronomy and Astrophysics, University of Chicago, 5640 South Ellis Avenue, Chicago, IL 60637; rich=oddjob.uchicago.edu AND K. COMMONS2 Department of Physics and Astronomy, Northwestern University, 2131 North Sheridan Road, Evanston, IL 60207; commons=lilith.astro.nwu.edu Received 1999 April 12; accepted 1999 August 23 ABSTRACT We present the Bright SHARC (Serendipitous High-Redshift Archival ROSAT Cluster) Survey, which is an objective search for serendipitously detected extended X-ray sources in 460 deep ROSAT PSPC pointings. The Bright SHARC Survey covers an area of deg2 and has yielded 374 extended sources. We discuss the X-ray data reduction, the candidate selection and present results from our ongoing optical follow-up campaign. The optical follow-up concentrates on the brightest 94 of the 374 extended sources and is now 97% complete. We have identiðed 37 clusters of galaxies, for which we present redshifts and luminosities. The clusters span a redshift range of \ z \ 0.83 and a luminosity range of \ L \ 8.3 ] 1044 ergs s~1 [0.5È2.0 kev] (assuming H \ 50 km s~1 Mpc~1 and X 0 q \ 0.5). Twelve of the clusters have redshifts greater than z \ 0.3, eight of which are at luminosities 0 brighter than L \ 3 ] 1044 ergs s~1. Seventeen of the 37 optically conðrmed Bright SHARC clusters have not been listed X in any previously published catalog. We also report the discovery of three candidate fossil groups ÏÏ of the kind proposed by Ponman et al. Subject headings: catalogs È galaxies: clusters: general È galaxies: distances and redshifts È surveys È X-rays: galaxies 1. INTRODUCTION Clusters of galaxies play a key role in constraining cosmological models. It has been shown (e.g., Oukbir & Blanchard 1992; Carlberg et al. 1997; Henry 1997; Sadat, Blanchard, & Oukbir 1998; Viana & Liddle 1999) that measurements of the cluster number density, and its evolution, play an important role in the derivation of the mean mass density of the universe, ). At present, there is a large dis- m 1 Based on data taken at the European Southern Observatory, Kitt Peak National Observatory, Cerro Tololo Inter-American Observatory, Canada-France-Hawaii, and Apache Point Observatory. 2 Visiting Astronomer, Kitt Peak National Observatory. KPNO is operated by AURA, Inc., under contract to the National Science Foundation. 3 Visiting Astronomer, European Southern Observatory. 4 Visiting Astronomer, Canada-France-Hawaii Telescope. 209 persion in the values of ) derived from measurements of m the cluster number density; e.g., ) \ 0.2 `0.3 (Bahcall & m ~0.1 Fan 1998), ) \ 0.4 `0.3 (Borgani et al. 1999), ) \ m ~0.2 m 0.5B0.14 (Henry 1997), ) \ 0.85B0.2 (Sadat et al. 1998), m ) \ 0.96 `0.36 (Reichart et al. 1999). m ~0.32 To fully exploit clusters as cosmological tools one needs to have access to large, objectively selected, cluster catalogs that cover a wide redshift range. Most cluster catalogs constructed prior to 1990 had a very limited redshift range and were not constructed in an objective manner (e.g., Abell 1958; Abell, Corwin, & Olowin 1989). However, recent developments, such as CCD mosaic cameras, optical plate digitizers, and imaging X-ray satellites, have resulted in a growing number of high-quality cluster catalogs. These include optically selected cluster samples derived from digitized plate material, e.g., the EDCC (Lumsden et al. 1992) and the APM (Dalton et al. 1994), or from CCD imaging
3 210 ROMER ET AL. Vol. 126 surveys, e.g., the PDCS (Postman et al. 1996) and the ESO Imaging Survey (Lobo et al. 1998). X-ray selected cluster samples derived from imaging X-ray satellite data include those from the Einstein mission, e.g., the EMSS cluster sample (Gioia et al. 1990), and those from the ROSAT (Tru mper 1993) mission. The various ROSAT cluster catalogs divide into two categories; those based on ROSAT All-Sky Survey (RASS) data and those based on ROSAT pointing data. The former category includes the SRCS (Romer 1995), XBACS (Ebeling et al. 1996), BCS (Ebeling et al. 1998), REFLEX (Bo hringer et al. 1998; De Grandi et al. al 1999a) and NEP (Gioia et al. 1999; Henry et al. 1997) surveys. Examples of surveys based on ROSAT pointing data are the SHARC (Collins et al. 1997); RIXOS (Castander et al. 1995); RDCS (Rosati et al. 1998); WARPS (Jones et al. 1998) and 160 deg2 (Vikhlinin et al. 1998a) surveys. The ROSAT instrument of choice for cluster surveys has been the PSPC, which combines imaging capabilities with a large Ðeld of view (2 in diameter), low background contamination and some spectral resolution. The angular resolution of the ROSAT PSPC is better than that of Einstein, allowing one to take advantage of the extended nature of cluster emission to distinguish clusters from X-ray point sources, e.g., active galactic nuclei (AGNs) and quasars. Moreover, the enhanced sensitivity of ROSAT over Einstein means that ROSAT cluster surveys can reach fainter Ñux limits than the EMSS. The RASS surveys have yielded several important insights into the clustering properties (Romer et al. 1994) and evolution (Ebeling et al. 1997; De Grandi et al. 1999b) of the z \ 0.3 cluster population. At higher redshifts, the ROSAT pointing data surveys have shown that there is no evidence for evolution in the cluster population at luminosities fainter than L \ 5 ] 1044 ergs s~1 [0.5È2.0 kev] X and redshifts less than z ^ 0.7 (Nichol et al. 1997; Burke et al. 1997; Collins et al. 1997; Vikhlinin et al. 1998b; Rosati et al. 1998; Jones et al. 1998; Nichol et al. 1999). At brighter luminosities, the 160 deg2 and Bright SHARC surveys, have provided evidence for negative evolution (Nichol et al. 1999; Vikhlinin et al. 1998b) similar to that seen in the EMSS cluster sample (Henry et al. 1992; Reichart et al. 1999). The SHARC (Serendipitous High-Redshift Archival ROSAT Cluster) survey was designed to optimize studies of X-ray cluster evolution and combines two complementary surveys; a narrow area deep survey and a wide area shallow survey. The former, known as the Southern SHARC, has been described elsewhere (Collins et al. 1997; Burke et al. 1997). We introduce the latter survey, the Bright SHARC, here. Unlike the Southern SHARC, the philosophy of the Bright SHARC has been to achieve maximum areal coverage rather than maximum sensitivity. The Bright SHARC survey covers a total area of deg2 and has yielded a catalog of 37 clusters with Ñuxes º1.63 ] 10~13 ergs s~1 cm~2. In contrast, the Southern SHARC survey covers only 17.7 deg2 but has yielded a similar number of clusters (36) with Ñuxes º4.66 ] 10~14 ergs s~1 cm~2. We describe below the reduction of the 460 ROSAT PSPC pointings in the Bright SHARC survey ( 2), our source detection methodology ( 3) and the selection and optical follow-up of cluster candidates ( 4 and 5). In 6 and 7 we present and discuss the Bright SHARC cluster catalog. Throughout this paper we use H \ 50 km s~1 0 Mpc~1 and q \ 0.5 and deðne f and L to be the 0 ~13 44 unabsorbed Ñux (observer frame) and luminosity (rest frame) in the [0.5È2.0 kev] energy band in units of 10~13 ergs s~1 cm~2 and 1044 ergs s~1, respectively. 2. TRANSFER AND REDUCTION OF ROSAT PSPC POINTING DATA The pointed PSPC data used in the construction of the Bright SHARC was obtained from the HEASARC ROSAT data archive using an automated FTP process over a period of two years starting in 1995 June. The criteria used to select data from the archive were (i) a listed exposure time greater than 10 ks and (ii) an absolute Galactic latitude greater than 20. Based on these criteria, 638 PSPC pointings were transferred to local machines and then reduced using a pipeline processing based on the Extended Source Analysis Software (ESAS) package (Snowden et al. 1994). An overview of our pipeline is as follows. First, the raw data were sorted into good and bad time intervals. Bad intervals were deðned as those in which the background level was higher than 170 counts s~1. Data obtained during bad intervals were discarded. The remaining data were binned, as a function of position, into seven di erent energy bandsèwhich Snowden et al. (1994) deðne as R1 through R7Èto produce seven 512 ] 512 pixel maps with a pixel scale of 14A.947. The Ðve highest energy bands, R3 through R7, were then co-added to produce a hard band [0.4È2.0 kev] count rate map for each pointing. Accompanying each count rate map was a count rate uncertainty map and a vignetting corrected exposure map. For each of the 638 pointings reduced by the ESAS pipeline, the ROSAT pointing name (col. [1]), the J2000 position (cols. [2] and [3]), Galactic latitude in degrees (b, col. [4]), the exposure time in seconds (col. [5]) and pointing target (col. [6]) are listed in Tables 4 and 5 (see Appendix A and Appendix B). Table 4 lists the 460 pointings selected to form the Bright SHARC survey. Two points should be noted about these 460 pointings. First, 371 of the pointings, those with three character extensions e.g., n00,ïï a01 ÏÏ etc., were processed after an important change was made to the Standard Analysis Software System (SASS). This change e ected those pointings for which the total exposure time was broken up into more than one observation interval. After the change, each observation interval was analyzed separately, whereas before the change they were analyzed together. Of these 371 pointings, only 45 have more than one observing interval. For simplicity we decided to include only the longest observing interval in our analysis. Second, the Bright SHARC survey does not include the central 2@.5 radius region of PSPC (see 4). This means that we were able to include several pointings in the survey which had intrinsically extended central targets, e.g., galaxies and clustersèas long as those targets did not extend beyond 2@.5. We discuss cases where Bright SHARC clusters are detected in pointings with cluster targets in Table 2 (see 6) and 7.2. The 178 pointings listed in Table 5 (Appendix B) were not included in the Bright SHARC because either an extended X-ray (or optical) source covers most of the Ðeld of view, or the pointing is within less than 6 of the Magellanic clouds. Extended X-ray and optical objects include low-redshift Abell clusters and Galactic globular clusters. The pointings listed in Table 5 were removed after visual inspections of the reduced X-ray data and the Digitized Sky Survey. Despite its subjective nature, this procedure does not undermine the serendipitous nature of the SHARC survey, since it was
4 No. 2, 2000 BRIGHT SHARC SURVEY: CLUSTER CATALOG 211 performed before the cluster candidate list was constructed. We have indicated in column [7] of Table 5 why each pointing was rejected from the survey. 3. SOURCE DETECTION Our source detection algorithm was based on wavelet transforms (Slezak, Bijaoui, & Oukbir 1990). For our purposes, we required a detection algorithm that (i) was sensitive to both extended and pointlike sources, (ii) worked in crowded Ðelds, and (iii) took into account a varying background level. Moreover, we wanted our method to be as simple as possible, so that we could deðne our selection function a posteriori using simulations. With these concerns in mind, we chose to convolve the PSPC count rate maps with a spherically symmetric, Mexican-hat ÏÏ wavelet. This wavelet, in one dimension, is given by A w(x) \ 1 [ a2b x2 e~x 2@2a2, (1) and is the second derivative of a Gaussian (Slezak et al. 1990) of width p \ a. The radially averaged point spread function of the ROSAT PSPC can be approximated to a Gaussian (Hasinger et al. 1992), so this wavelet is well suited to the detection of sources in PSPC images. An additional attraction of this wavelet is that it can be used to determine the extent of a source, since it has a width of 2 ] a at its zero-crossing points. A wavelet transform of a PSPC count rate map will, therefore, produce a wavelet coefficient map in which all the sources are bounded by a ring of zero values. The diameter of these zero-crossing rings provides a direct measure of the sourceïs extent in wavelet space. Ideally, a should be scaled logarithmically to provide statistically independent wavelet images over the whole range of real and k-space. For any given source, the wavelet coefficient will have a maximum when the value of a matches the sigma of the best-ðt Gaussian. However, the use of multiple wavelets would make a posteriori simulations of the selection function very complex and CPU intensive. We therefore decided to use only one wavelet convolution (a \ 3 pixels or 45A) in our source detection pipeline. This particular wavelet was found, empirically, to be the best compromise between smaller wavelets, which tended to fragment extended sources, and larger wavelets, which tended to blend neighboring sources. The penalty for this simpliðcation was the inclusion of some blended sources in our extended candidate list ( 5) and underestimated cluster count rates ( 6.1). Sources were identiðed in the wavelet coefficient map by selecting pixels with coefficients above a given threshold. This threshold was set, empirically, to be 7 p above the peak of the coefficient distribution. The thresholding technique only highlights the cores of each source, since that is where the wavelet coefficients are highest, so a friends-of-friends ÏÏ analysis was run to identify other associated pixels. This was done by growing the sources outward in the wavelet coefficient map until they reached the zero-crossing ring. Once the source boundaries were deðned, best-ðt centroids and ellipses were computed. A Ðlling factor was also derived for each source. This was deðned as ratio of the area within the Ðtted ellipse to the area within the zero-crossing boundary. For f \ 1, the ellipse Ðts the source shape exactly, while f? 1 indicates the presence of blended sources (dumbbell shapes) or percolation runaways (Ðlamentary shapes). In total, 10,277 sources were detected in the 460 pointings. To keep track of all of these sources, and their boundaries, a mask Ðle was generated for each pointing so that pixels associated with sources could be distinguished from those that were not. For each source, a 51 ] 51 pixel box, with the source at its center, was extracted from the count rate map. An average background for the box was calculated using all pixels not Ñagged as belonging to sources. The count rate for the central source was then derived by subtracting this background (appropriately scaled) from the sum of the pixels enclosed by the source boundary. We used this method because it was easy to apply to the thousands of sources detected in the Bright SHARC Survey. (We will refer to the count rates derived in this manner as wavelet count rates,ïï or cr.) However, the method has the dis- W advantage of underestimating the true count rate if the source is extended beyond the wavelet boundary (in 6.1 we describe an alternative method used to derive count rates for known clusters). An approximate signal-to-noise value for each source was also calculated using the count rate uncertainty maps produced by ESAS. It should be noted that certain pixels, those which received less than half the exposure time of the central pixel in the count rate maps, were not included in the friends-offriends ÏÏ analysis. Such pixels included those in the shadow of the PSPC window support structure and those at the edge of the Ðeld of view. These regions, which are noisier than those that were well exposed, were not used to deðne source centers, shapes, or wavelet count rates. 4. SELECTION OF CLUSTER CANDIDATES The majority of X-ray sources can be considered pointlike in their spatial properties, e.g., stars and AGNs. In the minority are objects with complex and extended X-ray pro- Ðles, such as supernova remnants, galaxies, and clusters of galaxies. Of these, only clusters are large enough and bright enough to be detected as extended beyond z ^ 0.1. Therefore, the strategy adopted by the SHARC has been to search for clusters only among those ROSAT sources that have a signiðcant extent. This reduces the required optical followup signiðcantly. The disadvantage of this approach, however, is that some clusters, e.g., those with compact surface brightness distributions, may be excluded from the survey. Bright SHARC Cluster candidates were selected from the 10,277 sources found in the survey using the following six criteria: The source had to (i) have a signal-to-noise ratio greater than 8, (ii) its centroid had to fall within 90 pixels (22@.4) of the pointing center, (iii) its centroid had to fall more than 10 pixels (2@.5) from the pointing center, (iv) its Ðlling factor had to be less than f \ 1.3, (v) it had to be more than 3 p extended, and (vi) it have to have a count rate higher than counts s~1. The imposition of these criteria cut down the source list from 10,277 (total) to 3,334 (criterion [i]) to 1,706 (criterion [ii]) to 374 (criteria [iii]è [v]) to 94 (criterion [vi]). Criterion (i) was imposed because it has been shown (Wirth & Bershady 2000, in preparation) that extent measures can only be derived with conðdence for sources meeting a minimum signal-to-noise threshold. Criterion (iii) was applied to avoid including the intended target of the pointing in the candidate list. Criterion (iv) was set empirically with the aim of reducing the number of blended sources and percolation runaways in the candidate list. The rationale for the other criteria is provided below.
5 212 ROMER ET AL. The point spread function of the PSPC degrades signiðcantly as one moves out from the center of the detector (Hasinger et al. 1992). It therefore becomes increasingly dif- Ðcult to distinguish extended sources from point sources as the o -axis angle increases. To overcome this, we used all 3334 of the S/N [ 8 sources in our survey to study statistically how source size varies as a function of position on the PSPC. The method used has been described previously (Nichol et al. 1997), but we include an overview here for completeness. Figure 1 shows the distribution of source size (as deðned by the lengths of the major and minor axes of the best-ðt ellipses) as a function of o -axis angle. After collecting these data into 10 pixel bins, we were able to determine how the mean and FWHM of the distribution varied with o -axis angle. (Beyond an o -axis angle of 90 pixels, the dispersion in source sizes became too large to deðne a reliable FWHM, hence the imposition of criterion [ii]). Under the assumption of a Gaussian distribution, the FWHM values were converted into sigma values and a 3 p curve was determined by Ðtting a fourth-order polynomial to the [mean ] 3 p] values. A source was deðned to be extended if it had a major and/or a minor axis more than 3 p from the mean. In total, 374 sources were found to meet criteria (i) through (v). These are listed in Table 6 (Appendix E) in right ascension order. Wavelet count rates (cr ) are given for W each source in units of 1 ] 10~2 counts s~1 (col. [4]). We note that duplicate entries, e.g., RX J0056.5[2730Èwhich was detected in two pointings, wp and rp701223n00èhave not been excised from this list. The Ñuxes for these 374 sources (assuming thermal spectra see 6.2) range from 0.2 [ f [ 40. In the interests of com- ~13 pleting the optical follow-up in a timely fashion, it was decided to concentrate only on the brightest of these 374. An arbitrary count rate cut (cr [ ) was imposed to W reduce the sample size to roughly 100 (criterion [vi]). At the redshift of the most distant cluster in the EMSS sample (z \ 0.81), this count rate corresponds to a luminosity of ^3.9L, which is approximately equal to locally determined 44 values of L, e.g., L \ 5.7L (Ebeling et al. 1997), 44 L \ 3.8L (De Grandi et al. 1999a). 44 The total areal coverage of the Bright SHARC survey is deg2. This value was determined by calculating the area available for candidate detection in each of the 460 pointings in the survey. This area includes all pixels at radii greater than 2@.5 and less than 22@.4, which (i) had exposure times more than half that of the central pixel and (ii) did not overlap pixels in a higher exposure pointing. (There were 21 pairs of pointings with some overlap between them.) 5. IDENTIFICATION OF EXTENDED SOURCES We present the 94 unique5 extended sources in the Bright SHARC survey in Table 1 and Appendix C. For each candidate, we provide the source name (col. [1]), its J2000 position (cols. [2] and [3]), the wavelet count rate [0.4È2.0 kev] (cr in units of 1 ] 10~2 counts s~1 col. [4]), the pointing W in which it was detected (col. [5]), the source type (col. [6]), and the method used to identify the source (col. [7]). Alternate source names and redshifts (where available) are listed in column (8). We note that Abell clusters (Abell 1958; Abell et al. 1989) are denoted by A. ÏÏ Likewise for EMSS sources ( MS ÏÏ; Stocke et al. 1991), 160 deg2 clusters ( V ÏÏ; Vikhlinin et al. 1998a, hereafter V98), Hickson groups ( HCG ÏÏ; Hickson 1982), and Zwicky clusters ( Z ÏÏ; Zwicky, Herzog, & Wild 1968). When an object is listed in more than one catalog, we have defaulted to the name given in the older catalog, e.g., for RX J we have listed the Abell number (A3038), not the V98 number (V28). In Appendix C, we present small (6@.6 ] 6@.6) Digitized Sky Survey (DSS) images of each of the 94 extended sources listed in Table 1. The source outlines, as deðned by our friends-of-friends analysis, are overlaid on these images. We note that the source centroids were deðned in a weighted fashion and do not necessarily coincide with the geometric center of the source outline. No external astrometric solution was applied before making these DSS images, because the expected pointing o set is much smaller ([6A) than the typical size of one of our extended sources. In some cases it was possible to identify the source using the DSS images alone. For example, the X-ray emission from source RX J0324.6[5103 is clearly associated with a bright star (HD 21360). This source was Ñagged as extended because emission from the star was blended by the friends- 5 Duplicate entries for RX J0237.9[5224 and RX J1211.2]3911 have been removed. FIG. 1.ÈDistribution of major and minor axes for the 3334 S/N [ 8 sources in the Bright SHARC survey as a function of o -axis angle. The solid lines correspond to the Ðtted 3 p extent curves; any sources falling above these lines are classiðed as extended. For illustration purposes, we have plotted, as open diamonds, the points corresponding to the 37 Bright SHARC clusters on the major axis plot (the numerical values for these points can be found in Table 2).
6 TABLE 1 EXTENDED SOURCES IN THE BRIGHT SHARC SURVEY Source R.A. (J2000) Decl. (J2000) cr W Pointing ID ID Code Notes References (1) (2) (3) (4) (5) (6) (7) (8) (9) RX J0031.0[ [ wp800387n00 Blend XSNC AGN, z \ 0.25 ]? RX J0031.9[ [ wp800387n00 Blend X S C id pending RX J0058.0[ [ rp701223n00 Blend S N C Mstar ]? RX J0117.6[ [ rp100376n00 Cluster S N C A2894, z \ RX J0124.8] ] rp Galaxy N NGC 524, cz \ 2421 km s~1 1 RX J0152.7[ [ rp600005n00 Cluster S O C z \ RX J0209.4[ [ rp800114n00 Galaxy N NGC0835, z \ RX J0209.9[ [ rp800114n00 Blend XSNC QSO: MS0207.4, z \ 1.97 ]? 4 RX J0217.4[ [ rp900352n00 Blend S C AGN, z \ ]? RX J0221.1] ] wp Cluster S C z \ 0.45 RX J0223.4[ [ rp800016n00 Cluster SONC z \ RX J0237.9[ [ rp300201n00 Cluster SONC A3038, z \ RX J0250.0] ] rp Cluster S C z \ 0.12 RX J0256.5] ] rp701403n00 Cluster S C z \ 0.36 RX J0318.2[ [ wp800555n00 Blend X S C Cluster, z \ 0.37 ] AGN, z \ RX J0318.5[ [ wp800555n00 Cluster S C z \ 0.37 RX J0321.9[ [ wp800371n00 Cluster N A3120, z \ RX J0324.6[ [ wp800371n00 Blend X D Star:HD21360 ]? RX J0327.9] ] rp700099m01 Galaxy N UGC2748, z \ RX J0337.5[ [ wp Blend X C id pending RX J0340.1[ [ rp900495n00 Id pending C RX J0359.1[ [ rp Blend X D 2 stars RX J0414.0[ [ rp900242n00 Blend S N AGN, z \ ]? 9 RX J0415.7[ [ wp600623n00 Galaxy N NGC1549, cz \ 1197 km s~1 10 RX J0416.1[ [ wp600623n00 Galaxy N NGC1553, cz \ 1080 km s~1 11 RX J0420.9] ] wp Blend S C AGN ]? RX J0421.2] ] rp200776n00 Blend X S C star ]? RX J0426.1] ] rp201369n00 Cluster S C z \ 0.38 RX J0454.3[ [ rp800229n00 Cluster S C z \ 0.26 RX J0514.2[ [ wp800368n00 Blend X S C AGN, z \ ]? RX J0609.1[ [ rp Blend D star ]? RX J0849.1] ] rp700546n00 Cluster S N C A708, z \ 0.23 RX J0853.6] ] rp700887n00 Blend X D N Star ] Galaxy:MS0850.8, z \ RX J0945.6[ [ wp701458n00 Blend X D S AGN, z ^ 1.2 ] star RX J0947.8] ] wp701587n00 Blend S C QSO, z ^ 0.63 ]? RX J1010.2] ] wp Group N V84 z ^ RX J1020.0] ] wp900528n00 Blend X C id pending RX J1024.3] ] wp800641n00 Cluster N A981, z \ RX J1031.3[ [ rp700461n00 Blend D S Star ]? RX J1113.8] ] rp700855n00 Cluster N A1203, z \ RX J1120.1] ] rp900383n00 Cluster S C z \ 0.60 RX J1142.2] ] wp Cluster N A1356, z \ RX J1143.7] ] rp600236n00 Blend X D C id pending RX J1204.0] ] wp Cluster N MS1201.5, z \ RX J1204.1] ] rp Galaxy N NGC4066, z \ RX J1210.4] ] wp Blend N C QSO:MS1207.9, z \ ]? 19 RX J1211.1] ] rp600625n00 Blend X D Star ]?
7 TABLE 1ÈContinued Source R.A. (J2000) Decl. (J2000) cr W Pointing ID ID Code Notes References (1) (2) (3) (4) (5) (6) (7) (8) (9) 214 RX J1211.2] ] wp Cluster N MS1208.7, z \ RX J1220.3] ] rp Galaxy N NGC4291, z \ RX J1222.1] ] rp Cluster N MS1219.9, z \ RX J1222.5] ] wp Blend X D 2 Stars RX J1227.4] ] wp600587n00 Cluster N A1541, z \ RX J1232.8] ] rp Cluster S C z \ 0.22 RX J1241.5] ] rp600129a00 Cluster S C z \ 0.39 RX J1244.1] ] rp Blend X C id pending RX J1250.4] ] wp Galaxy N NGC4725, z \ RX J1259.7[ [ rp800384n00 Cluster S C z \ RX J1308.5] ] wp300394n00 Cluster S C z \ 0.33 RX J1311.2] ] wp Cluster N C MS1308.8, z \ RX J1311.8] ] wp Cluster S C z \ 0.44 RX J1313.6[ [ wp Blend X D id pending RX J1334.3] ] rp Cluster S C z \ 0.62 RX J1343.7] ] rp700922n00 Cluster N A1783, z \ RX J1349.2[ [ rp800637n00 Galaxy pair N part of HCG67, z \ RX J1406.9] ] rp Cluster N S C V154, z \ RX J1412.4] ] wp Blend XSNC AGN, z \ ]? 28 RX J1416.4] ] rp800401a01 Cluster S C z \ RX J1417.9] ] wp Blend O C AGN ] Mstar 29 RX J1418.5] ] wp Cluster S C V159, z \ 0.29 RX J1508.4] ] rp600119n00 Blend D S C Star ]? RX J1517.1] ] rp Blend XDSC Star ]? RX J1524.6] ] rp701001n00 Cluster S O C V170, z \ RX J1525.3] ] rp701405n00 Blend N C QSO, z \ ]? 31 RX J1541.1] ] rp800511n00 Cluster S C z \ RX J1543.7] ] rp800511n00 Blend S C QSO, z \ ]? RX J1641.2] ] rp Cluster S N C V183, z \
8 TABLE 1ÈContinued Source R.A. (J2000) Decl. (J2000) cr W Pointing ID ID Code Notes References (1) (2) (3) (4) (5) (6) (7) (8) (9) 215 RX J1701.3] ] wp701457n00 Cluster N S C V190, z \ RX J1705.6] ] rp701439n00 Id pending C RX J1726.2] ] rp200522n00 Blend X D Star ]? RX J1730.6] ] wp Galaxy N S C NGC6414, z \ RX J1808.3] ] rp Blend X N QSO:HB89:1806]456, z \ 0.83 ]? 34 RX J1838.8[ [ rp701020n00 Id pending RX J1845.6] ] rp Blend X D Star:HD ]? RX J2109.7[ [ rp201007n00 Blend S C QSO ]? RX J2202.8[ [ rp200559n00 Blend X D id pending RX J2215.2[ [ rp701390n00 Blend N QS0: HB89:2212[299, z \ 2.7 ]? 35 RX J2223.8[ [ rp701018n00 Blend S AGN, z \ ]? RX J2236.0] ] wp Group N Stef.Quintet, z \ RX J2237.0[ [ wp201723n00 Cluster S C z \ RX J2258.1] ] rp201282n00 Cluster S N C Z2255.5, z \ RX J2309.4[ [ rp900323n00 Blend S C AGN, z \ 0.25 ]? RX J2311.4] ] rp100578n00 Blend S C AGN, z \ ]? RX J2314.7] ] rp800488n00 Blend S C Cluster, z \ 0.28 ] Mstar RX J2353.5[ [ wp701501n00 Blend S C QSO ] Mstar NOTES.ÈUnits of right ascension are hours, minutes, and seconds, and units of declination are degrees, arcminutes, and arcseconds. The ninety-four Extended sources in the Bright SHARC survey. Count rates (col. [4]) are quoted in units of 10~2 counts s~1. REFERENCES.È(1) Redshift taken from De Vaucouleurs et al. 1991, hereafter D91; (2) conðrmation of redshift provided by P. Rosati 1999, private communication, and Ebeling et al. 2000; (3) D91; (4) Stocke et al. 1991, hereafter S91. (5) additional spectroscopy provided by I. Del Antonio; (6) additional spectroscopy provided by I. Del Antonio; (7) Abell et al. 1989; (8) D91; (9) additional redshift information available in Perlman et al. 1998; (10) Longhetti et al. 1998; (11) D91; (12) S91; (13) Carballo et al. 1995; (14) Huchra et al. 1990; (15) Slinglend et al. 1998; (16) Struble & Rood 1987; (17) S91; (18) D91. (19) S91; (20) S91; (21) D91; (22) S91; (23) Zabludo et al. 1993; (24) D91; (25) S91; (26) Struble & Rood 1987; (27) Fairall et al. 1992; (28) additional redshift information available in Boyle et al. 1995; (29) spectroscopy provided by D. Turnshek and E. Monier; (30) spectroscopy provided by I. Del Antonio; (31) Perlman et al. 1998; (32) also known as EXSS ]8238 (Tucker et al. 1995); (33) also known as Cluster B ÏÏ (Reimers et al. 1997). (34) Hewitt & Burbidge 1993; (35) Hewitt & Burbidge 1993; (36) Hickson et al. 1992; (37) S91.
9 216 ROMER ET AL. Vol. 126 of-friends analysis with the (fainter) emission from a neighboring point source. (The X-ray surface brightness contours for this source show a secondary peak centered on the faint DSS object to the lower left of the source outline.) In other cases, the source outline, and/or the surface brightness contours, are indicative of blended emission but no obvious counterpart could be found on the DSS images, e.g., RX J0947.8]0741. When the DSS (or X-ray) images played a role in the identiðcation of a source, a D ÏÏ (or X ÏÏ) is listed in column (7) of Table 1. A search of the NASA/IPAC Extragalactic Database (NED) has also provided useful information for several of the Bright SHARC extended sources, including some cluster redshifts e.g., for RX J1204.0]2807 (MS , Gioia et al. 1990). When NED yielded information was used during the source identiðcation, an N ÏÏ is listed in column (7) of Table 1. Optical follow-up of Bright SHARC extended sources has been carried out at a number of telescopes; the 3.5 m ARC telescope at Apache Point Observatory, the Danish 1.5 m and 3.6 m telescopes at the ESO Southern Observatories, the 1.5 m telescope at the Cerro Tololo Inter- American Observatory, the 3.6 m Canada-France-Hawaii Telescope on Mauna Kea and the 4 m Mayall telescope at Kitt Peak National Observatory. Optical follow-up includes CCD imaging, long-slit spectroscopy and multiobject spectroscopy. Of the 94 extended sources, to date 57 have CCD images and 51 have been the target of spectroscopic follow-up. A C ÏÏ in column (7) of Table 1 indicates that a CCD image is available, whereas an S ÏÏ indicates spectroscopic follow up by the SHARC collaboration and an O ÏÏ indicates that spectroscopy came from private communications. To date, 91 of the 94 Bright SHARC extended sources have been identiðed; 37 clusters, 41 blends, nine galaxies and three galaxy groups. The symbols ]?ÏÏ in column (8) indicate that the identiðcation of one of the components of a blended source is unknown. We note that the distinctions between galaxies and groups (see 7.4), and between groups and clusters, are not absolute at the lowluminosity end. For the 12 extended objects (nine galaxies and three groups) at redshifts less than z \ 0.07, we based our classiðcations on the information provided by NED. 6. THE BRIGHT SHARC CLUSTER SAMPLE The 37 clusters in the Bright SHARC are listed in Table 2. For each cluster, we list the source number (col. [1]), the cluster redshift (col. [2]), the hydrogen column density (in units of 1 ] 1020 cm~2, col. [3]), the major and minor axes (in units of 14A.947 pixels, cols. [4] and [5]), the o -axis angle of the cluster centroid (in units of 14A.947 pixels, col. [6]), the wavelet (cr ) and total (cr ) count rates [0.4È2.0 W T kev] (in units of 1 ] 10~2 counts s~1, cols. [7] and [8]), the percentage error on cr (dcr, col. [9]), the aperture con- taining 80% of the Ñux T from a T model cluster proðle (r, col. 80 [10], see 6.1), the fraction of that aperture used to measure the cluster count rate ( f, col. [11]), the total Ñux [0.5È kev] ( f, in units of 1 ] 10~13 ergs s~1 cm~2, col. [12]), ~13 the corresponding luminosity (L, in units of 1 ] 1044 ergs 44 s~1, col. [13]), and the temperature used to derive the Ñux and luminosity (T, in units of kev, col. [14]). Various notes, including alternative cluster names and pointers to the information on the pointing target (if that target was a cluster) are given in column (15). The redshift distribution (z6 \ 0.266) for the 37 Bright SHARC clusters is shown in Figure 3. The highest redshift, and most luminous, cluster in the sample is RX J (z \ 0.83). The lowest redshift cluster in the sample is RX J (z \ ). Twenty-one of the redshifts in Table 2 are presented here for the Ðrst time. These 21 include 17 clusters which have not been listed before in any published catalog and four clusters from the 160 deg2 survey (V98). We describe below how the count rates ( 6.1) and Ñuxes/ luminosities ( 6.2) were derived T otal Cluster Count Rate Derivation The method described in 4, to measure wavelet count rates for all 10,277 sources in the Bright SHARC survey, was adopted because it was easy to apply to large numbers of sources. However, the method is not optimal for measuring cluster Ñuxes. This is because no correction is made for cluster Ñux falling outside the zero-crossing boundary. Moreover, when a portion of a cluster overlaps a masked out region (e.g., regions in the shadow of the support struts), the Ñux from that region will not be included in the count rate. Therefore, for the 37 sources identiðed with clusters of galaxies, we have performed a second count rate determination based on the method adopted by Holden et al. (1997). For each of the clusters, we derived an aperture for the Ñux measurement using a cluster model based on a modiðed isothermal sphere: I I \ 0 [1 ] (r/r )2]3b~1@2, (2) c where I is the surface brightness at radius r. We used values for the slope (b \ 0.67) and core radius (r \ 250 kpc) which c are typical for rich clusters (Jones & Forman 1992) and then converted the model from physical units to angular units using the cluster redshift. The cluster models were convolved with the appropriate o -axis PSPC PSF (Nichol et al. 1994b) so that the radius of a circular aperture, r, which contained ^80% of the total model Ñux could 80 be deðned (for b \ 2/3, r \ 241@2r ). The choice of r for the 80 c 80 aperture represents a compromise between including a high fraction of the cluster Ñux and keeping down the number of contaminating sources within the region. The 80% radii, r, are listed in column (10) of Table 2, in units of 14A.947 pixels. 80 Since these radii could be quite large, up to 40 pixels, some of them overlapped other sources. If any r \ r pixels lay within the wavelet-deðned boundary of another 80 source, they were masked out from the cluster aperture. Also masked were any pixels that received less than half the exposure time of the central pixel in the count rate map. By reference to the cluster model, it was possible to correct for the fraction of cluster Ñux lying in these masked regions. In column (11) of Table 2, we list the fraction of the 80% aperture available for Ñux determination, f. The raw aperture count rates for each of the 37 clusters 80 were measured by summing the Ñux in the unmasked r \ r pixels. 80The corresponding background count rates were measured inside 120 ] 120 pixel boxes centered on the cluster position. The background levels were measured in annuli with minimum radii of 1 ] r and maximum radii 3 ] r. If these annuli overlapped any 80 source boundaries, any lowexposure pixels, or the edges of the 120 ] 120 pixel box, the 80 pixels in those regions were excluded from the background calculations. In Appendix D we illustrate the masked out
10 No. 2, 2000 BRIGHT SHARC SURVEY: CLUSTER CATALOG 217 TABLE 2 BRIGHT SHARC CLUSTER CATALOG dcr T Source Redshift nh Major Minor O -Axis cr W cr T (%) r 80 f 80 f ~13 L 44 T Notes (1) (2) (3) (4) (5) (6) (7) (8) (9) (10) (11) (12) (13) (14) (15) RX J0117.6[ A2894 RX J0152.7[ RX J0221.1] RX J0223.4[ a RX J0237.9[ A3038 RX J0250.0] RX J0256.5] RX J0318.5[ b RX J0321.9[ A3120c RX J0426.1] RX J0454.3[ d RX J0849.1] A708 RX J1024.3] A981e RX J1113.8] A1203 RX J1120.1] RX J1142.2] A1356 RX J1204.0] MS RX J1211.2] MS RX J1222.1] MS RX J1227.4] A1541 RX J1232.8] RX J1241.5] RX J1259.7[ f RX J1308.5] RX J1311.2] MS RX J1311.8] RX J1334.3] g RX J1343.7] A1783 RX J1406.9] V154 RX J1416.4] h RX J1418.5] V159 RX J1524.6] V170 RX J1541.1] i RX J1641.2] V183 RX J1701.3] V190 RX J2237.0[ RX J2258.1] Z NOTE.ÈThe thirty-seven Bright SHARC clusters. Count rates (cols. [4] and [5]) are quoted in units of 10~2 counts s~1. a RX J (z \ 0.163) was detected in pointing rp800016n00, the central target of which was a wide angle radio (WAR) source. The cluster hosting this WAR source has a redshift of z \ 0.41 (Nichol et al. 1994a). The redshift separation of the two clusters is dz ^ b RX J (z \ 0.37) was detected in wp800555n00 which was pointed, accidentally, D40 away in declination away from the listed target, A3112, which lies at [ (Ebeling et al. 1996). c RX J (A3120, z \ ) was detected in wp800371n00, the central target of which was a Couch et al cluster at z \ The redshift separation of the two clusters is dz \ d RX J (z \ 0.26) was detected in rp800229n00, the central target of which was cluster MS (z \ 0.55; Gioia & Luppino 1994). The redshift separation of the two clusters is dz \ e RX J (A981, z \ 0.201) was detected in wp800641, the central target of which was cluster A998 (z \ 0.202; Huchra et al. 1990). The redshift separation of the two clusters is dz \ f RX J (z \ 0.076) was detected in rp800384n00, the central target of which was cluster A3537 (cz \ 5007 km s~1; Abell et al. 1989). The redshift separation of the two clusters is dz \ g RX J (z \ 0.62) was detected in rp800047, the central target of which was cluster A1758 (z \ ; Allen et al. 1992). The redshift separation of the two clusters is dz \ h RX J (z \ 0.138) was detected in rp800401a01, the central target of which was galaxy 4C23.37 (cz \ 154 km s~1; De Vaucouleurs et al. 1991). The redshift separation of the two clusters is dz \ i RX J (z \ 0.245) was detected in rp800511n00, the central target of which was A2125 (z \ ; Struble & Rood 1987). The redshift separation of the two clusters is dz \ regions for the source and background apertures for each of the 37 Bright SHARC clusters. After subtraction of the appropriately scaled background, the total cluster count rates were derived by dividing by (0.8 ] f ). The 80 background-subtracted, aperture-corrected, total cluster count rates (cr ) are listed in column (8) of Table 2. The 1 p T errors on the total cluster count rates are listed in column (9). These errors were calculated by adding in quadrature the counting errors on the cluster count rates and the background count rates. We draw attention to three SHARC clusters with anomalously high ([15%) count rates errors; RX J0250.0, RX J1524.6, and RX J These clusters have much lower signal to noise values inside the cr aper- T tures than in the cr apertures, demonstrating that the W
11 218 ROMER ET AL. Vol. 126 adopted cluster model (eq. [2]) signiðcantly over estimates the size of the aperture which encircles 80% of the source Ñux. The count rate errors are quoted as percentages since, in the absence of systematic errors in the count rate to Ñux/luminosity conversions ( 6.2), they should also reñect the percentage errors on the Ñux ( f, col. [12]) and lumi- ~13 nosity (L, col. [13]). In Figure 44 2 we compare the initial wavelet count rates, cr (col. [7]), to the total aperture corrected count rates, W crt. It can be seen that, as expected, the total count rate is systematically higher than the wavelet count rate. A least squares Ðt to the clusters at redshifts greater than z \ 0.15 shows that the total count rate is typically 2.1 times higher than the wavelet value. At lower redshifts, the correction is higher because the clusters are signiðcantly more extended than the p \ 3 pixel wavelet we used for source detection. It is encouraging that the wavelet count rate appears to be an unbiased measure of the total cluster count rate, since we have used the cr values to deðne the count rate limit of the Bright SHARC Survey. W 6.2. L uminosity Derivation We used the cr count rates listed in column (8) of Table 2 to determine Ñuxes T and luminosities for each cluster. We note that we chose to present the Ñuxes and luminosities in the [0.5È2.0 kev] band, rather than in the Bright SHARC count rate band [0.4È2.0 kev], to allow easier comparison with other studies. Since the ROSAT PSPC provides only limited spectral resolution, we had to assume a spectral model for each cluster to make the conversion between measured cluster count rate and unabsorbed Ñux. As is typical in X-ray cluster analyses, we adopted an emission spectrum from hot, di use gas based on the model calculations of Raymond & Smith (1977). The integrated emission from a Raymond-Smith spectrum in the SHARC energy band (observerïs rest frame) depends on several factors; the metallicity and temperature of the gas, the redshift of the cluster, and the absorption column along the line of sight. This means that the conversion between measured aperture count rate and cluster luminosity is nontrivial and must take into account the speciðc properties of each cluster. We note that, in most cases, the dominant source of error in the derived luminosities comes from the count rate FIG. 2.ÈWavelet count rate vs. the total count rate for each of the 37 clusters in the Bright SHARC sample. The low-redshift (z \ 0.15) clusters are indicated by circles. A least squares Ðt to the z [ 0.15 clusters (diamonds) is shown by the dotted line (slope \ 2.1). uncertainty, which rises to 30% in the case of RX J However, for those clusters with well-determined count rates (30 clusters have count rate errors of less than 10%) it is worth making the extra e ort to reduce the systematic errors in the conversion between count rates, Ñuxes and luminosities. We have constructed a matrix of count rate to Ñux conversion factors as a function of temperature, redshift and absorbing column. (A single, canonical, value for the metallicityèone-third the solar valueèwas used throughout.) The conversion factors were derived using the fakeit ÏÏ command in XSPEC (version 10.00, Arnaud 1996) together with the appropriate ROSAT PSPC response function. Photoelectric absorption was included via the XSPEC wabs ÏÏ model, which is based on cross sections presented in Morrison & McCammon (1983). The neutral hydrogen column densities adopted for each cluster are listed in column (3) of Table 2. These values were derived using the AT&T Bell Laboratories 21 cm survey (Stark et al. 1992), for clusters north of [40, and the values presented in Dickey & Lockman (1990) for clusters at lower declinations. In order to sample the observed distribution of cluster redshifts and column densities, and the expected distribution of cluster temperatures, we derived conversion factors over the following ranges; (i) 0.06 \ z \ 0.86 (in increments of dz \ 0.05), (ii) 0 \ nh \ 20 ] 1020 cm~2 (in increments of 1 ] 1020 cm~2), and (iii) 1 \ T \ 12 kev (in increments of 1 kev). (When a cluster redshift or column density was not exactly matched by one of the matrix entries, linear interpolation was used.) As expected, the count rate to Ñux conversion varied most rapidly along the column density axis of this matrix, however, changing the redshift also had a measurable e ect (by a factor of ^2 over the range 0.08 \ z \ 0.8). Estimates of the bolometric6 and k- corrections were also derived, as a function of temperature, using XSPEC. The luminosity derivation included an iteration to obtain an estimate of the X-ray temperature for each cluster, using the luminosity-temperature (L-T) relation presented in Arnaud & Evrard (1999). From a starting point of T \ 6 kev an initial [0.5È2.0 kev] luminosity was derived. This luminosity was then converted into a pseudo bolometric luminosity, so that a temperature estimate (to the nearest integer in kev) could be derived. The new temperature was used to select a second count rate to Ñux conversion from the matrix and the process was repeated until convergence was reached. The temperature used in the Ðnal luminosity calculation is listed in column (14) of Table 2. In the past, the luminosity-temperature (L-T) relation was not so well known and other groups have adopted a single temperature, usually 6 kev, for their luminosity calculations. Using the Arnaud & Evrard (1999) L-T relation, 6 kev corresponds to a cluster of L ^ 6. Most of the 44 clusters in Table 2 are signiðcantly fainter than this, meaning that the use of a canonical temperature will yield inaccurate results, especially for the lowest luminosity clusters. This is illustrated by the faintest (and hence, coolest) cluster in our sample (RX J1524.6) which has a luminosity of L \ when a temperature of T \ 1 kev is 44 assumed and a luminosity of L \ when a tem An energy range of 0.01È50 kev was used to calculate the (pseudo) bolometric corrections, which were found to be in excellent agreement with those presented in Fig. 2 of Borgani et al. (1999).
12 No. 2, 2000 BRIGHT SHARC SURVEY: CLUSTER CATALOG 219 perature of T \ 6 kev is assumed (an 11% e ect). By contrast the e ect is smaller (5%) for the hottest cluster in our sample; RX J has a luminosity of L \ 8.26 when a 44 temperature of T \ 9 kev is assumed and a luminosity of L \ 8.65 when a temperature of T \ 6 kev is assumed. It 44 is worth mentioning that the L-T relation we use (Arnaud & Evrard 1999) was constructed from clusters known not to contain cooling Ñows. Another recent work (Allen & Fabian 1998) combines both noncooling Ñow and cooling Ñow clusters and Ðts a Ñatter slope to the L-T relation (2.4 compared to 2.9). Unfortunately, the poor photon statistics of the Bright SHARC cluster sample do not allow us to test for the presence of cooling Ñows, and so our choice of L-T relation will be inappropriate in some cases. Finally, we note that the conversion between cluster count rate and cluster luminosity is a function of the adopted values of HubbleÏs constant and the deceleration parameter and that we have used H \ 50 km s~1 Mpc~1 0 and q \ 0.5 throughout DISCUSSION In a companion paper (Nichol et al. 1999, hereafter N99) we use the Bright SHARC sample to examine evolution in the X-ray cluster luminosity function (XCLF). Future papers will go on to use these evolution results to constrain the density parameter ). It is appropriate, therefore, to m discuss here some of the observational issues relevant to ) analyses. These issues include systematic biases in the m derived luminosities ( 7.1) of the Bright SHARC clusters and any possible contamination ( 7.2), or incompleteness ( 7.3) in the Bright SHARC catalog. We also discuss the possible discovery of three fossil groups ÏÏ ( 7.4) and our overlap with the 160 deg2 survey of V98 ( 7.5) L uminosity Bias in the Bright SHARC Cluster Sample A systematic bias in our luminosities would result in an over (or under) estimate of the number density of highluminosity systems. To investigate whether such a systematic bias exists, we have compared the luminosities quoted in column (13) of Table 2 with published values for the six clusters we have in common with the EMSS (Gioia et al. 1990): RX J (MS or A981), RX J (MS ), RX J (MS ), RX J (MS ), RX J (MS ), and RX J (MS or Z2255.5). We have chosen to compare our luminosities for these clusters with those presented in Nichol et al. (1997, hereafter N97), rather than those presented in Henry et al. (1992), for two reasons. First, the luminosities quoted in N97 are in the ROSAT bandpass [0.5È2.0 kev] rather than the Einstein bandpass [0.3È3.5 kev]. Second, the N97 study used the SHARC pipeline to produce count rate maps. A comparison of the two sets of luminosities will, therefore, show if the methodology outlined in 6.1 and 6.2 is robust (since a di erent methodology7 was used in N97). We Ðnd our derived luminosities to di er by 0% for MS , 1% for MS , 5% for MS , 26% for MS , 2% for MS , and 10% for MS These di erences are all smaller than the 1 p errors on the EMSS count rates quoted in N97. We note also that the luminosity we derive for RX J is within 1% of the value derived by the WARPS collaboration in Ebeling et al. (2000). We have also compared the Ñuxes quoted in column (12) of Table 2 with published values for the 11 clusters we have in common with the 160 deg2 survey (V98, see 7.3). In the Ðfth column of Table 3 we present the ratio of Bright SHARC to V98 Ñuxes. We Ðnd the Bright SHARC values to be systematically higher than those measured by V98, with an average Ñux ratio of To understand this discrepancy, we have recalculated the Bright SHARC Ñuxes using the core radii and redshifts presented in V98. Except for RX J1641.2, the V98 core radii are all smaller than r \ 250 kpc and, by using their values, we bring the average c Ñux ratio down to 1.01 (sixth column). We conclude that the methodology of 6.1 and 6.2 is robust, although it has the disadvantage of over estimating the cluster Ñux if r \ 250 kpc. Planned XMM observations c of several Bright SHARC clusters will provide higher angular resolution and signal-to-noise images together with accurate estimates of the electron temperature. These observations will provide an important test of the methods described in 6.1 and 6.2 since they will allow us to (i) more accurately excise contaminating sources in the cluster aperture, (ii) use Ðtted, rather than canonical, values for b, r and c the ellipticity, (iii) be less sensitive to errors in the back- 7 Di erences between Bright SHARC and N97 include the use of the IRAF PROS package to set background apertures and the use of a constant temperature, T \ 6 kev, for k-corrections and count rate to Ñux conversions. TABLE 3 COMPARISON OF BRIGHT SHARC AND V98 FLUX MEASUREMENTS Bright SHARC ID V98 ID Redshift f ~13 Ratioa Ratiob RX J0237.9[ V RX J0849.1] V RX J1204.0] V RX J1211.2] V RX J1308.5] V RX J1406.9] V RX J1418.5] V RX J1524.6] V RX J1641.2] V RX J1701.3] V RX J2258.1] V Average a Ratios of the Bright SHARC Ñuxes (fourth column) to the V98 Ñuxes. b Ratios of the recalculated Bright SHARC Ñuxes to the V98 Ñuxes, see 7.1 for details.
13 220 ROMER ET AL. Vol. 126 ground calculation, and (iv) improve our spectral dependent count rate to Ñux conversions Contamination of the Bright SHARC Cluster Sample The thorough, multiobject, spectroscopic follow-up of the Bright SHARC extended source list means that it is highly unlikely that any of the entries in Table 2 are misidentiðed contaminants. However, we stress that there are two clusters in that table which should not be used for studies of the cluster XCLF because their detections are not truly serendipitous: RX J and RX J were found in cluster pointings and lie at redshift separations from the pointing target of dz \ 0.002, or cz \ 600 km s~1. These clusters are probably associated with the pointing target via the cluster correlation function (Romer et al. 1994; Nichol, Briel, & Henry 1994a). In addition, we feel that RX J (MS ) warrants further study: This object is very compact, has a large count rate uncertainty ( 6.1), and Gioia & Luppino (1994) note that its central galaxy has emission lines. It is possible, therefore, that the luminosity quoted in Table 2 is an overestimate due to AGN contamination. (Although, it should be noted that the presence of emission lines in the central galaxy could be attributed to cooling Ñow nebulosity or star formation; Crawford et al ) We note that the three clusters highlighted here (RX J1024.3, RX J1222.1, and RX J1541.1) have redshifts in the range 0.20 \ z \ 0.25 and so were not used in the N99 analysis (which concentrated only on those clusters at z [ 0.3) Incompleteness of the Bright SHARC Cluster Sample There are three possible ways in which the Bright SHARC cluster sample might be incomplete. First, there are those clusters that did not meet our selection criteria. Second, there is a possibility that some clusters were misidentiðed as contaminants. Third, there are the three extended sources which have yet to be identiðed. We are using simulations to understand how the adopted selection criteria ( 4) e ects the completeness of the Bright SHARC cluster sample. We are in the process of carrying out a very thorough investigation of our selection function by adding many thousands of fake clusters (one at a time) to the pointings in our survey and then determining the fraction of these fake clusters that would have been selected as Bright SHARC cluster candidates. These simulations will provide us with the efficiency of cluster detection as a function of cluster parameters (e.g., redshift, luminosity, ellipticity, core radius etc.) and operational parameters (e.g., exposure time, o -axis angle, hydrogen column density, central target etc.). The results of these simulations will be presented elsewhere (Adami et al. 2000), but our preliminary Ðndings are described in N99. Let us now address possible cases where clusters might be misidentiðed as contaminants. We discuss Ðrst the two objects listed in Table 1 as blends of a cluster with another source, RX J and RX J The former, RX J0318.2, is a blend of a cluster with a QSO. (The cluster has the same redshift as the neighboring cluster RX J0318.8, z \ 0.37). The surface brightness contours of RX J are clearly dumbbell shaped, and so it has been possible to remove the QSO contribution from the total count rate. This object was also discovered as part of the Southern SHARC, and Burke (1998) has determined the total count rate and luminosity of this cluster to be cr \ count T s~1 and L \ 1.11, respectively. Therefore, this cluster 44 would not have made it into the Bright SHARC sample had it not been blended with the QSO and its exclusion for Table 2 is justiðed. By contrast, the boundary between the cluster and M star emission for RX J is blurred. Hence, it is not possible to excise the M star Ñux to see if the cluster alone has a high enough count rate (and extent) to qualify as a Bright SHARC candidate. If the M star makes only a minimal contribution, less that 20%, to the total Ñux, then the cluster should have been included in Table 2: Assuming that all the RX J Ñux comes from the cluster, the cluster would have a luminosity of L \ As stated above, three of the 94 Bright SHARC extended sources remain unidentiðed. If all three were high-redshift, high-luminosity clusters, then there would be important implications for cluster evolution. In N99, we predict that the Bright SHARC survey should include 4.9 clusters with luminosities L º 5 in the redshift range 0.3 \ z \ (based on a simple extrapolation of the De Grandi et al. 1999b local XCLF). Since only one such cluster has been conðrmed to exist in the Bright SHARC (RX J1120.1), we conclude in N99 that there may be evidence for evolution at luminosities brighter than L \ 5. This evidence would 44 e ectively disappear if another three Bright SHARC clusters were added in this luminosity range. We stress, however, that it is very unlikely all these objects are clusters with luminosities brighter than L \ 5; the CCD images of 44 RX J and RX J are not consistent with the presence of distant clusters and RX J is in a crowded star Ðeld (and so is most likely associated with a stellar X-ray source). We conservatively estimate that one these objects may be a cluster, given that the ratio of clusters to nonclusters among the other 91 identiðed sources is roughly 1:3. We have calculated that this cluster would have to reside at z [ 0.62, z [ 0.57 or z [ 0.51, for RX J0340.1, RX J1705.6, and RX J1838.8, respectively, to have a luminosity greater than L \ We also highlight candidate RX J This object contains a QSO and has a compact X-ray surface brightness proðle. Even though most of the Ñux from this source is probably coming the QSO, this object merits further study since a CCD image highlights a clustering of faint galaxies around the bright central object. The redshift of this source (z \ 0.615) and its high count rate (cr \ ) mean that W if more than 18% of the count rate from this source was coming from an associated cluster, then this cluster would have a luminosity greater than L \ For the various reasons outlined above, we have decided to continue the follow-up of the Bright SHARC in a variety of ways. As a Ðrst priority, we plan to identify the three remaining unidentiðed Bright SHARC extended sources (RX J0340.1, RX J1705.6, and RX J1838.8). We also plan to obtain identiðcations for at least one portion of the seven id-pending ÏÏ blends listed in Table 1 and to continue our campaign to obtain velocity dispersions for the Bright SHARC clusters. Moreover, we hope to obtain higher resolution X-ray images of complex sources such as RX J1210.4, RX J1222.1, and RX J to help determine the contamination level Fossil Groups and Dark Clusters in the Bright SHARC Survey We present evidence for the discovery of three new fossil groups ÏÏ (Ponman et al. 1994) or X-ray overluminous elliptical galaxies (OLEGs, Vikhlinin et al. 1999). These objects
14 No. 2, 2000 BRIGHT SHARC SURVEY: CLUSTER CATALOG 221 are predicted to occur when a galaxy group relaxes to form a single elliptical galaxy. They are interesting because they provide invaluable insight into the processes of elliptical galaxy evolution, metal enrichment in the intracluster medium, and the dynamics of extended dark halos (Mulchaey & Zabludo 1998). Their observational signatures would be an isolated cd or giant elliptical galaxy surrounded by a cool (T ^ 1 kev), extended, X-ray halo. Two galaxies detected in the Bright SHARC survey appear to share these properties; RX J (NGC 6414, z \ 0.05) and RX J (UGC 2748, z \ 0.03). Applying the same method used to obtain total cluster count rates ( 6.1), we have measured their luminosities to be L \ and L \ 0.056, respectively.8 In addition to these 44 two galaxies, 44 one of the Bright SHARC clusters, RX J (A3120, z \ , L \ 0.43), also appears to display fossil group ÏÏ characteristics. 44 We highlight these objects here since they are ideal targets for follow-up studies at X-ray and optical wavelengths. We have estimated the fossil group ÏÏ space density to be D2 ] 10~6 Mpc~3 under the assumption that the Bright SHARC is 100% efficient in detecting extended sources in the redshift range 0.02 \ z \ 0.08 and at luminosities of L [ In addition to estimating the space density of fossil groups, ÏÏ we can comment on the space density of dark clusters ÏÏ or failed clusters. ÏÏ These objects are theorized to have cluster-like masses and to radiate in the X-rays but to have an underluminous galactic component (Tucker, Tananbaum, & Remillard 1995; Hattori et al. 1997). We have successfully identiðed 91 of the 94 Bright SHARC extended sources and have found no evidence for dark clusters. ÏÏ To avoid detection in the Bright SHARC, these objects either must have a lower space density than rich clusters and fossil groups ÏÏ or they must be intrinsically faint and evolve rapidly (to avoid detection at low redshift). In either case, dark clusters ÏÏ are unlikely to be a signiðcant contribution to the mass of the universe Comparison with the 160 deg2 Survey As pointed out by N99, it may be possible to combine the Bright SHARC with the 160 deg2 survey (V98) to maximize the area available for high-redshift cluster searches. The motivation for this is demonstrated by Figure 3, which shows several gaps in the redshift coverage of our survey. Even though we are able to Ðnd high-luminosity clusters out to at least z \ 0.83, we Ðnd none at z ^ 0.5 or z ^ 0.7. The only way to guarantee more L [ 3 cluster detections 44 would be to search over a wider area. The combination of the two surveys would yield a search area of ^260 deg2, since only 44% (or ^78 deg2) of the Bright SHARC Survey overlaps with the 160 deg2 survey. (There are 201 pointings in common between the 160 deg2 and Bright SHARC Surveys; A. Vikhlinin 1999, private communication). There are 13 sources in common between the Bright SHARC and the 160 deg2 surveys. Of these 13, Ðve clusters have not been followed up spectroscopically by either survey but rely on literature redshifts (RX J1010.2,9 RX J1204.0, RX J1211.2, RX J1311.2, RX J2258.1). An additional three clusters have both Bright SHARC and V98 8 Assuming an absorbed Raymond Smith spectrum with an electron temperature of T \ 1 kev. 9 RX J was not included in Table 2 because its redshift (z \ 0.045) is too low, i.e., z \ FIG. 3.ÈRedshift distribution of the 37 clusters in the Bright SHARC redshifts (RX J0849.1, RX J1406.9, RX J1701.3); with the two redshifts being in agreement in all cases. We have also been able to provide spectroscopic information for Ðve 160 deg2 sources which previously relied on photometric redshifts; RX J (V28), RX J (V75), RX J (V159), RX J (V170), and RX J (V183). We have identiðed RX J as a blend, the main component of which is a QSO10 at z \ 0.63 (Burke 1998). We conðrm that the other four sources are clusters and we Ðnd that the photometric redshifts listed in V98 are good estimates of the true redshift, with the largest error being dz \ for RX J This cluster has been shown to be at z \ 0.195, giving it a luminosity of L \ It is not, therefore, a 44 high-redshift, high-luminosity, cluster, as previously suggested by Vikhlinin et al. (1998b), based on the upper limit of the estimated redshift (z \ 0.26 `0.04). est ~0.07 In addition to the 13 sources described above, 77 other V98 clusters were detected in the 201 pointings common to the two surveys. Most of these clusters are too faint to have been included in the Bright SHARC sample, only nine have wavelet count rates greater than the Bright SHARC threshold (cr \ ). Of these nine, seven were not included W in the Bright SHARC because they did not meet our Ðlling factor criterion ( f \ 1.3), one was detected at an o -axis distance less than our threshold of 2@.5 and one did not meet our extent criterion. Conversely, two clusters (RX J and RX J1311.8) in Table 2 are not listed in V98, despite falling in common pointings, because they lie beyond the V98 o -axis limit of 17@.5. These examples demonstrate how di ering survey selection criteria produce di ering cluster samples and that detailed simulations are required to determine a surveyïs selection function. There are eight conðrmed L [ 3 clusters in the Bright 44 SHARC; RX J0152.7, RX J0256.5, RX J0318.5, RX J0426.1, RX J1241.5, RX J1120.1, RX J1334.3, and RX J The presence of so many L [ 3 clusters in the Bright SHARC 44 has allowed us to show that the XCLF is nonevolving up to L ^ 5 (N99). It is important to note that, even after the 44 combination of Bright SHARC and 160 deg2 surveys, the areal coverage available for high-redshift cluster searches 10 Subsequent observations by Vikhlinin et al. have shown that this QSO most likely resides on the outskirts of a cluster at the same redshift (A. Vikhlinin 1999, private communication).
15 222 ROMER ET AL. will still be only about one-third that of the EMSS at the bright end (Henry et al. 1992). This means that we will probably have to wait until larger area surveys are made available, e.g., from the XMM satellite (Romer et al. 2000) to make deðnitive statements about XCLF evolution at L 44 [ 5. We acknowledge Ðnancial support from NASA grants NAG (A. R., R. P., C. A., and M. U.), NAG (R. N.), NAG (B. H.), and GO A (B. H.). And also from a NASA Space Consortium grant through Aerospace Illinois (A. M., K. C., B. H.), the CMU undergraduate research initiative (A. J. M.), the NSF Center for Astrophysical Research in Antartica (B. H.), NSF grant AST (B. H.) and PPARC (D. B.). This research has made use of: (i) Data obtained through the High-Energy Astrophysics Science Archive Research Center Online Service, provided by the NASA-Goddard Space Flight Center. (ii) The Digitized Sky Survey, which was produced at the Space Telescope Science Institute under US Government grant NAG W (iii) The NASA/IPAC Extragalactic Database (NED), which is operated by the Jet Propulsion Laboratory, Caltech, under contract with the National Aeronautics and Space Administration. (iv) The APM Catalogues at AAO ÏÏ web server, author Micheal Drinkwater. (v) The APS Catalog of POSS I and the APS Image Database, which are supported by the National Science Foundation, the National Aeronautics and Space Administration, and the University of Minnesota. We o er special thanks to Jim DeVeny and the support sta at the ARC, CFHT, CTIO, ESO, and KPNO telescopes, and also to Alain Blanchard, Francisico Castander, Ian Del Antonio, Paul Lynam, Eric Monier, Francis Falbo, Tim Kimball, Marc Postman, Patricia Purdue, Connie Rockosi, Rachid Sadat, Steve Snowden, Je rey Tran, Dave Turnshek, Pedro Viana, Alexey Vikhlinin, and an anonymous referee. APPENDIX A Table 4 shows the 460 ROSAT PSPC pointings in the Bright SHARC survey. TABLE 4 ROSAT PSPC POINTINGS IN THE BRIGHT SHARC SURVEY b Time Pointing Pointing R.A. (J2000) Decl. (J2000) (deg) (s) Target (1) (2) (3) (4) (5) (6) rp800469n ] [ NGC 7805 rp700467n [ [ Q0000[26 rp ] [ Mrk 335 wp800386n [ [ Sculptor/Phoenix N wp800388n [ [ Sculptor/Phoenix S rp800253n ] [ CL 0016]16 wp ] [ RX J0019.8]2156 rp800483n ] [ CL 0020 rp ] [ PG 0027]260 rp800486n ] [ HCG 2 wp800387n [ [ Sculptor/Phoenix ref rp600244n ] [ M31 Pos 2 rp ] [ Q0043]0048 rp600245n ] [ M31 Pos 3 rp ] [ Mrk 348 rp700275n [ [ SGP 2 rp900496a [ [ SGP 3 rp701223n [ [ GSGP 4 rp ] [ NGC 315 wp [ [ SGP 4 wp [ [ [304 rp201488n ] [ HD 6903 rp700794n [ [ NGC 424 rp800292n [ [ Abell 2889 rp100376n [ [ WFC focus check GD 695 rp800473a [ [ NGC 491 wp ] [ rp ] [ MS ]0903 wp800645n [ [ Group 3 rp800487n ] [ HCG 10 wp [ [ HCG 12 wp [ [ UV Ceti wp701499n ] [ PKS 0136]176 rp701407n ] [ ]012
16 TABLE 4ÈContinued b Time Pointing Pointing R.A. (J2000) Decl. (J2000) (deg) (s) Target (1) (2) (3) (4) (5) (6) rp300043n [ [ BL HYI rp ] [ Mrk 573 rp600005n [ [ NGC 720 wp ] [ NGC 752 wp [ [ [3158 wp300359n ] [ RX J0203.8]2959 rp ] [ TT Arietis rp700432n ] [ NAB 0205]024 rp700027a [ [ Q0207[398 rp800114n [ [ Arp 318 rp ]35 48 [0.0 [ ]35 rp900352n [ [ G192[67 wp ] [ MBM 7 rp800016n [ [ rp800482n ] [ CL 0231 rp120100n [ [ PSPC particle background rp700350n [ [ [042 rp300201n [ [ WW Hor rp701356n [ [ ESO 198[G24/ WW Hor rp600003n [ [ Fornax rp600520n [ [ NGC 1052 rp800508n ] [ S49[128 rp ] [ Mrk 372 rp701403n ] [ NGC 1144 wp ] [ MBM 12 wp800566n [ [ HCG 22 rp150052n [ [ EF Eri rp701036n [ [ The Marano Field rp600131n [ [ NGC 1291 wp800555n [ [ A 3112 rp600504n [ [ NGC 1313 rp700437n [ [ Fornax A wp800371n [ [ J1780 (5BL) rp800307n [ [ Field B-3 rp600006n [ [ NGC 1332 rp700099m ] [ H0323]022 rp800306n [ [ Field B-2 wp800367a [ [ J2175 (23C) wp [ [ EXO [ rp900495n [ [ QSF 1 wp900632n [ [ QSF 3 rp150082n [ [ QSF 3 rp200107m ] [ V471 Tau rp [ [ Field C-1 rp700271n [ [ [132 rp700825a ] [ ]121 rp800171n [ [ F 1557 rp900242n [ [ NGC 1535 wp201748n ] [ Hyades Ðeld G3 rp200912a ] [ Hyades C wp600623n [ [ NGC 1553/49 rp800089n [ [ A 483 wp600456n [ [ NGC 1566 rp200776n ] [ Hyades Ðeld F1 wp ] [ Hyades, position 1 rp200442n ] [ Hyades, position 2 rp201370a ] [ Hyades Ðeld F4 rp [ [ Q0420[388 rp200020n ] [ Hyades Ðeld d1 wp ] [ Hyades Ðeld F2 rp201369n ] [ Hyades Ðeld G1 wp ] [ Hyades Ðeld F3 rp800471n ] [ NGC 1588 rp200911a ] [ Hyades B rp200444n ] [ Hyades, position 4
17 TABLE 4ÈContinued b Time Pointing Pointing R.A. (J2000) Decl. (J2000) (deg) (s) Target (1) (2) (3) (4) (5) (6) wp [ [ MBM 20 wp201747n ] [ Hyades Ðeld G2 rp180042n [ [ PSR J0437[4715 rp200980n ] [ VLM Hyades 2 rp180069n [ [ SNR shell Voges rp [ [ PKS 0438[436 rp [ [ EDS-PSPC rp701021n [ [ NGC 1672 wp300221n [ [ RX J0453.4[4214 rp800229n [ [ MSS [0305 wp600436n [ [ NGC 1705 wp701557n ] [ MS 0459]0327 rp700826n ] [ ]019 rp700233n [ [ [286 rp600094n [ [ NGC 1808 rp200523n [ [ LHS 29 wp800368n [ [ J2001 (21C) rp ] [ AKN 120 rp300193a [ [ TV Columbae wp300130a [ [ RX J0529.4[5855 rp300334n [ [ RE 0531[461 rp400246n [ [ U 0532[664 rp300023n [ [ H0542[407 wp201245n [ [ K1-27 rp701359n [ [ A0557[383 rp [ [ U0601[49 rp701216n ] Markarian 3 wp201603n ] SV CAM rp700210n ] S5 0716]71 rp200450n ] NGC 2371[2 rp600536n ] NGC 2403 rp ] Mrk 78 wp180036n ] Unknown wp300388n ] RE 0751]14 rp180046n ] GRO J0752]1 rp ] ]37 rp600169n ] MK 86 wp600431n ] HOL II wp ] DX Cnc rp900349n ] G213]26 rp ] GBS 0839]37 rp200654n ] PI**1 UMa wp800370n ]17 54 [ F1767 (10TC) rp700546n ] E0845]378 rp ] Lynx.3A rp ] rp700887n ] ]140 rp900239n ] VLB rp701375n ] C 210 rp ] C212 rp ] B2 0902]343 rp900327a ] ZEL rp201382n ] XY UMa rp ] C216 wp ] S4 0917]62 wp ] NGC 2841 rp700882n ] wp ] Mrk 110 wp800557n ]34 18 [ HGR 24 wp ] I Zw 18 rp600207n ] UGC 5101 rp ] ]391 rp ] A851 wp701458n [ NGC 2992 wp701587n ] C
18 TABLE 4ÈContinued b Time Pointing Pointing R.A. (J2000) Decl. (J2000) (deg) (s) Target (1) (2) (3) (4) (5) (6) wp701554n ] PG 0946]301 rp701214n ] C73.08 rp701367n ] PG 0947]396 rp600514n ] M82-North wp800359n [ HCG 42 rp ] NGC 3079 wp [ [0755 rp600174n [ NGC 3109 rp300222n [ RX J1007.6[2017 wp ] Survey Ðeld 5 wp ] Survey Ðeld 4 wp ] Survey Ðeld 3 wp ] Survey Ðeld 4 wp ] Survey Ðeld 2 rp900215n ] Survey Ðeld 6 rp ] NGC 3184 wp900400a ] Lockman Spur A wp600575n ] NGC 3198 wp900528n ] HVC 1 rp700996n ] NGC 3227 rp700540n ] ]4724 wp800641n ] A998 wp900401a ] Lockman Spur B wp900529n ] HVC 2 rp800315n [ MKW 2 wp701544n ] RXJ 10313]5053 rp700461n [ HE 1029[1401 rp ] UMa Cloud 1 wp201243n [ PG 1034]001 rp800423n ] A1061 rp ] ]123 rp700883n ] ]31 rp201020n ] TX UMa wp800366a [ J1834 (5BC/8BL/22CR) rp700999a [ BJS 855 wp600280n ] NGC 3359 rp300158n ] EK UMa rp600261n ] Arp 270 wp300234a ] EK UMa wp900029a ] The Lockman Field rp900329n ] UMa 5 wp300291n ] ST LMI rp500157n ] G290.1[0.8 wp180019n [ Too HE 1104[18AB rp700872n ] NGC 3516 wp600464a [ NGC 3557 rp201019n [ TT Hya rp700855n ] ]408 rp600263n ] NGC 3607 rp ] ]080 rp600537n ] NGC 3623 wp ] ]215 rp ] NGC 3628 rp800646a ] Group 4 rp900383n ] M1-X2 wp800537n ] A 1228 wp ] ]39 wp600570n ] VII Zw 403 wp900384n ] M1-X3 rp700372n [ [041 rp ] UMa Cloud 2 rp900336n ] UMa 12 rp ] GD 140 rp ] UMa Cloud 3 rp701357n [ NGC
19 TABLE 4ÈContinued b Time Pointing Pointing R.A. (J2000) Decl. (J2000) (deg) (s) Target (1) (2) (3) (4) (5) (6) wp701201n ] MS ]3413 wp ] ]1033 rp600236n ] NGC 3921 wp300367n ]72 21 [ DO Dra wp300287n ] RE 1149]28 rp700833n ] ]245 rp600533n [ N3923 rp ] NGC 3998 wp [ MS [0323 wp600468a [ NGC 4038/9 wp ] NGC 4051 rp ] N79[299A rp201367m [ PG 1159[035 wp ] ]281 wp700557m ] NGC 4051 wp ] NGC 4151 rp600625n ] MS 1209]3917 wp800421n ] Group 1 rp ] NGC 4203 rp600189n ] NGC 4236 wp600417a ] NGC 4235 wp ] B2 1215]30 rp700970n ] Mrk 766 Ðeld wp ] MK 49 rp700425n ] NGC 4261 rp700864a ] C wp ] A 1218]304 wp ] ON 231 rp ] Mrk 205 wp ] COM 15 rp ] NGC 4365 wp600587n ] NGC 4410 rp600242a ] Giovanelli-Haynes CL wp ] Dra wp ] NGC 4490 rp ] TON 154 rp ] NGC 4565 rp600518n ] NGC 4526 rp300194n ] AM CVN rp600595a ] NGC 4559 wp600415a ] NGC 4565 rp ] QNY 1 wp600437a ] NGC 4569 rp600258n [ NGC 4594 wp701524n ] ]3520 rp600129a ] NGC 4631 rp ] NGC 4649 wp ] C 275.1/NGC 4651 wp ] NGC 4656 rp600532n [ NGC 4666 rp800324a [ Centaurus Cluster ST rp600262a [ NGC 4697 rp700375n [ Q1246[0542 wp ] NGC 4725/NGC 4747 rp300093n [ EX Hydrae wp800393a ] C rp201514n ] LOTR 5 wp ] Mrk 231 rp ] C280 rp800374n [ Abell 3535 wp ] NGC 4861 rp800384n [ A 3537 wp300394n ] RE 1307]535 wp ] B2 1308]32 rp [ Q1309[
20 TABLE 4ÈContinued b Time Pointing Pointing R.A. (J2000) Decl. (J2000) (deg) (s) Target (1) (2) (3) (4) (5) (6) wp [ RX J1313.3[3259 wp ] NGC 5055 rp100308n ] WFC Main Grid HZ 43 rp900325n ] G107]71 wp800556n ] HGR 23 rp800238n ] CL 1322 wp [ [3809 wp600458n ] NGC 5204 rp ] Abell 1758 wp ] Deep Survey rp600534n [ NGC 5253 rp300285n ] UX UMa wp ] CFHT Ðeld A/2 rp701000a [ BJS 864 rp800369a [ J1836 (3CR/23T) rp700922n ] Mrk 273 rp ] PG 1346]082 rp800637n [ HCG 67 rp600270n ] NGC 5322 wp701500n [ PKS 1351[018 rp ] Mrk 463 rp201037n ] ZZ Boo rp800109n ] CL 1358]62 wp ] ]226 rp ] CR 294 rp ] ]286 wp400134n ] GRB wp ] ]442 wp ] NGC 5529 rp ] Q1413]1143 rp800401a ] C23.37 wp ] NGC 5548 rp ] C 298 wp ] OQ 530 wp800528n [ Shakhbazian GRO. 328 wp ] LHS 2924 wp ] Mark 474/NGC 5682 rp701002n ] ]101 rp800518n ] Abell 1991 wp201536n ] Beta Boo rp170001n ] Calibration Source wp ] Mrk 841 rp600119n ] NGC 5866 rp200905n ] SS Bootis rp200965n ] PG 1513]442 wp600585n ] NGC 5905 wp ] NGC 5907 rp ] U Crb rp701001n ] ]101 rp701405n ] NGC 5929 rp701411n ] Arp 220 rp700897n [ CGCG 022[021 rp800511n ] A2125 rp201006n [ LHS 54 rp701373n ] C 324 wp ] C326 wp701526n ] ]6359 rp200459n [ HR 5942 rp ] GC 1556]335 rp800103n ] ]417 rp ] CL 1603 wp600588n ] Mrk 297 rp300021n ] MS ]2600 wp600421n ] ]6831 wp900381n ] HVC 1 227
21 TABLE 4ÈContinued b Time Pointing Pointing R.A. (J2000) Decl. (J2000) (deg) (s) Target (1) (2) (3) (4) (5) (6) wp701589n ] C332 rp700213n ] E1615]061 wp ] Unknown rp ] NGC 6251 wp701552n ] RXJ 16331]4157 rp200721n ] CM Dra rp201446n ] GD 356 rp701409n ] ]173 rp900166n ] Draco Cloud wp ] Draco Nebula HVC Interf wp900586n ] IVC-A 3 wp900591n ] LVC 2 rp900494n ] Low-contrast cloud 1 rp900169n ] MBM 41 rp400374n ] Her X-1 wp800530n ] Abell 2241 wp701457n ] HS 1700]6416 rp701439n ] C 351 wp ] HI-Ðlament rp900493n ] High-contrast cloud 1 rp700875n ] Draco Survey Ðeld wp300387n ] V795 Her rp ] rp701080n ] ]481 wp ] C 356 wp ] RX J1726.2]7431 rp200522n ] HD rp180014n ] Too Q1746]624 wp701523n ] Mrk 507 wp ] Unknown rp100378n ] WFC background Nep S1 wp ] C 371 rp ] DQ Her wp ] GRB B rp300067a ] AM Her rp701415n [ [ IRAS 18325[5926 rp701020n [ [ ES 0103[G35 rp ] C rp201505n ] HD wp201597n [ [ PZ Tel rp300314n ] H1907]690 rp900338n [ [ [293 wp300272n [ [ RE 1938[46 rp701410n ] Q 1946]77 rp300232n [ [ V3885 SGR wp [ [ PKS 2005[489 wp800536n [ [ A 3698 rp201763n ] VW Cep (Phase 0.00) rp700547n [ [ E2034[228 wp300218n [ [ AE AQR wp201374a [ [ HD wp [ [ IC 5063 rp701025n [ [ [201 wp300389n [ [ RE 2107[05 rp201007n [ [ LHS 65 rp900133n [ [ PAVO Ðeld rp700006n ] [ PG 2112]059 wp201753a ] [ RE 2131]23 wp800336a [ [ UKRO[287[1 wp800573n [ [ MS [2353 rp800150a ] [ Hour Ðeld rp600512n [ [ NGC 7144 wp800419a [ [ Hickson 90 rp200559n [ [ wp [ [ MT Ðeld
22 BRIGHT SHARC SURVEY: CLUSTER CATALOG 229 TABLE 4ÈContinued b Time Pointing Pointing R.A. (J2000) Decl. (J2000) (deg) (s) Target (1) (2) (3) (4) (5) (6) rp600175n [ [ [2803 wp701191n [ [ RX J2213.0[1710 rp701390n [ [ Q2212[299 rp600235n [ [ NGC 7252 rp701018n [ [ C445 rp900337n [ [ [052 rp700873n [ [ NGC 7314 wp ] [ StephanÏs Quintet wp201723n [ [ GJ 866 rp800467n [ [ NGC 7358 wp [ [ TY PSA wp201552n ] [ Mu Peg wp800334n [ [ RX J2252.9[213 rp900339n ] [ ]158 wp701630n [ [ MR 2251[179 rp ] [ GRB rp600266n [ [ IC 1459 rp201282n ] [ Peg wp701204n [ [ MS [3712 rp ] [ NGC 7469 rp600177n [ [ [5144 wp701250n [ [ MCG wp201339n [ [ Gliese 887 rp900323n [ [ G026[67 rp100578n ] [ WFC SPEC/FLUX BPM wp600544n ] [ Mrk 316 rp400144n [ [ GRB rp800488n ] [ HCG 93 wp300220n [ [ RX J2316.1[0527 wp ] [ III Zw 102 wp ] [ HR 8905 wp701045a ] [ Arp 284 wp701205n [ [ MS [1511 wp701501n [ [ PKS 2351[154 wp600386n [ [ NGC 7793 wp800372a [ [ F1637 (23TL) NOTE.ÈUnits of right ascension are hours, minutes, and seconds, and units of declination are degrees, arcminutes, and arcseconds. APPENDIX B Table 5 shows the 178 ROSAT PSPC pointings excluded from the Bright SHARC Survey. TABLE 5 ROSAT PSPC POINTINGS EXCLUDED FROM THE BRIGHT SHARC SURVEY b Time Pointing Reject Pointing R.A. (J2000) Decl. (J2000) (deg) (s) Target Code (1) (2) (3) (4) (5) (6) (7) wp [ [ A 2744 X rp600107n [ [ NGC 55 O rp [ [ Tucanae M rp ] [ S And O wp ] [ M31 west pos. 1 O wp ] [ M31 east pos. 1 O rp800250n [ [ A85 X wp ] [ M31 east pos. 7 O wp ] [ M31 west pos. 6 O wp201327n ] NGC 188 O wp ] [ M31 east pos. 4 O
23 TABLE 5ÈContinued b Time Pointing Reject Pointing R.A. (J2000) Decl. (J2000) (deg) (s) Target Code (1) (2) (3) (4) (5) (6) (7) rp500249n [ [ SMC SNR 0045[733 M rp ] [ M31POS 1 O wp ] [ M31 west pos. 3 O rp600087a [ [ NGC 253 O wp [ [ SMC Region B M wp201094n [ [ CF Tuc M wp600453n [ [ SMC Region E M rp600025a [ [ NGC 300 O rp800251n [ [ A119 X wp [ [ SMC Region A M rp ] [ ]26 X rp800319n [ [ A133 X rp500250n [ [ SMC SNR 0103[726 M wp600452a [ [ SMC Region D M wp ] [ NGC 383 X rp800276n [ [ DC 0107[46 X rp600197n [ [ SMC Region C M rp400022n [ [ SMCX-1 M rp600254a ] [ NGC 507 X rp600541n ] [ NGC 533 X rp [ [ A194 X rp ] [ M33 O rp800507n ] [ S49[140 X rp900250a [ [ Magellanic Bridge M rp900251n [ [ Magellanic Bridge M rp800226n ] [ Abell 400 X rp600127n [ [ NGC 1380 X rp600133n [ [ NGC 1395 X rp600043n [ [ N1399 X wp ] [ A0335]096 X rp600163n [ [ NGC 1407 X rp ] [ Pleiades NW O rp ] [ Pleiades Ðeld d1 O rp ] [ Pleiades Center O rp ] [ Pleiades NE O wp ] [ Abell 478 X wp800552n [ [ A 3266 X rp [ [ Abell 500 X rp [ [ Mu Eri O rp [ [ Abell 514 X rp800086n [ [ F1652 X rp500263n [ [ N9 M rp500258n [ [ N86 M rp900320n [ [ N11 M rp200921n [ [ HD M rp600098n [ [ Region C M rp [ [ Lambda Eridani O wp [ [ DEM 105 M rp400080n [ [ [40 O rp400263a [ [ LMC X-2 M wp600578n [ [ Region E M rp500138a [ [ N144 M rp200692n [ [ LMC X-4 and AB DOR M rp800523n [ [ A545 X rp500100a [ [ SN 1987A X wp [ [ Region F M rp300335n [ [ New S. Soft Srcs M rp500131n [ [ N157 M rp800246n [ [ A548S X rp400012n [ [ CAL 87 M rp800463n [ [ A548 N X rp100406n [ [ WFC Background Sep S1 M rp800154n [ [ SC 0559[40 X wp [ [ HR 2550 O 230
24 TABLE 5ÈContinued b Time Pointing Reject Pointing R.A. (J2000) Decl. (J2000) (deg) (s) Target Code (1) (2) (3) (4) (5) (6) (7) wp ] YY Gem O rp600542n ] NGC 2563 X rp ] Abell 665 X wp ] CV in M67 O rp201326n ] M 67 O rp600451n [ G0905[098 X rp800318n [ Hydra A X wp600547n ] NGC 2832 X rp180015n ] M81 O rp600382n ] M81 O wp180035n ] Unknown O wp600576n ] M81/M82 group X wp ] M82 X wp800572n ] A959 X rp ] AD Leo O rp800491n ] R1022.1]3831 X rp800200n [ Abell 1060 X rp800135n [ TOL 1037[271 X wp800410n ] Abell 1068 X wp ] Delta Leo O rp600223a [ MS [3754 X rp ] A1367 X rp100366n ] WFC UV Leak B. Leo O rp ] MKW 4 X rp600519n ] NGC 5838 X wp600444n ] NGC 4104 X wp600546n ] NGC 4258 O rp701404n ] NGC 4388 X wp ] NGC 4406 X rp600248n ] NGC 4472 X wp ] M 87 X wp600586n ] NGC 4552 X rp800522n ] A1576 X rp ] NGC 4636 X rp800322n [ Centaurus Cluster WE X rp800323n [ Centaurus Cluster NR X rp800321a [ Centaurus Cluster EA X wp [ Hickson 62 X rp ] Coma 5 X rp ] Coma 2 X rp ] Coma 1 X rp ] Coma 9 X wp [ Abell 1664 X rp800295n ] Abell 1691 X rp [ A1689 X rp [ WP 23 X rp800375n [ Abell 3556 X wp800416a [ Shapley 8 (O set) X rp800076n [ A3558 X rp600158n ] N5194/N5195 O wp800553n [ A 1750 X rp800237n [ A3562 X rp800252n ] A1763 X rp600268a [ IC 4296 X wp600188a [ M83 O rp300333a ] NGC 5272 O wp ] E1346]26 X rp ] Abell 1795 X rp ] Abell 1795 X rp800485n ] HCG 68 X rp [ A1837 X wp ] M101 O rp150018n ] Alpha Bootis O rp800518a ] Abell 1991 X 231
25 TABLE 5ÈContinued b Time Pointing Reject Pointing R.A. (J2000) Decl. (J2000) (deg) (s) Target Code (1) (2) (3) (4) (5) (6) (7) rp200510n [ Delta Lib X rp800249n ] A2029 X wp ] A2063 X wp201558n ] HR 5793 O rp900170n [ MBM 37 O wp ] Abell 2142 (O set) X rp800129n ] AWM 4 X rp800517n ] A2151 X wp ] A 2197 X wp800644n ] A2199 X rp800413n ] Abell 2208 X wp ] A2218 X wp800571n ] A2219 X rp ] NGC 6205 O wp900590n ] LVC 1 X wp600583n ] NGC 6269 X wp ] A2256 Region 4 X rp800163n ] A2256 Region 2 X wp ] XRT/PSPC Spec/FL A X rp800512n ] A2255 X wp600582n ] NGC 6329 X rp300180n ] NGC 6341 O rp201066n ] Gamma Draconis O rp200941n [ [ HR 7012 O rp800256n [ [ SC 1842[63 X wp400302n [ [ NGC 6809 O rp800234n [ [ A3667 X rp800227a [ [ Abell 2382 X wp800570n ] [ A2390 X wp800344n ] [ A 2397 X wp800378n [ [ A 3921 X wp800397n [ [ Sersic 159[03 X wp800568n ] [ HCG 94 X rp ] [ Pegasus I Cluster X rp800014a ] [ Abell 2634 X wp800333a [ [ RX J2344.3[042 X rp ] [ A2657 X wp [ [ HCG 97 X rp800420n [ [ A2670 X NOTES.ÈUnits of right ascension are hours, minutes, and seconds, and units of declination are degrees, arcminutes, and arcseconds. (X) An extended X-ray source covers most of the Ðeld of view. (O) An extended optical source covers most of the Ðeld of view. (M) The pointing is close (\6 ) to the Magellanic clouds.


![Each image is 400@@ ] 400@@ in size. FIG. 4. FIG. 5.](/docs-images/85/91340577/images/26-2.jpg "FIG. 6. FIG. 7. Figs.")

26 BRIGHT SHARC SURVEY: CLUSTER CATALOG 233 APPENDIX C Figures 4È97 show the Digitized Sky Survey images of the 94 bright SHARC extended sources, with wavelet source boundaries overlaid. Each image is 400@@ ] 400@@ in size. FIG. 4. FIG. 5. FIG. 6. FIG. 7. Figs. 4È97 show the Digitized Sky Survey images of the 94 bright SHARC extended sources, with wavelet source boundaries overlaid. Each image is 400@@ ] 400@@ in size.


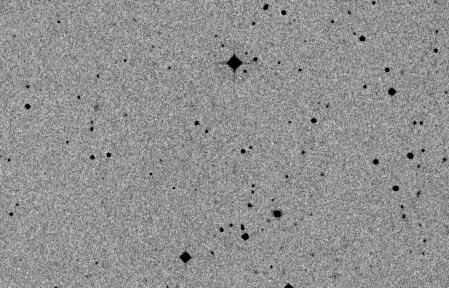
27 FIG. 8. FIG. 9. FIG. 10. FIG


28 FIG. 12. FIG. 13. FIG. 14. FIG


29 FIG. 16. FIG. 17. FIG. 18. FIG


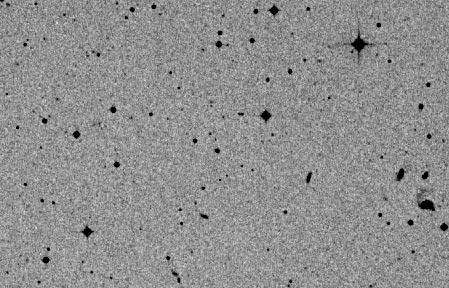
30 FIG. 20. FIG. 21. FIG. 22. FIG


31 FIG. 24. FIG. 25. FIG. 26. FIG


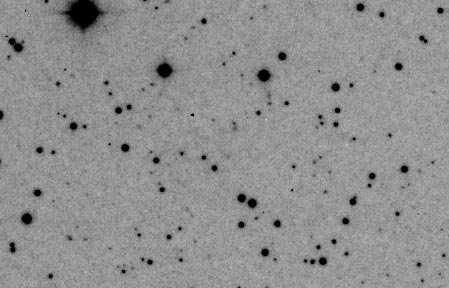
32 FIG. 28. FIG. 29. FIG. 30. FIG


33 FIG. 32. FIG. 33. FIG. 34. FIG


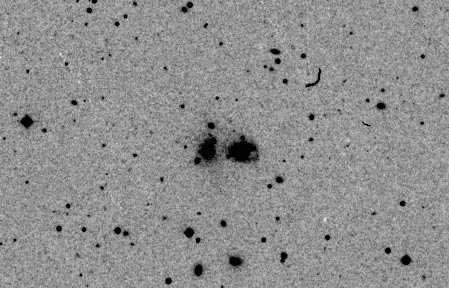
34 FIG. 36. FIG. 37. FIG. 38. FIG


35 FIG. 40. FIG. 41. FIG. 42. FIG


36 FIG. 44. FIG. 45. FIG. 46. FIG


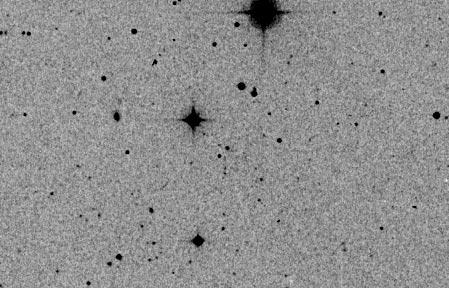
37 FIG. 48. FIG. 49. FIG. 50. FIG


38 FIG. 52. FIG. 53. FIG. 54. FIG


39 FIG. 56. FIG. 57. FIG. 58. FIG


40 FIG. 60. FIG. 61. FIG. 62. FIG


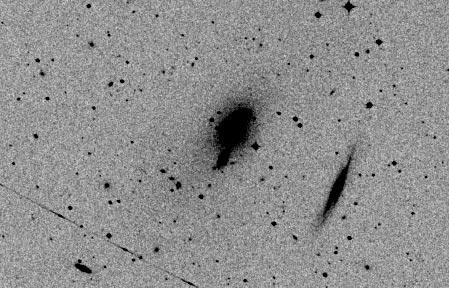
41 FIG. 64. FIG. 65. FIG. 66. FIG


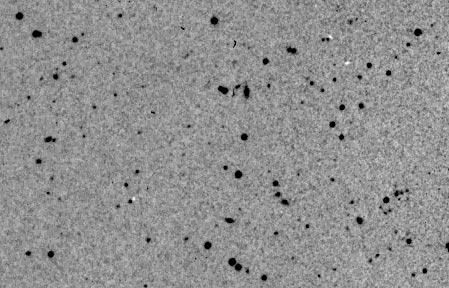
42 FIG. 68. FIG. 69. FIG. 70. FIG


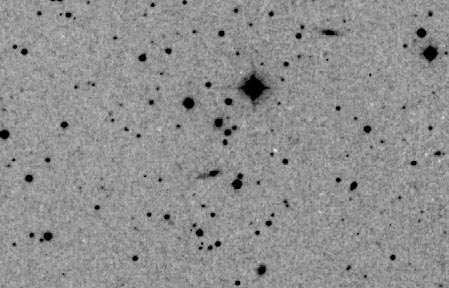
43 FIG. 72. FIG. 73. FIG. 74. FIG


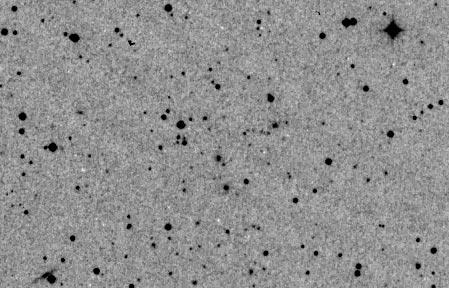
44 FIG. 76. FIG. 77. FIG. 78. FIG


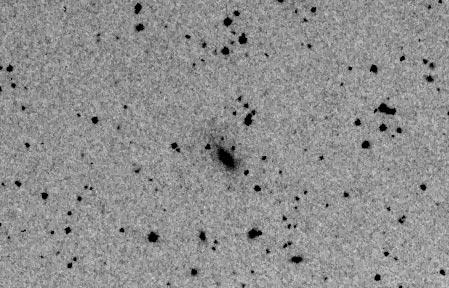
45 FIG. 80. FIG. 81. FIG. 82. FIG


46 FIG. 84. FIG. 85. FIG. 86. FIG


47 FIG. 88. FIG. 89. FIG. 90. FIG


48 FIG. 92. FIG. 93. FIG. 94. FIG

![cr, for Bright SHARC clusters. T Each image is 120 ] 120 pixels, with a pixel scale of 14A.947. FIG.](/docs-images/85/91340577/images/49-1.jpg "98. FIG. 99. Figs.")

49 256 ROMER ET AL. FIG. 96. FIG. 97. APPENDIX D Figures 98È134 show the source and background apertures used to deðne total count rates, cr, for Bright SHARC clusters. T Each image is 120 ] 120 pixels, with a pixel scale of 14A.947. FIG. 98. FIG. 99. Figs. 98È134 show the source (light gray plus black) and background (dark gray) apertures used to deðne total count rates, cr, for Bright SHARC clusters. Masked out pixels are shown in white. N.B.: The central black region represents the aperture used to deðne the wavelet count T rates, cr. Each image is 120 ] 120 pixels, with a pixel scale of 14A.947. W

50 FIG FIG FIG FIG FIG FIG. 105.


51 FIG FIG FIG FIG FIG FIG


52 FIG FIG FIG FIG FIG FIG


53 FIG FIG FIG FIG FIG FIG
54 FIG FIG FIG FIG FIG FIG


55 FIG FIG FIG FIG FIG. 134.
Simulations Applied to the Bright SHARC XCLF: Results and Implications
 The Evolution of Galaxies on Cosmological Timescales ASP Conference Series, Vol. 3 10 8, 1999 J. E. Beckman, and T. J. Mahoney, eds. Simulations Applied to the Bright SHARC XCLF: Results and Implications
NEW X-RAY CLUSTERS IN THE EINST EIN EXTENDED MEDIUM-SENSITIVITY SURVEY. I. MODIFICATIONS TO THE X-RAY LUMINOSITY FUNCTION
 THE ASTROPHYSICAL JOURNAL, 566:744È770, 2002 February 20 ( 2002. The American Astronomical Society. All rights reserved. Printed in U.S.A. NEW X-RAY CLUSTERS IN THE EINST EIN EXTENDED MEDIUM-SENSITIVITY
The Southern SHARC catalogue: a ROSAT survey for distant galaxy clusters
 Mon. Not. R. Astron. Soc. 341, 1093 1108 (2003) The Southern SHARC catalogue: a ROSAT survey for distant galaxy clusters D. J. Burke, 1 C. A. Collins, 2 R. M. Sharples, 3 A. K. Romer 4 and R. C. Nichol
arxiv:astro-ph/ v1 6 Dec 1999
 RESULTS FROM X-RAY SURVEYS WITH ASCA arxiv:astro-ph/9912084v1 6 Dec 1999 Yoshihiro Ueda Institute of Space and Astronautical Science, Kanagawa 229-8510, Japan ABSTRACT We present main results from X-ray
arxiv:astro-ph/ v1 6 Sep 2000
 MACS: A quest for the most massive galaxy clusters in the universe H. Ebeling 1, A.C. Edge 2, J.P. Henry 1 arxiv:astro-ph/0009101v1 6 Sep 2000 Received ; accepted submitted to ApJ on Sep 6, 2000 1 Institute
1. INTRODUCTION 2. SOURCE SELECTION
 THE ASTROPHYSICAL JOURNAL SUPPLEMENT SERIES, 124:285È381, 1999 October ( 1999. The American Astronomical Society. All rights reserved. Printed in U.S.A. VLA IMAGES AT 5 GHz OF 212 SOUTHERN EXTRAGALACTIC
STUDIES OF SELECTED VOIDS. SURFACE PHOTOMETRY OF FAINT GALAXIES IN THE DIRECTION OF IN HERCULES VOID
 STUDIES OF SELECTED VOIDS. SURFACE PHOTOMETRY OF FAINT GALAXIES IN THE DIRECTION OF 1600+18 IN HERCULES VOID G.Petrov [1], A.Y.Kniazev [2], and J.W. Fried [2] 1 Institute of Astronomy, Bulgarian Academy
arxiv:astro-ph/ v1 6 Jun 2001
 arxiv:astro-ph/0106098v1 6 Jun 2001 THE XMM NEWTON Ω PROJECT J.G. BARTLETT 1,2, N. AGHANIM 3, M. ARNAUD 4, J. PH. BERNARD 3, A. BLANCHARD 1, M. BOER 5, D.J. BURKE 6, C.A. COLLINS 7, M. GIARD 5, D.H. LUMB
Chandra Observation of Point Sources in the X-Ray Elliptical Galaxy NGC 1407
 Chin. J. Astron. Astrophys. Vol. 4 (2004), No. 3, 221 230 ( http: /www.chjaa.org or http: /chjaa.bao.ac.cn ) Chinese Journal of Astronomy and Astrophysics Chandra Observation of Point Sources in the X-Ray
Hubble s Law and the Cosmic Distance Scale
 Lab 7 Hubble s Law and the Cosmic Distance Scale 7.1 Overview Exercise seven is our first extragalactic exercise, highlighting the immense scale of the Universe. It addresses the challenge of determining
ROSAT Roentgen Satellite. Chandra X-ray Observatory
 ROSAT Roentgen Satellite Joint facility: US, Germany, UK Operated 1990 1999 All-sky survey + pointed observations Chandra X-ray Observatory US Mission Operating 1999 present Pointed observations How do
arxiv:astro-ph/ v1 10 Nov 1999
 Clustering at High Redshift ASP Conference Series, Vol., 1999 A. Mazure and O. Le Fevre, eds. Weak Lensing Observations of High-Redshift Clusters of Galaxies arxiv:astro-ph/9911169v1 10 Nov 1999 D. Clowe
arxiv:astro-ph/ v1 6 May 2004
 XMM-NEWTON OBSERVATIONS OF THREE HIGH REDSHIFT RADIO GALAXIES arxiv:astro-ph/0405116 v1 6 May 2004 Abstract E. Belsole, D.M. Worrall, M. J. Hardcastle Department of Physics - University of Bristol Tyndall
Chandra Analysis of a Possible Cooling Core Galaxy Cluster at z = 1.03
 Chandra Analysis of a Possible Cooling Core Galaxy Cluster at z = 1.03 Kyle Dolan Institute for Astronomy, University of Hawaii at Manoa (Dated: 12 August 2005) We present an analysis of Chandra observations
The Bright Side of the X-ray Sky The XMM-Newton Bright Survey. R. Della Ceca. INAF Osservatorio Astronomico di Brera,Milan
 The Bright Side of the X-ray Sky The XMM-Newton Bright Survey T. Maccacaro A. Caccianiga P. Severgnini V. Braito R. Della Ceca INAF Osservatorio Astronomico di Brera,Milan On behalf of the XMM-Newton Survey
Photometric Studies of GEO Debris
 Photometric Studies of GEO Debris Patrick Seitzer Department of Astronomy, University of Michigan 500 Church St. 818 Dennison Bldg, Ann Arbor, MI 48109 pseitzer@umich.edu Heather M. Cowardin ESCG/Jacobs
Quasars around the Seyfert Galaxy NGC3516
 Quasars around the Seyfert Galaxy NGC3516 Yaoquan Chu Center for Astrophysics, University of Science and Technology of China, Hefei, Anhui 230026, China arxiv:astro-ph/9712021v1 2 Dec 1997 Jianyan Wei
X-ray and optical observations of three clusters of galaxies: Abell 901, Abell 1437, and Abell 3570
 ASTRONOMY & ASTROPHYSICS MARCH II 2000, PAGE 433 SUPPLEMENT SERIES Astron. Astrophys. Suppl. Ser. 142, 433 441 (2000) X-ray and optical observations of three clusters of galaxies: Abell 901, Abell 1437,
Extraction of Point Source Spectra from STIS Long Slit Data
 1997 HST Calibration Workshop Space Telescope Science Institute, 1997 S. Casertano, et al., eds. Extraction of Point Source Spectra from STIS Long Slit Data J. R. Walsh Spect Telescope European Coordinating
A Library of the X-ray Universe: Generating the XMM-Newton Source Catalogues
 A Library of the X-ray Universe: Generating the XMM-Newton Source Catalogues Iris Traulsen Axel Schwope, Georg Lamer Leibniz-Institut für Astrophysik Potsdam (AIP) on behalf of the XMM-Newton Survey Science
The Hamburg/RASS Catalogue of Optical Identifications of ROSAT-BSC X-ray Sources
 The Hamburg/RASS Catalogue of Optical Identifications of ROSAT-BSC X-ray Sources F.-J. Zickgraf 1, D. Engels 1, H.-J. Hagen 1, D. Reimers 1, W. Voges 2 1 Hamburger Sternwarte 2 Max-Planck-Institut für
the kinematics of these clusters and presented evidence for peculiar cd velocities. Observations and analysis of A2107
 THE ASTRONOMICAL JOURNAL, 116:1529È1540, 1998 October ( 1998. The American Astronomical Society. All rights reserved. Printed in U.S.A. DYNAMICS OF cd CLUSTERS OF GALAXIES. III. REDSHIFT DATA FOR 11 ABELL
D4.2. First release of on-line science-oriented tutorials
 EuroVO-AIDA Euro-VO Astronomical Infrastructure for Data Access D4.2 First release of on-line science-oriented tutorials Final version Grant agreement no: 212104 Combination of Collaborative Projects &
Modern Image Processing Techniques in Astronomical Sky Surveys
 Modern Image Processing Techniques in Astronomical Sky Surveys Items of the PhD thesis József Varga Astronomy MSc Eötvös Loránd University, Faculty of Science PhD School of Physics, Programme of Particle
Results from the Chandra Deep Field North
 Results from the Chandra Deep Field North Brandt, Alexander, Bauer, Garmire, Hornschemeier, Immler, Lehmer, Schneider, Vignali, Wu, Barger, Cowie, Bautz, Nousek, Sargent, Townsley Chandra Deep Field North
The H II Regions of M33. II. A Photometric Catalog of 1272 Newly IdentiÐed Emission Regions
 PUBLICATIONS OF THE ASTRONOMICAL SOCIETY OF THE PACIFIC, 111:685È690, 1999 June ( 1999. The Astronomical Society of the PaciÐc. All rights reserved. Printed in U.S.A. The H II Regions of M33. II. A Photometric
Physics Lab #9: Measuring the Hubble Constant
 Physics 10263 Lab #9: Measuring the Hubble Constant Introduction In the 1920 s, Edwin Hubble discovered a relationship that is now known as Hubble s Law. It states that the recession velocity of a galaxy
A Random Walk Through Astrometry
 A Random Walk Through Astrometry Astrometry: The Second Oldest Profession George H. Kaplan Astronomical Applications Department Astrometry Department U.S. Naval Observatory Random Topics to be Covered
Automated Search for Lyman Alpha Emitters in the DEEP3 Galaxy Redshift Survey
 Automated Search for Lyman Alpha Emitters in the DEEP3 Galaxy Redshift Survey Victoria Dean Castilleja School Automated Search for Lyman-alpha Emitters in the DEEP3 Galaxy Redshift Survey Abstract This
Overview of comparison data presented
 SUPPLEMENTARY INFORMATION doi:10.1038/nature09452 Overview of comparison data presented In Figure 2, we compare our results with four other data sets chosen to reflect much of the universe in which galaxy
G. M. BERNSTEIN Department of Astronomy, University of Michigan, 830 Dennison Building, Ann Arbor, MI 48109
 THE ASTRONOMICAL JOURNAL, 115:1377È1382, 1998 April ( 1998. The American Astronomical Society. All rights reserved. Printed in U.S.A. THE GRAVITATIONAL LENS MG 0414]0534: A LINK BETWEEN RED GALAXIES AND
arxiv: v3 [astro-ph.co] 24 Jun 2010
![arxiv: v3 [astro-ph.co] 24 Jun 2010](/thumbs/88/117888134.jpg "arxiv: v3 [astro-ph.co] 24 Jun 2010") Mon. Not. R. Astron. Soc. 000, 1 25 (2010) Printed 10 October 2018 (MN LATEX style file v2.2) The Observed Growth of Massive Galaxy Clusters II: X-ray Scaling Relations arxiv:0909.3099v3 [astro-ph.co]
Mon. Not. R. Astron. Soc. 000, 1 25 (2010) Printed 10 October 2018 (MN LATEX style file v2.2) The Observed Growth of Massive Galaxy Clusters II: X-ray Scaling Relations arxiv:0909.3099v3 [astro-ph.co]
SUPPLEMENTARY INFORMATION
 doi:10.1038/nature11096 Spectroscopic redshifts of CDF-N X-ray sources We have taken a recent compilation 13 as our main source of spectroscopic redshifts. These redshifts are given to two decimal places,
PHY 475/375. Lecture 2. (March 28, 2012) The Scale of the Universe: The Shapley-Curtis Debate
 The Scale of the Universe: The Shapley-Curtis Debate") PHY 475/375 Lecture 2 (March 28, 2012) The Scale of the Universe: The Shapley-Curtis Debate By the 1920 s a debate had developed over whether some of the spiral nebulae catalogued in the 18th century by
PHY 475/375 Lecture 2 (March 28, 2012) The Scale of the Universe: The Shapley-Curtis Debate By the 1920 s a debate had developed over whether some of the spiral nebulae catalogued in the 18th century by
Science in the Virtual Observatory
 Mem. S.A.It. Vol. 80, 352 c SAIt 2009 Memorie della Science in the Virtual Observatory M.G. Allen Observatoire de Strasbourg UMR 7550 11 Rue de l Universite, F-67000 Strasbourg, France e-mail: allen@astro.u-strasbg.fr
Quasars in the SDSS. Rich Kron NGC June 2006 START CI-Team: Variable Quasars Research Workshop Yerkes Observatory
 Quasars in the SDSS Rich Kron 28 June 2006 START CI-Team: Variable Quasars Research Workshop Yerkes Observatory NGC 1068 About 10% of all of the spectra in the SDSS database are of quasars (as opposed
Quasar Selection from Combined Radio and Optical Surveys using Neural Networks
 Quasar Selection from Combined Radio and Optical Surveys using Neural Networks Ruth Carballo and Antonio Santiago Cofiño Dpto. de Matemática Aplicada y C. Computación. Universidad de Cantabria, Avda de
New Extended Radio Sources From the NVSS
 Astrophysical Bulletin,, vol. 7, No. July, 7 Translated from Astrofizicheskij Byulleten,, vol.7, No., pp. 7- New Extended Radio Sources From the NVSS V.R. Amirkhanyan, V.L. Afanasiev and A. V. Moiseev
Active Galactic Nuclei OIII
 Active Galactic Nuclei In 1908, Edward Fath (1880-1959) observed NGC 1068 with his spectroscope, which displayed odd (and very strong) emission lines. In 1926 Hubble recorded emission lines of this and
1 Lecture, 2 September 1999
 1 Lecture, 2 September 1999 1.1 Observational astronomy Virtually all of our knowledge of astronomical objects was gained by observation of their light. We know how to make many kinds of detailed measurements
arxiv:astro-ph/ v1 19 Nov 2001
 Mon. Not. R. Astron. Soc. 000, 1 5 (2001) Printed 1 February 2008 (MN LATEX style file v1.4) Evolution of Brightest Cluster Galaxies in X-Ray Clusters S. Brough, 1 C. A. Collins, 1 D. J. Burke, 2,3 R.
The Astronomical Journal, 127: , 2004 January # The American Astronomical Society. All rights reserved. Printed in U.S.A.
 The Astronomical Journal, 127:213 229, 2004 January # 2004. The American Astronomical Society. All rights reserved. Printed in U.S.A. A THE 172 ks CHANDRA EXPOSURE OF THE LALA BOOTES FIELD: X-RAY SOURCE
The cosmic distance scale
 The cosmic distance scale Distance information is often crucial to understand the physics of astrophysical objects. This requires knowing the basic properties of such an object, like its size, its environment,
Received 1998 January 16; revised 1998 March 12
 THE ASTRONOMICAL JOURNAL, 116:414È423, 1998 July ( 1998. The American Astronomical Society. All rights reserved. Printed in U.S.A. ROSAT AND HIPPARCOS OBSERVATIONS OF ISOLATED PREÈMAIN-SEQUENCE STARS NEAR
The PLANCK Cluster Catalog:
 The PLANCK Cluster Catalog: SZ/X-ray Expected Properties Antoine Chamballu James G. Bartlett Jean-Baptiste Melin in the framework of the Planck consortium The Planck mission Background Successfully launched
Clusters of Galaxies " High Energy Objects - most of the baryons are in a hot (kt~ k) gas." The x-ray luminosity is ergs/sec"
 gas. The x-ray luminosity is ergs/sec") Clusters of Galaxies! Ch 4 Longair Clusters of galaxies are the largest gravitationally bound systems in the Universe. At optical wavelengths they appear as over-densities of galaxies with respect to the
Clusters of Galaxies! Ch 4 Longair Clusters of galaxies are the largest gravitationally bound systems in the Universe. At optical wavelengths they appear as over-densities of galaxies with respect to the
ESO Phase 3 Data Release Description. Data Collection ATLASGAL Release Number 1 Data Provider
 ESO Phase 3 Data Release Description Data Collection ATLASGAL Release Number 1 Data Provider Frederic Schuller, K. Immer, Y. Contreras, T. Csengeri, J. S. Urquhart Date 19.01.2016 Abstract The APEX Telescope
A Cluster of Galaxies, Abell 496
 A Cluster of Galaxies, Abell 496 F. Nobels and W. Mulder MSc Astronomy & Kapteyn Astronomical Institute, University of Groningen (Dated: November 11, 2015) As part of the course High-Energy Astrophysics,
A Fast Algorithm for Cosmic Rays Removal from Single Images
 A Fast Algorithm for Cosmic Rays Removal from Single Images Wojtek Pych David Dunlap Observatory, University of Toronto P.O. Box 360, Richmond Hill, Ontario, Canada L4C 4Y6 and Copernicus Astronomical
Dark Energy: Measuring the Invisible with X-Ray Telescopes
 Black holes, Galactic Dark Center Matter and Galactic Center Dark Energy: Measuring the Invisible with X-Ray Telescopes Christine Jones Before 1930 -- only optical observations of the sky Intro Before
The Large Synoptic Survey Telescope
 The Large Synoptic Survey Telescope Philip A. Pinto Steward Observatory University of Arizona for the LSST Collaboration 17 May, 2006 NRAO, Socorro Large Synoptic Survey Telescope The need for a facility
Construction and Preliminary Application of the Variability Luminosity Estimator
 Construction and Preliminary Application of the Variability Luminosity Estimator arxiv:astro-ph/0103255v2 19 Mar 2001 Daniel E. Reichart 1,2 and Donald Q. Lamb 3 1 Department of Astronomy, California Institute
Radio-optical outliers a case study with ICRF2 and SDSS
 Radio-optical outliers a case study with ICRF2 and SDSS Sándor Frey FÖMI Satellite Geodetic Observatory & MTA Research Group for Physical Geodesy and Geodynamics (Budapest, Hungary) Gábor Orosz Department
Received 1999 August 16; accepted 2000 January 18
 THE ASTROPHYSICAL JOURNAL SUPPLEMENT SERIES, 129:563È610, 2000 August ( 2000. The American Astronomical Society. All rights reserved. Printed in U.S.A. THE HUBBL E SPACE T EL ESCOPE QUASAR ABSORPTION LINE
THE XMM-LSS CLUSTER SAMPLE AND ITS COSMOLOGICAL APPLICATIONS. M. Pierre, F. Pacaud 1 and the XMM-LSS consortium 2 ABSTRACT
 1 THE XMM-LSS CLUSTER SAMPLE AND ITS COSMOLOGICAL APPLICATIONS M. Pierre, F. Pacaud 1 and the XMM-LSS consortium 2 1 DAPNIA/SAp CEA Saclay, 91191 Gif sur Yvette, France 2 http://vela.astro.ulg.ac.be/themes/spatial/xmm/lss/cons
DETERMINATION OF STELLAR ROTATION WITH GAIA AND EFFECTS OF SPECTRAL MISMATCH. A. Gomboc 1,2, D. Katz 3
 537 DETERMINATION OF STELLAR ROTATION WITH GAIA AND EFFECTS OF SPECTRAL MISMATCH A. Gomboc,2, D. Katz 3 University in Ljubljana, Jadranska 9, 00 Ljubljana, Slovenia 2 ARI, Liverpool John Moores University,
arxiv:astro-ph/ v1 12 Jun 2000
 Astron. Nachr. 000 (0000) 0, 000 000 Compact Groups of Galaxies in the Las Campanas Redshift Survey S. S. Allam, Helwan, Cairo, Egypt National Research Institute of Astronomy and Geophysics D. L. Tucker,
Discovery of TeV Gamma-ray Emission Towards Supernova Remnant SNR G Last Updated Tuesday, 30 July :01
 Background-subtracted gamma-ray count map of SNR G78.2+2.1 showing the VERITAS detection (VER2019+407). For details, see Figure 1 below. Reference: E. Aliu et al. (The VERITAS Collaboration), Astrophysical
An AGN sample with high X-ray-to-optical flux ratio from RASS
 ASTRONOMY & ASTROPHYSICS NOVEMBER I 1999, PAGE 575 SUPPLEMENT SERIES Astron. Astrophys. Suppl. Ser. 139, 575 599 (1999) An AGN sample with high X-ray-to-optical flux ratio from RASS I. The optical identification
arxiv:astro-ph/ v1 6 Mar 2006
 Studying the Nature of Dark Energy with Galaxy Clusters Thomas H. Reiprich 1, Daniel S. Hudson 1, Thomas Erben 1, and Craig L. Sarazin 2 arxiv:astro-ph/0603129v1 6 Mar 2006 1 Argelander-Institut für Astronomie,
Sébastien C. VAUCLAIR, OMP, Toulouse
 XMM-Newton Ω-Project Ω matter from cluster evolution Collaborators : Sébastien C. VAUCLAIR, OMP, Toulouse J.G. Bartlett (PI) J.P. Bernard A. Blanchard M. Boer D.J. Burke* C.A. Collins* M. Giard D.H. Lumb
FIGURE 1. The total kev logn-logs determined from several ROSAT surveys as indicated in the plot. Adapted from Hasinger et al.
 X-RAY SURVEYS P. Giommi 1,F.Fiore 1,2,3 and M. Perri 1 1) BeppoSAX Science Data Center, Rome, Italy 2) Osservatorio Astronomico di Roma, Monteporzio, Italy 3) Smithsonian Astrophysical Observatory, 60
Hubble Science Briefing: 25 Years of Seeing Stars with the Hubble Space Telescope. March 5, 2015 Dr. Rachel Osten Dr. Alex Fullerton Dr.
 Hubble Science Briefing: 25 Years of Seeing Stars with the Hubble Space Telescope March 5, 2015 Dr. Rachel Osten Dr. Alex Fullerton Dr. Jay Anderson Hubble s Insight into the Lives of Stars Comes From:
Rick Ebert & Joseph Mazzarella For the NED Team. Big Data Task Force NASA, Ames Research Center 2016 September 28-30
 NED Mission: Provide a comprehensive, reliable and easy-to-use synthesis of multi-wavelength data from NASA missions, published catalogs, and the refereed literature, to enhance and enable astrophysical
GLOBAL PROPERTIES OF THE GLOBULAR CLUSTER SYSTEMS OF FOUR SPIRAL GALAXIES
 The Astronomical Journal, 134:1403 1418, 2007 October # 2007. The American Astronomical Society. All rights reserved. Printed in U.S.A. GLOBAL PROPERTIES OF THE GLOBULAR CLUSTER SYSTEMS OF FOUR SPIRAL
THE ABSOLUTE DIMENSIONS OF THE OVERCONTACT BINARY FI BOOTIS
 The Astronomical Journal, 132:1153Y1157, 2006 September # 2006. The American Astronomical Society. All rights reserved. Printed in U.S.A. A THE ABSOLUTE DIMENSIONS OF THE OVERCONTACT BINARY FI BOOTIS Dirk
NuSTAR observation of the Arches cluster: X-ray spectrum extraction from a 2D image
 NuSTAR observation of the Arches cluster: X-ray spectrum extraction from a 2D image Space Research Institute (IKI), Moscow, Russia E-mail: krivonos@iki.rssi.ru The NuSTAR mission performed a long (200
Analysis of extended sources with the EPIC cameras
 Analysis of extended sources with the EPIC cameras 7 th ESAC SAS Workshop June 19 22, 2007 Science Operations Centre 1 Status Analysis of extended sources is complex, challenging and time-consuming There
Astronomy 114. Lecture 27: The Galaxy. Martin D. Weinberg. UMass/Astronomy Department
 Astronomy 114 Lecture 27: The Galaxy Martin D. Weinberg weinberg@astro.umass.edu UMass/Astronomy Department A114: Lecture 27 18 Apr 2007 Read: Ch. 25,26 Astronomy 114 1/23 Announcements Quiz #2: we re
Introduction to the Sloan Survey
 Introduction to the Sloan Survey Title Rita Sinha IUCAA SDSS The SDSS uses a dedicated, 2.5-meter telescope on Apache Point, NM, equipped with two powerful special-purpose instruments. The 120-megapixel
1. INTRODUCTION. Received 2003 March 12; accepted 2003 May 28. Ann Arbor, MI Fermi National Accelerator Laboratory, P.O.
 The Astrophysical Journal Supplement Series, 148:243 274, 2003 October # 2003. The American Astronomical Society. All rights reserved. Printed in U.S.A. E A MERGED CATALOG OF CLUSTERS OF GALAXIES FROM
Ca II Absorbers in the Sloan Digital Sky Survey Data Release 9
 Ca II Absorbers in the Sloan Digital Sky Survey Data Release 9 Gendith Sardane Department of Physics & Astronomy PITTsburgh Particle Physics Astrophysics and Cosmology Center University of Pittsburgh,
Physics of Galaxies 2016 Exercises with solutions batch I
 Physics of Galaxies 2016 Exercises with solutions batch I 1. Distance and brightness at low redshift You discover an interesting galaxy in the local Universe and measure its redshift to be z 0.053 and
Study of the arrival directions of ultra-high-energy cosmic rays detected by the Pierre Auger Observatory
 Study of the arrival directions of ultra-high-energy cosmic rays detected by the Pierre Auger Observatory Piera L. Ghia*, for the Pierre Auger Collaboration * IFSI/INAF Torino, Italy, & IPN/CNRS Orsay,
The HII Regions of Sextans A
 Publications of the Astronomical Society of the Pacific 6: 765-769, 1994 July The HII Regions of Sextans A Paul Hodge 1 Astronomy Department, University of Washington, Seattle, Washington 98195 Electronic
Journal Club Presentation on The BIMA Survey of Nearby Galaxies. I. The Radial Distribution of CO Emission in Spiral Galaxies by Regan et al.
 Journal Club Presentation on The BIMA Survey of Nearby Galaxies. I. The Radial Distribution of CO Emission in Spiral Galaxies by Regan et al. ApJ, 561:218-237, 2001 Nov 1 1 Fun With Acronyms BIMA Berkely
Field Selection Criteria for the ACS Ultra Deep Field
 Field Selection Criteria for the ACS Ultra Deep Field Massimo Stiavelli, Nino Panagia, and Harry Ferguson 1. Selection Criteria The basic criteria for selecting a field suitable for deep observations are:
ASTRONOMY. Chapter 18 THE STARS: A CELESTIAL CENSUS PowerPoint Image Slideshow
 ASTRONOMY Chapter 18 THE STARS: A CELESTIAL CENSUS PowerPoint Image Slideshow FIGURE 18.1 Variety of Stars. Stars come in a variety of sizes, masses, temperatures, and luminosities. This image shows part
S. G. KLEINMANN, M. G. LYSAGHT, W. L. PUGIIE, S. E. SCHNEIDER, M. F. SKRUTSKIE and M. D. WEINBERG S. D. PRICE. K. MATTIIEWS and B. T.
 THE TWO MICRON ALL SKY SURVEY Survey Rationale and Initial Testing S. G. KLEINMANN, M. G. LYSAGHT, W. L. PUGIIE, S. E. SCHNEIDER, M. F. SKRUTSKIE and M. D. WEINBERG University of Massachusetts S. D. PRICE
The Pulsation Properties of the Double-Mode RR Lyrae Variable V79 in Messier 3
 336 The Pulsation Properties of the Double-Mode RR Lyrae Variable V79 in Messier 3 Christine M. Clement Department of Astronomy and Astrophysics, University of Toronto, Toronto, ON, M5S 3H8, Canada Mike
Analysis of Off-Nuclear X-Ray Sources in Galaxy NGC Sarah M. Harrison
 SLAC-TN-6-19 August 26 Analysis of Off-Nuclear X-Ray Sources in Galaxy NGC 4945 Sarah M. Harrison Office of Science, Science Undergraduate Laboratory Internship (SULI) Massachusetts Institute of Technology
The γ-ray Milky Way above 10 GeV: Distinguishing Sources from Diffuse Emission
 The γ-ray Milky Way above 10 GeV: Distinguishing Sources from Diffuse Emission, a C. Deil, a A. Donath, a R. Terrier b a Max-Planck-Institut für Kernphysik, P.O. Box 103980, D 69029 Heidelberg, Germany
The Milky Way Galaxy. Some thoughts. How big is it? What does it look like? How did it end up this way? What is it made up of?
 Some thoughts The Milky Way Galaxy How big is it? What does it look like? How did it end up this way? What is it made up of? Does it change 2 3 4 5 This is not a constant zoom The Milky Way Almost everything
Active Galaxies & Quasars
 Active Galaxies & Quasars Normal Galaxy Active Galaxy Galactic Nuclei Bright Active Galaxy NGC 5548 Galaxy Nucleus: Exact center of a galaxy and its immediate surroundings. If a spiral galaxy, it is the
Large-Scale Structure
 Large-Scale Structure Evidence for Dark Matter Dark Halos in Ellipticals Hot Gas in Ellipticals Clusters Hot Gas in Clusters Cluster Galaxy Velocities and Masses Large-Scale Distribution of Galaxies 1
PROJECT GLOBULAR CLUSTERS
 PROJECT 5 GLOBULAR CLUSTERS Objective: The objective of this exercise is the calculation of the core and tidal radius of a globular cluster in the Milky Way. Measure the tidal radius of a globular cluster
Coma Cluster Matthew Colless. Encyclopedia of Astronomy & Astrophysics P. Murdin
 eaa.iop.org DOI: 10.1888/0333750888/2600 Coma Cluster Matthew Colless From Encyclopedia of Astronomy & Astrophysics P. Murdin IOP Publishing Ltd 2006 ISBN: 0333750888 Institute of Physics Publishing Bristol
Application of deconvolution to images from the EGRET gamma-ray telescope
 Application of deconvolution to images from the EGRET gamma-ray telescope Symeon Charalabides, Andy Shearer, Ray Butler (National University of Ireland, Galway, Ireland) ABSTRACT The EGRET gamma-ray telescope
CONFIRMATION OF A SUPERNOVA IN THE GALAXY NGC6946
 CONFIRMATION OF A SUPERNOVA IN THE GALAXY NGC6946 G. Iafrate and M. Ramella INAF - Astronomical Observatory of Trieste 1 Introduction Suddenly a star runs out its nuclear fuel. Its life as a normal star
Catalog Information and Recommendations
 Catalog Information and Recommendations U.S. Naval Observatory, December, 2000 P.O.C. Sean Urban (seu@pyxis.usno.navy.mil) 1 Introduction The following is a list of widely used or well known catalogs for
uponèexplanation (see, e.g., Cowie et al. 1990; Gardner, Cowie, & Wainscoat 1993; Gronwall & Koo 1995;
 THE ASTROPHYSICAL JOURNAL, 505:50È73, 1998 September 20 ( 1998. The American Astronomical Society. All rights reserved. Printed in U.S.A. NEAR-INFRARED GALAXY COUNTS TO J AND K D 24 AS A FUNCTION OF IMAGE
Measuring Radial Velocities of Low Mass Eclipsing Binaries
 Measuring Radial Velocities of Low Mass Eclipsing Binaries Rebecca Rattray, Leslie Hebb, Keivan G. Stassun College of Arts and Science, Vanderbilt University Due to the complex nature of the spectra of
Dark Energy. Cluster counts, weak lensing & Supernovae Ia all in one survey. Survey (DES)
") Dark Energy Cluster counts, weak lensing & Supernovae Ia all in one survey Survey (DES) What is it? The DES Collaboration will build and use a wide field optical imager (DECam) to perform a wide area,
Dark Energy Cluster counts, weak lensing & Supernovae Ia all in one survey Survey (DES) What is it? The DES Collaboration will build and use a wide field optical imager (DECam) to perform a wide area,
Infrared Mass-to-Light Profile Throughout the Infall Region of the Coma Cluster
 Infrared Mass-to-Light Profile Throughout the Infall Region of the Coma Cluster K. Rines 1, M.J. Geller 2, M.J. Kurtz 1, A. Diaferio 3, T.H. Jarrett 4, and J.P. Huchra 1 ABSTRACT Using a redshift survey
There are three main ways to derive q 0 :
 Measuring q 0 Measuring the deceleration parameter, q 0, is much more difficult than measuring H 0. In order to measure the Hubble Constant, one needs to derive distances to objects at 100 Mpc; this corresponds
THE ASTROPHYSICAL JOURNAL, 533:631È649, 2000 April 20 ( The American Astronomical Society. All rights reserved. Printed in U.S.A.
 THE ASTROPHYSICAL JOURNAL, 533:631È649, 2000 April 20 ( 2000. The American Astronomical Society. All rights reserved. Printed in U.S.A. REVERBERATION MEASUREMENTS FOR 17 QUASARS AND THE SIZE-MASS-LUMINOSITY
PoS(extremesky2009)013
013") Correlating the WFC and the IBIS hard X-ray surveys IASF-Roma INAF. Via Fosso del Cavaliere, 100 00133 Rome Italy E-mail: fiamma.capitanio@iasf-roma.inaf.it A. J. Bird School of Physics and Astronomy,
Correlating the WFC and the IBIS hard X-ray surveys IASF-Roma INAF. Via Fosso del Cavaliere, 100 00133 Rome Italy E-mail: fiamma.capitanio@iasf-roma.inaf.it A. J. Bird School of Physics and Astronomy,
ACTIVE GALACTIC NUCLEI: optical spectroscopy. From AGN classification to Black Hole mass estimation
 ACTIVE GALACTIC NUCLEI: optical spectroscopy From AGN classification to Black Hole mass estimation Second Lecture Reverberation Mapping experiments & virial BH masses estimations Estimating AGN black hole
Studies of diffuse UV radiation
 Bull. Astr. Soc. India (2007) 35, 295 300 Studies of diffuse UV radiation N. V. Sujatha and Jayant Murthy Indian Institute of Astrophysics, Bangalore 560 034, India Abstract. The upcoming TAUVEX mission
Optical positions of compact extragalactic radio sources with respect to the Hipparcos Catalogue
 ASTRONOMY & ASTROPHYSICS AUGUST 1998, PAGE 259 SUPPLEMENT SERIES Astron. Astrophys. Suppl. Ser. 131, 259 263 (1998) Optical positions of compact extragalactic radio sources with respect to the Hipparcos