Characteristics of plasma flows at the inner edge of the plasma sheet
|
|
|
- Sybil Chase
- 5 years ago
- Views:
Transcription
1 Characteristics of plasma flows at the inner edge of the plasma sheet R.L. McPherron, T-S. Hsu, J. Kissinger, X. Chu, V. Angelopoulos Institute of Geophysics and Planetary Physics and Department of Earth and Space Science, University of California Los Angeles Los Angeles, CA Submitted to Journal of Geophysical Research: July 7, 2010 Revision 1: October 10, 2010 Revision 2: December 25,
2 ABSTRACT All known types of auroral zone magnetic activity are associated with closure of open magnetic flux in the magnetotail. As closure is caused by magnetic reconnection we expect to observe fast flows during geomagnetic activity. We have scanned the ion flow data during the first pass of the Themis D spacecraft through the tail (December 2007 May 2008) identifying all flows with V x > 150 km/s. These flows generally occur in a sequence of several short bursts (bursty bulk flows). Earthward flows are much more common than tailward flows; earthward flows are faster than tailward flows; earthward flows have longer duration; tailward flows are seen alone or after an earthward flow; both directions of flow are associated with an increase in tail Bz (dipolarization). Fast flows in either direction are rarely seen inside of 9 Re. Earthward flows are strongly localized in the local time sector 2100 to 0100 and have a probability distribution identical to that seen in auroral substorm expansions by the Image spacecraft. Tailward flows are also localized but with a peak shifted to 23:30 LT. Very close to midnight the flows are slowed and reflected. At other local times they appear to be deflected around the Earth. Fast flows often follow a reduction in Es (gsm VBs) and occur close to the time of a sudden decrease in the AL index. Generally the first flow burst in a sequence is most closely associated with the AL onset and its peak follows the AL onset by about 2 minutes. The probability of observing a fast flow at Themis D during steady magnetospheric convection (SMC) events is quite low compared with the probability during an interval before the SMC. Since most of the fast flows carry magnetic flux earthward and are associated with substorm onset seen in the aurora by Image and in the AL index we interpret them as evidence that magnetic reconnection has occurred in the tail. Near 30 Re in the tail plasmoid ejection has also been associated with substorm onset so we conclude that the fast flows are created by a new x-line formed outside the 11.9 apogee of Themis D some time earlier than they are seen at Themis D. During SMC it appears that fast flows due to reconnection are deflected around the Earth outside the apogee of the satellite. 2
3 1 Introduction The magnetosphere responds to the solar wind in a variety of ways depending on the strength and waveform of the interplanetary magnetic field (IMF), the dynamic pressure and Mach number of the solar wind, and the electrical conductivity of the northern and southern ionospheres. Several distinct modes of response have been identified including pseudo breakups [Akasofu, 1964; Voronkov et al., 2003], substorm expansion onsets [Ohtani et al., 1999], intensifications of the expansion [Weins and Rostoker, 1975], poleward boundary intensifications [De La Beaujardiere et al., 1994], convection bays [Pytte et al., 1978] or steady magnetospheric convection (SMC) [Sergeev et al., 1996], and sawtooth events [Borovsky et al., 2001; Henderson et al., 2006]. All of these phenomena are associated with southward IMF and each has been shown to be correlated with the closure of open magnetic flux in the tail lobes [Hubert et al., 2009; Milan et al., 2008 and their references to earlier work]. The inescapable conclusion is that magnetic reconnection plays an essential role in each of these modes of response. In this paper we will examine the relation of plasma sheet flows to two of these modes of response: substorms and steady magnetospheric convection. The concept of a substorm was developed nearly 50 years ago [Akasofu, 1964; Chapman, 1962], and the physical processes responsible for a substorm are still a subject of considerable controversy. In brief a substorm is an organized response of the magnetosphere to the onset of an interval of dayside magnetic reconnection. Magnetic flux is eroded from the dayside and transported to the tail lobes. The plasma sheet responds to the additional flux by thinning, moving earthward, and increasing the cross-tail current. After about 50 minutes of the growth of these effects the aurora at the equatorward edge of the auroral oval suddenly brightens and expands poleward. Associated with the auroral expansion the polar cap contracts as the flux stored in the tail lobes reconnects, and a portion of the inner edge of the tail current is diverted through the ionosphere. During the expansion phase and the following recovery phase magnetic flux is returned to the dayside by plasma flows in the near-earth plasma sheet. The distinguishing features of a substorm are a difference in the 1
4 day and night side reconnection rates and the poleward expansion of auroral and magnetic activity. The concept of steady magnetospheric convection was introduced more recently. The phenomenon was initially reported by Pytte et al. [1978] who noted that during steady intervals of southward interplanetary magnetic field (IMF) the magnetosphere occasionally enters a state of elevated activity during which there is little change in magnetic configuration and no expansions of the aurora. The authors named this phenomenon convection bay because of the continuous disturbance in the AE indices without evidence of substorm expansions. It was postulated that convection bays are examples of balanced day and night side reconnection during which there is no net change in the amount of open flux stored in the tail lobes. Sergeev et al. [1996] and coauthors renamed this phenomenon steady magnetospheric convection (SMC) and carried out extensive analysis of six events. Their analysis supported the hypothesis of balanced reconnection and suggested that reconnection on the nightside occurs at an x- line formed by a preceding substorm expansion. It appears that the X-line moves some distance tailward of its location during the substorm expansion and sporadically reconnects across a broad range of the tail creating channels of earthward flow. These are seen in the auroral oval as poleward boundary intensifications (PBI). The distinguishing features of SMC are elevated magnetic activity, absence of poleward expansions, and a steady magnetospheric configuration. Today there is little argument that a southward IMF connects to the earth s magnetic field on the dayside opening magnetic flux [Baker, et al., 1996]. Newly opened magnetic flux is transported across the polar caps and temporarily stored in the lobes of the tail. The feet of the open field lines connect to the Earth in the polar caps. As open flux accumulates, the polar caps, defined as the dark regions poleward of the auroral ovals, expand equatorward. If dayside reconnection were to continue indefinitely all dayside magnetic flux would be opened and added to the polar caps. Besides this increase in size of the polar caps the magnetosphere responds in a variety of other ways including erosion of the magnetopause, a change in magnetopause shape, onset of sunward convection, 2
5 earthward motion of the inner edge of the plasma sheet, and plasma sheet thinning. Eventually these changes lead to the onset of magnetic reconnection in the tail and open flux is closed. Once closed the magnetic flux is transported to the dayside by flows in the plasma sheet. Each of the response modes mentioned above is a different manifestation of the manner in which tail reconnection occurs. Thus the primary purpose of geomagnetic activity is to return magnetic flux to the dayside of the magnetosphere. It was established previously that plasma flows in the tail are bursty and localized in narrow channels [Angelopoulos et al., 1992; Angelopoulos et al., 1996; Angelopoulos et al., 1994]. Earthward plasma velocities up to several hundred kilometers per second are frequently seen in the plasma sheet beyond 10 Re. These flows occur in narrow channels of a few Earth radii (Re) width. As these flows penetrate the inner magnetosphere they slow down as they enter regions of increasing field strength according to the formula E = VB. If the electric field is constant throughout the plasma sheet and B increases from 5 to 100 nt there will be a 20-fold decrease in flow speed to a few tens of kilometers per second. This is the noise level of most previous plasma instruments and these flows are detectable only in long term averages. Recently the Themis mission launched five spacecraft into synchronized orbits in the tail such that the spacecraft have orbital periods of 4 days (Themis B), two days (C), one day (D and E), and approximately one day (A) [Angelopoulos, 2008]. The orbits are phased so that a major conjunction (4 spacecraft) occurs at apogee every four days and a minor conjunction every two days (two spacecraft). The line of apogees was chosen so that conjunctions in the midtail occur over North America in February and March of 2008 and Studies of magnetic activity requiring major conjunctions are limited by two factors. First the conjunctions only last about 10 hours out of every 96, and second the outer spacecraft (B and C) are only in the plasma sheet about 1 out of 5 hours. Together this gives about a 2% chance of catching an earthward flow at all spacecraft during conjunction. 3
6 To alleviate the foregoing problem we have chosen to use the inner spacecraft Themis D wherever it is located to study the statistical properties of flows at the inner edge of the plasma sheet. Apogee for Themis D is at 11.9 Re in the heart of the region often referred to as the current disruption region [Lui, 1991; Lui, 1996]. We will show that the arrival of a fast flow, a sudden onset of fluctuations in the magnetic field, and a prolonged enhancement in Bz (dipolarization) are the characteristic signatures of substorms in this region. In this paper we investigate the properties of these flows, their spatial distribution, their relation to dipolarization, their association with the IMF, and their relation to magnetic activity as revealed by the AL index. We focus on two types of magnetic activity: substorms as defined by a sudden decrease in the AL index and steady magnetospheric convection as defined by a steady elevated AE index without sudden drops in the AL index. 2 Background Since the near-earth neutral line model was developed to explain magnetospheric substorms [Hones, 1973; McPherron et al., 1973; Nishida and Nagayama, 1973] there have been many attempts to prove that plasma flow direction and magnetic field orientation are correlated as expected from magnetic reconnection. One of the first statistical studies of this relation was reported by Caan et al, [1979]. Using 324 events measured on the IMP 6 spacecraft (apogee 33.1 Re) the authors showed that Bz in tailward flows is biased toward negative values and in earthward flows toward positive values as predicted by reconnection theory. However, the observation of northward fields in tailward flows led them to speculate that the thin sheet tailward of the x-line contains weak Bz and is susceptible to tilting and waving producing intervals of northward Bz. They also speculated that multiple plasmoids produced by bursty reconnection could produce such a result. Surprisingly the AE index associated with the high-speed flows was only twice the quiet time values. The early work on magnetotail flows and fields was greatly extended by studies of the AMPTE IRM data [Baumjohann, 1988; Baumjohann et al., 1988; Baumjohann et al., 1989; Baumjohann et al., 1990; Baumjohann et al., 1991;]. With an apogee of 18.5 Re 4
7 and equatorial orbit plane the IRM spacecraft was able to explore the inner portion of the magnetotail. In Baumjohann et al. [1988] it was established that the plasma sheet boundary layer (PSBL) is a unique part of the plasma sheet subject to occasional bursts of high-speed, field-aligned flow, but having a relatively low average velocity. Baumjohann et al. [1989] examined the properties of the central plasma sheet. They determined that it also experiences bursty earthward fast flows of duration less than a minute and that it exhibits an average velocity comparable to that in the PSBL. Ion temperature increases and ion density decreases with increasing magnetic activity. The nearly complete absence of tailward flows with negative Bz led them to conclude that the near-earth x-line must form beyond 19 Re. Baumjohann et al. [1990] performed a detailed investigation of the properties of highspeed flow bursts (V> 400 km/s). In all layers of the plasma sheet the probability of a specific high-speed is less than 1.4% and decreases exponentially with speed, and also decrease linearly with density. PSBL bursts of low speed are more common than central plasma sheet (CPS) flows but at high speed they are nearly equal. In the CPS the probability of a high-speed flow increases with AE, decreases to low values approaching the inner edge of the plasma sheet (X ~ -10 Re), and decreases rapidly away from midnight. High speed flows usually last less than 10 seconds and almost never more than 60 seconds. Virtually all the high-speed flow inside 19 Re are directed earthward. An alternative to the neutral line model favored by Baumjohann and coworkers was postulated by Lui et al. [1988] from an examination of particle and field data from the AMPTE CCE, the sister spacecraft to IRM with apogee at 8.8 Re. In this region the authors found that the characteristic signature of substorm onset is the sudden appearance of fluctuations in the magnetic field and an increase in its Z-component (dipolarization). The authors suggest that this region of turbulent magnetic field is the source of particles injected deeper into the magnetosphere and also the region from which current is diverted into the substorm current wedge. In a subsequent paper Lui et al. [1990] invoke the kinetic cross-field streaming instability as the cause of the magnetic turbulence. They argue that this instability disrupts the cross-tail current allowing stretched field lines to 5
8 collapse in a convective surge. The diverted current creates the substorm current wedge and the observed increase in Bz. Additional details of this model are presented in a synthesis model [Lui, 1991]. In this synthesis it was suggested that all bursts of flow in the CPS are produced by current disruption events that trigger a collapse of extended field lines and a rarefaction wave that pulls plasma into the inner edge of the plasma sheet. It is only after several of these at progressively greater distances that a rarefaction wave triggers reconnection at a distant location. Plasma jets from this region are diverted into field-aligned flows in the PSBL. In this model plasma flows are a consequence of current disruption (CD) not the cause. The detailed properties of individual flow bursts were investigated by Angelopoulos et al. [1992]. They found that the bursts were organized into ~10-minute intervals of enhanced flow speed within which there were short-duration bursts of very high speed. They introduced the name bursty bulk flow (BBF) to describe this phenomenon. Their analysis showed that the average burst is associated with a temporary decrease in Bx and increase in Bz (dipolarization) and also with an increase in ion temperature. It should be noted that this use of the term dipolarization refers to a temporary increase in Bz in contrast to the prolonged increase in Bz called dipolarization closer to the Earth. The bursts generally have a large component perpendicular to the magnetic field and are therefore carrying magnetic flux sunward. Their estimates show that if these bursts occupy a cross section of only (3 x 3 Re 2 ) they transport as much mass, momentum and energy as steady convection across the entire tail. Angelopoulos et al. [1994] extended the study of BBFs in the IRM data and compared the results to properties of BBFs found in ISEE-2 data. In total they identified 114 IRM events and 241 ISEE-2 events with peak velocities exceeding 400 km/s. They found that flows with these speeds rarely penetrate inside 12 Re and that tailward flows with southward Bz were almost nonexistent in the IRM data and occurred only rarely is ISEE data beyond 17 Re. They also found that the occurrence rate of BBFs increases from 6% to 18% as the AE index increases from ~50 nt to 500 nt. 6
9 The relation of high-speed flows and magnetic field dipolarization to substorm onset was examined by Baumjohann [1996] and Baumjohann et al. [1991] using superposed epoch analysis of IRM data. A set of 39 substorms with clear signatures in multiple indicators was selected. For each substorm the major onset was chosen as the reference time. The results show that in the CPS both dipolarization and high-speed flow are closely associated with substorm onset and reach a peak at the start of the recovery phase (~45 minutes). The ion temperature increases during the expansion phase while the density decreases. In the PSBL the flow speed increases as in the CPS, but the increase in Bz and temperature only occur in the recovery phase. In contrast to the Lui model the authors interpret dipolarization in the near-earth region as the result of reconnection jets depositing newly closed magnetic flux at the inner edge of the plasma sheet. The development of the substorm current wedge via flux pileup was investigated experimentally by Shiokawa and colleagues in a series of papers [Shiokawa et al., 1997; Shiokawa et al., 1998a; Shiokawa et al., 1998b; Shiokawa et al., 1998c]. Shiokawa et al. [1997] point out that the deceleration of the flows by an inward pressure gradient will produce a dawnward inertial current. In addition the increase in magnetic field behind the dipolarization front (here defined as the leading edge of a flow burst) requires a dawnward current as well. Together these two currents partially cancel the cross-tail current in the pileup region requiring a diversion of a portion of the tail current to the ionosphere from the edges of the pileup. An estimate of the total strength of these currents shows they are insufficient to explain a typical current wedge [Shiokawa et al., 1998a]. This concept was applied to an isolated substorm by Shiokawa et al. [1998b] and shown to be consistent with observations. The data suggest that both the initial stage of formation of the substorm current wedge and Pi 2 pulsations are caused by the arrival of the flow burst. The authors argue that the pileup process is the solution to the problem found in the near-earth neutral line model where auroral breakup projects along field lines to the current disruption region near 10 Re and not to the x-line at 25 Re [Baker, et al., 1996]. Shiokawa et al. [1998c] consider the cause of later stages of the substorm current wedge and suggested it is produced by an azimuthal pressure gradient created by the pileup of magnetic flux and plasma. 7
10 The explanation of dipolarization by flux pileup was investigated theoretically with MHD simulations by Birn and Hesse [1991] and Hesse and Birn [1991]. They found that dipolarization is caused by compression of the magnetic field as flows come to a stop at the inner edge of the plasma sheet. Current disruption and diversion into field-aligned currents on the other hand occur tailward of the region of dipolarization but earthward of the x-line and are primarily a consequence of flow vorticity. The pattern of the diverted currents in their simulations is the same as those inferred in the substorm current wedge. A greatly improved simulation of these processes including a dipole field, a more realistic tail configuration, and a thin current sheet is described by Birn and Hesse [1996]. They find that the current diversion is produced by deflected flows shearing the magnetic field of the plasma sheet relative to higher latitude field lines, and by vertical pressure gradients in the same region. Birn et al. [1999] extend this work confirming the results of Shiokawa et al. [1997] that the inertial current is quite small and short lived, but that vertical gradients are more important than azimuthal gradients as argued by Shiokawa et al. [1998a]. It should be emphasized that in the simulations resistivity in the current disruption region is not the cause of current disruption as postulated in the CD model. A detailed multipoint analysis of a single bursty bulk flow (BBF) event and its effects close to the Earth was reported by [Angelopoulos et al., 1996]. The authors conclude that a single BBF flowing in a very narrow channel (1-2 Re 2 ) is sufficient to account for all the energy dissipated in the inner magnetosphere and ionosphere during the duration of the BBF. They also found that the flow ceases when local dipolarization is complete. They postulate that this corresponds to the passage of a dipolarization front tailward over the spacecraft. According to this definition a dipolarization front is the boundary between tail-like and more dipolar field. The study of dipolarization fronts mentioned above was extended to greater distances in a statistical study using Geotail data by Baumjohann et al. [1999] and Baumjohann et al. [2000]. The authors binned magnetic field and flow data in time relative to substorm onset and distance behind the earth to determine the behavior of dipolarization. They 8
11 showed that the times of dipolarization onset and peak Bz are progressively delayed from 11 Re to 30 Re indicating a slow outward motion of dipolarization. In addition they demonstrated that tailward flows are seen just after onset only beyond 21 Re and that these flows reverse when the dipolarization front reaches these locations. They interpret these results as evidence that bursty flows transport magnetic flux earthward where it piles up with an outer boundary that moves tailward with time. As this boundary approaches the x-line it chokes the flow either stopping reconnection or forcing it to move tailward. This result was predicted theoretically by the simulations discussed above. The concept of a dipolarization front is used differently by [Sergeev et al., 1998] who describe the injection of particles deep in the magnetosphere as a combination of an injection front and a subsequent dipolarization front that moves inward at convective speeds. [Nakamura et al., 2002] adopted this usage in a study of a flow burst seen at Cluster (R~17 Re). They find that the flow burst is preceded by a ~2000 km thick layer in which Bz increases rapidly. Ahead of this front plasma is diverted around the flow burst while behind it the high-speed flow is nearly parallel to the front. [Runov et al., 2009] used five Themis spacecraft to describe observations of a dipolarization front preceding a BBF. Their results are unambiguous: The front is seen first at greatest distance and progressively later at spacecraft closer to the Earth. Far from the Earth (X<-16 Re) dipolarization is temporary while closer to the Earth (X~-12 R) there is a prolonged increase in Bz. The idea that flow braking is the cause of a substorm expansion was questioned by Ohtani et al. [2002a] using Geotail data 10 Re behind the Earth. A case study of two nearly identical flow bursts observed in the braking region showed that one burst produced a pseudo breakup while the other produced a full expansion. In a companion paper Ohtani et al. [2002b] examined flow bursts that occurred at Geotail near X = -37 Re during active intervals preceded and followed by at least an hour of quiet times. In one case there was an intense tailward flow and only weak activity at high latitudes. In the second case there was a very strong earthward flow and again little activity in the 9
12 auroral zone. The authors conclude that flow braking alone is insufficient to generate a substorm expansion and that an additional process is required. Ohtani [2004] reiterate this theme arguing that many lobe reconnection and flow events do not develop into substorm expansions. Also they point out that poleward boundary intensifications produce flow bursts and auroral streamers, but no auroral features have been found to precede substorm onsets. A very extensive survey of fast flows with V x > 300 km/s at Geotail was reported by Ohtani et al. [2004]. In the tail this survey identified 818 earthward and 290 tailward flow events at X> -31 Re. These events were analyzed using superposed epoch analysis with two different reference times: the start of the fast flow and the start of the Bz increase. The median curves clearly show the following: Bz temporarily increases during the earthward flow; the dipolarization is usually preceded by a sharp decrease in Bz associated with a momentary increase in density; subsequent to the flow the density is at a lower level and Bz is at a higher level. These features are evident in all 5 Re bins between X = -5 and -31 Re. Similar results different only in details are found for tailward flows in the same distance range. The exception is that tailward flows close to the Earth almost never exhibit decreases in Bz. The authors conclude that The near-earth reconnection is inferred to be the responsible mechanism for most, if not all, flow events. In a subsequent paper Ohtani et al., [2006] considered the effects of the fast flows at geosynchronous orbit. They were unable to show any systematic relation between the dipolarization at this location and fast flows at Geotail. From this negative result they concluded: but it strongly suggests that the near-earth reconnection, even if it is an important component of the tail substorm process, is not sufficient for triggering a substorm onset. Very recently Ohtani et al. [2009] examined the characteristics of tailward flows in the near-earth region defined as a box with limits Y <5 and -8>X>-15 Re. They found that tailward flows with V < -200 km/s are almost as common as earthward flows in this region (prob = 0.8 x 10⁻² as compared to 1.0 x 10⁻² ) and that almost all are associated with a positive change in Bz (98.6%), with an increase in temperature, and a decrease in 10
13 density. These are the same characteristics found for earthward flow events. In the 3.5 years of data the authors found sixty two 12-second samples with V<-200 km/s. Applying the additional constraint that there is no such sample in the preceding 15 minutes reduced the list to 24 events. A superposed epoch analysis showed that the average tailward flow burst lasts about one minute and is often preceded by an earthward flow. The authors consider and rule out several possible explanations for the tailward flow including reconnection earthward of the spacecraft, Kelvin-Helmholtz instability, and the interchange instability. Their most likely explanation is a bounce-back effect in which earthward flows penetrate too close to the Earth and are reflected tailward. In this paper we extend previous work on the nature of plasma flows earthward of X = Re. Data from Themis D during its first tail pass through the tail are examined to determine the statistical properties of the flows and also their relation to northward turnings, dipolarization, and substorm onset as defined by the AL index. 3 Database The data used in this investigation include solar wind plasma and magnetic field and magnetic indices at one minute resolution from the Omni file provided by the NSSDC, three-second resolution fluxgate magnetometer data (FGM), and on-board moments of the ion distribution determined by the Themis electrostatic analyzers (ESA) both downloaded from the Themis mission database. The data were in daily Common Data Format (CDF) files with some missing or overlapping data at day boundaries. These anomalies were eliminated producing complete daily files with 28,800 records per day in ASCII format. The magnetometer data was used to determine the field-aligned and perpendicular components of the flow velocity in gsm coordinates. All data during the 2008 tail pass were then written into two Matlab binary files containing plasma and magnetic field data. These files provide the ability to randomly access any data interval needed in subsequent analysis. 11
14 4 Analysis methods The data analysis included several steps. The first step was to automatically detect fast flows (V > 150 km/s) along the gsm X-axis. This was done by identifying the start and stop times of all intervals in which V x was either greater than this threshold value or less than its negative. Each interval was processed to determine the time of maximum abs(v x ). These times, the peak flow speed, and the gsm location of the spacecraft were written to a file for later use. A second step displayed a 14-hour plot containing AU, AL AE, abs(<d(al)/dt)>, <std(al)>/<al>, and prob(smc). An example plot is presented in Figure 1. Angular brackets indicate a 15-minute running average. The probability that a given point is an SMC was calculated from the number of points that satisfy the SMC selection criteria in a 90 minute moving window. These criteria included: AU>50 nt; AL<-75 nt, -25<d(AL)/dt<+10 nt/min. This plot was examined and all sharp breaks in the slope of the AL index characteristic of a negative bay were selected. Three onsets are shown in the figure by vertical dashed lines. The selected times were written to a file as an initial estimate of substorm onset times. Without further information we can not determine whether these correspond to pseudo breakups, true expansion onsets, intensifications or poleward boundary intensifications (PBI). In a second pass of this program with the same parameters the start and stop times of possible SMC events were selected visually. The parameter prob(smc) was used as a guide, but the start and stop times were visually selected to correspond to intervals when the AL index had partially recovered from a substorm expansion and was exhibiting a nearly constant value for more than 90 minutes. The start and stop times of the SMC interval were written to a second file. In a third step we used a 20-minute plot to display 3-second Themis V x and Bz in gsm coordinates, and the AL index at one-minute resolution. An example is presented in Figure 2. The times of peak flows determined previously were used to center the panels. With this program we identified the time of the initial flow burst in a BBF, the time of the beginning of Bz increase, and the time of the sharp break in the AL index. During this process we found many more short-duration drops in AL index that appeared to be negative spikes in the 14-hour plots, but were obviously short negative bays at expanded scale as illustrated in this figure. Addition of these events to our previous list of 12
15 AL onsets significantly increased the number of possible substorm onsets. Also Figure 2 shows that the first burst in this sequence was not detected by our threshold criterion but the second burst was. In this case we chose the start time of the first burst and associated it with the initial dipolarization and the onset of the negative bay since it is clearly the beginning of the bursty bulk flow (BBF). The list of AL onsets and SMC intervals produced by these automatic and manual selection procedures provide the fundamental data used in subsequent analysis. The specific methods used are described in detail in the follow section of Statistical Results 5 Statistical Results 5.1 Properties of the ion flow The interval from December 1, 2007 through June 30, 2008 was used to obtain a statistical description of the ion flows at Themis D everywhere on the night side. Figure 3 presents cumulative probability distributions (cdfs) of the probability of exceeding the value on the abscissa. The line with blue x is for earthward flows (V x >0) and the line with red o is for tailward flows. The vertical dashed line represents the threshold used in this work to define a fast flow. The probability that an earthward flow sample exceeds the threshold of 150 km/s is about 2 x 10⁻³, a relative small value (0.2 %), and the probability of a tailward flow over this threshold is about four times smaller. Earthward flows reach values in excess of 700 km/s while tailward flows never exceeded 300 km/s. Annotation on the graph shows the number of samples used to create these distributions (213 days), the percentage of fast flow events that were earthward (70.5%), and the percentage of 3-sec samples greater than 150 km/s that were earthward (89.0%). The duration of the flows at Themis D is shown in Figure 4. The e-folding time for earthward flows is ~59 seconds while that of tailward flows is shorter at ~25 seconds. The probability distribution of separations between peaks of flow bursts (not shown) has a peak at 100 seconds with a long tail extending beyond 700 seconds. These peaks correspond to the separation of peaks in a single BBF and to the separation of BBFs. 13
16 A dynamic cdf of V x is presented in Figure 5. This map is produced by a superposed epoch analysis of 43 tailward flow events using the time of peak tailward flow as epoch zero. At each epoch time we calculate a cumulative probability distribution of the flow velocity and characterize it in the final map by deciles (thin lines and colors) and quartiles (heavy lines). A negative peak close to epoch zero is evident, but more importantly this is preceded four minutes earlier by an earthward flow peak. A similar map (not shown) using the times of peak flow of the 279 earthward flow events has a weak negative peak several minutes after epoch zero. These results suggest that in general earthward flows precede tailward flows. The fast flows are generally associated with an increase in Bz as demonstrated in Figure 6. About five minutes before the peak of a fast flow, Bz begins to increase reaching a level 5 nt higher within five minutes after the flow. However, careful examination of individual events such as the one shown in Figure 2 reveal that the increase in Bz is actually much more rapid (~ 1-2 minutes) and usually occurs in association with the first flow burst in a BBF. The smooth rise shown in Figure 6 is an artifact of using all flow bursts rather than only the first flow burst in the analysis. 5.2 Spatial Properties of the ion flow The dependence of the measured plasma flow velocity on distance behind the Earth is revealed in Figure 7. Events were chosen with the requirement that at least one of the five Themis spacecraft observed Vx (not Vperpx) exceeding 150 km/s. For each such event the position of all spacecraft and the maximum values of Vx at each spacecraft around this time were recorded regardless of the magnitude of Vx. These results were then binned as a function of X gsm and for each bin the deciles of the cdf of speed were determined. All observed speeds (along X) are plotted in the diagram with smooth lines through the decile points in each bin. The results suggest that the flow speed is constant from near -22 Re to -12 Re. Closer to the Earth than this the flow along X decreases reaching zero speed at about -6 Re. In addition there is an interesting change in the distribution of flow speeds beyond -22 Re. From -22 to -25 Re the number of tailward 14
17 flows increase relative to earthward flows. This location has been previously reported as the average location of the substorm X-line. Figure 7 shows that the earthward flow speed decreases inside of 12 Re. Themis D has its apogee at R =11.9 Re and hence should observe this process clearly. In Figure 8 results for only fast flows (V x >150 km/s) at Themis D are plotted as a function of radial distance R in contrast to X gsm used in the preceding figure. The top left panel presents the probability density function (pdf) for observation of earthward flows (blue x) and tailward flows (red o) in 0.1 Re bins as a function of R. Both distributions approach zero at 9 Re and peak at 11.7 Re. In actuality we expect the peak to be precisely at 11.9 Re because the spacecraft spends the most time at this radial distance. However, our calculation of the pdf is done with kernel smoothing which decreases the pdf when the kernel overlaps a sharp edge in the distribution. The top right panel is the pdf for the time the spacecraft spent in each radial bin. This pdf is peaked at the same distance as the flow speed as expected. The bottom panel displays the probability of observing earthward and tailward flows normalized by the time spent in each radial bin. This graph gives the probability, not the pdf, so it shows that tailward flows (red o) are relatively improbable compared to earthward flows and that both decrease to zero near 8.5 Re. Again this suggests that the flows are decelerated or deflected at the inner edge of the plasma sheet. The local time distribution of the fast flows is presented in Figure 9 in the same format as the preceding figure. The pdfs in the upper left panel show that the flows predominantly occur in the interval 21 to 01 local time (LT). The distribution of earthward flows (blue x) is virtually identical to the distribution of auroral expansion onsets (grey dash-dot) as determined from Image satellite data by Frey et al. [2004]. The auroral onsets and earthward flows are both peaked at 23 LT. The distribution of tailward flows is clearly offset by ½ hour towards dawn. The significance of this is not clear, but the result is supported by a superposed epoch analysis of V y. Its dynamic cdf (not shown) indicates that the upper quartile (duskward) is +24 km/s while the lower quartile (dawnward) is -37 km/s indicating a preference for dawnward deflection of the flow. For comparison the upper quartile of the earthward flow distribution superposed by peak time of earthward 15
18 flow is over 200 km/s demonstrating that the flow is primarily decelerated and only slightly deflected. The pdf of time spent in each LT bin is plotted in the upper right panel. Because our study begins on December 1, 2007 and only considers points R>6 Re and X<0 there are very few samples near dawn because of the phasing of the Themis orbit. This does not appear to be a problem since there were many samples at 03 LT but the pdfs of flow observation are approaching zero. The behavior of the fast flows at Themis D is exhibited in Figure 10. To obtain this graph each fast flow vector was averaged over the duration of the interval in which V x was above or below (tailward) the threshold. Then all flow vectors were assigned the location of the spacecraft at the peak of the flow burst and averaged in 1-Re square bins to obtain the average flow pattern in the gsm equatorial plane. The left panel shows average earthward flows. The inner grey dashed semicircle is the inner limit of the study at 7 Re, The outer solid grey line is the apogee of Themis D at Re. The grey dotted radial lines indicate the local time sector containing most of the flows. The grey dashed radial line is the center of the local time distribution. It is evident that plus or minus an hour of midnight the flows are almost directly sunward with only a minor azimuthal component. This is the region of deceleration and pileup of the earthward flows. At earlier local time the average flow vectors have an azimuthal component toward dusk suggesting flow around the Earth. Past 01 LT the flow vectors are more erratic but have an azimuthal component towards dawn. Near the dawn terminator there are strong sunward flow vectors which are probably in the low latitude boundary layer. The right panel displays the average tailward flow vectors. They appear to divide into two classes. Close to both terminators the vectors are azimuthal towards midnight. Near midnight the second class of tailward flows is directly outward suggesting that the earthward flows have been turned around. At earlier local times there is a slight westward component to the tailward flows perhaps due to ion drifts. The peculiar nature of the first class of flows towards midnight requires further investigation. 16
19 Properties of all perpendicular flow measurements observed by Themis D are summarized in Figure 11. The results plotted are derived from 4,789,570 three-second samples obtained on the night side at gsm equatorial distances greater than 6 Re. Original flow and position data in gsm coordinates were transformed to an equatorial polar coordinate system [rho, LT]. In this system the azimuthal flow angle of every measurement was determined as angle = atan2(vphi, vrad). An angle of -90 corresponds to westward motion of the plasma towards dusk and +90 to eastward motion towards dawn. Data were then restricted to polar bins with dimensions 0.5 Re and 1 hour LT. In each bin we calculated percentile lines of the distributions of vrad, vphi, angle, Veq = sqrt(vx2+vy2), and ratio = Vx/Vy. From the top down the three panels of Figure 11 show percentile lines of three of these properties (vrad, vphi, and angle) as a function of radial distance. The top panel of Figure 11 displays properties of the radial component of equatorial flow where positive values of vrad are radially outward. Twelve traces above and 12 below the baseline correspond to 12 local time bins from local time. The lines above correspond to the % value of the distribution and those below to the 0.001% value. The thick dashed black line with markers show the radial profiles at midnight. The solid red lines with symbol o correspond to the dawn meridian and the solid black lines with to the dusk meridian. Grey lines in between these sets of lines represent other local times. It is obvious from the top panel that the highest earthward flows (vrad<0) are observed near midnight in the hour centered at 23.5 LT. Almost every earthward flow seen at other local times and the same radial distance is weaker than that seen near midnight. The same is true for reflected flows near midnight. While the outward flows (vrad>0) are weaker than the earthward flows they are much faster near midnight than at other local times. Both the top and middle panel also show that no flow with speed greater than about 20 km/sec penetrates inside of 6 Re at any local time. All of these facts suggest that earthward flows near midnight are decelerated and are either diverted to other local times or are reflected in both cases with much reduced speed. 17
20 The middle panel is identical in format to the top panel and shows properties of the azimuthal component. Again the azimuthal flows near midnight (thick dashed black line with markers) are larger than at other local times in agreement with the larger radial flows seen here. The azimuthal component decreases to zero inside of 6 Re at all local times like the radial component. At the dawn and dusk terminators (traces close to baseline) the radial and azimuthal components are reduced to values of order km/s. The azimuthal component is stronger than the radial component as might be expected for plasma flowing back to the dayside. There is a slight tendency for the near midnight plasma to preferentially flow towards dusk rather than dawn. The bottom panel shows the median flow angle versus radial distance for all local times. Since most of the measurements are close to the noise level we have restricted the analysis to only those flow with equatorial speed greater than 100 km/sec. Even with this relatively weak constraint there are very few flows of this magnitude observed inside of 8 Re. Only near midnight (dashed black line) are such flows seen inside 7.5 Re. For those flows that exceed this limit the different traces show the median flow angle as a function of radial distance and local time. The traces fall into two sets: post midnight with angle>90 and pre midnight with angle<-90. In both sets the median flow angle indicates that the plasma is slowly approaching the Earth as it flows from midnight toward the terminators. In other words, there is a slight inward radial flow combined with azimuthal flow. Only near midnight is the flow pattern confused with a tendency to flow in either direction. These flow data suggest that during substorms plasma is injected between 21 and 01 local time. As the plasma approaches synchronous orbit it is decelerated and either deflected or diverted around the Earth. In the hour before local midnight the plasma may be diverted in either direction or reflected but pre midnight it is preferentially diverted towards dusk and post midnight it is diverted towards dawn. As the plasma flows toward the terminators it moves into regions of stronger field and slows considerably from its initial values seen near midnight. 18
21 5.3 Solar wind driver of ion flows A dynamic cdf of Es = VBs is displayed in Figure 12. A six hour interval centered on the time of peak earthward flow was used with epoch zero at the time of peak flow. About half of the data points correspond to northward IMF and were set to zero. Consequently many deciles have collapsed onto the base line when IMF Bz is northward (Es = 0). About 70 minutes before the peak of the fast flow (epoch zero) the IMF turns southward and median Es rises above the baseline. Shortly before the fast flow the IMF turns northward as evidenced by the sudden drop in the median and upper quartile. This behavior precedes many substorm onsets and is commonly referred to as substorm triggering. In the following section it is shown that a sudden decrease in AL is also associated with the peak of fast flows at Themis D. 5.4 Response of substorm indices to fast flows In the discussion of Figure 1 we showed an example of the 14-hour long plots used to select sharp breaks in the AL index. In this initial survey we looked for a sudden increase in the magnitude of the AL derivative (red trace in panel 2), a sudden onset of a decrease in the trace of the AL index (black asterisks on lower trace in panel 2), and a peak in the 15-minute running ratio of the standard deviation to the running mean of AL. This initial survey found 893 AL onsets. Subsequently a 20-minute interval centered on the time of fast flows was used to refine the onset timing and to associate fast flows with possible AL onsets. This survey provided more accurate timing and identified a number of additional negative bays of shorter duration. The final refined list contained 972 AL onsets, about three times the number of fast flows observed. Many of these onsets occurred sunward of the 7 Re boundary used to define flows or when the spacecraft was at local times where flows are less frequent. Thus the ratio should not be taken as evidence that not all onsets are related to fast flows. A pdf of the time between AL onsets was calculated (but not shown here) for the initial and refined AL onsets. In the initial list there was a broad peak at about 3 hours. Using the refined list the final pdf was bimodal with a peak at 35 and 170 minutes. Most of the additional AL onsets in the refined list were short-duration negative bays superposed on 19
22 the longer duration bay found in the initial survey. It is these that are primarily responsible for the shorter time separations. The relation between flows and AL onsets was examined using the initial list of AL onsets and the peak times of all 322 fast flow bursts. The result was a broad distribution with nearly zero mean but a large standard deviation. An examination of some of these events revealed that it is the first flow burst in a sequence of flow bursts that appears to be associated with the AL onset as was evident in Figure 2. This fact motivated the second survey using short intervals of 30 minute duration. In this refined survey only the delay between the first flow burst and an AL onset was determined. Note that in many cases the first flow burst in a sequence previously identified had a peak magnitude well above background but below the threshold of 150 km/s. This onset of a flow was selected regardless of the peak magnitude. This procedure reduced the list of 322 flow bursts by about half to 178 flow events. Five of these could not be associated with an AL onset within the 30 minute range of the plot. The results of these calculations are shown in Figure 13. The initial survey produced a pdf with nearly zero mean delay (-3.4 min), but a standard deviation of about 22 minutes as shown by the blue line of x. All fast flows both earthward and tailward were associated with the nearest AL onset no matter how long delayed. However, the pdf and statistical properties were calculated for only those flow events with delays less than 60 minutes. In contrast the delay between the AL onsets in the refined survey and the first flow burst in a sequence of bursts is sharply peaked as demonstrated by the red line of o. Many of the fast flows in the auto determination list were not the first flow in a sequence and were ignored in the refined survey. In total there were 173 initial flow bursts that could be associated with an AL onset. The pdf for this subset has a mean of minutes (AL before the flow) and a spread of 3.62 minutes. Taking into account the inherent inaccuracy of the AL index in substorm timing these distribution indicate that the arrival of the first flow at Themis D and the substorm onset are virtually simultaneous. 20
23 The onset of the first flow burst in a list of 173 events associated with AL onsets was used to define epoch zero in a superposed epoch analysis of the AL index. The resulting dynamic cdf is shown in Figure 14. About one hour before the flow burst the AL index begins to decrease. At the time of the flow burst there is a sudden increase in rate of decrease of AL evident in all deciles. This indicates that the response of the westward electrojet to the arrival of a fast flow inside 11.9 Re is a sudden increase in strength. AL reaches a minimum in minutes and then between 30 and 40 minutes it begins to recover. By 90 minutes it has reached a relatively constant but nonzero value. A similar analysis using all 322 fast flow events produced a similar dynamic cdf but with a less sudden change in slope. This is to be expected as many of these events were not the initial flow burst in a sequence and were delayed by as much as 15 minutes from the onset of the first burst. 5.5 Relation of fast flows to steady magnetospheric convection Steady magnetospheric convection (SMC) events were identified as described in the discussion of Figure 1. The procedure basically searches for intervals of elevated and relatively constant AE during which there is no evidence of a sudden decrease in the AL index. The indices must continuously exhibit this behavior for at least 90 minutes to be selected. Ninety four intervals satisfying the SMC criteria were identified and their start times used as epoch zero in a superposed epoch analysis. A dynamic cdf of AE is presented in Figure 15 for these events. About 75 minutes before the selected start time AE begins to increase reaching a maximum at zero epoch time. Thereafter median AE remains at a relatively constant value of 250 nt for more than 90 minutes. A superposed epoch analysis of the IMF Bz (not shown) shows that median Bz becomes negative about two hours before the start of the SMC, reaches a constant value of about nt 60 minutes before, and then remains almost constantly negative for the two hours after the start. Medians of other solar wind parameters are constant through the four hours of the dynamic cdfs. Characteristic solar wind values are: V ~ 500 km/s, Den ~ 2.5 cc -1, Btot ~ 4.5 nt, Es ~ 0.8 mv/m (ignoring zeros). At Themis D the inclination of the magnetic field is constant at around 25, density is around 0.5 cc -1, and Asym-D is 21
24 constant, as are all the AE indices. The stability of all of these parameters provides confidence that SMC events have been correctly identified. To determine whether fast flows are associated with SMC the number of fast flow events before, during, and after SMC intervals were counted. For each event the duration of the intervals before and after the SMC were set equal to the duration of the SMC. The initial result for 94 SMC was 17 before, 4 during, and 13 after. This surprising result prompted a detailed examination of the four events. It was found that all four were either bad data or the start and stop times were incorrectly identified so that the interval included a substorm expansion. In addition it was discovered that 20 of the SMC events occurred at times when the Themis D spacecraft was near apogee and close to or sunward of the dusk terminator. This is a region not considered in the auto detection of fast flows because of the possibility of contamination by boundary layer effects. When these events were eliminated leaving 74 events the three intervals contained respectively 10, 1, and 7 earthward flow events. These results clearly suggest that that few or no fast flows are observed by Themis D during SMC events! The relation of SMC to plasma flows was also investigated with superposed epoch analysis. A dynamic cdf of V x using the SMC start times as epoch zero was calculated. The 90% decile was only 20 km/s. Nowhere in the diagram was there evidence of any fast flow during the entire four hour interval. Since 17 fast flow events were identified in the interval before epoch zero one can ask why they don t influence the contour lines in the dynamic cdf. The answer is that they do, but only at percentile levels above 98%. The events are randomly distributed relative to the start of the SMC and are of short duration (~ 1 minute). In general no two events occur at the same epoch time and so there is a very low probability of a fast flow at any single epoch time. Clearly, if fast flows also occur randomly during SMC intervals they would not appear in the dynamic cdf for the same reason. The modified list of 74 SMC events was used to create a more sensitive display which is presented in Figure 16. The blue trace at the bottom is the 1% line and the purple trace at the top is the 99% line. It is obvious that the left and right side of the diagram differ considerably. Before the SMC onset there are numerous fast flows while 22
25 after few flows exceed the threshold of 150 km/s. The actual number of events is 25 before and six after. If we shorten the interval after onset from two hours to 90 minutes to correspond to the typical duration of SMC there are only 4 events after onset. This result validates the statement made above that fast flows rarely if ever penetrate inside of 12 Re during SMC. It should be noted that some fast flows were observed during SMC when Themis D was near the dusk terminator. In some cases these were long-duration tailward flows in the outer edge of the low latitude boundary layer. In several other cases there were brief bursts of sunward flow but without the dipolarization characteristic of substorms near midnight. For the interval studied there were not a sufficient number of observations near dawn to determine whether a similar phenomenon occurs there. 6 Summary of Results It has been demonstrated that fast flows (V > 150 km/s) are quite common at Themis D with ~322 events identified in a six month interval. Fast flows are most frequently observed in the local time sector 21 to 01 hours and at radial distances beyond 8 Re. Cumulative probability distributions (cdf) of the X-component of the flow from all Themis spacecraft show that deciles of the cdf are constant from about 22 Re to 12 Re and then rapidly decrease to zero by synchronous orbit. Tailward flow events with V > 150 km/s occur about 30% of the time but are of shorter duration and slower speed than earthward flows and occur in only 11% of the samples during fast flow events. Tailward flows rarely occur before an earthward flow but often occur alone. Peaks in both earthward and tailward fast flow bursts are associated with an increase in the gsm Z- component of the magnetic field (dipolarization). Median IMF Bz is negative prior to fast flow events and decreases in magnitude just before the event (northward turning). A sudden decrease in the AL index (pseudo breakup, substorm onset, or intensification) occurs at the time the first fast flow burst in a sequence of bursts (BBF) arrives at Themis D. The behavior of fast flows during steady magnetospheric convection events is very different from that seen at Themis D during substorms. During 74 SMC intervals only one fast flow burst was observed! A superposed epoch analysis finds very few fast flows 23
26 above threshold after SMC onset implying that fast flows rarely if ever penetrate inside 11.9 Re during SMC. 7 Discussion The magnetosphere responds to a southward interplanetary magnetic field (IMF) in a variety of modes including pseudo breakups, expansion onsets, expansion intensifications, poleward boundary intensifications (PBI), steady magnetospheric convection (SMC), and sawtooth events [McPherron et al., 2008]. The work reported here examines two of these response modes, substorm expansion onsets and SMC. Since only the AE indices have been used to define the start times of these events the possibility that some pseudo breakups, intensifications, and PBI are included in the event list can not be ruled out. However, superposed epoch analysis of the AL index for the event lists reveals the standard response [Weimer, 1994] expected during substorms: hour-long growth phase, minute expansion phase, and 90 minute recovery phase. Since pseudo break ups, intensifications, and PBI generally occur minutes apart multiple times during a single substorm [Hsu and McPherron, 2007; Rostoker, 1968], a predominance of such events in the list would smooth the median behavior of the AL index so that the expected behavior would not be observed. We conclude that most of the events have been correctly identified as expansion onsets. However, in this discussion we refer to these as AL onsets indicating the sudden development of a westward electrojet in the midnight sector. In recent work it has been demonstrated that each one of the response modes is associated with the closure of open magnetic flux in the tail, i.e. that magnetic reconnection plays an important role in these phenomena [Hubert et al., 2006; Hubert et al., 2008; Milan et al., 2003; Milan et al., 2007]. Furthermore, to the resolution of the analysis (~12 minutes) flux closure and the expansion onset are simultaneous. In our study we find that both the AL onsets and the start time of SMC intervals are associated with a predominantly southward IMF Bz indicating that dayside reconnection is occurring during the events. This implies that there is excess open flux in the tail lobes and we assume that the magnetic activity we observe is a consequence of reconnection in the tail. 24
27 The primary focus of this study is the properties of fast flows at the inner edge of the plasma sheet (R < 11.9 Re). Fast flow was defined as V x > 150 km/s even though higher values have been used in the past [Angelopoulos et al., 1992; Baumjohann et al., 1990]. Several studies have attempted to measure the width of these flow channels and the conclusion is that they are only a few Re wide otherwise too much magnetic flux would be transported to the inner magnetosphere [Angelopoulos et al., 1992; Nakamura et al., 2005]. The only known process that creates narrow, high-speed flow channels in the tail is transient, localized, magnetic reconnection. High resolution MHD simulations clearly show that this is the normal behavior of the tail once reconnection begins [Ashour- Abdalla et al., 2002; Walker et al., 2006; Wiltberger et al., 2000]. Other processes that stimulate earthward flow such as dayside reconnection or instability of the plasma near midnight at 8-12 Re should produce a rarefaction wave that stimulates a broad region of slow flow toward the dayside. We assume that the high-speed flows we observe with Themis D at the inner edge of the plasma sheet are produced by reconnection. It is important to recognize that this has not been established in the current study but the association of the observed flows with southward IMF Bz is consistent with this assumption. An important finding in this study is that fast flows appear to originate at 22 Re or beyond and travel earthward with relatively constant velocity. But at 12 Re the flows begin to decelerate along the X-axis, and by 8 Re no fast flows are observed. By 6 Re all inward flows have come to a stop although they continue azimuthally at greater distances. This suggests that inside 12 Re the flows encounter forces that slow and divert the flows. Shiokawa et al. [1997] have previously discussed this possibility and developed the idea that reconnection flows pileup near midnight in the outer magnetosphere. With our definition of fast flows we find that no flows with V > 150 km/s penetrate inside of 8 Re during the first tail pass of Themis D. Previous studies using a higher threshold have found the inner edge of the flows to be further out [Angelopoulos et al., 1994], a result consistent with our observation of deceleration inside of 12 Re. 25
28 In this study we found that 30% of the fast flow events are tailward when measured by event count. However, the tailward flows have less than half the duration of earthward flows and account for only 11% of the time in fast flows. The cumulative probability distribution of flow speeds is quite different for earthward and tailward flows. Earthward flows can exceed 800 km/s but tailward flows rarely exceed 300 km/s. Both earthward and tailward flows are associated with dipolarization of the local magnetic field (prolonged increase in Bz). That earthward flows do this is easily understood as a flow perpendicular to the magnetic field indicates that the plasma is carrying magnetic flux from the outer tail. Taken together the properties of the tailward flows suggest that they are produced by reflection or vorticity in the pileup region. A similar conclusion was reached by Baumjohann et al. [2002] To examine the relation of the fast flows to substorm and SMC activity we created lists of all AL and SMC onsets in the interval December 1, 2007 June 30, The initial substorm list was produced by a scan of 14-hour panels centered at 0 and 12 UT. Visual selection of sharp onsets of a decrease in AL produced a total of 893 in the 7 month interval. Subsequently we refined this list using the times of peak earthward flow as the center of 20-minute panels. In these panels we found a number of additional sharp breaks in AL slope that increased the number of AL onsets to 972. Since we did not examine intervals without flows it is likely that the list of AL onsets should be larger still. However our objective was to correlate AL onsets with flow onsets so the refined list corresponds to AL onsets close to a fast flow onset. In creating the refined list of AL onsets we found that the best correlation between AL onsets and fast flow onsets is with the first flow burst in a sequence of fast flow bursts, i.e. within a single bursty bulk flow (BBF). Flow bursts later in the sequence are obviously associated with the AL onset but with a larger delay than the first flow burst. In many cases we found that the first flow burst did not pass our velocity threshold although a later flow burst did. We took the beginning of the first flow burst as the relevant time regardless. The peak velocity in these bursts was well above background and from the distribution of flow speeds any particular threshold is arbitrary. 26
29 We used both the initial and refined lists of AL onsets to determine the separation between substorm onsets. The distribution was bimodal with peaks at 35 and 170 minutes. The 170 minute peak corresponds to the often reported 3-hour separation of substorms [Borovsky and Nemzek, 1994; Borovsky et al., 1993; Prichard et al., 1996], while the 35 minute peak is closer to the separation between pseudo breakups and PBI [Hsu and McPherron, 1998; Rostoker and Samson, 1981; Zesta et al., 2000]. A 12-hour plot of Bz at Themis D reveals frequent dipolarizations of the magnetic field with the same time separation as these AL onsets. Clearly if the 3-hour duration of a substorm has meaning then one substorm usually includes several BBFs carrying magnetic flux toward the earth. We also examined the time delay between AL onsets and the initial flow burst in a BBF. Using our initial survey of 279 earthward flow bursts the distribution was centered close to zero delay but had a very large spread with standard deviation of about 22 minutes. However, when we used only the first flow burst in a BBF (173 events) we found the distribution was sharply peaked near zero delay with a standard deviation of only 3 minutes. It is interesting to note that both distributions were actually centered 2-3 minutes before the flow onsets. If these mean delays are physically meaningful they suggest that the substorm current wedge begins before the arrival of the flow at Themis D. This appears to support the view of advocates of the current disruption theory that flows are created by the current wedge. However, an alternative explanation is that effects of the flow are propagated to the Earth by Alfvén waves from regions outside 12 Re and that the current wedge is beginning to flow through the ionosphere even as the flow arrives at Themis D. Another possibility is that the Themis D observations are biased by the spacecraft often being outside the local time sector of substorm onset and the arrival of flows in these regions is delayed. Still another alternative is that the AL index is an inaccurate measure of expansion onset time. However, we would expect the detection of electrojet signatures in AL to be delayed relative to its formation. The detailed interpretation of these mean delays requires more accurate determination of substorm onset times and knowledge of the location of the spacecraft relative to the substorm current wedge. Nonetheless these results establish that an enhancement of the westward 27
30 electrojet is associated within a minute or two with the initial arrival of a sequence of flow bursts at the inner edge of the plasma sheet. Our examination of the local time distribution of fast flows at Themis D showed that they most frequently occur between 21 and 01 local time. This distribution is virtually identical to that seen in satellite images of auroral expansion onset as was shown in Figure 9. This similarity suggests that there is a causal relation between the arrival of a fast flow in the inner magnetosphere and the expansion phase of an auroral substorm. The association of dipolarization and the onset of a negative bay with the arrival of the flow also suggest that there is a causal relation between the flows and these phenomena. An interesting fact obvious in our data is that the local time distribution of tailward flows is offset by ½ hour towards dawn from the earthward flow distribution. This offset is consistent with the observation that the quartile of V x in the dawnward direction (37 km/s) is larger than the quartile in the duskward direction (24 km/s). There is no obvious reason for this offset but it must indicate a pressure distribution during substorms that preferentially reflects earthward flows toward dawn. The initial list of 893 AL onsets was used as epoch zero in a superposed epoch analysis of the IMF Bz. The dynamic cdf (not shown) has a minimum in Bz at the time of the AL onset indicating a northward turning about this time. We repeated this analysis with the subset of earthward flows using Es = VBs with the time of peak flows as epoch zero (Figure 12). We found that the flow was preceded by a sharp decrease in the strength of Es a few minutes before the fast flow. This result suggests that a northward turning of the IMF triggers reconnection in the tail, a fast flow into the outer magnetosphere, and the onset of a substorm expansion. Since we showed that the arrival of a fast flow is associated within minutes with an AL onset this result is consistent with previous reports that northward turnings trigger substorm onsets [Hsu and McPherron, 2002; Hsu and McPherron, 2003]. 28
31 Finally we examined the association between the start of fast flows and the beginning of dipolarization. We found that the first flow burst is clearly associated with a sharp increase in Bz, but that subsequent flow bursts do not significantly increase the field strength. They do, however, seem to enhance the fluctuations in Bz. We attempted to determine which occurs first, the flow or the dipolarization. We found many clear cases arising from background where the flow appears to begin before the dipolarization. However, most of the time perturbations present in the magnetic field prior to the dipolarization preclude an accurate determination of the start of the dipolarization. Statistically we found that the two events are simultaneous within one minute. We believe that it is likely that the magnetic perturbations are caused by the arrival of the flow but our timing analysis is not sufficiently accurate to prove this point. Although not documented in the paper we also found that the minimum in Themis Bz prior to the fluctuating dipolarization, the so-called explosive growth phase is delayed by about one minute from the start of the fast earthward flow. Our search for fast flows during SMC events was quite revealing. Our results are consistent with the statement that fast flows never penetrate to 12 Re on the night side during SMC events. Since we know that SMC are a consequence of balanced dayside and nightside reconnection we must ask where is the return flow from the nightside? One possibility is that it emerges from a steady X-line over a broad region at such a slow velocity that it is undetectable by the time it reaches Themis D. A more likely explanation is that during SMC a region of high pressure exists behind the Earth and that transient and localized flows are deflected around the Earth at distances beyond 12 Re. This would imply that sunward flow bursts should be evident at the terminators during SMC. Unfortunately our original choice of the study interval was such that we had no flow measurement near the dawn terminator. However, at the dusk terminator we did have data and found one or two sunward flow bursts. Unfortunately the low latitude boundary layer is very dynamic and it is difficult to separate sunward flows due to the viscous interaction from sunward flows due to reconnection. Resolution of this problem will require future work. 29
32 8 Conclusions Two modes of magnetospheric response were investigated in this study: substorms and steady magnetospheric convection. Both are clearly associated with southward interplanetary magnetic field and hence must in some way be consequences of magnetic reconnection. Virtually all fast flows reaching inside 12 Re in the local time sector 21 to 01 hours can be associated with a sudden and persistent drop in the AL index indicating a substorm expansion has taken place. These fast flows deposit magnetic flux in the outer magnetosphere increasing the magnetic field strength by a substantial amount. Presumably this flux was created by reconnection further out in the tail since the lobe field strength and the size of the polar cap are observed to decrease during substorms. Also plasmoids and TCRs are observed moving tailward within a minute or two [Taguchi et al., 1998] of substorm onset and these can only be created by the formation of a second x-line in the tail close to the Earth. During SMC we discovered that no fast flows penetrate inside of 12 Re on the nightside. However, SMC are caused by balanced reconnection so reconnection flows must occur somewhere. Presumably they are deflected around the Earth at distances greater than 12 Re and so are invisible to the Themis D spacecraft. It should be emphasized that when no flows penetrate to 12 Re there is no dipolarization of the nightside magnetic field, no rapid fluctuations in the magnetic field, and no sudden decreases in the AL index. It would appear that it is the arrival of the fast flow that creates these phenomena as reconnection is occurring both in substorms when these phenomena are present and in SMC when they are not. Acknowledgments. The authors thank the investigators responsible for the development, calibration, and processing of Themis magnetometer and plasma moment data. They also thank the individuals responsible for acquisition and distribution of solar wind and magnetic index data through the NASA NSSDC data center. Data analysis was supported by NASA grants NNX07AG16G and NNX07AF60G. The Themis PI was supported by NASA contract NAS
33 9 References Akasofu, S.-I. (1964), The development of the auroral substorm, Planetary Space Science, 12(4), Angelopoulos, V., W. Baumjohann, C. Kennel, F. Coroniti, M. Kivelson, R. Pellat, R. Walker, H. Lü, hr, and G. Paschmann (1992), Bursty Bulk Flows in the Inner Central Plasma Sheet, Journal of Geophysical Research, 97(A4), Angelopoulos, V., F. Coroniti, C. Kennel, M. Kivelson, R. Walker, C. Russell, R. McPherron, E. Sanchez, C.-I. Meng, W. Baumjohann, G. Reeves, R. Belian, N. Sato, E. Friis-Christensen, P. Sutcliffe, K. Yumoto, and T. Harris (1996), Multipoint analysis of a bursty bulk flow event on April 11, 1985, Journal of Geophysical Research, 101(A3), Angelopoulos, V., C. Kennel, F. Coroniti, R. Pellat, M. Kivelson, R. Walker, C. Russell, W. Baumjohann, W. Feldman, and J. Gosling (1994), Statistical Characteristics of Bursty Bulk Flow Events, Journal of Geophysical Research, 99(A11), Angelopoulos, V. (2008), The THEMIS Mission, Space Science Reviews, 141(1-4), Ashour-Abdalla, M., M. El-Alaoui, F.V. Coroniti, R.J. Walker, and V. Peroomian (2002), A new convection state at substorm onset: Results from an MHD study, Geophys. Res. Lett., 29(20), Baker, D., T. Pulkkinen, et al. (1996). Neutral line model of substorms: Past results and present view, Journal of Geophysical Research 101(A6): Baumjohann, W. (1988), The plasma sheet boundary layer and magnetospheric substorms, Journal of Geomagnetism and Geoelectricity, 40(2), Baumjohann, W. (1996), Near-Earth plasma sheet dynamics, Advances in Space Research, 18(8), Baumjohann, W., M. Hesse, S. Kokubun, T. Mukai, T. Nagai, and A. Petrukovich (1999), Substorm dipolarization and recovery, Journal of Geophysical Research, 104(A11), Baumjohann, W., T. Nagai, A. Petrukovich, T. Mukai, T. Yamamoto, and S. Kokubun (2000), Substorm signatures between 10 and 30 Earth radii, Advances in Space Research, 25(7-8), Baumjohann, W., G. Paschmann, and C. Cattell (1989), Average Plasma Properties in the Central Plasma Sheet, Journal of Geophysical Research, 94(A6), Baumjohann, W., G. Paschmann, H. Lü, and hr (1990), Characteristics of High- Speed Ion Flows in the Plasma Sheet, Journal of Geophysical Research, 95(A4), Baumjohann, W., G. Paschmann, T. Nagai, H. Lü, and hr (1991), Superposed Epoch Analysis of the Substorm Plasma Sheet, Journal of Geophysical Research, 96(A7), Baumjohann, W., G. Paschmann, N. Sckopke, C. Cattell, and C. Carlson (1988), Average Ion Moments in the Plasma Sheet Boundary Layer, Journal of Geophysical Research, 93(A10),
34 Baumjohann, W., R. Schodel, and R. Nakamura (2002), Bursts of fast magnetotail flux transport, in Advances in Global Magnetospheric Structure, Dynamics, and Region Coupling, Proceedings, pp Birn, J., and M. Hesse (1991), The Substorm Current Wedge and Field-Aligned Currents in MHD Simulations of Magnetotail Reconnection, Journal of Geophysical Research, 96(A2), Birn, J., and M. Hesse (1996), Details of current disruption and diversion in simulations of magnetotail dynamics, Journal of Geophysical Research, 101(A7), Birn, J., M. Hesse, G. Haerendel, W. Baumjohann, and K. Shiokawa (1999), Flow braking and the substorm current wedge, Journal of Geophysical Research, 104(A9), Borovsky, J., and R. Nemzek (1994), Comment on "The Earth's Magnetosphere Under Continued Forcing: Substorm Activity During the Passage of an Interplanetary Cloud" by C. J. Farrugia, M. P. Freeman, L. F. Burlaga, R. P. Lepping, and K. Takahashi, Journal of Geophysical Research, 99(A8), Borovsky, J.E., R.J. Nemzek, and R.D. Belian (1993), The occurrence rate of magnetospheric-substorm onsets: random and periodic substorms, Journal of Geophysical Research, 98(A3), Borovsky, J.E., M. Thomsen, G.D. Reeves, M.W. Liemohn, J. Kozyra, C.R. Clauer, and H.J. Singer (2001), Global sawtooth oscillations of the magnetosphere during large storms, Eos Trans. AGU, 82(47), Abstract SM42D-08. Caan, M., D. Fairfield, and E.H. Jr. (1979), Magnetic Fields in Flowing Magnetotail Plasmas and their Significance for Magnetic Reconnection, Journal of Geophysical Research, 84(A5), Chapman, S. (1962), Earth storms: retrospect and prospect, J. Phys. Soc. Jpn., 17(A-I), 6. De La Beaujardiere, O., L.R. Lyons, J.M. Ruohomemi, E. Friss-Christensen, C. Danielsen, F. Rich, and P. Newell (1994), Quiet-time intensifications along the poleward auroral boundary near midnight, Journal of Geophysical Research, 99(A1), Frey, H.U., S.B. Mende, V. Angelopoulos, and E.F. Donovan (2004), Substorm onset observations by IMAGE-FUV, Journal of Geophysical Research, 109(A10), 1-6. Henderson, M.G., R. Skoug, E. Donovan, M.F. Thomsen, G.D. Reeves, M.H. Denton, H.J. Singer, R.L. McPherron, S.B. Mende, T.J. Immel, J.B. Sigwarth, and L.A. Frank (2006), Substorms during the August 2000 sawtooth event, Journal of Geophysical Research, 111(A6), 1-32, doi: /2005ja /2005JA Hesse, M., and J. Birn (1991), On Dipolarization and Its Relation to the Substorm Current Wedge, Journal of Geophysical Research, 96(A11), Hones, E.W., Jr. (1973), Plasma flow in the plasma sheet and its relation to substorms, Radio Science, 8(11), Hsu, T.-S., and R.L. McPherron (1998), The main onset of a magnetospheric substorm, in International Conference on Substorms (ICS-4), edited by S. Kokubun, and Y. Kamide, pp , Terra Scientific Publishing Company and Kluwer Academic Publishers, Tokyo and Dordrecht. 2
35 Hsu, T.-S., and R.L. McPherron (2007), A statistical study of the relation of Pi 2 and plasma flows in the tail, J. Geophys. Res., 112(A5), Hsu, T., and R.L. McPherron (2002), An evaluation of the statistical significance of the association between northward turnings of the interplanetary magnetic field and substorm expansion onsets, Journal of Geophysical Research, 107(A11), SMP 31-1-SMP Hsu, T.S., and R.L. McPherron (2003), Occurrence frequencies of IMF triggered and nontriggered substorms, Journal of Geophysical Research, 108(A7), 19 pp, Hubert, B., C. Blockx, S.E. Milan, and S.W.H. Cowley (2009), Statistical properties of flux closure induced by solar wind dynamic pressure fronts, Journal of Geophysical Research, 114(A7), Hubert, B., S.E. Milan, A. Grocott, C. Blockx, S.W.H. Cowley, J.-C. Gé, and rard (2006), Dayside and nightside reconnection rates inferred from IMAGE FUV and Super Dual Auroral Radar Network data, Journal of Geophysical Research, 111(A3), Hubert, B., S.E. Milan, A. Grocott, S.W.H. Cowley, J.C. Gé, and rard (2008), Open magnetic flux and magnetic flux closure during sawtooth events, Geophys. Res. Lett., 35(23), 1-6. Lui, A. (1991), A Synthesis of Magnetospheric Substorm Models, Journal of Geophysical Research, 96(A2), Lui, A.T.Y., R.E. Lopez, S.M. Krimigis, R.W. McEntire, L.J. Zanetti, and T.A. Potemra (1988), A case study of magnetotail current sheet disruption and diversion, Geophysical Research Letters, 15(7), Lui, A.T.Y., A. Mankofsky, C.L. Chang, K. Papadopoulos, and C.S. Wu (1990), A current disruption mechanism in the neutral sheet: a possible trigger for substorm expansions, Geophysical Research Letters, 17(6), Lui, A.T.Y. (1996), Current disruption in the Earth's magnetosphere: Observations and models, Journal of Geophysical Research, 101(A6), , doi: /96ja McPherron, R., C. Russell, and M. Aubry (1973), 9. Phenomenological Model for Substorms, J. Geophys. Res., 78(16), McPherron, R.L., J.M. Weygand, and H. Tung-Shin (2008), Response of the Earth's magnetosphere to changes in the solar wind, Journal of Atmospheric and Solar- Terrestrial Physics, 70(2-4), Milan, S.E., P.D. Boakes, and B. Hubert (2008), Response of the expanding/contracting polar cap to weak and strong solar wind driving: Implications for substorm onset, Journal of Geophysical Research, 113(A9), Milan, S.E., M. Lester, S.W.H. Cowley, K. Oksavik, M. Brittnacher, R.A. Greenwald, G. Sofko, and J.P. Villain (2003), Variations in the polar cap area during two substorm cycles, Annales Geophysicae, 21(5), Milan, S.E., G. Provan, and B. Hubert (2007), Magnetic flux transport in the Dungey cycle: A survey of dayside and nightside reconnection rates, Journal of Geophysical Research, 112(A1), Nakamura, R., W. Baumjohann, B. Klecker, Y. Bogdanova, A. Balogh, H. Rè, me, J.M. Bosqued, I. Dandouras, J.A. Sauvaud, K.-H. Glassmeier, L. Kistler, C. Mouikis, T.L. Zhang, H. Eichelberger, and A. Runov (2002), Motion of the 3
36 dipolarization front during a flow burst event observed by Cluster, Geophys. Res. Lett., 29(20), , doi: /2002gl Nakamura, R., W. Baumjohann, C. Mouikis, L.M. Kistler, A. Runov, M. Volwerk, Y. Asano, Z. Voros, T.L. Zhang, B. Klecker, A. Balogh, and H. Reme (2005), Multipoint observation of the high-speed flows in the plasma sheet, Advances in Space Research, 36(8), Nishida, A., and N. Nagayama (1973), Synoptic Survey for the Neutral Line in the Magnetotail during the Substorm Expansion Phase, Journal of Geophysical Research, 78(19), Ohtani, S., F. Creutzberg, T. Mukai, H. Singer, A. Lui, M. Nakamura, P. Prikryl, K. Yumoto, and G. Rostoker (1999), Substorm onset timing: The December 31, 1995, event, Journal of Geophysical Research, 104(A10), , doi: /1999ja Ohtani, S., R. Yamaguchi, H. Kawano, F. Creutzberg, J.B. Sigwarth, L.A. Frank, and T. Mukai (2002a), Does the braking of the fast plasma flow trigger a substorm?: A study of the August 14, 1996, event, Geophys. Res. Lett., 29(15). Ohtani, S.I., R. Yamaguchi, M. Nose, H. Kawano, M. Engbretson, and K. Yumoto (2002b), Quiet time magnetotail dynamics and their implications for the substorm trigger, Journal of Geophysical Research, 107(A2). Ohtani, S. (2004), Flow bursts in the plasma sheet and auroral substorm onset: observational constraints on connection between midtail and near-earth substorm processes, Space Science Reviews, 113(1-2), Ohtani, S., M.A. Shay, and T. Mukai (2004), Temporal structure of the fast convective flow in the plasma sheet: Comparison between observations and two-fluid simulations, Journal of Geophysical Research, 109(A3), Ohtani, S., H.J. Singer, and T. Mukai (2006), Effects of the fast plasma sheet flow on the geosynchronous magnetic configuration: Geotail and GOES coordinated study, Journal of Geophysical Research, 111(A1), Ohtani, S., Y. Miyashita, H. Singer, and T. Mukai (2009), Tailward flows with positive B Z in the near-earth plasma sheet, Journal of Geophysical Research, 114(A6), Prichard, D., J. Borovsky, P. Lemons, and C. Price (1996), Time dependence of substorm recurrence: An information-theoretic analysis, Journal of Geophysical Research, 101(A7), Pytte, T., R. McPherron, E.H. Jr., and H.W. Jr. (1978), Multiple-Satellite Studies of Magnetospheric Substorms: Distinction Between Polar Magnetic Substorms and Convection-Driven Negative Bays, Journal of Geophysical Research, 83(A2), , doi: /ja083ia02p Rostoker, G. (1968), Macrostructure of Geomagnetic Bays, Journal of Geophysical Research, 73(13), Rostoker, G., and J.C. Samson (1981), Polarization characteristics of Pi 2 pulsations and implications for their source mechanisms: location of source regions with respect to the auroral electrojects, Planetary and Space Science, 29(2), Runov, A., V. Angelopoulos, M.I. Sitnov, V.A. Sergeev, J. Bonnell, J.P. McFadden, D. Larson, K.-H. Glassmeier, and U. Auster (2009), THEMIS observations of an 4
37 earthward-propagating dipolarization front, Geophys. Res. Lett., 36(14), 1-7, doi: /2009gl Sergeev, V.A., R.J. Pellinen, and T.I. Pulkkinen (1996), Steady magnetospheric convection: a review of recent results, Space Science Reviews, 75(3-4), Sergeev, V., M. Shukhtina, R. Rasinkangas, A. Korth, G. Reeves, H. Singer, M. Thomsen, and L. Vagina (1998), Event study of deep energetic particle injections during substorm, Journal of Geophysical Research, 103(A5), , doi: /97ja Shiokawa, K., W. Baumjohann, and G. Haerendel (1997), Braking of High-Speed Flows in the near-earth Tail, Geophys. Res. Lett., 24(10), Shiokawa, K., W. Baumjohann, and G. Haerendel, (1998a), Braking the high-speed flow and azimuthal pressure gradient as driving forces of substorm currents, in Poceedings of ICS-4. Shiokawa, K., W. Baumjohann, G. Haerendel, G. Paschmann, J. Fennell, E. Friis- Christensen, H. Lü, hr, G. Reeves, C. Russell, P. Sutcliffe, and K. Takahashi (1998b), High-speed ion flow, substorm current wedge, and multiple Pi 2 pulsations, Journal of Geophysical Research, 103(A3), Shiokawa, K., G. Haerendel, and W. Baumjohann (1998c), Azimuthal Pressure Gradient as Driving Force of Substorm Currents, Geophys. Res. Lett., 25(7), Taguchi, S., J. Slavin, M. Kiyohara, M. Nose, G. Reeves, and R. Lepping (1998), Temporal relationship between midtail traveling compression regions and substorm onset: Evidence for near-earth neutral line formation in the late growth phase, Journal of Geophysical Research, 103(A11), , doi: /98ja Voronkov, I.O., E.F. Donovan, and J.C. Samson (2003), Observations of the phases of the substorm, Journal of Geophysical Research, 108(A2), SMP Walker, R.J., M. Ashour-Abdalla, M.E. Alaoui, and F.V. Coroniti (2006), Magnetospheric convection during prolonged intervals with southward interplanetary magnetic field, J. Geophys. Res., 111(A10), Weins, R.G., and G. Rostoker (1975), Characteristics of the development of the westward electrojet during the expansive phase of magnetospheric substorms, J. Geophys. Res., 80(16), Weimer, D. (1994), Substorm Time Constants, J. Geophys. Res., 99(A6), Wiltberger, M., T. Pulkkinen, J. Lyon, and C. Goodrich (2000), MHD simulation of the magnetotail during the December 10, 1996, substorm, Journal of Geophysical Research, 105(A12), Zesta, E., L. Lyons, and E. Donovan (2000), The Auroral Signature of Earthward Flow Bursts Observed in the Magnetotail, Geophys. Res. Lett., 27(20),
38 10 Figure Captions Figure 1. A plot of AE indices and quantities derived from them. The top panel displays the AE and AU indices with black asterisks showing points that satisfy the SMC criteria. The second panel shows the rectified filtered derivative of AL and the AL index. Red asterisks show AL values satisfying the SMC criterion. Black asterisks indicate that d(al)/dt is not satisfied. The third panel shows the ratio of the running standard deviation to the running mean. Red asterisks denote possible SMC intervals. The bottom panel is a running count in a 90-minute window of the number of times all SMC criteria are satisfied. Black asterisks denote times of possible SMC as does the vertical patch which was determined automatically by the program. Vertical dashed black lines indicate possible substorm expansion onsets. Figure 2. This shows a plot of 3-second resolution gsm Vperpx in top panel and gsm Bz in bottom panel. The AL index at 1-minute time resolution is overlain with its scale at right. The first vertical dashed line defines the onset of the first flow burst in this sequence and in this case the start of dipolarization. The sharp break in the AL index is closely associated with the first flow burst. Note this ~600 nt negative bay lasts only 8 minutes. Figure 3. Cumulative probability distributions showing the probability that a given 3- second sample of the x-component of the ion velocity perpendicular to the magnetic field exceeds the value shown on the abscissa. The blue line with "x" is for earthward flow samples and the red line with "o" is for tailward flows. The vertical dashed line shows the threshold used to define "fast flow". Figure 4. The cdfs of the duration of earthward and tailward ion flows at Themis D is shown. The line of blue "x" is for earthward flows and is approximated by an exponential with e-folding times of ~59 seconds. The line of red "o" is for tailward flow and has an e- folding time of ~25 s. Figure 5. A superposed epoch analysis of Vperpx is presented as a dynamic cdf. Contour lines and changes in color are drawn at deciles of the cdf. Quartiles are shown by the heavy lines. The time of peak tailward flow was used as epoch zero. Note that a peak in earthward flow typically occurs four minutes before the tailward flow. Figure 6. A dynamic cdf of the gsm-bz component at Themis D using the time of the peak in Vperpx as epoch zero is presented. The decile lines show that Bz generally increases by about 5 nt in association with a peak in ion flow. Figure 7. The peak earthward flow velocities at all five Themis spacecraft are shown for every event for which Vx (not Vperpx) at one or more spacecraft exceeds the threshold of Vx > 150 km/s. Decile lines are shown for bins along the gsm X axis. From about 22 Re inward the lines indicate nearly constant velocity, but inside of 12 Re the speed rapidly decreases to zero by 6 Re. Figure 8. The probability of Themis D observing a fast flow event (Vperpx >150 km/s) is presented. The top left panel is the probability density function (pdf) for observation of earthward flows (blue x) and tailward flows (red o) in 0.1 Re bins as a function of radial distance from the Earth. The top right panel is the pdf for the time the spacecraft spent in 6
39 each radial bin. The bottom panel displays the probability of observing earthward and tailward flows normalized by the time spent in each radial bin. Figure 9. The local time (LT) distribution of fast flows is presented in the same format as in Figure 8. The pdfs in the upper left show the local time distribution of the two types of flows. In addition the grey dash-dot line shows the pdf for the local time occurrence of auroral onsets in Image data. The pdf in the upper right shows the time the spacecraft spent in each LT bin during the study interval. The lower panel presents the probability of the two flow types as a function of local time. Figure 10. Fast flow vectors in 1-Re square bins were averaged and the vector plotted at the center of the bin. The left panel displays averages for 273 earthward flows and the right panel shows averages for 42 tailward flows. The scale for velocity is shown in upper right of each panel. The grey dotted radial lines are the range of most frequent flows (21-01 LT) and the center grey dashed lines are the center of the two flow distributions. Figure 11. Properties of Themis D flow measurements as a function of local time and radial distance are presented. The top panel shows the radial component (positive outward) of all flow measurements as a function of radial distance. Different traces correspond to different local times as explained in the text. The middle panel shows the azimuthal component (positive toward dawn) versus radial distance and local time. The bottom panel presents the azimuthal flow angle of only those flows having a gsm equatorial component exceeding 100 km/s. Positive angles are flow towards dawn. Figure 12. The dynamic cdf of the rectified solar wind electric field (Es = VBs) is shown here for the 279 earthward flow events. Positive Es corresponds to southward IMF Bz. Epoch zero is the time of peak fast flow at Themis D. Intervals of northward IMF (Es=0) are included in the cdf so many deciles have collapsed onto the base line. Figure 13. The pdfs for the delay between the onset time of a flow burst in Vperpx and an AL onset are shown. The blue curve with "x" is for an initial list of onsets and all fast flows. The red curve with "o" is for a refined list using only the time of the first flow burst in a sequence of flow bursts. Annotations on the left and right show properties of these distributions. Figure 14. Superposed epoch analysis of the AL index for 173 fast earthward flow events selected from a list of 279 by the restriction that they are the first flow burst in a sequence of bursts. Epoch zero is the start of the first flow burst. Figure 15. A superposed epoch analysis for a list of 94 steady magnetospheric convection (SMC) events during the December 1, 2007-June 30, 2008 interval when Themis D passed through the tail. Epoch zero was taken as the apparent start time of the SMC which by definition lasts for 90 minutes or longer. Figure 16. A superposed epoch analysis of Vperpx with epoch zero defined by the start time of 74 SMC events. The presence of flow is only evident at the 1% level. More flows are seen before than during the SMC. 7
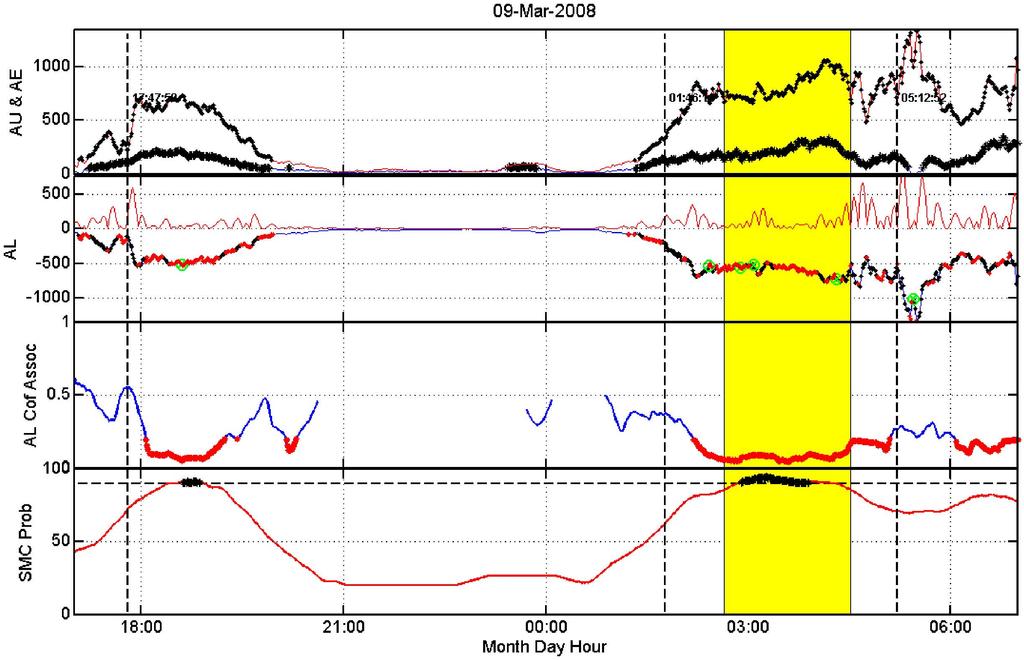
40
41
42
43

44

45
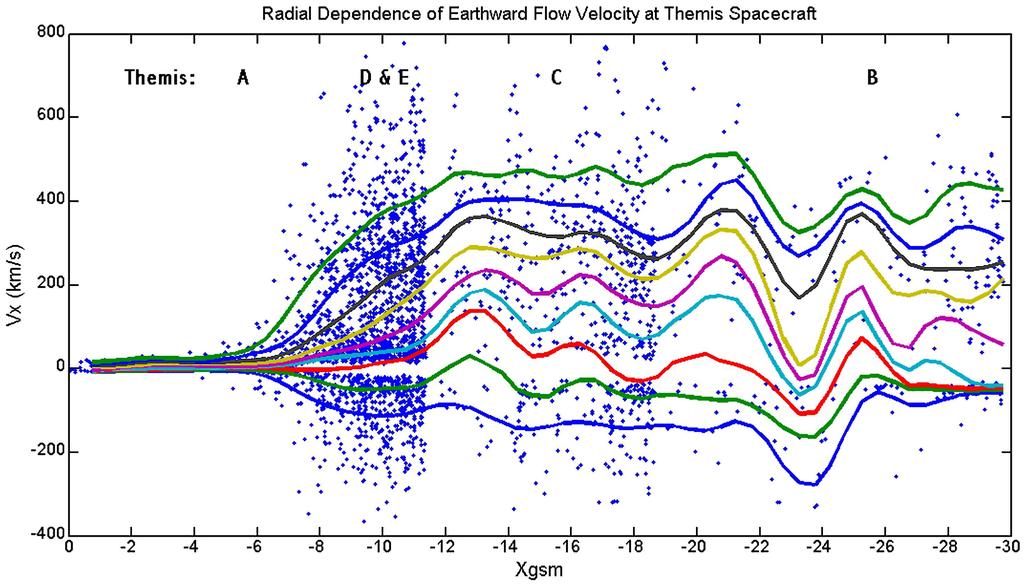
46
47
48
49
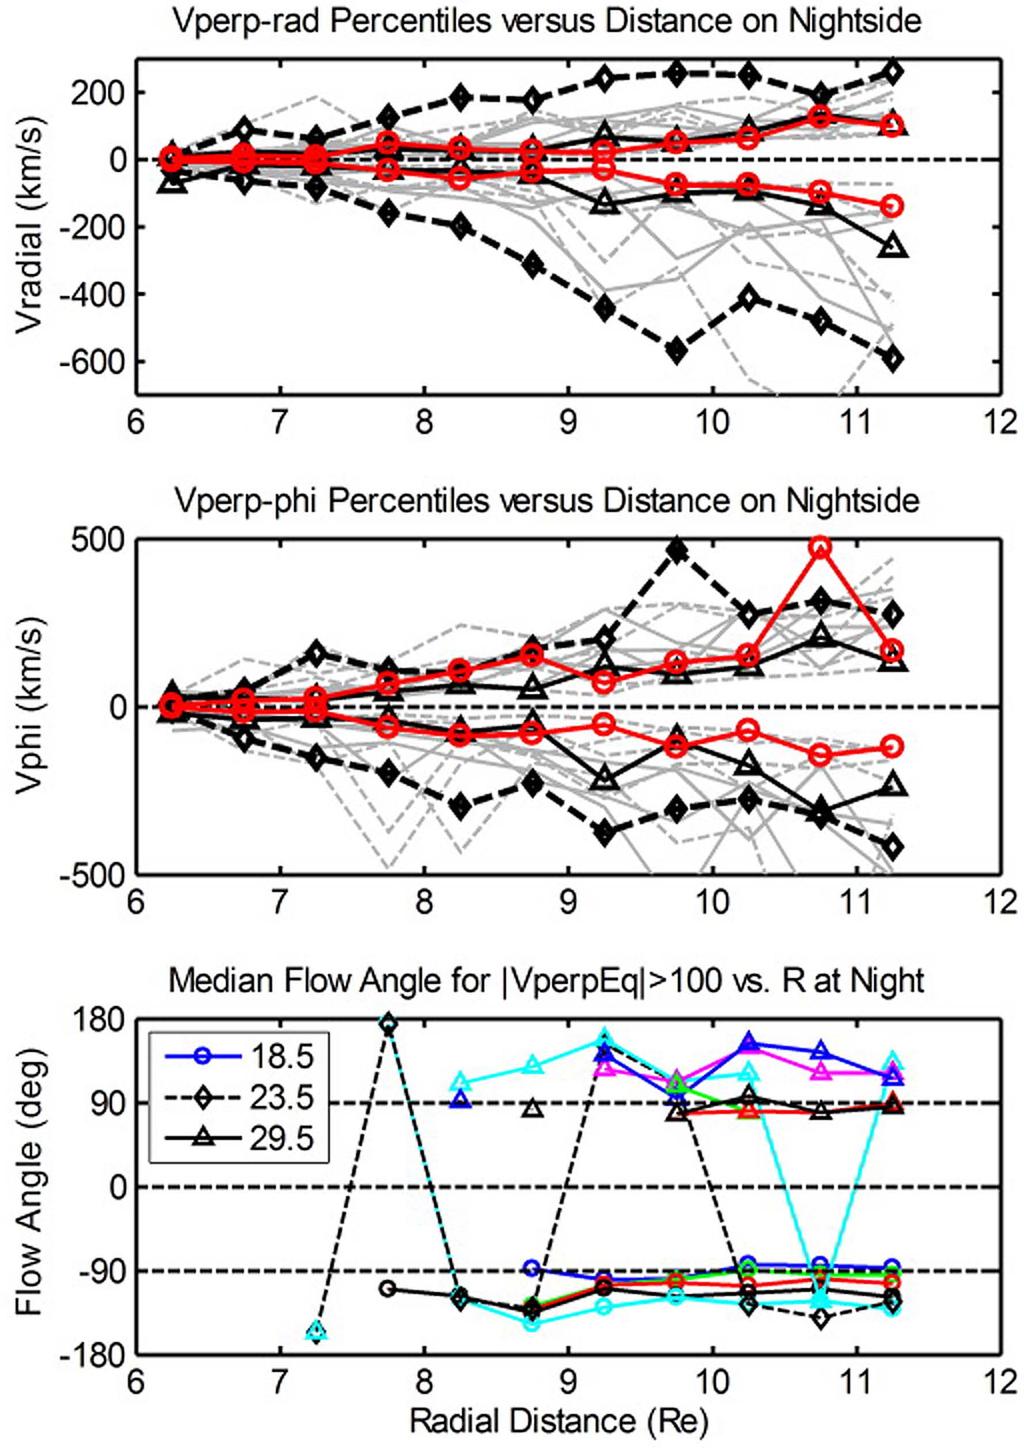
50

51
52
53

54
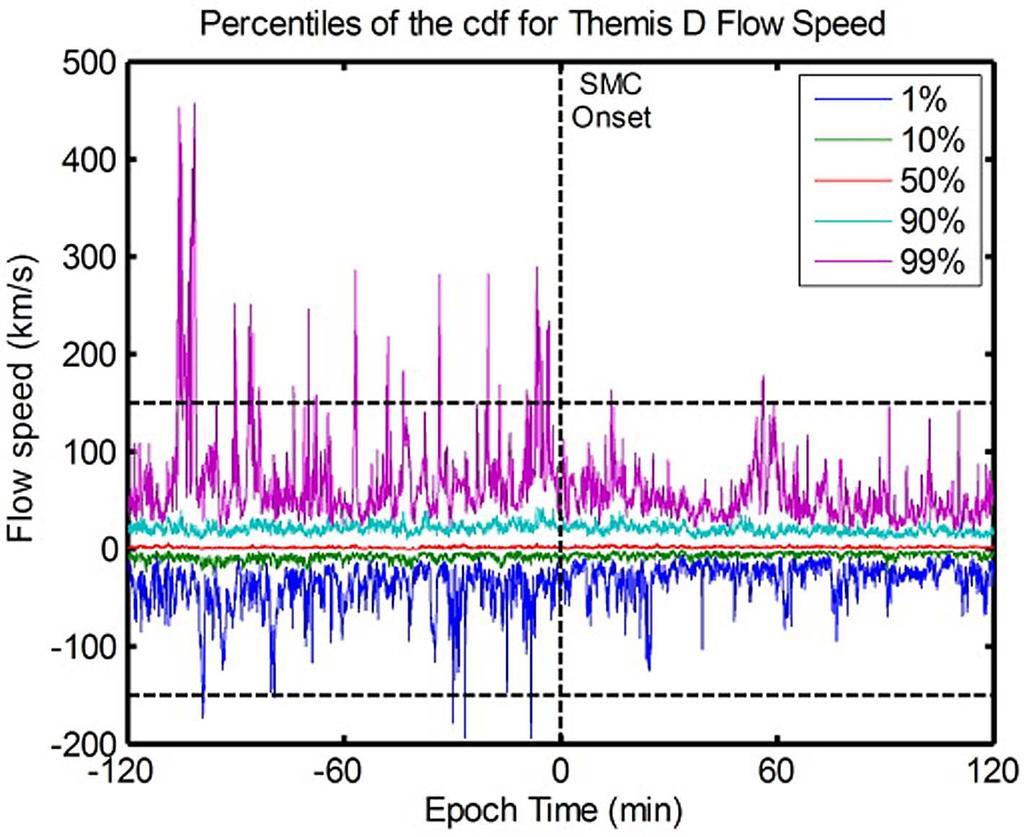
55
Planned talk schedule. Substorm models. Reading: Chapter 9 - SW-Magnetospheric Coupling from Russell book (posted)
") Reading: Chapter 9 - SW-Magnetospheric Coupling from Russell book (posted) Today: Example of dynamics/time variation Review of intro to auroral substorms Substorm models How do we know a substorm is occurring?
Reading: Chapter 9 - SW-Magnetospheric Coupling from Russell book (posted) Today: Example of dynamics/time variation Review of intro to auroral substorms Substorm models How do we know a substorm is occurring?
DYNAMICS OF THE EARTH S MAGNETOSPHERE
 DYNAMICS OF THE EARTH S MAGNETOSPHERE PROF JIM WILD j.wild@lancaster.ac.uk @jim_wild With thanks to: Stan Cowley, Rob Fear & Steve Milan OUTLINE So far: Dungey cycle - the stirring of the magnetosphere
Time Series of Images of the Auroral Substorm
 ESS 7 Lecture 13 October 27, 2010 Substorms Time Series of Images of the Auroral Substorm This set of images in the ultra-violet from the Polar satellite shows changes that occur during an auroral substorm.
Auroral Disturbances During the January 10, 1997 Magnetic Storm
 Auroral Disturbances During the January 10, 1997 Magnetic Storm L. R. Lyons and E. Zesta J. C. Samson G. D. Reeves Department of Atmospheric Sciences Department of Physics NIS-2 Mail Stop D436 University
What determines when and where reconnection begins
 What determines when and where reconnection begins Robert L. McPherron Invited presentation at Unsolved Problems in Magnetospheric Physics, Scarborough, UK, Sept. 6-12. Factors That Might Affect Tail Reconnection
Multipoint observations of substorm pre-onset flows and time sequence in the ionosphere and magnetosphere
 JOURNAL OF GEOPHYSICAL RESEARCH, VOL. 117,, doi:10.1029/2011ja017185, 2012 Multipoint observations of substorm pre-onset flows and time sequence in the ionosphere and magnetosphere Yong Shi, 1 Eftyhia
Simultaneous observations of ionospheric flow and tail reconnection signatures during the substorm expansion phase.
 Simultaneous observations of ionospheric flow and tail reconnection signatures during the substorm expansion phase. M. Lester 1, M. Parkinson 2, J.A. Wild 1, S.E. Milan 1, T. Nagai 3, K.A. McWilliams 4,
1 Introduction. Cambridge University Press Physics of Space Plasma Activity Karl Schindler Excerpt More information
 1 Introduction Space plasma phenomena have attracted particular interest since the beginning of the exploration of space about half a century ago. Already a first set of pioneering observations (e.g.,
Geomagnetic signatures of auroral substorms preceded by pseudobreakups
 JOURNAL OF GEOPHYSICAL RESEARCH, VOL. 114,, doi:10.1029/2008ja013712, 2009 Geomagnetic signatures of auroral substorms preceded by pseudobreakups A. Kullen, 1 S. Ohtani, 2 and T. Karlsson 3 Received 29
Fast flow, dipolarization, and substorm evolution: Cluster/Double Star multipoint observations
 197 Fast flow, dipolarization, and substorm evolution: /Double Star multipoint observations R. Nakamura, T. Takada, W. Baumjohann, M. Volwerk, T. L. Zhang, Y. Asano, A. Runov, Z. Vörös, E. Lucek, C. Carr,
Interplanetary Conditions. L. R. Lyons. Department of Atmospheric Sciences. University of California, Los Angeles. Los Angeles, CA
 Geomagnetic Disturbances: Characteristics of, Distinction Between Types, and Relations to Interplanetary Conditions by L. R. Lyons Department of Atmospheric Sciences University of California, Los Angeles
Flux transport, dipolarization, and current sheet evolution during a double onset substorm
 JOURNAL OF GEOPHYSICAL RESEARCH, VOL. 116,, doi:10.1029/2010ja015865, 2011 Flux transport, dipolarization, and current sheet evolution during a double onset substorm R. Nakamura, 1 W. Baumjohann, 1 E.
Magnetospheric Currents at Quiet Times
 Magnetospheric Currents at Quiet Times Robert L. McPherron Institute of Geophysics and Planetary Physics University of California Los Angeles Los Angeles, CA 90095-1567 e-mail: rmcpherron@igpp.ucla.edu
STUDY ON RELATIONSHIP OF MAGNETOSPHERIC SUBSTORM AND MAGNETIC STORM
 Prosiding Seminar Nasional Penelitian, Pendidikan dan Penerapan MIPA Fakultas MIPA, Universitas Negeri Yogyakarta, 16 Mei 2009 STUDY ON RELATIONSHIP OF MAGNETOSPHERIC SUBSTORM AND MAGNETIC STORM L. Muhammad
Relation of substorm disturbances triggered by abrupt solar-wind changes to physics of plasma sheet transport
 1 Relation of substorm disturbances triggered by abrupt solar-wind changes to physics of plasma sheet transport L. R. Lyons, D.-Y. Lee, C.-P. Wang, and S. B. Mende 1. Introduction Abstract: Substorm onset
The Structure of the Magnetosphere
 The Structure of the Magnetosphere The earth s magnetic field would resemble a simple magnetic dipole, much like a big bar magnet, except that the solar wind distorts its shape. As illustrated below, the
This is an electronic reprint of the original article. This reprint may differ from the original in pagination and typographic detail.
 Powered by TCPDF (www.tcpdf.org) This is an electronic reprint of the original article. This reprint may differ from the original in pagination and typographic detail. Pulkkinen, Tuija; Partamies, N; Kissinger,
Substorms, Storms, and the Near-Earth Tail. W. BAUMJOHANN* Y. KAMIDE, and R.. NAKAMURA
 J. Geomag. Geoelectr., 48, 177-185, 1996 Substorms, Storms, and the Near-Earth Tail W. BAUMJOHANN* Y. KAMIDE, and R.. NAKAMURA Solar-Terrestrial Environment Laboratory, Nagoya University, Toyokawa 442,
Substorm Current Wedge Revisited
 Space Sci Rev (2015) 190:1 46 DOI 10.1007/s11214-014-0124-9 Substorm Current Wedge Revisited L. Kepko R.L. McPherron O. Amm S. Apatenkov W. Baumjohann J. Birn M. Lester R. Nakamura T.I. Pulkkinen V. Sergeev
Relative timing of substorm onset phenomena
 JOURNAL OF GEOPHYSICAL RESEARCH, VOL. 109,, doi:10.1029/2003ja010285, 2004 Relative timing of substorm onset phenomena L. Kepko Center for Space Physics, Boston University, Boston, Massachusetts, USA M.
Time history effects at the magnetopause: Hysteresis in power input and its implications to substorm processes
 219 Time history effects at the magnetopause: Hysteresis in power input and its implications to substorm processes M. Palmroth, T. I. Pulkkinen, T. V. Laitinen, H. E. J. Koskinen, and P. Janhunen 1. Introduction
Overcoming Uncertainties in the Relation between Source and Aurora
 Unsolved Problems in Magnetospheric Physics Scarborough, UK, 06-12 September 2015 Overcoming Uncertainties in the Relation between Source and Aurora Gerhard Haerendel Max Planck Institute for Extraterrestrial
The Two-Dimensional Structure of Auroral Poleward Boundary Intensifications (PBI)
") The Two-Dimensional Structure of Auroral Poleward Boundary Intensifications (PBI) E. Zesta 1, E. Donovan 2, L. Lyons 1, G. Enno 2, J. S. Murphree 2, and L. Cogger 2 1 Department of Atmospheric Sciences,
The Two-Dimensional Structure of Auroral Poleward Boundary Intensifications (PBI) E. Zesta 1, E. Donovan 2, L. Lyons 1, G. Enno 2, J. S. Murphree 2, and L. Cogger 2 1 Department of Atmospheric Sciences,
Global morphology of substorm growth phases observed by the IMAGE-SI12 imager
 JOURNAL OF GEOPHYSICAL RESEARCH, VOL. 112,, doi:10.1029/2007ja012329, 2007 Global morphology of substorm growth phases observed by the IMAGE-SI12 imager V. Coumans, 1 C. Blockx, 1 J.-C. Gérard, 1 B. Hubert,
Magnetic flux in the magnetotail and polar cap during sawteeth, isolated substorms, and steady magnetospheric convection events
 JOURNAL OF GEOPHYSICAL RESEARCH, VOL. 114,, doi:10.1029/2009ja014232, 2009 Magnetic flux in the magnetotail and polar cap during sawteeth, isolated substorms, and steady magnetospheric convection events
The Substorm. Eric Donovan. Department of Physics and Astronomy University of Calgary
 The Substorm Department of Physics and Astronomy University of Calgary 1. Brief statement as to why the aurora is important here 2. Modes of the Magnetosphere (driven, normal, instability) 3. The substorm
Occurrence and properties of substorms associated with pseudobreakups
 JOURNAL OF GEOPHYSICAL RESEARCH, VOL. 115,, doi:10.1029/2010ja015866, 2010 Occurrence and properties of substorms associated with pseudobreakups A. Kullen, 1 T. Karlsson, 1 J. A. Cumnock, 1,2 and T. Sundberg
MODELING PARTICLE INJECTIONS TEST PARTICLE SIMULATIONS. Xinlin Li LASP, University of Colorado, Boulder, CO , USA
 1 MODELING PARTICLE INJECTIONS TEST PARTICLE SIMULATIONS Xinlin Li LASP, University of Colorado, Boulder, CO 80303-7814, USA ABSTRACT We model dispersionless injections of energetic particles associated
Relation of Substorm Breakup Arc to other Growth-Phase Auroral Arcs
 Relation of Substorm Breakup Arc to other Growth-Phase Auroral Arcs by L. R. Lyons Department of Atmospheric Sciences University of California, Los Angeles Los Angeles, CA 90095-1565 I. O. Voronkov Dept.
Response of the Earth s magnetosphere and ionosphere to the small-scale magnetic flux rope in solar wind by the MHD simulation
 Response of the Earth s magnetosphere and ionosphere to the small-scale magnetic flux rope in solar wind by the MHD simulation Kyung Sun Park 1, Dae-Young Lee 1, Myeong Joon Kim 1, Rok Soon Kim 2, Kyungsuk
Substorm onset dynamics in the magnetotail as derived from joint TC-1 and Cluster data analysis
 Earth Planets Space, 60, 613 621, 2008 Substorm onset dynamics in the magnetotail as derived from joint TC-1 and Cluster data analysis H. Wang 1,3,H.Lühr 2,S.Y.Ma 1, and A. J. Ridley 3 1 College of Electronic
Two-dimensional structure of auroral poleward boundary intensifications
 JOURNAL OF GEOPHYSICAL RESEARCH, VOL. 107, NO. A11, 1350, doi:10.1029/2001ja000260, 2002 Two-dimensional structure of auroral poleward boundary intensifications E. Zesta, 1 E. Donovan, 2 L. Lyons, 1 G.
A comparison of substorms occurring during magnetic storms with those occurring during quiet times
 JOURNAL OF GEOPHYSICAL RESEARCH, VOL. 107, NO. A9, 1259, doi:10.1029/2001ja002008, 2002 A comparison of substorms occurring during magnetic storms with those occurring during quiet times R. L. McPherron
TAIL RECONNECTION AND PLASMA SHEET FAST FLOWS
 1 TAIL RECONNECTION AND PLASMA SHEET FAST FLOWS Rumi Nakamura, Wolfgang Baumjohann, Andrei Runov, and Yoshihiro Asano Space Research Institute, Austrian Academy of Sciences, Schmiedlstr. 6, A 8042 Graz,
Magnetic dipolarization with substorm expansion onset
 JOURNAL OF GEOPHYSICAL RESEARCH, VOL. 107, NO. A7, 1131, 10.1029/2001JA000179, 2002 Magnetic dipolarization with substorm expansion onset K. Liou, C.-I. Meng, A. T. Y. Lui, P. T. Newell, and S. Wing Applied
A statistical study of the relation of Pi 2 and plasma flows in the tail
 Click Here for Full Article JOURNAL OF GEOPHYSICAL RESEARCH, VOL. 112,, doi:10.1029/2006ja011782, 2007 A statistical study of the relation of Pi 2 and plasma flows in the tail Tung-Shin Hsu 1 and R. L.
Tokyo Institute of Technology Ookayama , Meguro Tokyo , Japan Yoshinodai, Sagamihara Kanagawa , Japan
 Structured Currents Associated with Tail Bursty Flows During Turbulent Plasma Sheet Conditions by L. R. Lyons1, T. Nagai2, J. C. Samson3, E. Zesta1, T. Yamamoto4, T, Mukai4, A. Nishida4,, S. Kokubun5 1Department
The Solar wind - magnetosphere - ionosphere interaction
 The Solar wind - magnetosphere - ionosphere interaction Research seminar on Sun-Earth connections Eija Tanskanen Friday January 27, 2006 12-14 a.m., D115 Outline 1. Basics of the Earth s magnetosphere
Simultaneous THEMIS in situ and auroral observations of a small substorm
 Simultaneous THEMIS in situ and auroral observations of a small substorm E. Donovan (1), W. Liu (2), J. Liang (2), E. Spanswick (1), I. Voronkov (3), M. Connors (3), M. Syrjäsuo (4), G. Baker (1), B. Jackel
Solar-wind control of plasma sheet dynamics
 Ann. Geophys., 33, 845 855, 215 www.ann-geophys.net/33/845/215/ doi:1.5194/angeo-33-845-215 Author(s) 215. CC Attribution 3. License. Solar-wind control of plasma sheet dynamics M. Myllys 1, E. Kilpua
MSSL. Magnetotail Science with Double Star and Cluster
 Magnetotail Science with Double Star and Cluster A.N. Fazakerley 1, A. Marchaudon 1, I. Alexeev 1, C.J. Owen 1, C. M. Carr 2, E. Lucek 2, H Reme 3, J. Watermann 4, G.A. Abel 5 1 :, 2 : ICSTM, 3 : CESR,
Convection dynamics and driving mechanism of a small substorm during dominantly IMF By+, Bz+ conditions
 GEOPHYSICAL RESEARCH LETTERS, VOL. 31, L08803, doi:10.1029/2003gl018878, 2004 Convection dynamics and driving mechanism of a small substorm during dominantly IMF By+, Bz+ conditions Jun Liang, 1 G. J.
РС INDEX AS INDICATOR OF THE SOLAR WIND ENERGY ENTERED INTO THE MAGNETOSPHERE: RELATION TO INTERPLANETARY ELECTRIC FIELD AND MAGNETIC DISTURBANCES
 РС INDEX AS INDICATOR OF THE SOLAR WIND ENERGY ENTERED INTO THE MAGNETOSPHERE: RELATION TO INTERPLANETARY ELECTRIC FIELD AND MAGNETIC DISTURBANCES О. A.Troshichev Arctic and Antarcrtic Research Institute,
THEMIS observations of an earthward-propagating dipolarization front
 Click Here for Full Article GEOPHYSICAL RESEARCH LETTERS, VOL. 36, L14106, doi:10.1029/2009gl038980, 2009 THEMIS observations of an earthward-propagating dipolarization front A. Runov, 1 V. Angelopoulos,
Storm-time convection electric field in the near-earth plasma sheet
 JOURNAL OF GEOPHYSICAL RESEARCH, VOL. 11, A4213, doi:1.129/24ja1449, 25 Storm-time convection electric field in the near-earth plasma sheet T. Hori, 1 A. T. Y. Lui, S. Ohtani, P. C:son Brandt, B. H. Mauk,
Revised timing and onset location of two isolated substorms observed by Time History of Events and Macroscale Interactions During Substorms (THEMIS)
") JOURNAL OF GEOPHYSICAL RESEARCH, VOL. 116,, doi:10.1029/2010ja015877, 2011 Revised timing and onset location of two isolated substorms observed by Time History of Events and Macroscale Interactions During
JOURNAL OF GEOPHYSICAL RESEARCH, VOL. 116,, doi:10.1029/2010ja015877, 2011 Revised timing and onset location of two isolated substorms observed by Time History of Events and Macroscale Interactions During
Introduction to the Sun-Earth system Steve Milan
 Introduction to the Sun-Earth system Steve Milan steve.milan@ion.le.ac.uk The solar-terrestrial system Corona is so hot that the Sun s gravity cannot hold it down it flows outwards as the solar wind A
Dependence of plasma sheet energy fluxes and currents on solar wind-magnetosphere coupling
 JOURNAL OF GEOPHYSICAL RESEARCH, VOL. 117,, doi:10.1029/2012ja017995, 2012 Dependence of plasma sheet energy fluxes and currents on solar wind-magnetosphere coupling Richard L. Kaufmann 1 Received 4 June
Magnetic Reconnection
 Magnetic Reconnection? On small scale-lengths (i.e. at sharp gradients), a diffusion region (physics unknown) can form where the magnetic field can diffuse through the plasma (i.e. a breakdown of the frozenin
The Dynamic Magnetosphere. Ioannis A. Daglis. National Observatory of Athens, Greece
 310/1749-42 ICTP-COST-USNSWP-CAWSES-INAF-INFN International Advanced School on Space Weather 2-19 May 2006 The Dynamic Magnetosphere: Reaction to and Consequences of Solar Wind Variations Yannis DAGLIS
Earthward plasma sheet flows during substorm phases
 JOURNAL OF GEOPHYSICAL RESEARCH, VOL. 116,, doi:10.1029/2011ja016852, 2011 Earthward plasma sheet flows during substorm phases L. Juusola, 1,2 N. Østgaard, 1 E. Tanskanen, 1,2 N. Partamies, 2 and K. Snekvik
Observations of the phases of the substorm
 JOURNAL OF GEOPHYSICAL RESEARCH, VOL. 108, NO. A2, 1073, doi:10.1029/2002ja009314, 2003 Observations of the phases of the substorm I. O. Voronkov Department of Physics, University of Alberta, Edmonton,
Magnetotail response to prolonged southward IMF B z intervals: Loading, unloading, and continuous magnetospheric dissipation
 JOURNAL OF GEOPHYSICAL RESEARCH, VOL. 110,, doi:10.1029/2004ja010561, 2005 Magnetotail response to prolonged southward IMF B z intervals: Loading, unloading, and continuous magnetospheric dissipation E.
Relation of the auroral substorm to the substorm current wedge
 DOI 10.1186/s40562-016-0044-5 RESEARCH LETTER Open Access Relation of the auroral substorm to the substorm current wedge Robert L. McPherron * and Xiangning Chu Abstract The auroral substorm is an organized
Highly periodic stormtime activations observed by THEMIS prior to substorm onset
 GEOPHYSICAL RESEARCH LETTERS, VOL.???, XXXX, DOI:10.1029/, 1 2 Highly periodic stormtime activations observed by THEMIS prior to substorm onset L. Kepko, 1 J. Raeder, 1 V. Angelopoulos, 2 J. McFadden,
ESS 200C Aurorae. Lecture 15
 ESS 200C Aurorae Lecture 15 The record of auroral observations dates back thousands of years to Greek and Chinese documents. The name aurora borealis (latin for northern dawn) was coined in 1621 by P.
Relation of substorm breakup arc to other growth-phase auroral arcs
 JOURNAL OF GEOPHYSICAL RESEARCH, VOL. 107, NO. A11, 1390, doi:10.1029/2002ja009317, 2002 Relation of substorm breakup arc to other growth-phase auroral arcs L. R. Lyons, 1 I. O. Voronkov, 2 E. F. Donovan,
Crater FTEs: Simulation results and THEMIS observations
 Click Here for Full Article GEOPHYSICAL RESEARCH LETTERS, VOL. 35, L17S06, doi:10.1029/2008gl033568, 2008 Crater FTEs: Simulation results and THEMIS observations D. G. Sibeck, 1 M. Kuznetsova, 1 V. Angelopoulos,
Dynamics of the Jovian magnetosphere for northward interplanetary magnetic field (IMF)
") GEOPHYSICAL RESEARCH LETTERS, VOL. 32, L03202, doi:10.1029/2004gl021392, 2005 Dynamics of the Jovian magnetosphere for northward interplanetary magnetic field (IMF) Keiichiro Fukazawa and Tatsuki Ogino
GEOPHYSICAL RESEARCH LETTERS, VOL. 32, L03202, doi:10.1029/2004gl021392, 2005 Dynamics of the Jovian magnetosphere for northward interplanetary magnetic field (IMF) Keiichiro Fukazawa and Tatsuki Ogino
THEMIS observations of consecutive bursts of Pi2 pulsations: The 20 April 2007 event
 Click Here for Full Article JOURNAL OF GEOPHYSICAL RESEARCH, VOL. 114,, doi:10.1029/2008ja013538, 2009 THEMIS observations of consecutive bursts of Pi2 pulsations: The 20 April 2007 event C.-C. Cheng,
Solar-Wind/Magnetosphere Coupling
 Solar-Wind/Magnetosphere Coupling Joe Borovsky Space Science Institute --- University of Michigan 1. Get a feeling for how the coupling works 2. Get an understanding of how reconnection works 3. Look at
Response of the Earth s magnetosphere to changes in the solar wind
 Journal of Atmospheric and Solar-Terrestrial Physics ] (]]]]) ]]] ]]] www.elsevier.com/locate/jastp Response of the Earth s magnetosphere to changes in the solar wind Robert L. McPherron a,b,, James M.
This is the published version of a paper published in Geophysical Research Letters. Citation for the original published paper (version of record):
:") http://www.diva-portal.org This is the published version of a paper published in Geophysical Research Letters. Citation for the original published paper (version of record): Pitkänen, T., Hamrin, M., Norqvist,
http://www.diva-portal.org This is the published version of a paper published in Geophysical Research Letters. Citation for the original published paper (version of record): Pitkänen, T., Hamrin, M., Norqvist,
Geotail observations of magnetic flux ropes in the plasma sheet
 JOURNAL OF GEOPHYSICAL RESEARCH, VOL. 108, NO. A1, 1015, doi:10.1029/2002ja009557, 2003 Geotail observations of magnetic flux ropes in the plasma sheet J. A. Slavin, 1 R. P. Lepping, 1 J. Gjerloev, 1 D.
Ring current formation influenced by solar wind substorm conditions
 Click Here for Full Article JOURNAL OF GEOPHYSICAL RESEARCH, VOL. 115,, doi:10.1029/2009ja014909, 2010 Ring current formation influenced by solar wind substorm conditions M. D. Cash, 1 R. M. Winglee, 1
Pressure changes associated with substorm depolarization in the near Earth plasma sheet
 JOURNAL OF GEOPHYSICAL RESEARCH, VOL. 115,, doi:10.1029/2010ja015608, 2010 Pressure changes associated with substorm depolarization in the near Earth plasma sheet Y. Miyashita, 1 S. Machida, 2 A. Ieda,
Stormtime Dynamics of the Magnetosphere near Geosynchronous Altitudes
 Stormtime Dynamics of the Magnetosphere near Geosynchronous Altitudes William J. Burke 1, Meg A. Noah 2 and Jun Yang 2 4 November 214 1. Boston College/ISR 2. University of Massachusetts, Lowell Stormtime
Steady Magnetospheric Convection Selection Criteria: Implications of Global SuperDARN Convection Measurements
 GEOPHYSICAL RESEARCH LETTERS, VOL.???, XXXX, DOI:10.1029/, 1 2 3 Steady Magnetospheric Convection Selection Criteria: Implications of Global SuperDARN Convection Measurements K. A. McWilliams and J. B.
Stepwise feature of aurora during substorm expansion compared with the near Earth tail dipolarization: Possible types of substorm dynamics
 Click Here for Full Article JOURNAL OF GEOPHYSICAL RESEARCH, VOL. 115,, doi:10.1029/2009ja014572, 2010 Stepwise feature of aurora during substorm expansion compared with the near Earth tail dipolarization:
Magnetospheric currents during sawtooth events: Event-oriented magnetic field model analysis
 JOURNAL OF GEOPHYSICAL RESEARCH, VOL. 113,, doi:10.1029/2007ja012983, 2008 Magnetospheric currents during sawtooth events: Event-oriented magnetic field model analysis M. Kubyshkina, 1 T. I. Pulkkinen,
Relation of polar auroral arcs to magnetotail twisting and IMF rotation: a systematic MHD simulation study
 Annales Geophysicae (24) 22: 951 97 SRef-ID: 1432-576/ag/24-22-951 European Geosciences Union 24 Annales Geophysicae Relation of polar auroral arcs to magnetotail twisting and IMF rotation: a systematic
Highly periodic stormtime activations observed by THEMIS prior to substorm onset
 GEOPHYSICAL RESEARCH LETTERS, VOL. 35, L17S24, doi:10.1029/2008gl034235, 2008 Highly periodic stormtime activations observed by THEMIS prior to substorm onset L. Kepko, 1 J. Raeder, 1 V. Angelopoulos,
On the current sheets surrounding dipolarizing flux bundles in the magnetotail: The case for wedgelets
 JOURNAL OF GEOPHYSICAL RESEARCH: SPACE PHYSICS, VOL. 118, 2000 2020, doi:10.1002/jgra.50092, 2013 On the current sheets surrounding dipolarizing flux bundles in the magnetotail: The case for wedgelets
Electromagnetic Fields Inside the Magnetoshpere. Outline
 Electromagnetic Fields Inside the Magnetoshpere P. K. Toivanen Finnish Meteorological Institute, Space Research Outline Introduction to large-scale electromagnetic fields Magnetic field geometry Modelling
ARTICLE IN PRESS. Journal of Atmospheric and Solar-Terrestrial Physics
 Journal of Atmospheric and Solar-Terrestrial Physics 70 (2008) 2336 2345 Contents lists available at ScienceDirect Journal of Atmospheric and Solar-Terrestrial Physics journal homepage: www.elsevier.com/locate/jastp
Observation of two distinct cold, dense ion populations at geosynchronous orbit: local time asymmetry, solar wind dependence and origin
 European Geosciences Union 2006 Annales Geophysicae Observation of two distinct cold, dense ion populations at geosynchronous orbit: local time asymmetry, solar wind dependence and origin B. Lavraud 1,
Substorms: Externally Driven Transition to Unstable State a few Minutes Before Onset
 Substorms: Externally Driven Transition to Unstable State a few Minutes Before Onset L. R. Lyons 1, I. O Voronkov 2, J. M. Ruohoniemi 3, E. F. Donovan 4 1 Department of Atmospheric Sciences, University
Observations of plasma vortices in the vicinity of flow-braking: A case study
 1 3 Observations of plasma vortices in the vicinity of flow-braking: A case study 4 5 6 7 K. Keika 1,, R. Nakamura 1, M. Volwerk 1, V. Angelopoulos 3, W. Baumjohann 1, A. Retinò 1, M. Fujimoto 4, J. W.
GLOBAL AND LOCAL ESTIMATES OF THE CURRENT SHEET THICKNESS: CDAW-6
 Adv. Space Res. Vol. 13, No.4, ~. (4)85 (4)91, 1993 0273 1177/93$24.00 Printedin Great Britain. AM rights reserved. Copyright 01993 COSPAR GLOBAL AND LOCAL ESTIMATES OF THE CURRENT SHEET THICKNESS: CDAW-6
Magnetospherically-Generated Ionospheric Electric Fields
 Magnetospherically-Generated Ionospheric Electric Fields Stanislav Sazykin Rice University sazykin@rice.edu June 26, 2005 Sazykin--Ionospheric E-Fields--CEDAR Student Workshop 1 Overall Magnetospheric
PC index as a standard of magnetospheric disturbances in the auroral zone
 PC index as a standard of magnetospheric disturbances in the auroral zone Oleg Troshichev, Arctic and Antarcrtic Research Institute, St.Petersburg olegtro@aari.ru The Solar-Terrestrial Physics Symposium
Dynamic Harris current sheet thickness from Cluster current density and plasma measurements
 JOURNAL OF GEOPHYSICAL RESEARCH, VOL. 110,, doi:10.1029/2004ja010714, 2005 Dynamic Harris current sheet thickness from Cluster current density and plasma measurements S. M. Thompson, 1,2 M. G. Kivelson,
Modeling magnetospheric current response to solar wind dynamic pressure enhancements during magnetic storms: 2. Application to different storm phases
 JOURNAL OF GEOPHYSICAL RESEARCH, VOL. 113,, doi:10.1029/2008ja013420, 2008 Modeling magnetospheric current response to solar wind dynamic pressure enhancements during magnetic storms: 2. Application to
Planetary Magnetospheres
 1 Planetary Magnetospheres Vytenis M. Vasyliūnas Max-Planck-Institut für Sonnensystemforschung Heliophysics Summer School: Year 4 July 28 August 4, 2010 Boulder, Colorado July 23, 2010 Figure 1: Schematic
Chapter 8 Geospace 1
 Chapter 8 Geospace 1 Previously Sources of the Earth's magnetic field. 2 Content Basic concepts The Sun and solar wind Near-Earth space About other planets 3 Basic concepts 4 Plasma The molecules of an
Ion heating during geomagnetic storms measured using energetic neutral atom imaging. Amy Keesee
 Ion heating during geomagnetic storms measured using energetic neutral atom imaging Amy Keesee Outline Motivation Overview of ENA measurements Charge exchange MENA and TWINS ENA instruments Calculating
JOURNAL OF GEOPHYSICAL RESEARCH, VOL. 116, A04202, doi: /2010ja016371, 2011
 JOURNAL OF GEOPHYSICAL RESEARCH, VOL. 116,, doi:10.1029/2010ja016371, 2011 Relation between magnetotail magnetic flux and changes in the solar wind during sawtooth events: Toward resolving the controversy
Features of magnetosphere-ionosphere coupling during breakups and substorm onsets inferred from multi-instrument alignment
 Features of magnetosphere-ionosphere coupling during breakups and substorm onsets inferred from multi-instrument alignment I. Voronkov, A. Runov, A. Koustov, K. Kabin, M. Meurant, E. Donovan, C. Bryant,
David versus Goliath 1
 David versus Goliath 1 or A Comparison of the Magnetospheres between Jupiter and Earth 1 David and Goliath is a story from the Bible that is about a normal man (David) who meets a giant (Goliath) Tomas
Multistage substorm expansion: Auroral dynamics in relation to plasma sheet particle injection, precipitation, and plasma convection
 JOURNAL OF GEOPHYSICAL RESEARCH, VOL. 107, NO. A11, 1342, doi:10.1029/2001ja900116, 2002 Multistage substorm expansion: Auroral dynamics in relation to plasma sheet particle injection, precipitation, and
Construction of magnetic reconnection in the near Earth magnetotail with Geotail
 JOURNAL OF GEOPHYSICAL RESEARCH, VOL. 116,, doi:10.1029/2010ja016283, 2011 Construction of magnetic reconnection in the near Earth magnetotail with Geotail T. Nagai, 1 I. Shinohara, 2 M. Fujimoto, 2 A.
A Correlation Study of Steady Magnetospheric Convection in the Northern and Southern Hemispheres
 A Correlation Study of Steady Magnetospheric Convection in the Northern and Southern Hemispheres Caroline M. McElhenny 1, Dr. Anna DeJong 1 1 Christopher Newport University Abstract: The purpose of this
Sub-Auroral Electric Fields: An Inner Magnetosphere Perspective
 Sub-Auroral Electric Fields: An Inner Magnetosphere Perspective Bob Spiro Rice University 2005 GEM/CEDAR Tutorial 1 Introduction/Outline Introduction/Outline Importance of Sub-Auroral E-Fields Early Models
FAST Observations of Ion Outflow Associated with Magnetic Storms
 FAST Observations of Ion Outflow Associated with Magnetic Storms J. P. McFadden 1, Y. K. Tung 1, C. W. Carlson 1, R. J. Strangeway 2, E. Moebius 3, and L. M. Kistler 3 New observations from the FAST mission
THEMIS Science Objectives and Mission Phases
 Space Sci Rev DOI 10.1007/s11214-008-9393-5 THEMIS Science Objectives and Mission Phases D.G. Sibeck V. Angelopoulos Received: 30 March 2008 / Accepted: 2 June 2008 Springer Science+Business Media B.V.
MI Coupling from a Magnetospheric Point of View
 MI Coupling from a Magnetospheric Point of View Robert L. McPherron Institute of Geophysics and Planetary Physics and Department of Earth and Space Sciences rmcpherron@igpp.ucla.edu Normal Stress Normal
Ionospheric convection signatures of tail fast flows during substorms and Poleward Boundary Intensifications (PBI)
") GEOPHYSICAL RESEARCH LETTERS, VOL. 38,, doi:10.1029/2011gl046758, 2011 Ionospheric convection signatures of tail fast flows during substorms and Poleward Boundary Intensifications (PBI) Eftyhia Zesta,
GEOPHYSICAL RESEARCH LETTERS, VOL. 38,, doi:10.1029/2011gl046758, 2011 Ionospheric convection signatures of tail fast flows during substorms and Poleward Boundary Intensifications (PBI) Eftyhia Zesta,
Geosynchronous magnetic field response to solar wind dynamic pressure pulse
 JOURNAL OF GEOPHYSICAL RESEARCH, VOL. 109,, doi:10.1029/2003ja010076, 2004 Geosynchronous magnetic field response to solar wind dynamic pressure pulse D.-Y. Lee Department of Astronomy and Space Science,
The Dependence of the Magnetic Field Near the Subsolar Magnetopause on IMF in Accordance with THEMIS Data
 WDS'11 Proceedings of Contributed Papers, Part II, 45 50, 2011. ISBN 978-80-7378-185-9 MATFYZPRESS The Dependence of the Magnetic Field Near the Subsolar Magnetopause on IMF in Accordance with THEMIS Data
Simultaneous THEMIS in situ and auroral observations of a small substorm
 Click Here for Full Article GEOPHYSICAL RESEARCH LETTERS, VOL. 35, L17S18, doi:10.1029/2008gl033794, 2008 Simultaneous THEMIS in situ and auroral observations of a small substorm E. Donovan, 1 W. Liu,