arxiv:astro-ph/ v1 20 Nov 1997
|
|
|
- Ross Henry
- 5 years ago
- Views:
Transcription
1 Observations of the SW Sextantis Star UU Aquarii D. W. Hoard, 1 M. D. Still, 2 Paula Szkody, 1 Robert Connon Smith, 3 and D. A. H. Buckley 4 ABSTRACT arxiv:astro-ph/ v1 20 Nov 1997 We present 14 nights of medium resolution (1-2Å) spectroscopy of the eclipsing cataclysmic variable UU Aquarii obtained during a high accretion state in 1995 August October. UU Aqr appears to be an SW Sextantis star, as noted by Baptista, Steiner, & Horne (1996), and we discuss its spectroscopic behavior in the context of the SW Sex phenomenon. Emission line equivalent width curves, Doppler tomography, and line profile simulation provide evidence for the presence of a bright spot at the impact site of the accretion stream with the edge of the disk, and a non-axisymmetric, vertically- and azimuthally-extended absorbing structure in the disk. The absorption has maximum depth in the emission lines around orbital phase 0.8, but is present from φ 0.4 to φ An origin is explored for this absorbing structure (as well as the other spectroscopic behavior of UU Aqr) in terms of the explosive impact of the accretion stream with the disk. Subject headings: accretion, accretion disks novae, cataclysmic variables stars: individual (UU Aquarii) 1. Introduction Cataclysmic variables (CVs) are short period (P orb typically < 1 d), semi-detached binary systems in which matter is transferred through the L 1 point from a Roche-lobe-filling, lower main sequence dwarf (the secondary star), into an accretion disk around the white dwarf (WD) primary star. In most nonmagnetic CVs, energy output from the disk dominates the optical X-ray luminosity; hence, the properties of the disk (which are primarily governed by the mass transfer rate Ṁ in the case of an optically thick disk) determine most of the observed properties of the 1 Department of Astronomy, University of Washington, Box , Seattle, WA , USA; hoard@astro.washington.edu, szkody@astro.washington.edu 2 Physics & Astronomy, University of St. Andrews, North Haugh, St. Andrews, Fife KY16 9SS, UK; martin.still@st-and.ac.uk 3 Astronomy Centre, University of Sussex, Brighton BN1 9QJ, UK; rcs@star.maps.susx.ac.uk 4 South African Astronomical Observatory, PO Box 9, Observatory 7935, Cape Town, South Africa; dibnob@saao.ac.za
2 2 entire system. UU Aquarii (V 13.5) was identified as a variable star early in this century (Beljawsky 1926). As observations of UU Aqr have been accumulated, its classification has evolved from a long-period semi-regular variable (Payne-Gaposchkin 1952), to a low Ṁ, optically thin disk, dwarf nova type CV (Volkov, Shugarov, & Seregina 1986), to a high Ṁ, optically thick disk, novalike CV (Diaz & Steiner 1991, henceforth DS91; Baptista, Steiner, & Cieslinski 1994, henceforth BSC94). Volkov et al. (1986) and Goldader & Garnavich (1989) observed deep ( 1.5 mag) eclipses in UU Aqr, and established an orbital period of P orb = (61) d ( 3.93 h). This places UU Aqr in the 3 4 hr period range just above the 2 3 hr CV period gap (thought to be due to the transition from orbital angular momentum loss primarily via magnetic braking for P> 3 hr to loss due to gravitational radiation for P< 2 hr; King 1988). Among novalike CVs, the 3 4 hr period range is occupied almost solely by the group of systems known as the SW Sextantis stars (e.g., Thorstensen et al. 1991), which are characterized by high inclination, single-peaked optical emission lines (in contrast to the double-peaked lines expected in high inclination disk systems), orbital-phase-dependent absorption in the Balmer lines, and a phase offset in the emission line radial velocity curves (implying non-uniform emission from the disk). As a result of their multiwavelength eclipse mapping study, Baptista, Steiner, & Horne (1996; henceforth BSH96) conclude that UU Aqr is most likely an SW Sex star (a conclusion that we share based on the results presented here see 4.4). BSC94 obtained photometric data of UU Aqr on 28 nights during They discovered that this system, like many other novalike CVs (Dhillon 1996), exhibits occasional transitions from high to low brightness states. The amplitude of the state change in UU Aqr, however, is only mag, which is small compared to other novalike CVs (e.g., BH Lyncis: mag , Hoard & Szkody 1997; DW Ursae Majoris: mag 2 3, Dhillon, Jones, & Marsh 1994). The shape of the eclipse profile in UU Aqr does change significantly from the high to low states, and BSC94 concluded that the main difference between the two states is the presence of a bright spot on the outer edge of the disk in the high state. Both Haefner (1989) and DS91 determined radial velocity curves for the Hα line in UU Aqr; both noted the strongly asymmetric, phase-dependent profile of the line. Haefner (1989) found a velocity semi-amplitude of 160 km s 1 from the wings of the Hα line, while DS91 obtained 120 km s 1 using the same method. DS91 determined system parameters of q = (M 2 /M wd =) 0.4 with M wd = 0.9M. More recently, the detailed eclipse-mapping study of UU Aqr by BSC94 and BSH96 provided a photometric model that requires K wd 84 km s 1, substantially smaller than estimates made from the Hα emission line. (This is not surprising as low excitation emission lines, which form primarily in the outer parts of the disk, cannot be expected to accurately map the orbital motion of the WD; e.g., Still, Dhillon, & Jones 1995, Shafter, Hessman, & Zhang 1988.) BSC94 derive system parameters of q = 0.30 with M wd = 0.67M and an inclination i = 78. We present here the results of an extensive spectroscopic monitoring campaign on UU Aqr.
3 3 Previously published time-resolved spectra (DS91) were obtained during a low state, while our spectra explore the high state of the system (see 3.3). In addition, the spectra of DS91 covered only 200Å around Hα, whereas our spectra span Hβ to Hγ on all nights, with additional coverage from Hα to He I λ5876 on one night. Our results include a line profile simulation that reproduces the gross characteristics of the orbital-phase-resolved emission line behavior of UU Aqr in terms of several discrete emission and absorption components ( 4.1), Doppler tomography resolved over half an orbit of the CV ( 4.2), and a qualitative model for the system ( 4.3). 2. Observations We observed UU Aqr using the 1.9m Radcliffe Telescope at the South African Astronomical Observatory (SAAO) on 1995 August 1 8 UT, 1995 August UT, and 1995 September UT. The observations were made using the two-channel Reticon Photon Counting System (RPCS; Menzies & Glass 1996) with a 1200 line mm 1 grating (giving a resolution of 1.8Å). Exposures were 90 s with a total time per spectrum of 97 s; a total of 1492 spectra were obtained. Sky was recorded in one channel of the RPCS and sky+object in the other channel. Following normalization via bias-subtraction and division by a tungsten lamp flat-field, the spectra were extracted by simply subtracting the sky channel from the sky+object channel. The spectra were wavelength-calibrated by comparison to spectra of a Cu-Ar arc lamp standard; the usable wavelength range was Å. They were flux-calibrated via observations of the standard stars L1788 and L7379 (Hamuy et al. 1994). In order to increase the signal-to-noise, the reduced RPCS spectra were averaged into phase bins of width φ = 0.04 in blocks of 2 consecutive nights (see Table 1), using the photometric ephemeris of BSC94 (we will refer to these as the binned RPCS data sets ). We also constructed sets of phase-binned ( φ = 0.04) spectra using 1450 of the total set of RPCS spectra (some of the RPCS spectra were rejected because they were extremely weak, possibly due to slit losses; we will refer to this as the combined RPCS data set ). We also obtained spectra of UU Aqr on 1995 October UT using the Double Imaging Spectrograph (DIS) on the Apache Point Observatory 3.5m telescope (e.g., see Hoard & Szkody 1997). Exposure times were 300 s with a total time of 381 s per spectrum; a total of 65 spectra were obtained. The blue side of DIS covered a wavelength range of Å and the red side covered Å, with an overall resolution of 1.5 2Å. The spectra were extracted and calibrated using standard IRAF routines (Massey, Valdes, & Barnes 1992); they were wavelength-calibrated via comparison with a He-Ne arc lamp standard. Fine corrections to the wavelength calibration were made by examining the positions of night sky lines in the spectra. Both the blue and red spectra were flux-calibrated using spectra of the standard stars Feige 110 and BD (Massey et al. 1988). The spectroscopic observations of UU Aqr are summarized in Table 1.
4 4 3. Results 3.1. The Average Spectrum The average spectrum of UU Aqr, outside orbital phases 0.9 to 0.1 (the eclipse) and uncorrected for any orbital motion, is shown in Figure 1. Each blue spectrum from the binned RPCS data sets listed in Table 1 is plotted in the figure. The spectrum shows prominent Balmer emission lines and several weaker He I emission lines (λ4471, λ4921, λ5015, λ5876, λ6678). The He II λ4686 emission line is weak and blended with a C III/N III emission complex of similar strength. All of the emission lines are single-peaked (this is true for the individual spectra as well for example, see Fig. 10 so this is not just an effect of smearing of the line profiles in the average spectrum). The blue spectrum is quite constant over the 3 month span of the observations. The continuum from 4200Å to 6800Å follows a power law, F λ λ α with α 1.7. This is somewhat smaller than the power law index α = 2.3 expected from both theoretical calculations in which all disk elements radiate as blackbodies (Pringle 1981) and observations of dwarf novae at outburst (Szkody 1985). A relatively flat spectral energy distribution is considered typical of novalike CVs (Oke & Wade 1982), and may be related to departures of the disk structure from simple theoretical models and/or self-eclipse of the inner disk in high inclination systems (e.g., Rutten, van Paradijs, & Tinbergen 1992) Radial Velocities Radial velocities were measured from the wings of the Balmer emission lines in all of the binned RPCS data sets, and from the Balmer and helium lines in each of the unbinned DIS spectra, using the double Gaussian fitting technique described by Shafter, Szkody, & Thorstensen (1986) and Schneider & Young (1980). Before applying this technique to each line, a section of the spectrum around the wavelength of the line center (±3000 km s 1 ) was converted to a uniform (i.e., linear) velocity scale with a step-size of the local velocity dispersion, (c λ)/λ 0 km s 1, (1) where c is the speed of light (km s 1 ), λ o is the wavelength of the line center (Å), and λ is the wavelength dispersion ( 0.8Å for the RPCS spectra, 1.3Å for the red DIS spectra, and 1.6Å for the blue DIS spectra). For the Balmer and He I λ5876 lines, the FWHM of the Gaussians was set at twice the local velocity resolution of the spectra for each line (FWHM 160 km s 1 at Hβ to 180 km s 1 at Hγ in the RPCS spectra; FWHM 120 km s 1 at Hα to 230 km s 1 at Hγ in the DIS spectra). The Gaussian separation a was varied in steps of 100 km s 1 from 500 km s 1 to 2500 km s 1. In order to obtain usable velocities from the weaker He I λ4471 and He II λ4686 lines (in the DIS spectra), the FWHM of the Gaussians was increased to 400 km s 1. The equation V (φ,a) = γ(a) K(a)sin[2π(φ φ 0 (a))] (2)
5 5 was fitted to the velocity data obtained from the optimum value of the Gaussian separation for each line. Because we are comparing spectra obtained at different times, the velocities from each data set were shifted by the appropriate heliocentric correction prior to fitting. Representative samples of the diagnostic diagrams (from the DIS data) used to determine the optimum Gaussian separation are shown in Figure 2. For the Balmer lines, the diagrams are well-behaved and we chose a = 1700 km s 1. The diagrams for the helium lines, on the other hand, are rather more uncertain. All three He lines display a trough in the fractional uncertainty of the velocity semi-amplitude, σ K /K, between a = 1100 km s 1 and a = 1800 km s 1, indicating that this range of Gaussian separations best samples the line wings away from the highly variable line cores but before the adjacent continuum contaminates the wings significantly. However, the values of the system parameters (especially K) still fluctuate significantly over this range of a. The He I λ5876 line is the best-behaved of the He lines, and we have used a = 1700 km s 1 for this line also, based on the overall shapes of its σ K /K, K, and σ total curves, which are similar to those of the Balmer lines. The values (and 1σ uncertainies determined from Monte Carlo simulations) of the UU Aqr velocity parameters for the Balmer and He I λ5876 lines are listed in Table 2 for each of the data sets. For He I λ4471 and He II, the velocity parameter values between a = 1100 km s 1 and a = 1800 km s 1 (where σ K /K is smallest) oscillate around a roughly flat mean trend, which makes it difficult to pick an optimum Gaussian separation. Instead, we have computed a weighted average of the parameter values in this range of a using x i = Σ(x i/σ 2 i ) Σ(1/σ 2 i ), (3) where σ i is the uncertainty in parameter x i at a given a as determined from a Monte Carlo simulation. This provides a representative velocity solution, rather than relying on any one of the individual solutions (which might lie above or below the general trend). The average parameters for these two lines are also listed in Table 2. The Balmer, He I λ4471 and λ5876, and He II λ4686 radial velocity curves obtained from the DIS spectra are shown in Figure 3, along with the best fit sine functions. For the He I λ4471 and He II lines, we have plotted the radial velocities for a = 1700 km s 1 with the sine function produced by the average velocity parameters. The RPCS radial velocity curves for Hβ and Hγ do not differ significantly from the DIS curves, so are not plotted. The He lines in the RPCS data sets were generally too weak to yield reliable wing velocity curves. All of the lines have positive phase offsets (φ 0 ) corresponding to a delay of the red-to-blue velocity crossing of the emission lines relative to photometric phase 0.0. The phase offsets range from in the Balmer and He I lines, to 0.3 in the He II line (again, however, we cannot rule out the possibility of a skewed result owing to blending of the He II line). This implies that the main source of emission is off-center in the disk.
6 6 If we consider the systemic velocities (γ) as a function of time, then the Hβ and Hγ lines display similar behavior. In both lines, the gamma velocity decreases from data set #1 to #2. In Hβ this decrease continues through data set #3, then γ has its maximum value in data set #4; in Hγ the maximum value is reached in data set #3. The value of γ then decreases following the maximum for each line, until a minimum value (γ < 0 for Hβ and several of the other lines) is reached in data set #7. This pattern does not appear to correlate with the smaller ( < ±2σ), somewhat more random fluctuations of the other velocity parameters (K and φ 0 ). This suggests that the systemic velocity is influenced by a separate emission region than the velocity semi-amplitude and phase offset. For example, the presence of an emission component from a (non-rotating or only slightly rotating) disk wind could systematically skew the zero level of the radial velocities without overtly disrupting the rotational behavior of underlying emission from the disk. Variability of the flux of emitting material in this wind might then account for the changing γ values in UU Aqr. The semi-amplitude of the Hβ radial velocity ranges from K = km s 1, with the best-determined value (σ K /K = 0.05) from the DIS data, K = 115 ± 6 km s 1. The variability of the K value may be related to small changes in the location and/or structure of the off-center emitting region that dominates the Balmer lines. For the Hα line, the DIS spectra give 151 ± 8 km s 1. This is slightly smaller than the Hα wing velocity K 160 km s 1 measured by Haefner (1989), but larger than that found by DS91, K = 121 ± 7 km s 1. In general, the Balmer lines and (especially) the He II line have velocity semi-amplitudes larger than the nominal WD orbital velocity predicted by the photometric model of BSC94, K wd = 84 ± 26 km s 1, although many of the Hβ and Hγ (but not Hα or He II) velocities are within 1σ of the BSC94 value. The He II line is often thought to originate in the hotter region close to the WD and, hence, to be a good indicator of the WD orbital velocity. However, both its large difference from the independently determined value of BSC94 and its large phase offset argue against adopting our value for K HeII as K wd. Thus, we will refrain from computing additional system parameters and will instead accept those determined for UU Aqr by BSC94 from their multicolor eclipse mapping investigation (i.e., q = 0.30 ± 0.07, M wd = 0.67 ± 0.14M, M 2 = 0.20 ± 0.07M, and i = 78 ± 2 ). We note for the sake of completeness that the effect on the derived system parameters of adopting a larger WD orbital velocity would be to increase q and decrease i (e.g., Garnavich et al. 1990) Equivalent Widths We measured equivalent widths (EWs) for all 65 of the DIS spectra and for all of the spectra from the binned RPCS data sets. The EW curves for the DIS spectra are shown in Figure 4; the curves for the RPCS spectra do not differ in any significant way from the DIS curves, so are not shown. The mean EWs and 1σ uncertainties outside of eclipse (0.1 φ 0.9) for the Hβ, Hγ, He I λ4471, and He II λ4686 emission lines of UU Aqr are listed in Table 3 for each of the binned data sets. Note that the He II line is blended with the adjacent C III/N III emission complex and
7 7 the EW measures the flux from both. The mean EWs of all of these lines were essentially constant from 1995 August to 1995 October. We note, however, that data set #7 (which has the smallest emission line systemic velocities see Table 2) has the smallest mean Balmer and He I EWs and the largest mean He II EW. This might be explained if the Balmer and He I emission contains a variable wind emission component that produces a positive systemic velocity when present (as discussed in 3.2), but is absent or reduced in amplitude in data set #7. Outside of eclipse, the EWs go through roughly sinusoidal modulations on the orbital period, with minima at φ This modulation is most apparent in the Hα line, where it has a full amplitude of 15Å (see top right panel of Fig. 4). This modulation is not seen in broadband (i.e., continuum) light curves of UU Aqr (see Fig. 5 and text below), indicating that it is due to variability in the emission lines. In the novalike CVs BH Lyn (Hoard & Szkody 1997) and PG (Hoard & Szkody 1996a), similar modulation of the EWs was interpreted as due to absorption in a vertically extended bulge on the edge of the disk. The presence of such bulges in the disk edge is predicted at phases of 0.2, 0.5, and/or 0.8 by numerical simulations of accretion stream-disk interaction (e.g., Hirose, Osaki, & Mineshige 1991; Meglicki, Wickramasinghe, & Bicknell 1993). Absorption by a bulge at φ 0.8 could explain the UU Aqr EW modulation. The most obvious feature of the EW curves is the presence of a large peak around φ 0.0 in all of them. The height of this peak varies from curve to curve; among the Balmer series in particular, its amplitude is largest for Hα ( 55Å) and smallest for Hγ ( 20Å). The eclipse peaks reach maximum amplitude at φ = 0.0 but are asymmetrically shaped, with a steep rise before φ = 0.0 ( φ = ) and a longer decline ( φ = ). DS91 reported no change in the emission line EWs during eclipse, but their spectra were obtained in 1988 October, when BSC94 determined that UU Aqr was in a low accretion state. Yet, the narrowband (50Å) Hα light curve of UU Aqr obtained by BSH96 during another low state (in 1992) is uneclipsed relative to light curves in both the broadband R and adjacent narrowband λ6700 filters. This would produce a peak in the Hα EW as seen in our high state data. The lack of eclipse in the emission lines implies that there is an extended source of emission that remains partially visible during eclipse; however, the presence of such a region does not appear to be strongly tied to the brightness state in UU Aqr. We acquired CCD photometry of UU Aqr at SAAO on the nights of 1995 August and UT, concurrent with binned RPCS data sets #1 and #2 (see Table 1). A total of 570 measurements were obtained, with typical time resolution of 69 s, and calibrated to Strömgren b magnitudes via comparison to observations of E-region standards (e.g., Cousins 1987) obtained under photometric conditions. The eclipse profile in the resultant light curve of UU Aqr (shown in Fig. 5) is most similar in shape to that of the high state light curves of BSC94 (compare to their Fig. 5). The small differences in the profile from orbit to orbit immediately before and after eclipse are consistent with those seen by BSC94. The asymmetry of the EW peaks is reflected
8 8 in the shape of the high state eclipse light curve, which shows a steep, smooth ingress to the eclipse minimum over φ 0.04, followed by a longer egress, φ 0.1, back to the quiescent level. The eclipse egress has a sharp shoulder φ 0.04 after the minimum. BSC94 interpreted the asymmetry of the eclipse as an effect of the bright spot, which must have a large azimuthal extent on the edge of the disk. The projected surface area of the spot along the line-of-sight to the system decreases as the orbital phase approaches φ = 0.0, leading to a rapid spot eclipse ingress. After the eclipse minimum, the projected spot area along the line-of-sight increases as φ increases, leading to a longer egress from the eclipse of the spot (also see Rutten et al. 1992). In addition, the light curve of UU Aqr during 1995 from the Indiana Automated CCD Photometric Telescope ( Roboscope; e.g., Honeycutt & Turner 1992, Honeycutt et al. 1994) shows that the system was bright (V = 13.5 ± 0.1) during our spectroscopic observations (Robertson 1997). As noted in 1, the difference in brightness between high and low states of UU Aqr is small, but the eclipse profile shapes in the two states show significant differences; hence, the latter is a more precise diagnostic of the accretion state in UU Aqr than the former. Based on the comparison of the system brightness, EW behavior, and eclipse profile to previously published observations, we conclude that UU Aqr was in a high state during our observations Doppler Tomography We used the Fourier-filtered back-projection algorithm described by Horne (1991) and others (e.g., Marsh & Horne 1988; Kaitchuck et al. 1994) to produce Doppler tomograms of the velocity distribution of emitting material in UU Aqr. Figures 6a f show the Hβ tomograms for the six binned RPCS data sets; Figure 6g is the Hβ tomogram constructed from the DIS data (binned to φ = 0.04); Figure 6h is the Hβ tomogram for the combined set of RPCS spectra. The tomogram for 1995 Sep UT (Fig. 6d) is of poorer quality than the others because the binned data set used to construct it (#4 see Table 1) contains substantially fewer total spectra than the other RPCS data sets. As might be expected following the similar behavior of the average spectra (see 3.1) and emission line equivalent widths ( 3.3), the Hβ tomogram does not change significantly from 1995 August to 1995 October. This implies that the changes in the radial velocity parameters of the emission lines must be due to small changes in the structure of a discrete emitting region rather than the whole disk. There are two main features in the tomograms: (1) a roughly circular region of diffuse emission, centered around the velocity origin and extending to a radius of km s 1 ; and (2) a localized region of strong emission centered at V x 300 to 400 km s 1 and V y 0 to +50 km s 1. The latter region is suggestive of the bright spot at the impact site of the accretion stream with the edge of the disk, but is somewhat inconsistent with the expected velocity position. Such emission would normally lie further inside the ( V x,+v y ) quadrant of the tomogram (see, for example, Fig. 11 of Kaitchuck et al. 1994). In Figures 6g and 6h, we have plotted the positions of the secondary star Roche lobe and the accretion stream trajectory, using the system parameters
9 9 determined by BSC94 (see 1). The strong emission region does not coincide with the stream trajectory as would be expected for normal bright spot emission. By arbitrarily reducing the WD orbital velocity from the value of 84 km s 1 calculated by BSC94 to 40 km s 1, we can force the accretion stream to pass roughly through the center of the emission region in the tomograms. However, this requires the masses of the stellar components to be unreasonably small (M WD 0.07M, M M ) and, consequently, does not provide a useful explanation for the discrepancy between stream and emission locations. The strong emission region also appears to be elongated towards the (+V x,+v y ) quadrant; several of the tomograms (notably a, b, g, and h) show a tail of emission which extends from this region to the +V y axis, intersecting at +200 km s 1. This velocity is comparable to an estimate of the orbital velocity of the L 1 point around the center-of-mass assuming the mass ratio calculated by BSC94. Indeed, the velocity at the end of the emission tail on the +V y -axis coincides with that of the tip of the secondary star Roche lobe (i.e., the L 1 point) as plotted in Figures 6g and 6h; the tail itself follows the expected trajectory of the accretion stream. None of the Hβ tomograms contains a distinct ring of emission (the signature of an accretion disk; e.g., see Fig. 24 of Kaitchuck et al. 1994), although there is some indication of such a structure in Figures 6c and 6f. Figure 6g contains the most obvious hint of an emission ring. The lack of a prominent disk signature in the tomograms is not surprising given the single- rather than double-peaked emission lines in the spectrum of UU Aqr; this may be consistent with only a small disk being present, or only weak emission from a larger disk, or emission from a non-disk source (e.g., a wind) that masks the disk emission. The Hγ and, for the DIS spectra, Hα tomograms are very similar to the Hβ tomograms (the wavelength coverage of the RPCS spectra does not extend to Hα). Representative examples of the tomograms of these lines, constructed from the DIS data, are shown in Figure 7a b. The trailed spectrum used to construct the Hγ tomogram is shown in Figure 8 (the trailed spectra for Hα and Hβ are shown in Fig. 9). There is a somewhat more distinct disk-ring of emission in the Hγ tomogram than in the other Balmer tomograms; the disk may be more optically thin to the more energetic Balmer radiation (i.e., at hotter temperatures). The Hγ ring emission is strongest along an arc starting at the strong emission region in the ( V x,+v y ) quadrant and trailing counter-clockwise in the tomogram into the (+V x, V y ) quadrant, which suggests that the disk edge is nonuniform (in temperature, or density, or local turbelent velocity, etc.). The spectra binned at a given phase from the DIS data set have somewhat higher signalto-noise than the corresponding binned RPCS spectra. Thus, we also attempted to construct Doppler tomograms for the weaker He I λ4471 and He II λ4686 lines in the DIS spectra. These are shown in Figure 7c d, and the trailed spectra for these lines are shown in Figure 8. The high velocity regions of the He I tomogram are severely contaminated by noise in the continuum adjacent to the line. However, there are still two features of note in the tomogram: (1) a region of enhanced emission on the V x axis, consistent with the location of the one seen in the Balmer
10 10 tomograms; and (2) a centralized lack of emission and slightly enhanced arc of emission spanning the V y quadrants that are suggestive of the ring signature of disk emission. The He II tomogram is practically indistinguishable from noise, although there may be a slight enhancement of the emission level in the ( V x,+v y ) quadrant (corresponding to the location of the strong emission region in the other tomograms). The poor quality of the He II tomogram is probably the result of both the weakness of the He II line and its severe blending with the adjacent C III/N III complex. The only other published tomogram for UU Aqr is that of the Hβ line shown in the CV tomography atlas of Kaitchuck et al. (1994), and it is significantly different from our Hβ tomograms. The strong emission region in the Kaitchuck et al. tomogram is displaced upward to V y +100 to +300 km s 1 and there is a much more prominent ring of disk emission (centered at V y 200 km s 1 ) than in our tomograms. Overall, the Kaitchuck et al. tomogram of UU Aqr is much more similar to that of a dwarf nova type CV with a prominent, optically thin disk and a discrete bright spot at the expected site of the accretion stream impact with the outer edge of the disk. The Kaitchuck et al. tomogram was constructed using data obtained in 1988 October, during one of the photometric low states classified by BSC94. Thus, we may attribute the differences in the tomograms to differences in the accretion state of UU Aqr when the spectra were obtained: low for Kaitchuck et al., high for our data. The eclipse mapping of BSC94 shows that the disk in UU Aqr has a larger radius in the high state than in the low; however, the increased mass transfer in the high state may produce a strong wind emission component that masks the disk emission. The consistency of our Hβ tomogram from 1995 August to 1995 October implies that the physical conditions in the UU Aqr disk were very stable during the 3 month span of our observations. 4. Discussion 4.1. Line Profile Simulation As a simple model, CV emission line profiles can be simulated as the sum of several component profiles with the appropriate radial velocity vs. orbital phase behavior expected for various emission regions in the system (e.g., accretion stream, bright spot, WD, etc.). In this manner, Hellier & Robinson (1994) and Hellier (1996) have had some success at reproducing the general line profile behavior of SW Sex stars (specifically, PX Andromedae and V1315 Aquilae). We have applied a similar technique to simulating the Balmer emission lines in UU Aqr. Figure 9 shows trailed spectrograms and Doppler tomograms for the observed Hα (DIS data) and Hβ (combined RPCS data) emission lines of UU Aqr, and a simulated Balmer line. The velocity and phase resolution of the simulated data was made comparable to that of the observed data. Our simulated line profiles are made up of five components, described here: Double-peaked Keplerian disk emission: This is the only one of the components that is not represented by a Gaussian profile; instead, the disk profile is calculated as in Robinson, Marsh, & Smak (1993), using an emissivity index β = 2.0 (small changes in β around this value
11 11 do not have a significant effect on the simulation owing to the relatively small amplitude of the disk profile and the qualitative nature of the fitting process see below). We used the system parameters and WD orbital velocity for UU Aqr derived by BSC94 to define the shape and orbital phase behavior of the disk profile. We initially assumed inner and outer disk radii of 0.015R and 0.4R (BSC94; Harrop-Allin & Warner 1996). Subsequent comparison with the observed profiles (see Fig. 10) caused us to pick 0.045R and 0.45R as final inner and outer disk radii (the latter value is 60% of the distance from the WD to the L 1 point). These disk radii are used throughout the simulation. The amplitude of the disk profile in the simulation is 0.40 above the continuum level (which has been normalized to a value of 1.00 in the observed spectra). Single-peaked WD/disk wind emission: This is represented by a Gaussian function with FWHM of 1000 km s 1 centered at the midpoint of the disk profile. It is assumed to follow the orbital motion of the WD. The amplitude of the wind component is 0.80 above the continuum. The amplitudes of both the disk and wind components were artificially enhanced by a factor of 2.25 during phases to emulate the general appearance of the observed Balmer emission lines during eclipse. We have not explicitly calculated an eclipse profile for the simulated line (which would require determination of the precise 3-D locations of emission and continuum regions in the system). Hence, the treatment of the eclipse phases shown in the simulated trailed spectrogram in Figure 9 is, at best, only an approximation of the actual eclipse behavior. (We note, however, that even this simple approximation yields line profiles that are similar to the observed profiles during eclipse see Fig. 10 although it is not clear whether or not this is merely coincidental.) Since the data from the eclipse phases are excluded from the creation of a Doppler tomogram, any incorrect treatment of the simulated eclipse behavior has no effect on the simulated tomogram. Accretion stream emission: The free-fall velocities along the accretion stream trajectory from the L 1 point were calculated as in Lubow & Shu (1975). Gaussian profiles with FWHM of 25% of the local stream velocity were summed along a specified length of this trajectory to simulate emission from the material in the stream. In addition, the Keplerian rotational velocities of the disk material underlying the stream trajectory were calculated, to provide the option of simulating disk material excited to emission through interaction with a stream that overflows the disk from its initial impact site. In the case of UU Aqr, we have assumed that the stream emits only between the L 1 point and its impact with the edge of the disk this reproduces the tail seen in the Balmer tomograms (see 3.4). The peak amplitude of the stream component is 0.25 above the continuum. Bright spot emission: In the model proposed by Hellier & Robinson (1994) and Hellier (1996) for the SW Sex stars PX And and V1315 Aql, the accretion stream continues coherently past its initial impact with the edge of the disk, absorbing the underlying disk emission along its trajectory, to a secondary impact site in the inner disk (thereby creating a secondary bright spot whose velocity behavior is determined by the dynamics of the inner disk). The eclipse maps of UU Aqr in a high state (BSH96), however, show evidence for a bright spot only at the expected phase of the initial stream impact with the disk (φ 0.8). Further, we find that the velocity of
12 12 a secondary impact site near the radius expected for re-impact (Lubow 1989) must be arbitrarily reduced by a very large amount (> 50%) to match the observed velocity offset of the strong emission region in the Balmer tomograms of UU Aqr. Consequently, we have simulated the line profiles using a bright spot (Gaussian FWHM = 50% of the average of the local stream+disk rotation velocity) that originates at the intersection of the stream with the disk edge, and expands to lower velocities (this is consistent with, for example, emission from impacting stream material that does not deeply penetrate the disk and is primarily reflected away from the disk edge in the general direction of the secondary star). This scenario is suggested by recent numerical simulations of the stream-disk interaction (Armitage & Livio 1996, 1997), in which the impact of the stream with the disk, in the presence of inefficient cooling (appropriate for high Ṁ systems such as novalike CVs), does not produce coherent stream flow over the disk, but instead causes an explosion of material away from the impact point in all directions (except those blocked by the disk). Thus, the stream component in the line simulation does not contribute beyond the outer edge of the disk. The peak amplitude of the bright spot profile is 1.20 above the continuum. Non-axisymmetric absorption: Hellier (1997) has recently proposed accretion stream overflow onto an axisymmetrically flared disk to explain the transient absorption features in the emission lines of the SW Sex stars. Unfortunately, this mechanism appears only to be able to reproduce the absorption seen around φ 0.5 in some of the SW Sex stars. In order to account for absorption at both 0.5 and other phases, there must be a non-axisymmetric absorbing structure located at different positions in the disk in different systems, as suggested by Hoard & Szkody (1996a, 1997). In order to match the observed behavior of the Balmer emission lines in UU Aqr, we utilized non-axisymmetric absorption represented by an inverted (i.e., negative amplitude) Gaussian function. The absorbing structure can be visualized as a vertically- and azimuthally-extended bulge or wall along the disk edge, which starts (with zero absorption) at φ = 0.95, ramps up linearly to peak absorption (amplitude of 0.63 relative to the continuum) between phases 0.7 and 0.8, then ramps back down to zero absorption at φ = 0.3. The formation of such a structure could result from stream material exploding around the impact site (near φ 0.8) to form the highest section of the wall, with additional material carried along the disk edge by the rotation of the disk to form the long, declining tail of the wall. This is consistent with the large azimuthal extent of the bright spot expected from the eclipse profiles of UU Aqr (see 3.3). The FWHM of the absorption is 300 km s 1 ; this value was initially set at the rotational velocity of the outer edge of the disk ( 550 km s 1 ) and was refined by comparing the simulated absorption width with that seen between phases 0.5 and 1.0 in the observed spectra. In the simulation shown in Figure 9, the velocity behavior of the absorption was set to follow that of the bright spot, in essence producing a self-absorption component of the bright spot (as suggested by Dickinson et al to explain the line profile behavior of the probable SW Sex star V795 Herculis). We also experimented with somewhat more physical forms of velocity behavior for the absorption, such as following either the rotational velocity of the edge of the disk or the continuation of the stream trajectory over the disk, and found these to produce qualitatively similar results. Considering the simplicity of our simulation, we elected to present here the case
13 13 involving the fewest unknown parameters (i.e., self-absorption). In general, this technique of line profile simulation can produce reasonable-looking results. Yet, the large number of input parameters and use of simplifying approximations beg the question: how realistic are these results? We have calculated the χ 2 values of the simulated profiles using different input parameters compared to the observed profiles, in a number of phase bins; the comparison for the simulation presented here is shown in Figure 10. This provided a means of comparing the relative goodness of simulations for a particular data set. However, the parameters were adjusted based only on a visual inspection of the simulated vs. real profiles; for example, the blue shoulder visible in the φ = 0.15 profile in Figure 10 provided a measure of the correct amplitudes for the disk and wind components, while the height of the central peak provided an estimate of the correct amplitude for the bright spot emission. This manual fitting can produce somewhat erratic results. Further, like Doppler tomography, the line profile simulation process essentially collapses the velocity field of the emission into two dimensions, which can lead to some ambiguity if significant sources of emission have large velocity components in the third dimension (i.e., vertical relative to the plane of the disk) Half-Orbit Tomography The presence of a non-axisymmetric absorbing structure in the disks of SW Sex stars appears to be quite successful at explaining the transient absorption features in the emission lines of these CVs. Unfortunately, it poses a potential problem for the technique of Doppler tomography, which is widely used in the analysis of both the SW Sex stars and CVs in general. A basic tenet of the tomography process is that the emission region(s) being mapped should be equally visible at all orbital phases of the system; this is why eclipse phase data are neither used in the tomography process nor accurately reproduced in forward-projections of the velocity maps. In order to circumvent the violation of this tenet in UU Aqr, we have constructed two additional sets of Balmer line tomograms. In the first set (shown in the top panels of Fig. 11), we used only the spectra from orbital phases 0.0 to 0.5 the stronger, unabsorbed spectra (see top panels of Fig. 9). The second set uses the remaining, absorbed spectra, from φ = (bottom panels of Fig. 11). Thus, each of these half-orbit time-resolved tomograms should show the emission from only one side of the absorbing structure described in 4.1. In the φ = tomograms, we are effectively looking across most of the width of the disk to the absorbing structure on the far edge. The strong emission region lies on the V x axis in the same location as in the full-orbit tomograms. This emission originates at the explosive stream impact with the disk edge, and is viewed on the inner disk side of the absorbing structure. Little or no emission is visible along the accretion stream trajectory itself; the stream is likely obscured at most of these phases by the absorbing bulge, accretion disk, and/or secondary star. In the φ = tomograms, we are looking only at the stream and the small amount of disk material at radii outside the absorbing structure. There is prominent emission along the accretion stream
14 14 trajectory; however, there is little or no emission on the V x axis. Presumably, most of the stream impact emission is obscured by the absorbing structure at these phases. It was noted in 3.4 that the Hγ tomogram showed the most prominent suggestion of the ring indicative of an accretion disk. The half-orbit tomograms of this line show that the strongest part of this ring emission is visible only at φ = , in the form of enhanced emission that trails out along the disk-ring from the bright spot at the stream impact site. This corresponds to material carried along the outer edge of the disk by the disk rotation (e.g., Armitage & Livio 1997); it is hidden behind the absorbing structure and/or secondary star for φ , so is not seen in the φ = tomograms. A similar trail of emission is seen in tomograms of the archetype SW Sex (Dhillon, Marsh, & Jones 1997) and the non-sw Sex system WZ Sagittae (Spruit & Rutten 1997); Spruit & Rutten suggest that this emission is due to recombination in material that is cooling down from the shock of the stream-disk impact as it is swept downstream by the disk rotation A System Model Figure 12 is a schematic diagram of a CV showing the features of the model for UU Aqr suggested by our line profile simulations and half-orbit tomography. The high Ṁ accretion stream strikes the edge of the disk and forms a roughly spherical explosion of emitting material (region A in Fig. 12). This emitting material is flung primarily in directions of least resistance, away (and above) the disk, but some also disperses across the inner disk, producing diffuse emission in the tomograms (region B). An optically thick absorbing wall is built up by large amounts of the impacting stream material (region D), either carried along the disk edge or roughly following the continuation of the stream trajectory (although there is no coherent overflow of the stream). Optically thin emitting gas heated by the shock of the stream impact is also carried along the very outer edge of the disk by the disk rotation, outside the absorbing structure (relative to the WD), forming the trailing arc of emission seen most prominently in the Hγ tomograms (region C). (This situation is likely to be further complicated by the probable presence of a wind from the disk that is mentioned, but not explicitly addressed, in this work.) 4.4. UU Aqr as an SW Sex Star The definition of the SW Sex stars as a distinct class of CV is somewhat ambiguous and considerably more phenomenological than that of other CV classes (e.g., U Geminorum stars, polars, etc.) The SW Sex stars tend to be high inclination systems, but this is almost certainly a selection effect. They have similar orbital periods, P orb 3 4 h, which suggests a possible evolutionary link to the onset of SW Sex behavior. In general, they display single-peaked emission lines, orbital-phase-dependent absorption in the Balmer lines, and phase offsets in the emission line radial velocity curves. UU Aqr has all of these general qualities. Early work on the SW Sex
15 15 stars (e.g., Szkody & Piché 1990; Thorstensen et al. 1991) specified that the absorption occurred only at φ 0.5, whereas it occurs at φ 0.8 in UU Aqr (and in PG ). Yet, this variation in behavior can be accommodated if the SW Sex class contains systems comprising a continuum of observational characteristics determined by the relative values of fundamental parameters (such as the mass transfer rate), rather than many examples of a fixed system morphology. We note that strong He II λ4686 emission (relative to the Balmer emission lines, for example) is also typically mentioned as a distinguishing property of the SW Sex stars, but UU Aqr has weak He II. The strength of He II, however, does vary among the members of this class (Hoard & Szkody 1996b), from comparable to Hβ (e.g., DW UMa; Shafter et al. 1988) to much weaker than Hβ (e.g., WX Arietis; Beuermann et al. 1992). Thus, although the reason for the weak He II emission in UU Aqr is not entirely clear, just the fact that it is weak is not so troubling. It is reasonable to suggest that the strength of He II is related to inclination; for example, WX Ari (i < 75 ; Beuermann et al. 1992) and PG (i 65 ; Hoard & Szkody 1996a), which are both moderate inclination systems, have weak He II emission. However, this correlation does not appear to extend to other systems: BH Lyn (i = 79 ; Hoard & Szkody 1997) and SW Sex (i = 79 ; Penning et al. 1984) have inclinations similar to that of UU Aqr but have strong He II emission, while PX And (i = 73.6 ; Thorstensen et al. 1991) has a smaller inclination than UU Aqr, but stronger He II emission. The presence of optically thick parts of the outer disk that obscure the hot inner regions where He II is expected to form might reduce the emission strength; for example, PG and UU Aqr are known or suspected of having thick disks and both display weak He II emission. The dependency of the amount of stream overflow on cooling efficiency noted by Armitage & Livio (1997) provides at least a partial explanation for the range of behavior among the SW Sex stars. At high mass transfer rates, cooling is inefficient and the stream impact produces a forceful explosion, resulting in no coherent stream overflow and the presence of line absorption at the initial impact site (φ 0.8). At low mass transfer rates, cooling is efficient and there is substantial, coherent overflow of the stream. This allows the formation of a bright spot in the inner disk at the site of the secondary stream impact site, resulting in line absorption around φ 0.5. In the SW Sex stars UU Aqr and PG (Hoard & Szkody 1996a), the line absorption is deepest near φ = 0.8 and there is evidence for a substantial bright spot on the edge of the disk. In BH Lyn, the absorption occurs around φ = 0.5 but there is also evidence for the presence of a bright spot on the edge of the disk from time to time (Hoard & Szkody 1997). In DW UMa (Shafter et al. 1988), PX And (Thorstensen et al. 1991), and V1315 Aql (Dhillon, Marsh, & Jones 1991), the absorption occurs around φ = 0.5 and there is little or no evidence for a bright spot on the disk edge. We can understand this range of behavior in the context of the numerical simulations of Armitage & Livio (1997) if the mass transfer rate is largest for UU Aqr and PG , Ṁ is smaller for BH Lyn, and still smaller for DW UMa, PX And, and V1315 Aql. This produces primarily explosive impact of the stream with the disk in the first two systems, a mix of explosive impact and stream overflow in BH Lyn, and primarily stream overflow in the last three systems. Mass transfer rates
16 16 in CVs are notoriously difficult to estimate, but we note that if their Ṁ s do compare as described here, then the orbital periods of these six systems (UU Aqr = 3.9 h; PG = 3.7 h; BH Lyn = 3.7 h; PX And = 3.5 h; V1315 Aql = 3.3 h; DW UMa = 3.3 h) roughly follow a trend where mass transfer rate decreases with decreasing orbital period. Some evidence for such a trend has been seen among the novalike CVs (Dhillon 1996). We wish to thank Keith Horne for making his Doppler tomography software available to us, and Stefanie Wachter for reading a draft of this paper. The research of PS and DWH was supported by NASA grant NAG-W-3158 and NSF grant AST MDS was supported by the Particle Physics and Astronomy Research Council grant K The work of RCS was partially supported by PPARC grant GR/K REFERENCES Armitage, P. J. & Livio, M. 1996, ApJ, 470, 1024 Armitage, P. J. & Livio, M. 1997, preprint Baptista, R., Steiner, J. E., & Cieslinski, D. 1994, ApJ, 433, 332 (= BSC94) Baptista, R., Steiner, J. E., & Horne, K. 1996, MNRAS, 282, 99 (= BSH96) Beljawsky, P. R. 1926, Beobachtungs-Zircular der Astr. Nach., 6, 38 Beuermann, K., Thorstensen, J. R., Schwope, A. D., Ringwald, F. A., & Sahin, H. 1992, A&A, 256, 442 Cousins, A. W. J. 1987, South African Astron. Obs. Circ., 11, 93 Dhillon, V. S. 1996, in Cataclysmic Variables and Related Objects, eds. A. Evans and J. H. Wood (The Netherlands: Kluwer), 3 Dhillon, V. S., Jones, D. H. P., & Marsh, T. R. 1994, MNRAS, 266, 859 Dhillon, V. S., Marsh, T. R., & Jones, D. H. P. 1997, MNRAS, in press Dhillon, V. S., Marsh, T. R., & Jones, D. H. P. 1991, MNRAS, 252, 342 Diaz, M. P. & Steiner, J. E. 1991, AJ, 102, 1417 (= DS91) Dickinson, R. J., Prinja, R. K., Rosen, S. R., King, A. R., Hellier, C. & Horne, K. 1997, MNRAS, 286, 447 Garnavich, P. M., Szkody, P., Mateo, M., Feinswog, L., Booth, J., Goodrich, B., Miller, H. R., Carini, M. T., & Wilson, J. W. 1990, ApJ, 365, 696 Goldader, J. D. & Garnavich, P. 1989, IBVS, no Haefner, R. 1989, IBVS, no. 3397
17 17 Hamuy, M., Suntzeff, N. B., Heathcote, S. R., Walker, A. R., Gigoux, P., & Phillips, M. M. 1994, PASP, 106, 566 Harrop-Allin, M. K. & Warner, B. 1996, MNRAS, 279, 219 Hellier, C. 1996, ApJ, 471, 949 Hellier, C. 1997, preprint Hellier, C. & Robinson, E. L. 1994, ApJ, 431, L107 Hirose, M., Osaki, Y., & Mineshige, S. 1991, PASJ, 43, 809 Hoard, D. W. & Szkody, P. 1996a, ApJ, 470, 1052 Hoard, D. W. & Szkody, P. 1996b, BAAS, 28, 1371 Hoard, D. W. & Szkody, P. 1997, ApJ, 481, 433 Honeycutt, R. K., Adams, B. R., Swearingen, D. J., & Kopp, W. R. 1994, PASP, 106, 670 Honeycutt, R. K. & Turner, G. W. 1992, in Robotic Telescopes in the 1990 s: ASP Conference Series, Vol. 34, ed. A. V. Filippenko (San Francisco: ASP), 77 Horne, K. 1991, in Fundamental Properties of Cataclysmic Variable Stars: Proceedings of the 12th North American Workshop on Cataclysmic Variables and Low Mass X-ray Binaries, ed. A. W. Shafter (San Diego: San Diego State University), 23 Kaitchuck, R. H., Schlegel, E. M., Honeycutt, R. K., Horne, K., Marsh, T. R., White, J. C. II, & Mansperger, C. S. 1994, ApJS, 93, 519 King, A. R. 1988, QJRAS, 29, 1 Lubow, S. H. 1989, ApJ, 340, 1064 Lubow, S. H. & Shu, F. H. 1975, ApJ, 198, 383 Marsh, T. R. & Horne, K. 1988, MNRAS, 235, 269 Massey, P., Strobel, K., Barnes, J. V., & Anderson, E. 1988, ApJ, 328, 315 Massey, P., Valdes, F., & Barnes, J. 1992, A User s Guide to Reducing Slit Spectra with IRAF, available on-line from the NOAO at Meglicki, Z., Wickramasinghe, D., & Bicknell, G. V. 1993, MNRAS, 264, 691 Menzies, J. W. & Glass, I. S. 1996, Ap&SS, 235, 175 Oke, J. B. & Wade, R. A. 1982, AJ, 87, 670 Payne-Gaposchkin, C. 1952, Ann. Astron. Obs. Harvard College, 115, no. 22 Penning, W. R., Ferguson, D. H., McGraw, J. T., & Liebert, J. 1984, ApJ, 276, 233 Pringle, J. E. 1981, ARA&A, 19, 137 Robertson, J. W. 1997, private communication
18 18 Robinson, E. L., Marsh, T. R., & Smak, J. 1993, in Accretion Disks in Compact Stellar Systems, J. C. Wheeler ed. (River Edge, NJ: World Scientific Publishing), 75 Rutten, R. G. M., van Paradijs, J., & Tinbergen, J. 1992, A&A, 260, 213 Schneider, D. P. & Young, P. 1980, ApJ, 238, 946 Shafter, A. W., Hessman, F. V., & Zhang, E. H. 1988, ApJ, 327, 248 Shafter, A. W., Szkody, P., & Thorstensen, J. R. 1986, ApJ, 308, 765 Spruit, H. C. & Rutten, R. G. M. 1997, A&A, in press Still, M. D., Dhillon, V. S., & Jones, D. H. P. 1995, MNRAS, 273, 863 Szkody, P. 1985, in Recent Results on Cataclysmic Variables: Proceedings of the ESA Workshop, ed. W. R. Burke (Bamberg: ESA SP-236), 39 Szkody, P. & Piché, F. 1990, ApJ, 361, 235 Thorstensen, J. R., Ringwald, F. A., Wade, R. A., Schmidt, G. D., & Norsworthy, J. E. 1991, AJ, 102, 272 Volkov, I. M., Shugarov, S. Y., & Seregina, T. M. 1986, Astr. Tsirk., 1418, 3 This preprint was prepared with the AAS L A TEX macros v4.0.
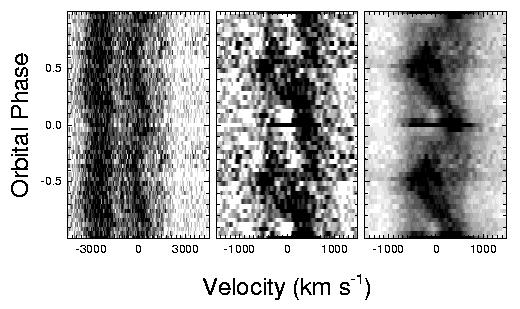
19 19 FIGURE CAPTIONS Fig. 1. Average red (bottom) and blue (top) spectrum of UU Aqr, uncorrected for orbital motion. The red spectrum is the DIS data from 1995 Oct UT. The blue spectra are from (top to bottom) 1995 Aug 1 3 UT, 1995 Aug 6 8 UT, 1995 Aug UT, 1995 Sep UT, 1995 Sep UT, 1995 Sep UT, 1995 Oct UT. The blue flux scale refers to the bottom spectrum (DIS data); the other spectra have been cumulatively offset by erg s 1 cm 2 Å 1. Fig. 2. Diagnostic diagrams from the double Gaussian fitting technique for the DIS data. The left panels are for the Balmer lines: Hα (dotted line), Hβ (solid line), and Hγ (dashed line). The right panels are for the helium lines: He i λ4471 (dotted line), He ii λ4686 (solid line), and He i λ5876 (dashed line). The panels show (from bottom to top) the phase shift of the velocity solution, the systemic velocity (km s 1 ), the fractional uncertainty of the velocity semi-amplitude, the velocity semi-amplitude (km s 1 ), and the total 1σ uncertainty of the velocity fit (km s 1 ). Fig. 3. Emission line radial velocity curves measured from the wings of the DIS spectra using the double Gaussian fitting technique. Fig. 4. Equivalent width curves of the prominent emission lines in the DIS spectra of UU Aqr. The top right panel shows the same Hα data as the top left panel plotted on an expanded scale to show the variation of the equivalent width outside of eclipse. Fig. 5. Light curve of UU Aqr obtained on 1995 August and UT. The top panel shows the entire curve, phased according to the ephemeris of BSC94, while the bottom panel shows a close-up of the region around the eclipse, with data obtained during different orbital cycles plotted with differently-shaped points. Fig. 6. Doppler tomograms for the Hβ emission line of UU Aqr from 1995 August to 1995 October. Panels (a f) were constructed using the binned RPCS data sets from (a) 1995 Aug 1 3 UT, (b) 1995 Aug 6 8 UT, (c) 1995 Aug UT, (d) 1995 Sep UT, (e) 1995 Sep UT, and (f) 1995 Sep UT. Panel (g) was constructed using the binned DIS data set. Panel (h) was constructed using the combined set of RPCS spectra. The secondary star Roche lobe and accretion stream trajectory are plotted in panels (g) and (h) using the system parameters determined by BSC94. Fig. 7. Doppler tomograms for several emission lines constructed from the DIS data: (a) Hα, (b) Hγ, (c) He I λ4471, (d) He II λ4686 (+ C III/N III). Fig. 8. Trailed spectra for the He ii + C iii/n iii emission complex (left), the He i λ4471 emission line (middle), and the Hγ emission line (right). Emission is dark; continuum is light. The spectra are repeated over two orbital cycles. Note that the velocity scale of the He ii panel is larger than that of the other two panels to show the adjacent C iii/n iii emission.
20 20 Fig. 9. Trailed spectrograms and Doppler tomograms of UU Aqr. The left panels show the Hα line from the DIS spectra. The right panels show the Hβ line from the total combined RPCS data set. The middle panels show simulated data. The Roche lobe of the secondary star, the path of the accretion stream (lower curve), and the position of Keplerian disk velocities under the stream trajectory (upper curve) have been plotted in the Doppler tomograms, based on the system parameters determined by BSC94. Fig. 10. Observed (solid line) and simulated (dotted line) orbital-phase-resolved emission line profiles for UU Aqr. The observed data is the Hα line from the DIS spectra. Fig. 11. Half-orbit tomograms for the Hα (left panels), Hβ (middle panels), and Hγ (right panels) emission lines of UU Aqr. The DIS data were used for Hα and Hγ; the RPCS data for Hβ. The tomograms in the top panels were constructed using only the spectra in the range 0.0 φ 0.5; those in the lower panels used only the spectra in the range 0.5 φ 1.0. The linear structures visible in the tomograms are artifacts caused by the decreased orbital phase coverage of the input spectra. Fig. 12. A schematic model of UU Aqr. The Roche-lobe-filling secondary star is shown on the right, and the white dwarf (black dot) and accretion disk are on the left. The orbital phases of a number of lines-of-sight through the system are labeled around the perimeter of the dashed circle enclosing the diagram. Phase 0.0 corresponds to the superior conjunction of the WD. The system rotates counter-clockwise in its orbit, which corresponds to an observer moving clockwise around the lines of sight down each fiducial phase. The lettered regions are described in 4.3 of the text.
21 21 Table 1. Observation Log Binned mid-jd of UT Time Orbital # of Data Set Binned Data Instrument UT Date Start End Phases Spectra RPCS 1995 Aug :24 02: RPCS 1995 Aug :16 02: RPCS 1995 Aug :33 02: RPCS 1995 Aug :58 03: RPCS 1995 Aug :44 02: RPCS 1995 Aug :43 02: RPCS 1995 Sep :20 01: RPCS 1995 Sep 20 20:05 22: RPCS 1995 Sep :16 00: RPCS 1995 Sep :13 00: RPCS 1995 Sep :43 01: RPCS 1995 Sep :40 00: DIS 1995 Oct 12 04:45 08: DIS 1995 Oct 13 05:06 08:
22 22 Table 2. Radial Velocity Parameters from Emission Line Wings Data Hβ: Hγ: Set γ a K φ 0 σ K /K σ TOTAL γ a K φ 0 σ K /K σ TOTAL (km s 1 ) (km s 1 ) (km s 1 ) (km s 1 ) (km s 1 ) (km s 1 ) 1 36(2) 117(12) 0.15(2) (4) 119(8) 0.15(2) (1) 113(18) 0.14(2) (3) 107(15) 0.11(2) (4) 114(12) 0.16(2) (5) 97(11) 0.18(2) (5) 95(11) 0.13(3) (10) 117(22) 0.12(4) (6) 77(12) 0.10(3) (4) 121(19) 0.15(3) (4) 113(16) 0.09(2) (8) 104(12) 0.08(3) (1) 115(6) 0.13(1) (2) 103(8) 0.10(1) Hα: He i λ5876: 7 4(1) 151(8) 0.21(1) (1) 61(7) 0.16(2) He i λ4471: c He ii λ4686: b,c a Heliocentric corrections applied to systemic velocities. b Blended with C iii/n iii emission. c Weighted average of velocity parameter values in the range a = km s 1 see text.
23 23 Table 3. Mean Emission Line Equivalent Widths (0.1 φ 0.9) Data Mean Equivalent Width (Å): Set UT Date Hβ Hγ He i λ4471 He ii λ4686 a Aug (1.1) 12.1(2.0) 1.4(0.7) 9.8(1.6) Aug (2.3) 12.7(1.4) 2.1(0.8) 9.7(1.4) Aug (3.4) 11.8(2.5) 2.1(1.4) 6.7(1.8) Sep (3.0) 13.3(7.5) 2.0(1.9) 8.2(5.7) Sep (3.6) 13.9(2.2) 2.6(1.2) 4.6(5.5) Sep (2.1) 12.1(3.2) 2.7(1.2) 8.5(1.8) Oct (2.8) 9.2(2.5) 0.0(1.0) 10.2(1.9) a Blended with C iii/n iii emission.
24
25
26
27
28
 -1000")


29 1000 (a) (b) (c) (d) 0 V y (km/s) (e) (f) (g) (h) V x (km/s)
 -1000 1000 (c)")

30 1000 (a) (b) 0 V y (km s -1 ) (c) (d) V x (km s -1 )
31
 0-1000 -1000 0 1000-1000 0 1000-1000 0 1000 V x (km s -1 )")
32 Velocity (km s -1 ) Orbital Phase V y (km s -1 ) V x (km s -1 )
33


34 Hα Hβ Hγ φ= V y (km s -1 ) φ= V x (km s -1 )
Radial velocity study of the intermediate polar EX Hydrae
 Mem. S.A.It. Vol. 83, 637 c SAIt 2012 Memorie della Radial velocity study of the intermediate polar EX Hydrae A. Ramirez-Torres 1, J. Echevarria 1 and R. Michel 2 1 Instituto de Astronomía, Universidad
Measuring the Motion of the Black Hole in GRO J
 Measuring the Motion of the Black Hole in GRO J1655 40 Roberto Soria 1,2, Dayal T. Wickramasinghe 2, Richard W. Hunstead 3,KinwahWu 3 Received 21 November 1997; accepted 12 January 1998 To appear on the
PoS(SSC2015)051. Multi-tomography of polars from SALT spectroscopy
051. Multi-tomography of polars from SALT spectroscopy") from SALT spectroscopy Stephen B. Potter 1 South African Astronomical Observatory Cape Town, South Africa E-mail: sbp@saao.ac.za Enrico J. Kotze South African Astronomical Observatory and Astrophysics,
from SALT spectroscopy Stephen B. Potter 1 South African Astronomical Observatory Cape Town, South Africa E-mail: sbp@saao.ac.za Enrico J. Kotze South African Astronomical Observatory and Astrophysics,
A Self-Occulting Accretion Disk in the SW Sex Star DW UMa 1
 A Self-Occulting Accretion Disk in the SW Sex Star DW UMa 1 Christian Knigge 2 Department of Astronomy, Columbia University, 550 West 120th Street, New York, NY 10027, USA Knox S. Long Space Telescope
U Gem Rediscussion of Radial Velocities and System Parameters. Józef I. S m a k
 ACTA ASTRONOMICA Vol. 51 (2001) pp. 279 293 U Gem Rediscussion of Radial Velocities and System Parameters by Józef I. S m a k N. Copernicus Astronomical Center, Polish Academy of Sciences, Bartycka 18,
High Time Resolution Photometry of V458 Vul
 High Time Resolution Photometry of V458 Vul Samia Bouzid 2010 NSF/REU Program Physics Department, University of Notre Dame Advisor: Dr. Peter Garnavich High Time-Resolution Photometry of Nova V458 Vul
arxiv:astro-ph/ v1 9 Oct 2002
 INTERPLAY BETWEEN PERIODIC, CYCLIC AND STOCHASTIC VARIABILITY IN SELECTED AREAS OF THE HR DIAGRAM ASP Conference Series, Vol. 000, 2003 C. Sterken, ed. A warped accretion disc in PX And? arxiv:astro-ph/0210198v1
Submitted for publication in the Monthly Notices of the Royal Astronomical Society. 17 June 1995
 Mon. Not. R. Astron. Soc. 000, 000{000 (1995) Spectropolarimetry of the nova-like variable V1315 Aquilae V. S. Dhillon 1 and R. G. M. Rutten 1;2 1 Royal Greenwich Observatory, Apartado de Correos 321,
The role of SW Sex stars in the evolution of CVs
 European Southern Observatory Chile Wild Stars in the West II, Tucson 2009 The orbital period distribution SW Sextantis stars in a nutshell Original definition (Thorstensen et al. 1991, AJ 102, 272): novalike
Two projects without apparent connection?
 Two projects without apparent connection? SW Sextantis stars SW Sextantis stars The golden age of surveys, Gänsicke 2005, Strassbourg SW Sextantis stars an introduction Original definition (Thorstensen
Received 2000 March 27; accepted 2000 April 26; published 2000 August 1
 The Astrophysical Journal, 539:L49 L53, 000 August 10 000. The American Astronomical Society. All rights reserved. Printed in U.S.A. A SELF-OCCULTING ACCRETION DISK IN THE SW SEXTANTIS STAR DW URSAE MAJORIS
The SW Sex enigma. Accepted 2012 October 26. Received 2012 October 24; in original form 2012 September 6. com/biglist (Hoard et al. 2003).
.") MNRAS 428, 3559 3568 (2013) doi:10.1093/mnras/sts294 The SW Sex enigma V. S. Dhillon, 1 D. A. Smith 2 and T. R. Marsh 3 1 Department of Physics and Astronomy, University of Sheffield, Sheffield S3 7RH
MNRAS 428, 3559 3568 (2013) doi:10.1093/mnras/sts294 The SW Sex enigma V. S. Dhillon, 1 D. A. Smith 2 and T. R. Marsh 3 1 Department of Physics and Astronomy, University of Sheffield, Sheffield S3 7RH
7. BINARY STARS (ZG: 12; CO: 7, 17)
") 7. BINARY STARS (ZG: 12; CO: 7, 17) most stars are members of binary systems or multiple systems (triples, quadruples, quintuplets,...) orbital period distribution: P orb = 11 min to 10 6 yr the majority
7. BINARY STARS (ZG: 12; CO: 7, 17) most stars are members of binary systems or multiple systems (triples, quadruples, quintuplets,...) orbital period distribution: P orb = 11 min to 10 6 yr the majority
OBSERVATIONS OF THE SW SEXTANTIS STAR DW URSAE MAJORIS WITH THE FAR ULTRAVIOLET SPECTROSCOPIC EXPLORER 1 D. W. Hoard. Paula Szkody. Cynthia S.
 The Astronomical Journal, 126:2473 2486, 2003 November # 2003. The American Astronomical Society. All rights reserved. Printed in U.S.A. OBSERVATIONS OF THE SW SEXTANTIS STAR DW URSAE MAJORIS WITH THE
Basics, types Evolution. Novae. Spectra (days after eruption) Nova shells (months to years after eruption) Abundances
 Nova shells (months to years after eruption) Abundances") Basics, types Evolution Novae Spectra (days after eruption) Nova shells (months to years after eruption) Abundances 1 Cataclysmic Variables (CVs) M.S. dwarf or subgiant overflows Roche lobe and transfers
Basics, types Evolution Novae Spectra (days after eruption) Nova shells (months to years after eruption) Abundances 1 Cataclysmic Variables (CVs) M.S. dwarf or subgiant overflows Roche lobe and transfers
Several Methods of Estimating Times of Minima in Cataclysmic Variables And Some Fesults for EX Dra
 WDS'2 Proceedings of Contributed Papers, Part III, 6 22, 22. ISBN 978-8-7378-226-9 MATFYZPRESS Several Methods of Estimating Times of Minima in Cataclysmic Variables And Some Fesults for EX Dra L. Pilarčík
Optical Photometry of Dwarf Nova QZ Serpentis in Quiescence
 Optical Photometry of Dwarf Nova QZ Serpentis in Quiescence Erica D. Jones Center for Astrophysics, Space Physics and Engineering Research at Baylor University Dr. Dwight Russell Department of Physics
Dark spot, Spiral waves and the SW Sex behaviour: it is all about UX Ursae Majoris
 Mon. Not. R. Astron. Soc., 1 16 (21) Printed 15 June 21 (MN LATEX style file v2.2) Dark spot, Spiral waves and the SW Sex behaviour: it is all about UX Ursae Majoris V. V. Neustroev 1, V. F. Suleimanov
arxiv:astro-ph/ v1 25 Feb 1999
 Mon. Not. R. Astron. Soc. 000, 1 12 (1999) Printed 1 February 2008 (MN LATEX style file v1.4) On the observability of spiral structures in CV accretion discs D. Steeghs 1, R. Stehle 2 1 Physics and Astronomy,
Infrared Spectroscopy of the Black Hole Candidate GRO J
 Infrared Spectroscopy of the Black Hole Candidate GRO J1655-40 1 Francis T. O Donovan March 19th, 2004 1 Based on a paper by F. T. O Donovan & P. J. Callanan (in preparation). Black Holes in the Sky At
Detailed ROSAT X-ray Analysis of the AM Her Cataclysmic Variable VV Pup
 Detailed ROSAT X-ray Analysis of the AM Her Cataclysmic Variable VV Pup E. El kholy 1,2 and M. I. Nouh 1,2. 1 Physics Department, College of Science, Northern Border University 1320, Arar, Saudi Arabia
arxiv:astro-ph/ v1 3 Feb 2004
 Astron. Nachr./AN 325, No. 0, 001 005 (2004) / DOI 10.1002/asna.20041XXXX What can we learn from Accretion Disc Eclipse Mapping experiments? RAYMUNDO BAPTISTA arxiv:astro-ph/0402059v1 3 Feb 2004 1. Introduction
arxiv:astro-ph/ v1 27 Nov 2006
 Mon. Not. R. Astron. Soc. 000, (2006) Printed 4 February 2008 (MN LATEX style file v2.2) Spectroscopic search for new SW Sextantis stars in the 3 4 hour orbital period range I. arxiv:astro-ph/0611829v1
arxiv:astro-ph/ v1 22 Nov 2000
 **TITLE** ASP Conference Series, Vol. **VOLUME**, **PUBLICATION YEAR** **EDITORS** OAO1657 415 : A Missing Link in High Mass X-ray Binaries? arxiv:astro-ph/0011401v1 22 Nov 2000 D.H. Maxwell, A.J. Norton
Short-period cataclysmic variables at Observatorio Astronomico Nacional IA UNAM.
 Contrib. Astron. Obs. Skalnaté Pleso 43, 294 299, (214) Short-period cataclysmic variables at Observatorio Astronomico Nacional IA UNAM. S. Zharikov Observatorio Astronomico Nacional, Instituto de Astronomia,
System parameters of the long-period polar V1309 Ori
 Astronomy & Astrophysics manuscript no. (will be inserted by hand later) System parameters of the long-period polar V1309 Ori A. Staude, A. D. Schwope, and R. Schwarz arxiv:astro-ph/0105362v1 21 May 2001
Study of Cataclysmic Variable B7 in NGC 6791: From the Ground and from Space
 Study of Cataclysmic Variable B7 in NGC 6791: From the Ground and from Space K. C. Magno College of Science, University of Notre Dame, Notre Dame, 46556 kmagno@nd.edu and P. M. Garnavich Department of
Cataclysmic Variable Stars
 Cataclysmic Variable Stars Modern Astronomy in Motion Jeffrey M. Bryant Product Manager Wolfram Research, Inc. Champaign, IL 61820 jeffb@wolfram.com October 22, 2002 1. Introduction. Cataclysmic variable
arxiv:astro-ph/ v1 9 Oct 2002
 Astronomy & Astrophysics manuscript no. MS2909 October 26, 2018 (DOI: will be inserted by hand later) Time-resolved, multi-color photometry and spectroscopy of Virgo 4 (OU Vir): a high orbital inclination,
The Binary System VV Cephei Eclipse Campaign 2017/2019 OHP-Meeting July 2017
 The Binary System VV Cephei Eclipse Campaign 2017/2019 OHP-Meeting July 2017 Ernst Pollmann International Working Group Active Spectroscopy in Astronomy http://astrospectroscopy.de 3 One of the best known
U GEMINORUM: A TEST CASE FOR ORBITAL PARAMETER DETERMINATION
 The Astronomical Journal, 134:262Y273, 2007 July # 2007. The American Astronomical Society. All rights reserved. Printed in U.S.A. A U GEMINORUM: A TEST CASE FOR ORBITAL PARAMETER DETERMINATION Juan Echevarría,
arxiv:astro-ph/ v1 25 Mar 1998
 Mon. Not. R. Astron. Soc. 000, 000 000 (0000) Printed 8 August 2018 (MN LATEX style file v1.4) A new method of determining the inclination angle in interacting binaries Tariq Shahbaz University of Oxford,
Phase-resolved high-resolution spectrophotometry of the eclipsing polar HU Aquarii
 Astron. Astrophys. 319, 894 908 (1997) ASTRONOMY AND ASTROPHYSICS Phase-resolved high-resolution spectrophotometry of the eclipsing polar HU Aquarii Axel D. Schwope 1,, Karl-Heinz Mantel 2,, and Keith
Determining the Orbital Period of the Cataclysmic Variable CSS1204 Using Data from the Vatican Advanced Technology Telescope
 Determining the Orbital Period of the Cataclysmic Variable CSS1204 Using Data from the Vatican Advanced Technology Telescope Amy Applegate 2012 NSF/REU Program Physics Department, University of Notre Dame
arxiv:astro-ph/ v1 6 Jun 2000
 Mon. Not. R. Astron. Soc. 000, 000 000 (0000) Printed 27 October 2018 (MN LATEX style file v1.4) Investigating the structure of the accretion disk in WZ Sge from multi-wave-band, time-resolved spectroscopic
arxiv:astro-ph/ v1 23 Oct 2002
 Evolution of the symbiotic nova RX Puppis J. Mikołajewska, E. Brandi, L. Garcia, O. Ferrer, C. Quiroga and G.C. Anupama arxiv:astro-ph/0210505v1 23 Oct 2002 N. Copernicus Astronomical Center, Bartycka
arxiv:astro-ph/ v1 1 Apr 1998
 Mon. Not. R. Astron. Soc. 000, 1 22 (1998) Printed 29 March 2018 (MN LATEX style file v1.4) HST spatially-resolved spectra of the accretion disc and gas stream of the nova-like variable UX Ursae Majoris
Mass transfer in Binary-System VV Cep
 Mass transfer in Binary-System VV Cep Fig: 1 Two of the best known and largest stars in space, which can be found hidden and close together within a dark interstellar cloud of dust in the constellation
Spectropolarimetry of Beta Lyrae: Constraining the Location of the Hot Spot and Jets
 Spectropolarimetry of Beta Lyrae: Constraining the Location of the Hot Spot and Jets Jamie R. Lomax 1 and Jennifer L. Hoffman 1 arxiv:1011.3548v1 [astro-ph.sr] 15 Nov 2010 1 University of Denver, Denver,
Photometric and spectroscopic observations of the 2014 eclipse of the complex binary EE Cephei
 Photometric and spectroscopic observations of the 2014 eclipse of the complex binary EE Cephei David Boyd Variable Star Section, British Astronomical Association, [davidboyd@orion.me.uk] Abstract We report
arxiv:astro-ph/ v1 29 May 2001
 Mon. Not. R. Astron. Soc. 000, 000 000 (1994) Printed 27 October 2018 (MN plain TEX macros v1.6) Spectroscopy and orbital periods of four cataclysmic variable stars John R. Thorstensen and Cynthia J. Taylor
SW Sextantis in an excited, low state
 Astronomy & Astrophysics manuscript no. (will be inserted by hand later) SW Sextantis in an excited, low state P.J. Groot 1,2, R.G.M. Rutten 3, and J. van Paradijs 1,4 1 Astronomical Institute Anton Pannekoek
Classification of nova spectra
 International Workshop on Stellar Spectral Libraries ASI Conference Series, 2012, Vol. 6, pp 143 149 Edited by Ph. Prugniel & H. P. Singh Classification of nova spectra G. C. Anupama Indian Institute of
HS : a new 4.2 hr eclipsing dwarf nova
 A&A manuscript no. (will be inserted by hand later) Your thesaurus codes are: 06 (02.01.1 04.19.1 08.02.2 08.02.2 08.09.2 08.14.2 ) HS 0907+1902: a new 4.2 hr eclipsing dwarf nova ASTRONOMY AND ASTROPHYSICS
arxiv: v1 [astro-ph.sr] 1 Jul 2012
![arxiv: v1 [astro-ph.sr] 1 Jul 2012](/thumbs/81/83375876.jpg "arxiv: v1 [astro-ph.sr] 1 Jul 2012") BD+36 3317: An Algol Type Eclipsing Binary in Delta Lyrae Cluster arxiv:1207.0194v1 [astro-ph.sr] 1 Jul 2012 O. Özdarcan, E. Sipahi, H. A. Dal Ege University, Science Faculty, Department of Astronomy and
BD+36 3317: An Algol Type Eclipsing Binary in Delta Lyrae Cluster arxiv:1207.0194v1 [astro-ph.sr] 1 Jul 2012 O. Özdarcan, E. Sipahi, H. A. Dal Ege University, Science Faculty, Department of Astronomy and
Transiting Exoplanet in the Near Infra-red for the XO-3 System
 Transiting Exoplanet in the Near Infra-red for the XO-3 System Nathaniel Rodriguez August 26, 2009 Abstract Our research this summer focused on determining if sufficient precision could be gained from
arxiv: v1 [astro-ph.sr] 4 May 2009
![arxiv: v1 [astro-ph.sr] 4 May 2009](/thumbs/93/112734420.jpg "arxiv: v1 [astro-ph.sr] 4 May 2009") Mon. Not. R. Astron. Soc. 000, 000 000 (0000) Printed 4 May 2009 (MN LATEX style file v2.2) The eclipsing Intermediate Polar V597 Pup (Nova Puppis 2007) arxiv:0905.0325v1 [astro-ph.sr] 4 May 2009 Brian
Mon. Not. R. Astron. Soc. 000, 000 000 (0000) Printed 4 May 2009 (MN LATEX style file v2.2) The eclipsing Intermediate Polar V597 Pup (Nova Puppis 2007) arxiv:0905.0325v1 [astro-ph.sr] 4 May 2009 Brian
WANTED THE TRUE BOUNCE -BACK SYSTEMS
 WANTED THE TRUE BOUNCE -BACK SYSTEMS Paczynski, B. & Sienkiewicz, R., 1981, ApJ, 248, L27 Paczynski, 1981, AcA, 31, 1 After reach the period minimum the CVs should be evolving back toward longer periods
Dwarf Nova Outbursts. III. The Viscosity Parameter. J. S m a k
 ACTA ASTRONOMICA Vol. 49 (1999) pp. 391 401 Dwarf Nova Outbursts. III. The Viscosity Parameter by J. S m a k N. Copernicus Astronomical Center, Polish Academy of Sciences, ul. Bartycka 18, 00-716 Warsaw,
PX Andromedae: Superhumps and variable eclipse depth
 A&A 394, 625 632 (2002) DOI: 10.1051/0004-6361:20021163 c ESO 2002 Astronomy & Astrophysics PX Andromedae: Superhumps and variable eclipse depth V. Stanishev 1, Z. Kraicheva 1,,H.M.J.Boffin 2,, and V.
THE OBSERVATION AND ANALYSIS OF STELLAR PHOTOSPHERES
 THE OBSERVATION AND ANALYSIS OF STELLAR PHOTOSPHERES DAVID F. GRAY University of Western Ontario, London, Ontario, Canada CAMBRIDGE UNIVERSITY PRESS Contents Preface to the first edition Preface to the
Eclipsing Binaries in Open Clusters
 Eclipsing Binaries in Open Clusters John Southworth (jkt@astro.keele.ac.uk) and Jens Viggo Clausen (jvc@astro.ku.dk) Niels Bohr Institute, Copenhagen University, Denmark. Abstract. The study of detached
Lab 4 Radial Velocity Determination of Membership in Open Clusters
 Lab 4 Radial Velocity Determination of Membership in Open Clusters Sean Lockwood 1, Dipesh Bhattarai 2, Neil Lender 3 December 2, 2007 Abstract We used the Doppler velocity of 29 stars in the open clusters
arxiv:astro-ph/ v2 1 Oct 2004
 Mon. Not. R. Astron. Soc. 000, 000 000 (0000) Printed 2 February 2008 (MN LATEX style file v2.2) ULTRACAM photometry of the eclipsing cataclysmic variable OU Vir arxiv:astro-ph/0310504v2 1 Oct 2004 W.
arxiv:astro-ph/ v1 24 Jan November 2018
 Mon. Not. R. Astron. Soc. 000, 000 000 (0000) Printed 3 November 2018 (MN LATEX style file v1.4) Variability of the Accretion Stream in the Eclipsing Polar EP Dra C.M. Bridge 1, Mark Cropper 1, Gavin Ramsay
Characterization of variable stars using the ASAS and SuperWASP databases
 Characterization of variable stars using the ASAS and SuperWASP databases Derck P. Smits Dept of Mathematical Sciences, PO Box 392, UNISA, 0003, South Africa E-mail: smitsdp@unisa.ac.za Abstract. A photographic
arxiv:astro-ph/ v1 9 Aug 2005
 Chin. J. Astron. Astrophys. preprint, Vol.5 (2005) Suppl., 57-62 (http:/www.chjaa.org ) Chinese Journal of Astronomy and Astrophysics arxiv:astro-ph/0508221v1 9 Aug 2005 Observations of Rapid Disk-Jet
Lab 4: Differential Photometry of an Extrasolar Planetary Transit
 Lab 4: Differential Photometry of an Extrasolar Planetary Transit Neil Lender 1, Dipesh Bhattarai 2, Sean Lockwood 3 December 3, 2007 Abstract An upward change in brightness of 3.97 ± 0.29 millimags in
Observingwith a LISA spectrograph. David Boyd BAAVSS, AAVSO, CBA
 Observingwith a LISA spectrograph David Boyd BAAVSS, AAVSO, CBA For me, the appeal of spectroscopy is in its scientific potential Photometry reveals changes in a star s brightness R Scutum Spectroscopy
Danny Steeghs University of Warwick
 Lecture 4 Danny Steeghs University of Warwick Reconstruction techniques Danny Steeghs University of Warwick Non-parametric methods Astro-tomography reconstruction tools: - Eclipse mapping Doppler Tomography
Open Research Online The Open University s repository of research publications and other research outputs
 Open Research Online The Open University s repository of research publications and other research outputs The mass of the black hole in LMC X-3 Conference or Workshop Item How to cite: Val-Baker, A. K.
Distribution of X-ray binary stars in the Galaxy (RXTE) High-Energy Astrophysics Lecture 8: Accretion and jets in binary stars
 High-Energy Astrophysics Lecture 8: Accretion and jets in binary stars") High-Energy Astrophysics Lecture 8: Accretion and jets in binary stars Distribution of X-ray binary stars in the Galaxy (RXTE) Robert Laing Primary Compact accreting binary systems Compact star WD NS BH
High-Energy Astrophysics Lecture 8: Accretion and jets in binary stars Distribution of X-ray binary stars in the Galaxy (RXTE) Robert Laing Primary Compact accreting binary systems Compact star WD NS BH
V5116 Sgr (Nova Sgr 2005b): an eclipsing supersoft postoutburst nova?
: an eclipsing supersoft postoutburst nova?") V5116 Sgr (Nova Sgr 2005b): an eclipsing supersoft postoutburst nova? (UPC-IEEC, Barcelona) Margarita Hernanz, Carlo Ferri (CSIC-IEEC, Barcelona) Jochen Greiner (MPE, Garching) X-ray emission from Classical
V5116 Sgr (Nova Sgr 2005b): an eclipsing supersoft postoutburst nova? (UPC-IEEC, Barcelona) Margarita Hernanz, Carlo Ferri (CSIC-IEEC, Barcelona) Jochen Greiner (MPE, Garching) X-ray emission from Classical
arxiv:astro-ph/ v1 17 Dec 2001
 Spectral properties of the Narrow-Line Seyfert 1 Quasar PG1211+143 arxiv:astro-ph/0112387v1 17 Dec 2001 A. Janiuk 1, B. Czerny 1, G.M. Madejski 2 1) N. Copernicus Astronomical Centre, Bartycka 18, 00-716,
University of Central Florida Department of Physics, PSB 132, 4000 University Blvd., Orlando, FL, USA
 University of Central Florida Department of Physics, PSB 132, 4000 University Blvd., Orlando, FL, USA E-mail: montgomery@physics.ucf.edul In this work, we review the evolutionary sequence of close binary
University of Warwick institutional repository:
 University of Warwick institutional repository: http://go.warwick.ac.uk/wrap This paper is made available online in accordance with publisher policies. Please scroll down to view the document itself. Please
Black Hole and Host Galaxy Mass Estimates
 Black Holes Black Hole and Host Galaxy Mass Estimates 1. Constraining the mass of a BH in a spectroscopic binary. 2. Constraining the mass of a supermassive BH from reverberation mapping and emission line
arxiv:astro-ph/ v1 1 Jun 2001
 Astronomy & Astrophysics manuscript no. (will be inserted by hand later) HST/STIS spectroscopy of the exposed white dwarf in the short-period dwarf nova EK TrA B.T. Gänsicke 1, P. Szkody 2, E.M. Sion 3,
Measuring Radial Velocities of Low Mass Eclipsing Binaries
 Measuring Radial Velocities of Low Mass Eclipsing Binaries Rebecca Rattray, Leslie Hebb, Keivan G. Stassun College of Arts and Science, Vanderbilt University Due to the complex nature of the spectra of
CHEMICAL ABUNDANCE ANALYSIS OF RC CANDIDATE STAR HD (46 LMi) : PRELIMINARY RESULTS
 : PRELIMINARY RESULTS") Dig Sites of Stellar Archeology: Giant Stars in the Milky Way Ege Uni. J. of Faculty of Sci., Special Issue, 2014, 145-150 CHEMICAL ABUNDANCE ANALYSIS OF RC CANDIDATE STAR HD 94264 (46 LMi) : PRELIMINARY
Dig Sites of Stellar Archeology: Giant Stars in the Milky Way Ege Uni. J. of Faculty of Sci., Special Issue, 2014, 145-150 CHEMICAL ABUNDANCE ANALYSIS OF RC CANDIDATE STAR HD 94264 (46 LMi) : PRELIMINARY
arxiv:astro-ph/ v1 20 Jul 2002
 Mon. Not. R. Astron. Soc. 000, 1 4 (2002) Printed 23 January 2014 (MN LATEX style file v1.4) Cyclical period changes in Z Chamaeleontis arxiv:astro-ph/0207438v1 20 Jul 2002 R. Baptista 1, F. Jablonski
Dr G. I. Ogilvie Lent Term 2005 INTRODUCTION
 Accretion Discs Mathematical Tripos, Part III Dr G. I. Ogilvie Lent Term 2005 INTRODUCTION 0.1. Accretion If a particle of mass m falls from infinity and comes to rest on the surface of a star of mass
Astronomy 421. Lecture 14: Stellar Atmospheres III
 Astronomy 421 Lecture 14: Stellar Atmospheres III 1 Lecture 14 - Key concepts: Spectral line widths and shapes Curve of growth 2 There exists a stronger jump, the Lyman limit, occurring at the wavelength
Dr. Reed L. Riddle. Close binaries, stellar interactions and novae. Guest lecture Astronomy 20 November 2, 2004
 Dr. Reed L. Riddle Close binaries, stellar interactions and novae Guest lecture Astronomy 20 November 2, 2004 Gravitational Tides Look at the forces acting on one body orbiting another - more pull on closer
Low state transitions in the nova-like cataclysmic variable HS Jeremy Shears. Abstract
 Low state transitions in the nova-like cataclysmic variable HS 0506+7725 Jeremy Shears Abstract The twelve-year light curve of the nova-like cataclysmic variable HS 0506+7725 between 2006 April and 2018
Analyzing Spiral Galaxies Observed in Near-Infrared
 Analyzing Spiral Galaxies Observed in Near-Infrared Preben Grosbøl European Southern Observatory Karl-Schwarzschild-Str. 2, D-85748 Garching, Germany Abstract A sample of 54 spiral galaxies was observed
Unstable Mass Transfer
 Unstable Mass Transfer When the mass ratios are large, or when the donor star has a deep convective layer (so R M-1/3), mass loss will occur on a dynamical timescale. The result will be common envelope
Analysis of the rich optical iron-line spectrum of the x-ray variable I Zw 1 AGN 1H
 Analysis of the rich optical iron-line spectrum of the x-ray variable I Zw 1 AGN 1H0707 495 H Winkler, B Paul Department of Physics, University of Johannesburg, PO Box 524, 2006 Auckland Park, Johannesburg,
Photometry of the Dwarf Nova SDSS J in Outburst
 Wils and Krajci, JAAVSO Volume 38, 2010 33 Photometry of the Dwarf Nova SDSS J094002.56+274942.0 in Outburst Tom Krajci Astrokolkhoz Observatory, P.O. Box 1351, Cloudcroft, New Mexico 88317; tom_krajci@tularosa.net
Emission-line oscillations in the dwarf nova V2051 Ophiuchi
 Mon. Not. R. Astron. Soc. 323, 484±496 2001) Emission-line oscillations in the dwarf nova V2051 Ophiuchi D. Steeghs, 1,2w K. O'Brien, 2w Keith Horne, 2w Richard Gomer 3w and J. B. Oke 4,5w 1 Astronomy
Photometric and spectroscopic observations of the outburst of the symbiotic star AG Draconis between March and June 2016
 Photometric and spectroscopic observations of the outburst of the symbiotic star AG Draconis between March and June 2016 David Boyd Variable Star Section, British Astronomical Association, [davidboyd@orion.me.uk]
R.E. Mennickent 1,, K. Matsumoto 2, and J. Arenas 3
 Astron. Astrophys. 348, 466 474 (1999) ASTRONOMY AND ASTROPHYSICS The orbital period of the dwarf nova HS Virginis, the revised P o P s relation and the superhump mass ratio distribution of SU UMa stars
Tidal effects and periastron events in binary stars
 Tidal effects and periastron events in binary stars Gloria Koenigsberger & Edmundo Moreno Universidad Nacional Autónoma de México gloria@fis.unam.mx; edmundo@astroscu.unam.mx December 8, 2008 ABSTRACT
A study of accretion disk wind emission
 Mem. S.A.It. Vol. 83, 525 c SAIt 2012 Memorie della A study of accretion disk wind emission R. E. Puebla 1, M. P. Diaz 1, and D. J. Hillier 2 1 Departamento de Astronomia, Instituto de Astronomia, Geofísica
arxiv:astro-ph/ v1 5 Sep 1995
 Observations of the X-ray Nova GRO J0422+32: II: Optical Spectra Approaching Quiescence. 1 arxiv:astro-ph/9509021v1 5 Sep 1995 Michael R. Garcia Paul J. Callanan Jeffrey E. McClintock Ping Zhao Center
Astrophysical Quantities
 Astr 8300 Resources Web page: http://www.astro.gsu.edu/~crenshaw/astr8300.html Electronic papers: http://adsabs.harvard.edu/abstract_service.html (ApJ, AJ, MNRAS, A&A, PASP, ARAA, etc.) General astronomy-type
The Wolf-Rayet + O binary WR 140 in Cygnus
 The Wolf-Rayet + O binary WR 140 in Cygnus http://spektroskopie.fg-vds.de Fachgruppe SPEKTROSKOPIE 1. The system The archetype of colliding-wind binary (CWB) systems is the 7.9-year period WR+O binary
A spectroscopic study of the long-period dwarf nova DX Andromedae
 Astron. Astrophys. 327, 1107 1113 (1997) ASTRONOMY AND ASTROPHYSICS A spectroscopic study of the long-period dwarf nova DX Andromedae Albert Bruch 1, Sonja Vrielmann 1,2,3, Frederic V. Hessman 2, Alexander
arxiv:astro-ph/ v1 12 Jan 1998
 To appear in Astronomical Journal, April 1998 issue HS0551+7241: A New Possible Magnetic Cataclysmic Variable in the Hamburg/CfA Bright Quasar Survey arxiv:astro-ph/9801101v1 12 Jan 1998 Danuta Dobrzycka
The Challenge of AZ Cas-Part 1. John Menke Barnesville, MD Abstract
 The Challenge of AZ Cas-Part 1 John Menke Barnesville, MD 20838 john@menkescientific.com www.menkescientific.com Abstract This is an interim report on observations of the spectrum of AZCas taken during
AG Draconis. A high density plasma laboratory. Dr Peter Young Collaborators A.K. Dupree S.J. Kenyon B. Espey T.B.
 AG Draconis A high density plasma laboratory Collaborators A.K. Dupree S.J. Kenyon B. Espey T.B. Ake p.r.young@rl.ac.uk Overview CHIANTI database Symbiotic Stars AG Draconis FUSE FUSE observations of AG
Analyzing X-Ray Pulses from Stellar Cores Pencil & Paper Version
 Analyzing X-Ray Pulses from Stellar Cores Pencil & Paper Version Purpose: To determine if two end products of stellar evolution GK Per and Cen X-3 could be white dwarfs or neutron stars by calculating
ECLIPSING AND SPECTROSCOPIC BINARY STARS
 FINAL YEAR SEMINAR, OLD PROGRAM ECLIPSING AND SPECTROSCOPIC BINARY STARS Author: Franci Gorjup Mentor: Prof. dr. Tomaž Zwitter Ljubljana, December 2013 Abstract: First, we will see, what kind of binary
The total luminosity of a disk with the viscous dissipation rate D(R) is
 is") Chapter 10 Advanced Accretion Disks The total luminosity of a disk with the viscous dissipation rate D(R) is L disk = 2π D(R)RdR = 1 R 2 GM Ṁ. (10.1) R The disk luminosity is half of the total accretion
Chapter 10 Advanced Accretion Disks The total luminosity of a disk with the viscous dissipation rate D(R) is L disk = 2π D(R)RdR = 1 R 2 GM Ṁ. (10.1) R The disk luminosity is half of the total accretion
Disk Instabilities in Close Binary Systems 25 Years of the Disk-Instability Model
 Disk Instabilities in Close Binary Systems 25 Years of the Disk-Instability Model Proceedings of the Disk-Instability Workshop on "Disk Instabilities in Close Binary Systems" held on October 27-30, 1998,
Orbital period analyses for the CVs inside the period gap
 Mem. S.A.It. Vol. 83, 614 c SAIt 2012 Memorie della Orbital period analyses for the CVs inside the period gap Z.-B. Dai 1,2 and S.-B. Qian 1,2 1 National Astronomical Observatories/Yunnan Observatory,
Accretion disk evolution in dwarf novae through outbursts: disk instability and mass-transfer instability cases
 Mem. S.A.It. Vol. 83, 530 c SAIt 2012 Memorie della Accretion disk evolution in dwarf novae through outbursts: disk instability and mass-transfer instability cases R. Baptista Departamento de Física, Universidade
THE ABSOLUTE DIMENSIONS OF THE OVERCONTACT BINARY FI BOOTIS
 The Astronomical Journal, 132:1153Y1157, 2006 September # 2006. The American Astronomical Society. All rights reserved. Printed in U.S.A. A THE ABSOLUTE DIMENSIONS OF THE OVERCONTACT BINARY FI BOOTIS Dirk
Absolute Flux Calibration for STIS First-Order, Low-Resolution Modes
 Instrument Science Report STIS 97-14 Absolute Flux Calibration for STIS First-Order, Low-Resolution Modes Ralph Bohlin, Space Telescope Science Institute Nicholas Collins, Hughes STX/LASP/GSFC Anne Gonnella,
Discovery of a New Gamma-Ray Binary: 1FGL J
 Discovery of a New Gamma-Ray Binary: 1FGL J1018.6-5856 Robin Corbet (UMBC/NASA GSFC) on behalf of the Fermi-LAT collaboration, & M.J. Coe, P.G. Edwards, M.D. Filipovic, J.L. Payne, J. Stevens, M.A.P. Torres