arxiv: v1 [astro-ph.co] 29 Jul 2011
|
|
|
- Solomon Simpson
- 5 years ago
- Views:
Transcription
1 A Study of Gravitational Lens Chromaticity with the Hubble Space Telescope 1 J.A. Muñoz 1, E. Mediavilla 2, C.S. Kochanek 3, E.E. Falco 4 and A.M. Mosquera 1,3 arxiv: v1 [astro-ph.co] 29 Jul Departamento de Astronomía y Astrofísica, Universidad de Valencia, E Burjassot, Valencia, Spain 2 Instituto de Astrofísica de Canarias, E La Laguna, Tenerife, Spain 3 Department of Astronomy, The Ohio State University, Columbus, OH 43210, USA 4 Harvard-Smithsonian Center for Astrophysics, 60 Garden St., Cambridge, MA 02138, USA jmunoz@uv.es ABSTRACT We report Hubble Space Telescope observations of 6 gravitational lenses with the Advanced Camera for Surveys. We measured the flux ratios between the lensed images in 6 filters from 8140Å to 2200Å. In 3 of the systems, HE , B , and H , we were able to construct UV extinction curves partially overlapping the 2175Å feature and characterize the properties of the dust relative to the Galaxy and the Magellanic Clouds. In HE we detect chromatic microlensing and use it to study the physical properties of the quasar accretion disk. For a Gaussian model of the disk exp( r 2 /2rs), 2 scaling with wavelength as r s λ p, we estimate r s (λ3363) = (7±4) light-days and p = 1.1±0.6 (1.0±0.6) for a logarithmic (linear) prior on r s. The remaining two systems, FBQ and SBS , yielded no useful estimates of extinction or chromatic microlensing. Subject headings: cosmology: observations gravitational lensing dust, extinction, accretion, accretion disk galaxies: ISM 1 Based on observationsmade with the NASA/ESA Hubble Space Telescope. The Space Telescope Science Institute is operated by the Association of Universities for Research in Astronomy, Inc. under NASA contract NAS
2 2 1. Introduction The wavelength-dependent flux ratios between gravitationally lensed images of quasars can be used to probe both the extinction law in the lens galaxy and the unresolved structure of the quasar. Each image is differentially extincted by dust along the path of the image through the lens galaxy, and this can be used to measure the extinction, the extinction law, and the lens redshift (e.g. Nadeau et al. 1991; Falco et al. 1999; Motta et al. 2002; Muñoz et al. 2004; Mediavilla et al. 2005; Eliasdottir et al. 2006, Mosquera et al. 2011). The second effect, microlensing by the stars in the lens galaxy (Chang & Refsdal 1979), leads to wavelength dependent changes in the flux ratios because the effective size of the quasar accretion disk varies with wavelength (Wisotzki et al. 1993, 1995; Wucknitz et al. 2003; Anguita et al. 2008; Bate et al. 2008; Eigenbrod et al. 2008; Poindexter et al.2008; Floyd et al. 2009; Mosquera et al. 2009, 2011; Blackburne et al. 2010; Mediavilla et al. 2011). Detections of chromaticity between the images of a lensed quasar are useful for studying both phenomena if they can be disentangled. In extragalactic astronomy, understanding dust is crucial to understanding galaxies, through its effects on estimates of star formation rates and galaxy evolution (e.g. Conroy et al. 2009), cosmology, through its effects on SNe Ia fluxes (e.g. Jha et al. 2006), and the interpretation of gamma-ray burst afterglows (e.g. Jakobsson et al. 2004)). Unfortunately, classical methods for obtaining accurate extinction curves to characterize dust cannot be used outside the Local Group because they depend on detailed measurements of individual stars. Gravitational lenses are one of the best quantitative astrophysical probes of dust properties at intermediate redshifts given lenses with the right amount of dust and the appropriate combinations of redshifts. If there is too little dust, it is difficult to measure the extinction at long wavelengths and microlensing is more likely to dominate the chromaticity. If there is too much dust, it becomes impossible to measure extinction curves into the rest-frame ultraviolet. Similarly, the lens redshift must be high enough to make the rest-frame 2175Å dust feature observable, while the source redshift must be low enough to avoid having the quasar continuum blocked by absorption in the intergalactic medium. Similar considerations hold for studying chromatic microlensing over the broadest possible wavelength baseline. We selected six lenses from the survey of extinction by Falco et al. (1999) that roughly satisfied these criteria: HE , FBQ , HE , H , SBS , and B As we report in 2, we observed them in 6 filters spanning 2200Å to 8100Å (F220W, F250W, F330W, F435W, F555W, F625W and F814W) using the Hubble Space Telescope (HST) and the ACS/HRC camera. This approach ensures that we can measure the image flux ratios without contamination from the lens or the host galaxy
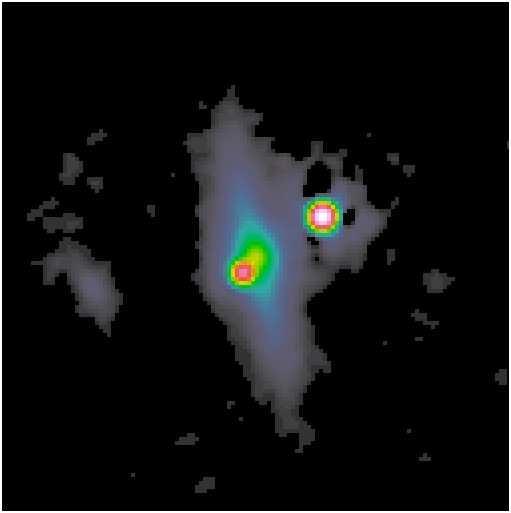
3 3 of the quasar. Section 2 also outlines how we model the results to study extinction and microlensing. In 3 we present the results, reporting on the extinction curves of three of the systems and the chromatic microlensing in one system. Section 4 summarizes the results and lessons for future observations. 2. Observations and Analysis Table 1 provides a log of our ACS/HRC observations based on 13 HST orbits in Cycle 12, Table 2 summarizes previous HST observations of these systems and Table 3 presents our new photometry. The observations in each filter consisted of multiple, dithered sub-exposures which were corrected for cosmic rays and combined using standard methods. We modeled the images following the procedures of Lehár et al. (2000). The images were fit as a combination of point sources, de Vaucouleurs and exponential disk profiles convolved with TinyTim (Krist & Hook 1997) PSF models. We determined the relative astrometry of the components and the structure of the lens galaxy using the CASTLES H-band images where the lens galaxy is best detected and characterized (see Fig. 1). These were then held fixed and the remaining images were fit to determine the fluxes of the components in each filter. For the bluer filters the lens galaxy was undetected and we could easily confirm the model fits with aperture photometry. Consider multiple images i of a single lensed quasar. Let m 0 (λ,t) be the intrinsic quasar flux at time t, expressed in magnitudes at observed wavelength λ. The redshifted, extincted flux of image i, is then ( ) λ m i (λ,t) = m 0 (λ,t) M i (λ,t)+e i R (1) 1+z l where M i (λ,t) and E i = E(B V) are the magnification (in magnitudes) and extinction of image i, and R(λ/(1+z l )) is the extinction curve at the lens redshift z l. The magnification M i (λ,t) may depend on wavelength and time due to microlensing effects (Wambsganss 2006 and references therein). By measuring the magnitude differences as a function of wavelength for each image pair (labeled i and j), ( ) λ m j (λ,t) m i (λ,t) = M(λ,t)+ E R (2) 1+z l we constrain the relative magnifications, M(λ,t) = M j (λ,t) M i (λ,t), the extinction differences, E(B V) = E j (B V) E i (B V), and the mean extinction curve R(λ). For the extinction law R(λ) we used either the Cardelli et al. (1989; hereafter CCM) parametrized models for the Galactic extinction curve or the Fitzpatrick & Massa (1990;
4 4 hereafter FM) model with its parameters set to match the average extinction in the SMC (Gordon et al. 2003). The main difference is that the Galactic models have a strong 2175Å absorption feature while the SMC models do not. One way to confirm the presence of extinction is to estimate a dust redshift z d (Jean & Surdej 1998, Falco et al. 1999), the redshift at which the extinction curve best fits the data, and show that it agrees with the observed lens redshift z l. We assume that the extinction law is the same for all images. Generally one image dominates the extinction and this assumption is unimportant, but it can be an issue if all images are significantly extincted (see Muñoz et al and McGough et al. 2005). For models assuming there is only extinction, we fit the data with a single M(λ, t) M, a common differential magnification for all wavelengths which removes any effects from the magnifications of the macro model and most of the effects of source variability. The second physical effect in Eqn. 2 is the chromatic microlensing produced by the M(λ, t) term. Because of the structure in the microlensing magnification patterns, the changing size of the disk with wavelength changes the magnification. Since the observer, lens, stars and host galaxy are all in relative motion, this magnification then changes with time. In our present study we will examine this using simulations. Based on the properties of the macro models for the lens geometry, we generate magnification patterns using the approach of Mediavilla et al. (2006), assuming that fraction α = 0.1 of the surface density is in stars (i.e. that the surface density is dark matter dominated, see Kochanek et al. 2006, Mediavilla et al. 2009, Pooley et al. 2009, Morgan et al. 2010, Mosquera et al. 2011) and we simply use M = 1M stars. We then convolve the patterns with Gaussian intensity profiles to model the quasar accretion disk, I(R) exp( R 2 /2rs 2) where r s λ p characterizes the disk size at wavelength λ. These sizes can be rescaled to a different microlensing mass as M/M. We make many random trials fitting the data as a function of r s and p, and then use Bayesian methods to estimate the size r s and the scaling exponent p for either linear or logarithmic priors on r s and linear priors on p, as explained in detail in Mediavilla et al. (2011). The last point we note is that our data are obtained at a single epoch, so our flux ratios are really comparing m 0 (λ,t) m 0 (λ,t+ t) where t is the time delay between the images. This means that intrinsic source variability combined with the time delay between the images can lead to wavelength dependent changes in the flux ratios which we will ignore by assuming that m 0 (λ,t) m 0 (λ,t+ t) 0. Particularly in the estimates of extinction, we will see negligible effects because the parameter M for the difference in the macro model magnifications also captures any achromatic effects from ignoring time variability. For most of the lenses we consider, these changes will be small, as can be seen from the empirical quasar variability models of MacLeod et al. (2010). Yonehara et al.
5 5 (2008) based on the ensemble SDSS quasar structure functions (Van den Berk et al. 2004; Ivezic et al. 2004) estimated that there would be typical shifts of 0.1 mag in single epoch observations, but that the changes in colors would be significantly smaller because the color changes associated with quasar variability are far smaller than the overall variability. We can compensate for this problem by using modestly larger uncertainties, but it is really only an issue for systems with long time delays. The worst case is HE which has a relatively long time delay of almost 6 months. If we follow the procedures of Yonehara et al. (2008), we estimate that the time delay can produce a bias in the shortest wavelength filter (F330W) of roughly 0.1 mag, with a potential color change between the F330W filter and the H-band of only 0.05 mag. 3. Results We now consider each of the systems individually. We found extinction in HE , B and H and chromatic microlensing in HE The remaining two systems, FBQ and SBS , did not show enough of a chromaticity signature to perform a deeper analysis given only a single epoch of data. In each of the analyses, it is necessary to determine whether the filters include any broad emission lines, because line and continuum flux ratios can be quite different (e.g. see Mediavilla el al. 2005). While both are equally altered by extinction, the broad emission line regions are more spatially extended and hence far less affected by microlensing (e.g. see Abajas et al. 2002). Here we are restricted to photometry, but by tracking the filter and line locations and widths we can determine the degree of contamination. Fig. 1 shows HST images of the 6 systems. Note that at least half of them are relatively disky, which is not the norm for gravitational lenses HE HE is a two image lensed quasar with a separation of and a source redshift of z s = (Gregg et al. 2000). The lens redshift is not directly measured, but the presence of a damped Lymanα absorber (DLA) system and associated strong metal line absorption systems suggests that the lens is a spiral galaxy at z l = 0.93 (Gregg et al. 2000, Wucknitz et al. 2003). Table 2 presents the photometry for the lens galaxy as well as the quasar images in the CASTLES data. While the time delays are not measured, they will be so short given the image separation that the single epoch flux ratios will be unaffected by intrinsic variability.
6 6 As we see in Fig. 2, the flux ratios have a steep dependence on the wavelength, and the slope is little changed from the earlier CASTLES results or the later results from Eliasdottir et al. (2006). While there are offsets between the epochs indicative of microlensing, they show no significant wavelength dependencies. Wucknitz et al. (2003) show that the broad emission line flux ratios, which should be very little affected by microlensing, show a wavelength dependence consistent with these trends. After correcting for extinction using the broad emission line flux ratios, they also find an effect from microlensing. Figure 3 shows the result of fitting the flux ratios assuming they are due to differential extinction. Like Wucknitz et al. (2003), and unlike Eliasdottir et al. (2006), we identify a weak 2175Å feature. The Galactic CCM extinction curve fits poorly, with χ 2 = 13 for 4 degrees of freedom (dof), an estimated R(V) < 0.5 and a best fit R(V) 0, a region where the model makes no sense. The model with the weaker feature of the mean SMC extinction law fits far better, with χ 2 = 2.8 for 5 dof and E(B V) = 0.06±0.01. If we allow the parameter responsible for the stretch of the bump (c3) in the FM extinction law to vary, we find a best fit with χ 2 = 1.1 for 4 dof and parameter c3 = 1.7±0.9 confirming the marginal detection of the bump by Wucknitz et al. (2003). The interpretation of the flux ratios as extinction and the feature as the 2175Å feature seems robust since we obtain a dust redshift of z d = 0.92±0.15 that is in good agreement with that of the DLA and metal line systems at z l = 0.93 (Gregg et al. 2000, Wucknitz et al. 2003). Although 25% of the CIV emission line lies in the F435W filter, we estimate that differential microlensing between the line and continuum of order 0.2 mag would lead to a line-induced bias in the estimated continuum flux ratios of only 0.01 mag. This is smaller than the photometric uncertainties and cannot explain the observed shift of 0.1 mag B B is a two image system with a separation of 1. 4, a source redshift of z s = 1.59 and a lens redshift of z l = 0.41 (Jackson et al. 1995) where the lens is a nearly edge on spiral (Jaunsen & Hjorth 1997). The time delay is relatively short ( 47 days, Koopmans et al. 2000, Burud et al. 2000), so single epoch flux ratios will be little affected by intrinsic variability. Not surprisingly, it was quickly found that the image passing through the disk of the galaxy suffered from extinction (Jaunsen & Hjorth 1997, Falco et al. 1999, Burud et al. 2000). Figure 4 shows the magnitude differences as a function of wavelength, where the redder image A is the image passing through the disk of the lens. The slope of the differences is little changed from the CASTLES observations, but there is an offset of approximately
7 7 0.2 mag. Thus, as for HE , the dominant effect is differential extinction with weaker effects due to microlensing that show no obvious wavelength dependence. Figure 5 shows a fit to the flux ratios assuming they are due to extinction, where we have used the 6 cm radio flux ratio (Koopmans et al. 2000) as an extinction-free anchor for the ratios. The data are well fit by a CCM extinction law with R(V) = 1.5 ± 0.3 and E(B V) = 0.39±0.02. The structure of the extinction law is not tightly constrained because the 2175Å feature is not only bluewards of our shortest wavelength filter but also lies on top of the Lyα line of the quasar. Dai & Kochanek (2005) estimated a gas column density difference between the images of cm 2 based on differences in the X-ray spectra of the two images. Using the extinction estimate of E(B V) 0.1 from Falco et al. (1999), this implied a dust-to-gas ratio that was somewhat high. However, if we adopt our new estimate, we find a dust-to-gas ratio of mag 1 cm 2 that is very close to the typical Galactic value of mag 1 cm 2 (Bohlin et al. 1978) H H is a four image system with a maximum separation of 1. 1 and z s = 2.55 (Magain et al. 1988). The lens galaxy is marginally detected at H-band and its redshift is unknown, although Kneib et al. (1998) propose z 0.9 based on the photometric redshifts of nearby galaxies. Figure 6 shows the magnitude differences for our HRC observations, the CASTLES data, the Turnshek (1997) and Chae (2001) data, and the mid-infrared (11µm) flux ratios from MacLeod et al. (2009). The small shifts between the epochs appear to be due to changes in the fluxes of images A and D, at levels of approximately 0.1 and 0.05 mag. The largest wavelength dependencies correspond to images A and B and the lack of significant changes in the colors with time indicates that they should be attributed to extinction. The lack of a wavelength dependence between images D and C suggests they are little affected by either extinction or chromatic microlensing at these wavelengths. The small bump in the F435W magnitude differences including image D (see Fig. 6) is probably due to the contamination by the Lyα emission line. In Figure 6 we also see that the flux ratios excluding image D (m A m C, m B m C ) extend naturally into the mid-ir as might be expected for extinction, while the flux rations including image D (m B m D, m D m C ) show significant shifts ( 0.2 mag) going from near-ir to the mid-ir. This seems more easily explained by microlensing, where the near-ir emission is from the accretion disk while the mid-ir emission is from thermal dust emission on larger scales. We conclude that A and B images are significantly affected by differential extinction from the lens galaxy. Unfortunately the lack of a candidate for the 2175 Å feature combined
8 8 with the unknown redshift of the lens galaxy makes it difficult to analyze the extinction. If the bump feature is present in the lens galaxy, its absence in our observations implies a very low lens redshift ( < 0.3), as illustrated by the example for a lens at z l = 0.25 shown in Fig. 7. The failure to detect the lens in the V and I-band HST observations almost certainly guarantees that the lens redshift cannot be so low. Thus we must conclude that the extinction law in this lens lacks a significant 2175Å feature HE HE is a two image lensed quasar with a relatively large separation of 3. 2 and a source redshift of z s = 2.32 (Wisotzki et al. 1993) and a lens redshift of z l = 0.73 (Lidman et al. 2000). Lehár et al. (2000) modeled the system in detail using the CASTLES images. The time delay is relatively long ( 162 days, Morgan et al. 2008), but based on the statistics of quasar variability discussed in 2 our single epoch flux ratios should not be strongly biased. Falco et al. (1999) modeled the flux ratios as extinction, although the X-ray absorption study by Dai et al. (2006) found negligible differential absorption. In fact, it was also clear from the later light curves (Schechter et al. 2003, Poindexter et al. 2007) that there was significant chromatic microlensing in this system. Indeed, as Poindexter et al. (2008) noted in their detailed study of microlensing the relative colors of the two images reversed over the period from its discovery, very different from the limited color changes seen in the first three lenses we considered. Further evidence against significant extinction is that the mid-ir flux ratios from Poindexter et al. (2007) agree well with the emission line flux ratios (Wisotzki et al. 1993). Figure 8 shows the magnitude differences for images A and B for each ACS/HRC filter, along with the CASTLES magnitude differences and the mid-ir flux ratios from Poindexter et al. (2007). We can see again the change in slope of the wavelength dependence between the two epochs indicating the detection of chromatic microlensing. We separately modeled the two epochs of HST observations using the procedures from Mediavilla et al. (2011) and Mosquera et al. (2011), as briefly outlined in 2, to compare the results from single epoch models to the more complex light curve modeling procedures used by Poindexter et al. (2008). Figure 9 shows the estimates for the scale radius r s in the F336W filter (1013Å in the rest frame) and the logarithmic slope p of the size with wavelength, r s λ p, for the HRC data, the CASTLES data and the combination of the two assuming either a logarithmic or a linear prior on r s. In thin disk theory, where the disk temperature profile is T R 3/4, we would expect to find p = 4/3. Given the nature of the chromatic microlensing detected in the HRC observations the uncertainties
9 9 are substantially greater than the ones derived from the CASTLES data, with its steeper, monotonic variations in the flux ratios, but the estimates (see Table 4) agree within the uncertainties. When we combine the two results, we find p = 1.1 ± 0.6 and r s = light-days for the logarithmic prior on the size, and p = 1.0±0.6 and r s = 7±4 light-days for the linear prior. We can compare to Poindexter et al. (2008), who used a different disk model and normalizing wavelength, by converting the scale lengths to the half-light radii R 1/2 of the models since Mortonson et al. (2005) showed that different microlensing models will agree on the half-light radius of the distribution. We transform our r s at λ = 3363Å to R 1/2 (λ4311) = 1.18 (4311/3363) p r s (λ3363) at the normalizing wavelength λ = 4311Å used by Poindexter et al. (2008), where their radius r disk corresponds to a half-light radius of R 1/2 = 2.49r λ In addition we rescale our microlens mass to M = 0.3M from M = 1M (r s M) as this is closer to the expectation for normal stellar populations (see Poindexter et al. 2008). Figure 10 shows that our combined results are in excellent agreement with those of Poindexter et al. (2008) FBQ FBQ is a two image lens with an image separation of 1. 1, a source redshift of z s = 1.24 (Schechter et al. 1998), and a lens redshift of z l = 0.260±0.002 (Eigenbrod et al. 2007). The time delay is short, 16 days (Jakobsson et al. 2005) and several studies have detected microlensing variability at the level of 0.04 mag/year (e.g., Schechter et al. 1998, Jakobsson et al. 2005, Paraficz et al. 2006). Figure 11 shows our measurements of the magnitude differences between the two images along with the differences found by CASTLES. The magnitudes of the differences are smaller than in the previous four systems, and it is clear that there is little differential extinction. This agrees with the similar conclusion of Mosquera et al. (2011) based on ground-based narrow band imaging. The UV data from HST allow to us cover the wavelength range where the bump feature is expected given the measured redshift of the lens galaxy. Although we see a small feature in the F250W filter, we cannot simply attribute it to the 2175Å bump because it also overlaps the Lyα emission line of the quasar. The differences between the present data and the CASTLES observations indicate the presence of chromatic microlensing, but the amplitudes are too small for single epoch microlensing models to yield significant results. Nonetheless, we confirm that FBQ is a good candidate for future measurements, reinforced by the fact that Morgan et al. (2010) were already able to estimate a disk size based on microlensing in the R-band light curves of this source.
10 SBS SBS is a two image lens with an image separation of 1. 6, a source redshift of z s = 1.86 and a lens redshift of z l = 0.72 (Chavushyan et al. 1997). Burud et al. (2002) measured a time delay for the system of 130 days, and Gaynullina et al. (2005) and Paraficz et al. (2006) observed microlensing at a level of 0.14 mag over roughly 4 years. Morgan et al. (2010) estimated an R-band half-light radius for the disk based on modeling these light curves. Unfortunately our HRC observations do not show a significant chromaticity signal to allow us to perform a deeper analysis. Figure 12 shows the magnitude differences as a function of wavelength for our HRC data and the CASTLES differences presented in Table 2. The wavelength dependent trends in the ACS/HRC observations are weak, indicating that the differential extinction is very low. Interpreting the CASTLES data is difficult because the V-band (F555W) flux ratio is so oddly different. We have inspected the CASTLES data several times and have been unable to find a systematic problem (e.g. missed cosmic rays) that would explain the discrepancies. 4. Discussion and Summary The effects of both extinction and microlensing become larger as we observe them at shorter wavelengths. Unfortunately, the atmosphere prevents us from observing into the ultraviolet from the ground, and so we generally cannot observe the rest-frame 2175Å region to search for the characteristic feature of Galactic and LMC extinction curves or to probe the hot regions near the inner edges of accretion disks. Here we surveyed six gravitational lenses with evidence for significant wavelength dependent flux ratios in the extinction study of Falco et al. (1999) from the I-band into the UV (8100Å to 2200Å). Two of the lenses, FBQ and SBS , showed changes with wavelength that were too small to yield interesting constraints. It is not surprising given the selection method that three of the lenses show significant evidence for differential extinction between the images. We argue for extinction dominating over chromatic microlensing systems based on the lack of evidence for significant time variability in the color, although all three systems show small changes in the flux ratios that are probably due to microlensing. In the case of HE we find evidence for a weak 2175Å feature from the dust in the z l = 0.93 lens. For B we cannot quite reach the wavelengths needed to quantify the presence of the 2175Å feature, although a CCM extinction law agrees with our observations, while the lack of a lens redshift for H limits our conclusions. Both systems contain significant differential extinction, and it is likely that the dust in B has the 2175Å feature and that the dust in H
11 11 does not. We clearly detect chromatic microlensing in HE If we estimate the wavelength dependent size of the accretion disk by modeling our single epoch of data or the earlier CASTLES data, we find compatible results. If we combine the two single epoch estimates, the combined result agrees with the multi-band light curve analyses of Poindexter et al. (2008). Modeled as a Gaussian source exp( r 2 /2rs 2) with r s λ p and normalized at the observed wavelength λ = 3363 Å we find r s = (7±4) and p = 1.1±0.6 (1.0±0.6) for a logarithmic (linear) prior on r s. These slopes are consistent with the expected slopes from standard thin disk theory (T R 1/p with p=4/3), but the uncertainties are too large to draw a stronger conclusion. This research was supported by the European Community s Sixth Framework Marie Curie Research Training Network Programme, Contract No. MRTN-CT ANGLES, and by the Spanish Ministerio de Educación y Ciencias (grants AYA C03-01/03 and AYA C03/02). J.A.M. is also supported by the Generalitat Valenciana with the grant PROMETEO/2009/64. A.M.M. is also supported by Generalitat Valenciana, grant APOSTD/2010/030. CSK is supported in part by NSF grant AST Based on observations made with the NASA/ESA Hubble Space Telescope, obtained at the Space Telescope Science Institute, which is operated by the Association of Universities for Research in Astronomy, Inc., under NASA contract NAS These observations are associated with program GO REFERENCES Abajas, C., Mediavilla, E., Muñoz, J. A., Popović, L. C., & Oscoz, A. 2002, ApJ, 576, 640 Anguita, T., Schmidt, R. W., Turner, E. L., Wambsganss, J., Webster, R. L., Loomis, K. A., Long, D., & McMillan, R. 2008, A&A, 480, 327 Bate, N. F., Floyd, D. J. E., Webster, R. L., & Wyithe, J. S. B. 2008, MNRAS, 391, 1955 Blackburne, J. A., & Kochanek, C. S. 2010, ApJ, 718, 1079 Bohlin, R. C., Savage, B. D., & Drake, J. F. 1978, ApJ, 224, 132 Burud, I., et al. 2000, ApJ, 544, 117 Burud, I., et al. 2002, A&A, 391, 481
12 12 Cardelli, J.A., Clayton, G.C. & Mathis, J.S., 1989, ApJ, 345, 245 Chae, K.-H., Turnshek, D. A., Schulte-Ladbeck, R. E., Rao, S. M., & Lupie, O. L. 2001, ApJ, 561, 653 Chang, K., & Refsdal, S. 1979, Nature, 282, 561 Chavushyan, V. H., Vlasyuk, V. V., Stepanian, J. A., & Erastova, L. K. 1997, A&A, 318, L67 Conroy, C., Gunn, J. E., & White, M. 2009, ApJ, 699, 486 Dai, X., & Kochanek, C. S. 2005, ApJ, 625, 633 Dai, X., Kochanek, C. S., Chartas, G., & Mathur, S. 2006, ApJ, 637, 53 Eigenbrod, A., Courbin, F., & Meylan, G. 2007, A&A, 465, 51 Eigenbrod, A., Courbin, F., Meylan, G., Agol, E., Anguita, T., Schmidt, R. W., & Wambsganss, J. 2008, A&A, 490, 933 Eliasdottir, A., Hjorth, J., Toft, S., Burud, I., & Paraficz, D. 2006, ApJS, 166, 443 Falco, E. E. et al. 1999, ApJ, 523, 617 Fitzpatrick, E.L,. & Massa, D., 1988, ApJ, 307, 734 Floyd, D. J. E., Bate, N. F., & Webster, R. L. 2009, MNRAS, 398, 233 Gaynullina, E. R., Schmidt, R. W., Akhunov, T., Burkhonov, O., Gottlober, S., Mirtadjieva, K., Nuritdinov, S. N., Tadjibaev, I., Wambsganss, J., & Wisotzki, L. 2005, A&A, 440, 53 Gordon, K. D., Clayton, G. C., Misselt, K. A., Landolt, A. U., & Wolff, M. J. 2003, ApJ, 594, 279 Gregg, M. D.,Wisotzki, L., Becker, R.H., Maza, J., Schechter, P. L., White,R. L., Brotherton, M. S., & Winn, J. N. 2000, AJ, 119, 2535 Ivezic, Ž., et al. 2004, The Interplay Among Black Holes, Stars and ISM in Galactic Nuclei, 222, 525 Jakobsson, P., et al. 2004, A&A, 427, 785
13 13 Jakobsson, P., Hjorth, J., Burud, I., Letawe, G., Lidman, C. & Courbin, F. 2005, A&A, 431, 103 Jackson, N., et al. 1995, MNRAS, 274, L25 Jaunsen, A. O. & Hjorth, J. 1997, A&A, 317, L39 Jean, C. & Surdej, J. 1998, A&A, 339, 729 Jha, S., et al. 2006, AJ, 131, 527 Kneib, J.-P., Alloin, D., & Pello, R. 1998, A&A, 339, L65 Kochanek, C. S., Morgan, N. D., Falco, E. E., McLeod, B. A., Winn, J. N., Dembicky, J., & Ketzeback, B. 2006, ApJ, 640, 47 Koopmans, L. V. E., de Bruyn, A. G., Xanthopoulos, E., & Fassnacht, C. D. 2000, A&A, 356, 391 Krist, J. E., & Hook, R. N. 1997, The 1997 HST Calibration Workshop with a New Generation of Instruments, 192 Lehár, J., et al. 2000, ApJ, 536, 584 Lidman, C., Courbin, F., Kneib, J.-P., Golse, G., Castander, F., & Soucail, G. 2000, A&A, 364, L62 McGough, C., Glayton, G. C., Gordon, K. D., & Wolff, M. J. 2005, ApJ, 624, 118 MacLeod, C. L., Kochanek, C. S., & Agol, E. 2009, ApJ, 699, 1578 MacLeod, C. L., et al. 2010, ApJ, 721, 1014 Magain, P., Surdej, J., Swings, J.-P., Borgeest, U., Kayser, R., Kühr, H., Refsdal, S., & Remy, M. 1988, Nature, 334, 325 Mediavilla, E., Muñoz, J. A., Kochanek, C. S., Falco, E. E., Arribas, S., & Motta, V. 2005, ApJ, 619, 749 Mediavilla, E., Muñoz, J. A., Lopez, P., et al. 2006, ApJ, 653, 942 Mediavilla, E., Muñoz, J. A., Falco, E. E. et al. 2009, ApJ, 706, 1451 Mediavilla, E., Muñoz, J. A., Kochanek C. S. et al. 2011, ApJ, 730, 16
14 14 Morgan, C. W., Kochanek, C. S., Dai, X., Morgan, N. D., & Falco, E. E. 2008, ApJ, 689, 755 Morgan, C. W., Kochanek, C. S., Morgan, N. D., & Falco, E. E. 2010, ApJ, 712, 1129 Mortonson, M. J., Schechter, P. L., & Wambsganss, J. 2005, ApJ, 628, 594 Mosquera, A. M., Muñoz, J. A., & Mediavilla, E. 2009, ApJ, 691, 1292 Mosquera, A. M., Muñoz, J. A., Mediavilla, E., & Kochanek C. S. 2011, ApJ, 728, 145 Motta, V., Mediavilla, E., Muñoz, J.A. et al. 2002, ApJ, 574, 719 Muñoz, J. A., Falco, E. E., Kochanek, C. S., McLeod, B. A., & Mediavilla, E. 2004, ApJ, 605, 614 Nadeau, D., Yee, H. K. C., Forrest, W. J., Garnett, J. D., Ninkov, Z., & Pipher, J. L. 1991, ApJ, 376, 430 Paraficz, D., Hjorth, J., Burud, I., Jakobsson, P., & Eliasdottir, A., 2006, A&A, 455, 1 Poindexter, S., Morgan, N., Kochanek, C. S., & Falco, E. E. 2007, ApJ, 660, 146 Poindexter, S., Morgan, N., & Kochanek, C. S. 2008, ApJ, 673, 34 Pooley, D., Rappaport, S., Blackburne, J., Schechter, P. L., Schwab, J., & Wambsganss, J. 2009, ApJ, 697, 1892 Schechter, P. L., Gregg, M. D., Becker, R. H., Helfand, D. J., & White, R. L. 1998, AJ, 115, 1371 Schechter, P. L., et al. 2003, ApJ, 584, 657 Turnshek, D. A., Lupie, O. L., Rao, S. M., Espey, B. R., & Sirola, C. J. 1997, ApJ, 485, 100 Vanden Berk, D. E., et al. 2004, ApJ, 601, 692 Wambsganss, J. 2006, in Saas-Fee Advanced Course 33, Gravitational Lensing: Strong, Weak and Micro, ed. G. Meylan, P. Jetzer, & P. North (Berlin: Spri nger), 453 Wisotzki, L., Köhler, T., Kayser, R., & Reimers, D. 1993, A&A, 278, L15 Wisotzki, L., Koehler, T., Ikonomou, M., & Reimers, D. 1995, A&A, 297, 59 Wucknitz, O., Wisotzki, L., Lopez, S., & Gregg, M. D. 2003, A&A, 405, 445
15 15 Yonehara, A., Hirashita, H., & Richter, P. 2008, A&A, 478, 95 This preprint was prepared with the AAS L A TEX macros v4.0.


16 16 HE FBQ HE H SBS B
17 17 Fig. 2. Magnitude differences of HE as a function of the inverse of the observed wavelength for the new HST observations (filled squares) along with the previous CASTLES observations (open triangles) and the ground-based data from Eliasdottir et al. (2006) (asterisks). The shaded regions correspond to the wavelength location and width of the most prominent quasar broad emission lines. The vertical solid line indicates the expected position of the 2175Å extinction curve feature based on the estimated lens redshift. The horizontal error bars on the HST data indicate the widths of the filters.
18 18 Fig. 3. Magnitude differences as a function of the inverse of the lens rest-frame wavelength for the new HST observations (filled squares). The solid line shows the best fit FM extinction law allowing variations in the stretch of the bump and the dust redshift. The dashed line corresponds to the best fit for a Galactic CCM extinction law with R(V) = 0.5.
19 19 Fig. 4. Magnitude differences of B as a function of the inverse of the observed wavelength for the new HST observations (filled squares) along with the previous CASTLES observations (open triangles). The format of the figure is the same as in Figure 2.
20 20 Fig. 5. Magnitude differences as a function of the inverse of the lens rest-frame wavelength for the new HST observations (filled squares) and the 6 cm radio flux (open triangle) from Koopmans et al. (2000). The solid line shows the best fit for a CCM extinction law.
21 21 Fig. 6. Magnitude differences of H as a function of the inverse of the observed wavelength for the new HST observations (filled squares) along with the previous CASTLES observations (open triangles) and the mid-infrared flux (large open symbols: squares or circles when de D image is present, see text) from MacLeod et al. (2009). We have also shown the results from Turnshek (1997) (asterisks) and Chae (2001) (open circles). In some cases these points are completely hidden by our new measurements. The format of the figure is the same as in Figure 2.
22 22 Fig. 7. ACS/HRC andmid-infrared(macleodet al. 2009)magnitude differences m B m C and m A m C, which are strongly indicative of extinction. As an example, the solid lines show fits with the same CCM extinction law for a fixed lens redshift z l = For the more probable, higher lens redshift, where the location of the 2175Å feature should be shifted to the left, successful fits require extinction laws without a strong 2175Å feature.
23 23 Fig. 8. Magnitude differences of HE as a function of the inverse of the observed wavelength for the new HST observations (filled squares) along with the previous CASTLES observations (open triangles) and the mid-ir observations (open square) from Poindexter et al. (2007). The format of the figure is the same as in Figure 2.
24 24 Fig. 9. Probability distributions for the size of the quasar accretion disk r s at an observed wavelength of 3363Å and the dependence of the size on wavelength, r s λ p, assuming a linear (left) or logarithmic (right) prior for r s, and using either the new HRC data (top), the older CASTLES data (middle) or the combined results (bottom). From the center, the contours are iso-probability density contours enclosing 15%, 47%, 68%, and 90% of the total probability, respectively.
25 25 Fig. 10. Comparisons of the half-light radii R 1/2 at λ = 4311Å for our combined single epoch models (squares) and the multi-band light curve analysis (circles) of Poindexter et al. (2008). Open (filled) symbols correspond to logarithmic (linear) priors on r s. The dashed horizontal lines represent the size estimates inferred from the black-hole mass based on the thin disk theory (upper) or the observed I-band flux (lower) (see Poindexter et al. 2008). In this composition we have shifted the mean microlens mass to 0.3 M (see text) in order to better compare to Poindexter et al. (2008).
26 26 Fig. 11. Magnitude differences of FBQ as a function of the inverse of the observed wavelength for the new HST observations (filled squares) along with the previous CASTLES observations (open triangles). The format of the figure is the same as in Figure 2.
27 27 Fig. 12. Magnitude differences of SBS as a function of the inverse of the observed wavelength for the new HST observations (filled squares) along with the previous CASTLES observations (open triangles). The format of the figure is the same as in Figure 2.
28 28 Table 1. Log of ACS/HRC Observations TARGET DATE-OBS FILTER EXP No. of images (yyyy-mm-dd) (sec) HE F220W F220W F250W F250W F330W F330W F435W F435W F555W F555W F625W F625W F814W F814W F814W FBQ F220W F220W F250W F250W F330W F330W F330W F435W F435W F435W F555W F555W F555W F625W F625W F625W F814W F814W F814W 4 2 HE F250W F250W F250W F330W F330W F330W F330W F435W F435W F555W F555W F625W F625W F814W F814W H F330W F330W F435W F435W F555W F555W F625W 16 4
29 29 Table 1 Continued TARGET DATE-OBS FILTER EXP No. of images (yyyy-mm-dd) (sec) SBS F250W F250W F330W F330W F435W F435W F555W F555W F625W F625W F814W F814W B F330W F435W F555W F625W F814W
30 30 Table 2. CASTLES Photometry Lens Component R.A. ( ) Dec ( ) F555W F814W F160W HE image A ± ± ± ± ± 0.02 image B ± ± ± 0.03 lens G 0.09± ± ± ± ±0.8 FBQ image A ± ± ± 0.03 image B ± ± ± ± ± 0.03 lens G ± ± ± ± ± 0.14 HE image A ± ± ± 0.01 image B ± ± ± ± ± 0.03 lens G ± ± ± ± ± 0.09 H image A ± ± ± 0.04 image B ± ± ± ± ± 0.03 image C ± ± ± ± ± 0.02 image D ± ± ± ± ± 0.03 lens G ± ± ± 0.03 SBS image A ± ± ± 0.02 image B ± ± ± ± ± 0.03 lens G ± ± ± ± ± 0.05 B image A ± ± ± 0.03 image B ± ± ± ± ± 0.03 lens G ± ± ± ± 0.13 Note. For the system H it corresponds to the filter F702W Table 3. ACS/HRC Photometry Lens Image F220W F250W F330W F435W F555W F625W F814W HE A 18.96± ± ± ± ± ± ±0.03 B 18.33± ± ± ± ± ± ±0.03 FBQ A 16.72± ± ± ± ± ± ±0.03 B 17.97± ± ± ± ± ± ±0.05 HE A 17.25± ± ± ± ±0.05 B 18.20± ± ± ± ±0.07 H A 20.84± ± ± ± ± ±0.03 B 21.40± ± ± ± ± ±0.01 C 20.45± ± ± ± ± ±0.02 D 20.78± ± ± ± ± ±0.01 SBS A 18.23± ± ± ± ± ±0.04 B 19.40± ± ± ± ± ±0.04 B A 25.68± ± ± ± ±0.03 B 22.55± ± ± ± ±0.06
31 31 Table 4. Quasar Accretion Disk Measurements for HE ACS CASTLES ACS x CASTLES Logarithmic prior r s (light-days) p 1.8± ± ±0.6 Linear prior r s (light-days) 12±6 7±4 7±4 p 1.8± ± ±0.6 Note. r s is the size of the quasar accretion disk modeled as a Gaussian (I(R) exp( R 2 /2rs 2 )) at the observed wavelength λ = 3363Å and p is the power law of the size variation with wavelength (r s (λ) λ p ).
arxiv:astro-ph/ v1 23 Dec 2005
 3D spectroscopy as a tool for investigation of the BLR of lensed QSOs Luka Č. Popović Astronomical Observatory, Volgina 7, 11160 Belgrade, Serbia lpopovic@aob.bg.ac.yu arxiv:astro-ph/0512594v1 23 Dec 2005
arxiv: v1 [astro-ph.ga] 8 Nov 2018
![arxiv: v1 [astro-ph.ga] 8 Nov 2018](/thumbs/90/101372073.jpg "arxiv: v1 [astro-ph.ga] 8 Nov 2018") DRAFT VERSION NOVEMBER 9, 2018 Typeset using L A TEX twocolumn style in AASTeX61 ESTIMATE OF THE ACCRETION DISK SIZE IN THE GRAVITATIONALLY LENSED QUASAR HE 0435-1223 USING MICROLENSING MAGNIFICATION STATISTICS
DRAFT VERSION NOVEMBER 9, 2018 Typeset using L A TEX twocolumn style in AASTeX61 ESTIMATE OF THE ACCRETION DISK SIZE IN THE GRAVITATIONALLY LENSED QUASAR HE 0435-1223 USING MICROLENSING MAGNIFICATION STATISTICS
arxiv:astro-ph/ v2 16 May 2007
 Mid-IR Observations and a Revised Time Delay for the Gravitational Lens System Quasar HE 1104 1805 Shawn Poindexter 1, Nicholas Morgan 1, Christopher S. Kochanek 1, Emilio E. Falco 2 arxiv:astro-ph/0612045v2
HST Observations of the Gravitational Lens Systems HE and J03.13
 1997 HST Calibration Workshop Space Telescope Science Institute, 1997 S. Casertano, et al., eds. HST Observations of the Gravitational Lens Systems HE 1104 1805 and J03.13 M. Remy, J.-F. Claeskens, 1 and
PoS(LCDU 2013)010. The extinction law at high redshift. Simona Gallerani Scuola Normale Superiore
010. The extinction law at high redshift. Simona Gallerani Scuola Normale Superiore") Scuola Normale Superiore E-mail: simona.gallerani@sns.it We analyze the optical-near infrared spectra of 33 quasars with redshifts 3.9 < z < 6.4 with the aim of investigating the properties of dust extinction
Scuola Normale Superiore E-mail: simona.gallerani@sns.it We analyze the optical-near infrared spectra of 33 quasars with redshifts 3.9 < z < 6.4 with the aim of investigating the properties of dust extinction
arxiv:astro-ph/ v1 18 May 2000
 A&A manuscript no. (will be inserted by hand later) Your thesaurus codes are: 0(1.07.1; 11.17.4: QSO 0957+561) ASTRONOMY AND ASTROPHYSICS Constraints on source and lens parameters from microlensing variability
Constraints on source and lens parameters from microlensing variability in QSO A,B
 Astron. Astrophys. 360, 10 14 (000) Constraints on source and lens parameters from microlensing variability in QSO 0957+561 A,B ASTRONOMY AND ASTROPHYSICS S. Refsdal 1,5, R. Stabell,5,J.Pelt 3,5, and R.
High Redshift Universe
 High Redshift Universe Finding high z galaxies Lyman break galaxies (LBGs) Photometric redshifts Deep fields Starburst galaxies Extremely red objects (EROs) Sub-mm galaxies Lyman α systems Finding high
Extragalactic Microlensing: Quasars, Caustics & Dark Matter
 Extragalactic Microlensing: Quasars, Caustics & Dark Matter Joachim Wambsganss Universität Heidelberg April 22, 2009 JENAM / NAM University of Hertfordshire Extragalactic Microlensing: Quasars, Caustics
Redshifts and lens profile for the double quasar QJ (Research Note)
") Astronomy & Astrophysics manuscript no. qj0158 4 c ESO 2008 December 3, 2008 Redshifts and lens profile for the double quasar QJ 0158-4325 (Research Note) C. Faure 1,2, T. Anguita 2, A. Eigenbrod 1, J.-P.
Astronomy & Astrophysics manuscript no. qj0158 4 c ESO 2008 December 3, 2008 Redshifts and lens profile for the double quasar QJ 0158-4325 (Research Note) C. Faure 1,2, T. Anguita 2, A. Eigenbrod 1, J.-P.
Extragalactic DM Halos and QSO Properties Through Microlensing
 Extragalactic DM Halos and QSO Properties Through Micro Eduardo Guerras (student) - Evencio Mediavilla (supervisor) Instituto de Astrofísica de Canarias Photon deflection by gravitating mass α = 4GM 2
Microlensing Constraints on Quasar X-ray Emission Regions
 Microlensing Constraints on Quasar X-ray Emission Regions Xinyu Dai (Univ. of Oklahoma) Bin Chen (Univ. of Oklahoma) Chris Kochanek (Ohio State Univ.) George Chartas (College of Charleston) Chris Morgan
Inspiration: Microlensing of Quasar Broad Emission Lines: Constraints on Broad Line Region Size E. Guerras et al. 2012, astro-ph/1207.
 Lecture 3: Microlensing of Quasar Broad Emission Lines Case study: 18 image pairs in 16 lenses Emilio E. Falco Smithsonian Astrophysical Observatory F. L. Whipple Observatory 670 Mt. Hopkins Rd. Amado,
Received 2002 July 19; accepted 2003 May 7
 The Astrophysical Journal, 594:279 293, 2003 September 1 # 2003. The American Astronomical Society. All rights reserved. Printed in U.S.A. A QUANTITATIVE COMPARISON OF THE SMALL MAGELLANIC CLOUD, LARGE
Gravitational Lensing: Strong, Weak and Micro
 P. Schneider C. Kochanek J. Wambsganss Gravitational Lensing: Strong, Weak and Micro Saas-Fee Advanced Course 33 Swiss Society for Astrophysics and Astronomy Edited by G. Meylan, P. Jetzer and P. North
Dust properties of galaxies at redshift z 5-6
 Dust properties of galaxies at redshift z 5-6 Ivana Barisic 1, Supervisor: Dr. Peter L. Capak 2, and Co-supervisor: Dr. Andreas Faisst 2 1 Physics Department, University of Zagreb, Zagreb, Croatia 2 Infrared
THE TRANSVERSE PECULIAR VELOCITY OF THE Q LENS GALAXY AND THE MEAN MASS OF ITS STARS
 The Astrophysical Journal, 712:658 667, 2010 March 20 C 2010. The American Astronomical Society. All rights reserved. Printed in the U.S.A. doi:10.1088/0004-637x/712/1/658 THE TRANSVERSE PECULIAR VELOCITY
arxiv: v3 [astro-ph.co] 23 Jul 2015
![arxiv: v3 [astro-ph.co] 23 Jul 2015](/thumbs/76/74446680.jpg "arxiv: v3 [astro-ph.co] 23 Jul 2015") Astronomy & Astrophysics manuscript no. h0_paper c ESO 205 July 24, 205 H 0 from ten well-measured time delay lenses S. Rathna Kumar, 2, C. S. Stalin, and T. P. Prabhu Indian Institute of Astrophysics,
Astronomy & Astrophysics manuscript no. h0_paper c ESO 205 July 24, 205 H 0 from ten well-measured time delay lenses S. Rathna Kumar, 2, C. S. Stalin, and T. P. Prabhu Indian Institute of Astrophysics,
arxiv: v1 [astro-ph.ga] 31 Jan 2018
![arxiv: v1 [astro-ph.ga] 31 Jan 2018](/thumbs/79/79937347.jpg "arxiv: v1 [astro-ph.ga] 31 Jan 2018") Draft version February 2, 2018 Typeset using L A TEX preprint style in AASTeX61 PROBING PLANETS IN EXTRAGALACTIC GALAXIES USING QUASAR MICROLENSING Xinyu Dai 1 and Eduardo Guerras 1 arxiv:1802.00049v1
Draft version February 2, 2018 Typeset using L A TEX preprint style in AASTeX61 PROBING PLANETS IN EXTRAGALACTIC GALAXIES USING QUASAR MICROLENSING Xinyu Dai 1 and Eduardo Guerras 1 arxiv:1802.00049v1
An optical time delay for the double gravitational lens system FBQ arxiv:astro-ph/ v1 17 Sep 2004
 Astronomy & Astrophysics manuscript no. 1432 February 2, 2008 (DOI: will be inserted by hand later) An optical time delay for the double gravitational lens system FBQ 0951+2635 arxiv:astro-ph/0409444v1
arxiv:astro-ph/ v1 30 Sep 2004
 New V R magnification ratios of QSO 0957+561 L. J. Goicoechea 1, R. Gil Merino 1, A. Ullán 1,M. Serra Ricart 2, J. A. Muñoz 3, E. Mediavilla 2, J. González Cadelo 1, A. Oscoz 2 arxiv:astro-ph/0409763v1
arxiv:astro-ph/ v1 16 Jan 1997
 Inclination Effects in Spiral Galaxy Gravitational Lensing Ariyeh H. Maller, Ricardo A. Flores and Joel R. Primack ABSTRACT arxiv:astro-ph/9700v 6 Jan 997 Spheroidal components of spiral galaxies have
Hubble Space Telescope ultraviolet spectroscopy of blazars: emission lines properties and black hole masses. E. Pian, R. Falomo, A.
 Hubble Space Telescope ultraviolet spectroscopy of blazars: emission lines properties and black hole masses E. Pian, R. Falomo, A. Treves 1 Outline Extra Background Introduction Sample Selection Data Analysis
THE THIRD IMAGE OF THE LARGE-SEPARATION LENSED QUASAR SDSS J
 Preprint typeset using L A TEX style emulateapj v. 10/09/06 SLAC-PUB-13104 February 2008 THE THIRD IMAGE OF THE LARGE-SEPARATION LENSED QUASAR SDSS J1029+2623 1 Masamune Oguri, 2 Eran O. Ofek, 3 Naohisa
Gravitational microlensing of active galactic nuclei dusty tori
 Mon. Not. R. Astron. Soc. 425, 1576 1584 (2012) doi:10.1111/j.1365-2966.2012.21611.x Gravitational microlensing of active galactic nuclei dusty tori Marko Stalevski, 1,2,3 Predrag Jovanović, 1,3 Luka Č.
Precision cosmology with Type Ia Supernovae?
 Precision cosmology with Type Ia Supernovae? Reynald Pain LPNHE, CNRS/IN2P3 & Universités Paris 6 and Paris 7 Outline I will used the SNLS 1st year data and analysis to try answer the following questions
arxiv:astro-ph/ v2 19 Jan 2007
 stronomy & strophysics manuscript no. 6939 c ESO 2018 March 6, 2018 COSMORIL: the COSmological MOnitoring of RvItational Lenses arxiv:astro-ph/0612419v2 19 Jan 2007 VI. Redshift of the lensing galaxy in
arxiv:astro-ph/ v1 16 Apr 2004
 AGN Physics with the Sloan Digital Sky Survey ASP Conference Series, Vol. 311, 2004 G.T. Richards and P.B. Hall, eds. Quasars and Narrow-Line Seyfert 1s: Trends and Selection Effects arxiv:astro-ph/0404334v1
arxiv:astro-ph/ v1 23 Jan 2005
 Impact of Gravitational Lensing on Cosmology Proceedings IAU Symposium No. 225, 2004 Mellier, Y. & Meylan,G. eds. c 2004 International Astronomical Union DOI: 00.0000/X000000000000000X Quasar Lensing Statistics
MASS AND DUST IN THE DISK OF A SPIRAL LENS GALAXY Joshua N. Winn, 1,2 Patrick B. Hall, 3,4 and Paul L. Schechter 5
 The Astrophysical Journal, 597:672 679, 2003 November 10 # 2003. The American Astronomical Society. All rights reserved. Printed in U.S.A. MASS AND DUST IN THE DISK OF A SPIRAL LENS GALAXY Joshua N. Winn,
Interstellar Dust and Extinction
 University of Oxford, Astrophysics November 12, 2007 Outline Extinction Spectral Features Emission Scattering Polarization Grain Models & Evolution Conclusions What and Why? Dust covers a range of compound
Strong gravitational lensing
 Strong gravitational lensing Olaf Wucknitz, JIVE, Dwingeloo, NL Mike Garrett, JIVE, Dwingeloo, NL Neal Jackson, Jodrell Bank, UK Dieter Engels, Hamburger Sternwarte, Germany 1 Introduction The gravitational
IMAGE DECONVOLUTION OF THE RADIO RING PKS F. Courbin. C. Lidman. B. L. Frye. P. Magain 2. T. J. Broadhurst
 The Astrophysical Journal, 499:L119 L123, 1998 June 1 1998. The American Astronomical Society. All rights reserved. Printed in U.S.A. IMAGE DECONVOLUTION OF THE RADIO RING PKS 1830 211 1 F. Courbin Institut
Chapter 10: Unresolved Stellar Populations
 Chapter 10: Unresolved Stellar Populations We now consider the case when individual stars are not resolved. So we need to use photometric and spectroscopic observations of integrated magnitudes, colors
Inclination Effects in Spiral Galaxy Gravitational Lensing
 Inclination Effects in Spiral Galaxy Gravitational Lensing Ariyeh H. Maller 1, Ricardo A. Flores 2 and Joel R. Primack 1 Received ; accepted 1 Physics Department, University of California, Santa Cruz,
Lecture 11: SDSS Sources at Other Wavelengths: From X rays to radio. Astr 598: Astronomy with SDSS
 Astr 598: Astronomy with SDSS Spring Quarter 4, University of Washington, Željko Ivezić Lecture : SDSS Sources at Other Wavelengths: From X rays to radio Large Surveys at Many Wavelengths SDSS: UV-IR five-band
Type II Supernovae as Standardized Candles
 Type II Supernovae as Standardized Candles Mario Hamuy 1 2 Steward Observatory, The University of Arizona, Tucson, AZ 85721 Philip A. Pinto Steward Observatory, The University of Arizona, Tucson, AZ 85721
BUILDING GALAXIES. Question 1: When and where did the stars form?
 BUILDING GALAXIES The unprecedented accuracy of recent observations of the power spectrum of the cosmic microwave background leaves little doubt that the universe formed in a hot big bang, later cooling
Examination of a High Redshift Quasar and its Host Galaxy
 Examination of a High Redshift Quasar and its Host Galaxy A Senior Honors Thesis Presented in Partial Fulfillment of the Requirements for graduation with research distinction in Astronomy in the undergraduate
ACTIVE GALACTIC NUCLEI: optical spectroscopy. From AGN classification to Black Hole mass estimation
 ACTIVE GALACTIC NUCLEI: optical spectroscopy From AGN classification to Black Hole mass estimation Second Lecture Reverberation Mapping experiments & virial BH masses estimations Estimating AGN black hole
Age-redshift relation. The time since the big bang depends on the cosmological parameters.
 Age-redshift relation The time since the big bang depends on the cosmological parameters. Lyman Break Galaxies High redshift galaxies are red or absent in blue filters because of attenuation from the neutral
Using Quadruple Lenses to probe the Structure of the Lensing Galaxy
 Using Quadruple Lenses to probe the Structure of the Lensing Galaxy Hans J. Witt Astrophysikalisches Institut Potsdam, An der Sternwarte 16, 14482 Potsdam, Germany ABSTRACT We show here that quadruple
arxiv: v1 [astro-ph.co] 13 Apr 2012
![arxiv: v1 [astro-ph.co] 13 Apr 2012](/thumbs/93/111963583.jpg "arxiv: v1 [astro-ph.co] 13 Apr 2012") Cosmic masers: from OH to H 0 Proceedings IAU Symposium No. 287, 2012 A.C. Editor, B.D. Editor & C.E. Editor, eds. c 2012 International Astronomical Union DOI: 00.0000/X000000000000000X Long term Arecibo
Cosmic masers: from OH to H 0 Proceedings IAU Symposium No. 287, 2012 A.C. Editor, B.D. Editor & C.E. Editor, eds. c 2012 International Astronomical Union DOI: 00.0000/X000000000000000X Long term Arecibo
Quasars ASTR 2120 Sarazin. Quintuple Gravitational Lens Quasar
 Quasars ASTR 2120 Sarazin Quintuple Gravitational Lens Quasar Quasars Quasar = Quasi-stellar (radio) source Optical: faint, blue, star-like objects Radio: point radio sources, faint blue star-like optical
Low-Ionization BAL QSOs in Ultraluminous Infrared Systems
 Mass Outflow in Active Galactic Nuclei: New Perspectives ASP Conference Series, Vol. TBD, 2001 D.M. Crenshaw, S.B. Kraemer, and I.M. George Low-Ionization BAL QSOs in Ultraluminous Infrared Systems Gabriela
On the lensed blazar B
 Mon. Not. R. Astron. Soc. 000, 000 000 (0000) Printed 5 June 2017 (MN LATEX style file v2.2) On the lensed blazar B0218+357 R. Falomo 1 A. Treves 2, R. Scarpa 3,4 S. Paiano 1, and M. Landoni 5 1 INAF Osservatorio
High-resolution observations and mass modelling of the CLASS gravitational lens B
 Mon. Not. R. Astron. Soc. 330, 205 211 (2002) High-resolution observations and mass modelling of the CLASS gravitational lens B11521199 D. Rusin, 1P M. Norbury, 2 A. D. Biggs, 2 D. R. Marlow, 2 N. J. Jackson,
The OGLE search for microlensing events towards the LMC
 The OGLE search for microlensing events towards the LMC 1,2, Szymon Kozłowski 3, Vasily Belokurov 1, Martin C. Smith 1, Jan Skowron 2 and Andrzej Udalski 2 1 Institute of Astronomy, University of Cambridge
The cosmic distance scale
 The cosmic distance scale Distance information is often crucial to understand the physics of astrophysical objects. This requires knowing the basic properties of such an object, like its size, its environment,
arxiv: v2 [astro-ph] 21 Aug 2007
![arxiv: v2 [astro-ph] 21 Aug 2007](/thumbs/93/113115929.jpg "arxiv: v2 [astro-ph] 21 Aug 2007") Survey Requirements for Accurate and Precise Photometric Redshifts for Type Ia Supernovae Yun Wang 1, Gautham Narayan 2, and Michael Wood-Vasey 2 arxiv:0708.0033v2 [astro-ph] 21 Aug 2007 ABSTRACT In this
Survey Requirements for Accurate and Precise Photometric Redshifts for Type Ia Supernovae Yun Wang 1, Gautham Narayan 2, and Michael Wood-Vasey 2 arxiv:0708.0033v2 [astro-ph] 21 Aug 2007 ABSTRACT In this
Hubble s Law and the Cosmic Distance Scale
 Lab 7 Hubble s Law and the Cosmic Distance Scale 7.1 Overview Exercise seven is our first extragalactic exercise, highlighting the immense scale of the Universe. It addresses the challenge of determining
Astronomy. Astrophysics. New near-infrared observations and lens-model constraints for UM673,
 A&A 566, A36 (214) DOI: 1.151/4-6361/2132223 c ESO 214 Astronomy & Astrophysics New near-infrared observations and lens-model constraints for UM673, E. Koptelova 1,2,3, T. Chiueh 1,W.P.Chen 2, and H. H.
High accuracy imaging polarimetry with NICMOS
 Rochester Institute of Technology RIT Scholar Works Articles 11-6-28 High accuracy imaging polarimetry with NICMOS Daniel Batcheldor G. Schneider D.C. Hines Follow this and additional works at: http://scholarworks.rit.edu/article
Correlation Lengths of Red and Blue Galaxies: A New Cosmic Ruler
 10/22/08 Correlation Lengths of Red and Blue Galaxies: A New Cosmic Ruler Michael J. Longo University of Michigan, Ann Arbor, MI 48109 A comparison of the correlation lengths of red galaxies with blue
Gravitational light bending prevents gamma-gamma absorption in gravitational lenses
 Gravitational light bending prevents gamma-gamma absorption in gravitational lenses NWU, South Africa E-mail: 26559226@nwu.ac.za Markus Böttcher NWU, South Africa E-mail: Markus.Bottcher@nwu.ac.za The
The Correlation Between Supermassive Black Hole Mass and the Structure of Ellipticals and Bulges
 1 The Correlation Between Supermassive Black Hole Mass and the Structure of Ellipticals and Bulges Peter Erwin 1, Alister W. Graham 2, Nicola Caon 1 (1) Instituto de Astrofísica de Canarias, La Laguna,
Cavendish Laboratory, Madingley Road, Cambridge, UK
 THE DIFFERENTIAL MAGNIFICATION OF HIGH- REDSHIFT ULTRALUMINOUS INFRARED GALAXIES A. W. BLAIN Cavendish Laboratory, Madingley Road, Cambridge, UK 1. Introduction The spectral energy distribution (SED) of
Ram Pressure Stripping in NGC 4330
 The Evolving ISM in the Milky Way & Nearby Galaxies Ram Pressure Stripping in NGC 4330 Anne Abramson 1 & Jeffrey D. P. Kenney 1 1 Astronomy Department, Yale University, P.O. Box 208101 New Haven, CT 06520-8101
Modern Image Processing Techniques in Astronomical Sky Surveys
 Modern Image Processing Techniques in Astronomical Sky Surveys Items of the PhD thesis József Varga Astronomy MSc Eötvös Loránd University, Faculty of Science PhD School of Physics, Programme of Particle
We investigate the flux ratio anomalies between
 arxiv:1711.07919v1 [astro-ph.co] 21 Nov 2017 A Quadruply Lensed SN Ia: Gaining a Time-Delay...Losing a Standard Candle Daniel A. Yahalomi 1, Paul L. Schechter 1,2, and Joachim Wambsganss 3 1 MIT Department
arxiv:astro-ph/ v4 15 Mar 2005
 Astronomy & Astrophysics manuscript no. dwlee20 October 29, 2018 (DOI: will be inserted by hand later) arxiv:astro-ph/0503018v4 15 Mar 2005 Reconstruction of the microlensing light curves of the Einstein
Spectral Lines from Rotating Neutron Stars
 Submitted to The Astrophysical Journal Letters Spectral Lines from Rotating Neutron Stars Feryal Özel1 and Dimitrios Psaltis Institute for Advanced Study, School of Natural Sciences, Einstein Dr., Princeton,
G. M. BERNSTEIN Department of Astronomy, University of Michigan, 830 Dennison Building, Ann Arbor, MI 48109
 THE ASTRONOMICAL JOURNAL, 115:1377È1382, 1998 April ( 1998. The American Astronomical Society. All rights reserved. Printed in U.S.A. THE GRAVITATIONAL LENS MG 0414]0534: A LINK BETWEEN RED GALAXIES AND
Multi-wavelength Surveys for AGN & AGN Variability. Vicki Sarajedini University of Florida
 Multi-wavelength Surveys for AGN & AGN Variability Vicki Sarajedini University of Florida What are Active Galactic Nuclei (AGN)? Galaxies with a source of non-stellar emission arising in the nucleus (excessive
Deep optical imaging and spectroscopy of the lens system SDSS J
 Astronomy & Astrophysics manuscript no. AA_2013_23360_lang c ESO 2014 July 22, 2014 Deep optical imaging and spectroscopy of the lens system SDSS J1339+1310 V. N. Shalyapin 1, 2 and L. J. Goicoechea 1
Measuring the evolution of the star formation rate efficiency of neutral atomic hydrogen gas from z ~1 4
 Measuring the evolution of the star formation rate efficiency of neutral atomic hydrogen gas from z ~1 4 Marc Rafelski Galactic Scale Star Formation August 2012 Collaborators: Harry Teplitz Arthur Wolfe
Cosmology and Strongly Lensed QSOs
 Cosmology and Strongly Lensed QSOs Andy Friedman Astronomy 200, Harvard University, Spring 2004 http://cfa-www.harvard.edu/~kstanek/astro200/spring2004.html Ho Outline ΩΛ Determining Ho from Time Delays
TMT and Space-Based Survey Missions
 TMT and Space-Based Survey Missions Daniel Stern Jet Propulsion Laboratory/ California Institute of Technology 2014 California Institute of Technology TMT Science Forum 2014 July 17 Outline Summary of
1. The AGB dust budget in nearby galaxies
 **Volume Title** ASP Conference Series, Vol. **Volume Number** **Author** c **Copyright Year** Astronomical Society of the Pacific Identifying the chemistry of the dust around AGB stars in nearby galaxies
The complex gravitational lens system B
 Mon. Not. R. Astron. Soc. 301, 310 314 (1998) The complex gravitational lens system B1933+503 C. M. Sykes, 1 I. W. A. Browne, 1 N. J. Jackson, 1 D. R. Marlow, 1 S. Nair, 1 P. N. Wilkinson, 1 R. D. Blandford,
arxiv:astro-ph/ v3 31 Jan 2002
 HST Observations of 10 Two-Image Gravitational Lenses 1 J. Lehár 2, E. E. Falco 2, C. S. Kochanek 2, B. A. McLeod 2, J. A. Muñoz 2, C. D. Impey 3, H.-W. Rix 4, C. R. Keeton 3, and C. Y. Peng 3 ABSTRACT
Gravitational microlensing and its capabilities for research of the dark matter. Lyudmila Berdina Institute of Radio Astronomy NAS of Ukraine
 Gravitational microlensing and its capabilities for research of the dark matter Lyudmila Berdina Institute of Radio Astronomy NAS of Ukraine Gravitational lensing Spherically symmetric mass distribution
Galaxies 626. Lecture 9 Metals (2) and the history of star formation from optical/uv observations
 and the history of star formation from optical/uv observations") Galaxies 626 Lecture 9 Metals (2) and the history of star formation from optical/uv observations Measuring metals at high redshift Metals at 6 How can we measure the ultra high z star formation? One robust
Galaxies 626 Lecture 9 Metals (2) and the history of star formation from optical/uv observations Measuring metals at high redshift Metals at 6 How can we measure the ultra high z star formation? One robust
Time delays for eleven gravitationally lensed quasars revisited. E. Eulaers 1 and P. Magain
 & 536, 44 (211) DOI: 1.151/4-6361/211611 c ESO 211 stronomy & strophysics Time delays for eleven gravitationally lensed quasars revisited E. Eulaers 1 and P. Magain Institut d strophysique et de Géophysique,
The HII Regions of Sextans A
 Publications of the Astronomical Society of the Pacific 6: 765-769, 1994 July The HII Regions of Sextans A Paul Hodge 1 Astronomy Department, University of Washington, Seattle, Washington 98195 Electronic
ACS CCDs UV and narrowband filters red leak check
 Instrument Science Report ACS 2007-03 ACS CCDs UV and narrowband filters red leak check Marco Chiaberge and Marco Sirianni May 01, 2007 ABSTRACT We present results of the observations of the star 15 Mon,
arxiv:astro-ph/ v1 21 Mar 2005
 Effects of Gravitational Microlensing on P-Cygni Profiles of Type Ia Supernovae Hamed Bagherpour 1, David Branch 2, Ronald Kantowski 3 arxiv:astro-ph/0503460v1 21 Mar 2005 University of Oklahoma, Department
THE GALACTIC BULGE AS SEEN BY GAIA
 143 THE GALACTIC BULGE AS SEEN BY GAIA C. Reylé 1, A.C. Robin 1, M. Schultheis 1, S. Picaud 2 1 Observatoire de Besançon, CNRS UMR 6091, BP 1615, 25010 Besançon cedex, France 2 IAG/USP Departamento de
phot g, r, i' gri g, r, i 182 g r i gri g r i" r g i r r) , (g g) and (i i) r
 , (g g) and (i i) r") Final report on the activities of Dr Talat Akhunov during the period 14 May 2012 15 November 2013 in the AEOS group at the Institute of Astrophysics & Geophysics, Liège University Image processing in general,
Final report on the activities of Dr Talat Akhunov during the period 14 May 2012 15 November 2013 in the AEOS group at the Institute of Astrophysics & Geophysics, Liège University Image processing in general,
NICMOS Status and Plans
 1997 HST Calibration Workshop Space Telescope Science Institute, 1997 S. Casertano, et al., eds. NICMOS Status and Plans Rodger I. Thompson Steward Observatory, University of Arizona, Tucson, AZ 85721
Lecture Outlines. Chapter 25. Astronomy Today 7th Edition Chaisson/McMillan Pearson Education, Inc.
 Lecture Outlines Chapter 25 Astronomy Today 7th Edition Chaisson/McMillan Chapter 25 Galaxies and Dark Matter Units of Chapter 25 25.1 Dark Matter in the Universe 25.2 Galaxy Collisions 25.3 Galaxy Formation
Sizes and Temperature Profiles of Quasar Accretion Disks from Chromatic Microlensing
 Sizes and Temperature Profiles of Quasar Accretion Disks from Chromatic Microlensing The MIT Faculty has made this article openly available. Please share how this access benefits you. Your story matters.
Infrared Mass-to-Light Profile Throughout the Infall Region of the Coma Cluster
 Infrared Mass-to-Light Profile Throughout the Infall Region of the Coma Cluster K. Rines 1, M.J. Geller 2, M.J. Kurtz 1, A. Diaferio 3, T.H. Jarrett 4, and J.P. Huchra 1 ABSTRACT Using a redshift survey
A GRAPHICS PROCESSING UNIT-ENABLED, HIGH-RESOLUTION COSMOLOGICAL MICROLENSING PARAMETER SURVEY
 C 2012. The American Astronomical Society. All rights reserved. Printed in the U.S.A. doi:10.1088/0004-637x/744/2/90 A GRAPHICS PROCESSING UNIT-ENABLED, HIGH-RESOLUTION COSMOLOGICAL MICROLENSING PARAMETER
Astrophysical Research
 Astrophysical Research Elena Bannikova Institute of Radio Astronomy of National Academy of Science V.N.Kharazin Kharkiv National University Astrophysical Research in Kharkiv Theoretical investigations
Inclination-Dependent Extinction Effects in Disk Galaxies in the Sloan Digital Sky Survey aa aa. A Senior Honors Thesis
 1 Inclination-Dependent Extinction Effects in Disk Galaxies in the Sloan Digital Sky Survey aa aa aa aa A Senior Honors Thesis Presented in Partial Fulfillment of the Requirements for Graduation with Distinction
Calibration of ACS Prism Slitless Spectroscopy Modes
 The 2005 HST Calibration Workshop Space Telescope Science Institute, 2005 A. M. Koekemoer, P. Goudfrooij, and L. L. Dressel, eds. Calibration of ACS Prism Slitless Spectroscopy Modes S. S. Larsen, M. Kümmel
arxiv:astro-ph/ v2 9 Jan 2006
 stronomy & strophysics manuscript no. 4454 c ESO 2018 March 12, 2018 OSMORIL: the OSmological MOnitoring of RvItational Lenses III. arxiv:astro-ph/0511026v2 9 Jan 2006 Redshift of the lensing galaxy in
arxiv:astro-ph/ v2 24 Nov 1999
 Redshifts of the Gravitational Lenses MG 1131+0456 and B 1938+666 1 arxiv:astro-ph/9910480v2 24 Nov 1999 John L. Tonry Institute for Astronomy, University of Hawaii, Honolulu, HI 96822 Electronic mail:
Observational Cosmology
 Astr 102: Introduction to Astronomy Fall Quarter 2009, University of Washington, Željko Ivezić Lecture 15: Observational Cosmology 1 Outline Observational Cosmology: observations that allow us to test
arxiv:astro-ph/ v1 20 Feb 2004
 Discovery of Face-On Counterparts of Chain Galaxies in the Tadpole ACS Field arxiv:astro-ph/42477v1 Feb 4 Debra Meloy Elmegreen Vassar College, Dept. of Physics & Astronomy, Box 745, Poughkeepsie, NY 1264;
Galaxies 626. Lecture 10 The history of star formation from far infrared and radio observations
 Galaxies 626 Lecture 10 The history of star formation from far infrared and radio observations Cosmic Star Formation History Various probes of the global SF rate: ρ* (z) M yr 1 comoving Mpc 3 UV continuum
Bright Quasar 3C 273 Thierry J-L Courvoisier. Encyclopedia of Astronomy & Astrophysics P. Murdin
 eaa.iop.org DOI: 10.1888/0333750888/2368 Bright Quasar 3C 273 Thierry J-L Courvoisier From Encyclopedia of Astronomy & Astrophysics P. Murdin IOP Publishing Ltd 2006 ISBN: 0333750888 Institute of Physics
MIT Invitational, Jan Astronomy C. 2. You may separate the pages, but do not forget to put your team number at the top of all answer pages.
 MIT Invitational, Jan 2019 Astronomy C Competitors: School name: Team number: INSTRUCTIONS 1. Please turn in all materials at the end of the event. 2. You may separate the pages, but do not forget to put
Microlensing Parallax with Spitzer
 Microlensing Parallax with Spitzer Pathway to the Galactic Distribution of Planets 2015 Sagan/Michelson Fellows Symposium May 7-8, 2015 Caltech Sebastiano Calchi Novati Sagan Visiting Fellow NExScI (Caltech),
Evidence for a source size of less than 2000 AU in Quasar
 Evidence for a source size of less than 2000 AU in Quasar 2237+0305 Atsunori Yonehara 1,2,3 ABSTRACT Recently, OGLE team have reported clear quasar microlensing signal in Q2237+0305. We have analyzed the
Subaru Telescope adaptive optics observations of gravitationally lensed quasars
 EAYAM November 17, 2017 Subaru Telescope adaptive optics observations of gravitationally lensed quasars Cristian Eduard Rusu Subaru Fellow Contents Brief description of the adaptive optics imaging campaign
Study of the evolution of the ACS/WFC sensitivity loss
 Instrument Science Report ACS 2013 01 Study of the evolution of the ACS/WFC sensitivity loss Leonardo Úbeda and Jay Anderson Space Telescope Science Institute January 28, 2013 ABSTRACT We present a study
Astr 2320 Thurs. April 27, 2017 Today s Topics. Chapter 21: Active Galaxies and Quasars
 Astr 2320 Thurs. April 27, 2017 Today s Topics Chapter 21: Active Galaxies and Quasars Emission Mechanisms Synchrotron Radiation Starburst Galaxies Active Galactic Nuclei Seyfert Galaxies BL Lac Galaxies
Part two of a year-long introduction to astrophysics:
 ASTR 3830 Astrophysics 2 - Galactic and Extragalactic Phil Armitage office: JILA tower A909 email: pja@jilau1.colorado.edu Spitzer Space telescope image of M81 Part two of a year-long introduction to astrophysics: