Honors Statistics. Daily Agenda
|
|
|
- Colin Simpson
- 5 years ago
- Views:
Transcription

1 Section 2.1 Describing Location in a Distribution Day 3 Linear Data Transformations Honors Statistics Daily Agenda 1. Review OTL C2#3 2. Introduce and practice data transformations 1

 This student sent/ received 200 texts in the two-day period.")

2 Askips are red - show the arithmetic for all Do practice MC A B C D E CONTINUE Reading and Notes Chapter 2 Section 2 page 103 to 127 NOTES TOOK ME 1 Hour Please start You Better CONTINUE Reading and Notes Chapter 2 Section 2 page 103 to 127 Yep... I am going to check your "starting" a) This student sent/ received 200 texts in the two-day period. Their text behavior is located at approximately the 80th percentile. This means that 80% of the students sent/received less than 200 texts during the twoday period. b) The median number of texts is the 50th percentile which is approximately 105 texts sent/received. 2


 Q1 25th%tile is")

3 a) Maryland has approximately 13% foreign-born residents. This is approximately the 73rd% tile for the 50 states. b) The 30th%tile is approximately 4% of resident foreign-born. a) Q1 25th%tile is approximately $19 Q3 75th%tile is approximately $48 b) $19.50 is 26th %tile IQR =


4 z = 4.15 z = 4.26 Williams z = 4.07 All of the hitters were at least 4 standard deviation above their respective means but Ty Williams was the highest with z = = 4


5 a) 29 players... Brad is position number 23 so... = th %tile 75% of the player made less money than Brad made in the 2008 team /29 = z = Brad's salary is 0.79 standard deviations above the mean. X = X


6 Q1 25th%tile is approximately Q3 75th%tile is approximately IQR =


7 The distribution of travel times is not symmetric and is skewed to the right. The center is approximately at 20 minutes. The data spreads from 0 minutes to 90 minutes with a range of 90 minutes. The data should be analyzed using the 5 number summary. There are many gaps after 40 minutes and 2 to 5 potential outliers at the top end. 7

8 Measures of... Center Median Mean Mode Midrange Spread St Dev Range IQR Variance Example original data set {2,3,4} 2(data) 2(data) +3 8


9 9

10 10


11 Apply the "short-cut" transformations to the measures of Enter the following data into list L L 1 L 1 +3 L 1-5 2L 1 3L 1 2L L
12 12
13 13


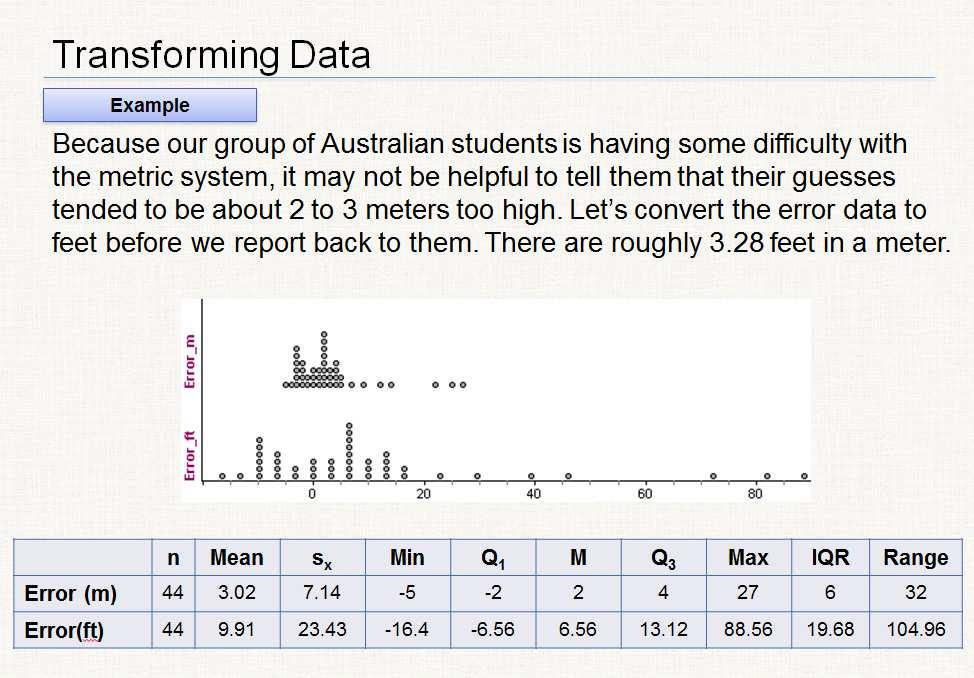
14 = a + bx Measures of Center are affected by a and b. Measures of Spread are only affect by b. mean = 2.7 miles median = 1.54 miles If 1 mile = meters convert all statistics to meters 14

15 for one month. mean = median = standard deviation = by using the formula 15
16 16

17 17


18 18

19 A uniform density curve Use the areas under the density curve to answer the following questions. 19


20 2.11 A uniform density curve, II 20


21 Because this is a SYMMETRIC uniform density curve mean = median And its' location is in the center of the density curve x = 1.5 mile You could also solve for b in the equation b(1/3) = 0.5 Sketch density curves that might describe the distributions with the following shapes. b) Single peak and skewed to the left. 21
22 OTL C2#4 page 101: 17, 18 page 102: 19, 20, 21, 22, 23, 24, 26 Standard Deviation WS (be sure to do the back) FINISH Reading and Notes Chapter 2 Section 2 page 103 to 127 NOTES QUIZ TOMORROW!!! S x QUIZ TOMORROW!!! 22
The Normal Distribution. Chapter 6
 + The Normal Distribution Chapter 6 + Applications of the Normal Distribution Section 6-2 + The Standard Normal Distribution and Practical Applications! We can convert any variable that in normally distributed
Measures of the Location of the Data
 Measures of the Location of the Data 1. 5. Mark has 51 films in his collection. Each movie comes with a rating on a scale from 0.0 to 10.0. The following table displays the ratings of the aforementioned
Slide 1. Slide 2. Slide 3. Pick a Brick. Daphne. 400 pts 200 pts 300 pts 500 pts 100 pts. 300 pts. 300 pts 400 pts 100 pts 400 pts.
 Slide 1 Slide 2 Daphne Phillip Kathy Slide 3 Pick a Brick 100 pts 200 pts 500 pts 300 pts 400 pts 200 pts 300 pts 500 pts 100 pts 300 pts 400 pts 100 pts 400 pts 100 pts 200 pts 500 pts 100 pts 400 pts
Resistant Measure - A statistic that is not affected very much by extreme observations.
 Chapter 1.3 Lecture Notes & Examples Section 1.3 Describing Quantitative Data with Numbers (pp. 50-74) 1.3.1 Measuring Center: The Mean Mean - The arithmetic average. To find the mean (pronounced x bar)
1.3.1 Measuring Center: The Mean
 1.3.1 Measuring Center: The Mean Mean - The arithmetic average. To find the mean (pronounced x bar) of a set of observations, add their values and divide by the number of observations. If the n observations
Selected Answers for Core Connections Algebra
 Selected Answers for Core Connections Algebra Lesson 11.1.1 11-4. a: 2x!1, shift up 2 units b: 4x! 3, twice as steep c: 2x +1, shift left 2 units d: 4x! 6, twice as steep, y-intercept shifts down 3 units,
Describing Distributions
 Describing Distributions With Numbers April 18, 2012 Summary Statistics. Measures of Center. Percentiles. Measures of Spread. A Summary Statement. Choosing Numerical Summaries. 1.0 What Are Summary Statistics?
Name: Class: Date: ID: A. Find the mean, median, and mode of the data set. Round to the nearest tenth. c. mean = 8.2, median = 8, mode =7
 Class: Date: Unit 2 Test Review Find the mean, median, and mode of the data set. Round to the nearest tenth. 1. 4, 7, 8, 15, 1, 7, 8, 14, 7, 15, 4 a. mean = 7.5, median = 7, mode = 7 b. mean = 8.2, median
3.1 Measure of Center
 3.1 Measure of Center Calculate the mean for a given data set Find the median, and describe why the median is sometimes preferable to the mean Find the mode of a data set Describe how skewness affects
are the objects described by a set of data. They may be people, animals or things.
 ( c ) E p s t e i n, C a r t e r a n d B o l l i n g e r 2016 C h a p t e r 5 : E x p l o r i n g D a t a : D i s t r i b u t i o n s P a g e 1 CHAPTER 5: EXPLORING DATA DISTRIBUTIONS 5.1 Creating Histograms
Lecture 2. Descriptive Statistics: Measures of Center
 Lecture 2. Descriptive Statistics: Measures of Center Descriptive Statistics summarize or describe the important characteristics of a known set of data Inferential Statistics use sample data to make inferences
Chapter 3. Measuring data
 Chapter 3 Measuring data 1 Measuring data versus presenting data We present data to help us draw meaning from it But pictures of data are subjective They re also not susceptible to rigorous inference Measuring
Chapter 2: Tools for Exploring Univariate Data
 Stats 11 (Fall 2004) Lecture Note Introduction to Statistical Methods for Business and Economics Instructor: Hongquan Xu Chapter 2: Tools for Exploring Univariate Data Section 2.1: Introduction What is
Name: Class: Date: ID: A. Find the mean, median, and mode of the data set. Round to the nearest tenth. c. mean = 9.7, median = 8, mode =15
 Class: Date: Unit 2 Pretest Find the mean, median, and mode of the data set. Round to the nearest tenth. 1. 2, 10, 6, 9, 1, 15, 11, 10, 15, 13, 15 a. mean = 9.7, median = 10, mode = 15 b. mean = 8.9, median
CHAPTER 2 Modeling Distributions of Data
 CHAPTER 2 Modeling Distributions of Data 2.1 Describing Location in a Distribution The Practice of Statistics, 5th Edition Starnes, Tabor, Yates, Moore Bedford Freeman Worth Publishers Describing Location
Math 120 Introduction to Statistics Mr. Toner s Lecture Notes 3.1 Measures of Central Tendency
 Math 1 Introduction to Statistics Mr. Toner s Lecture Notes 3.1 Measures of Central Tendency The word average: is very ambiguous and can actually refer to the mean, median, mode or midrange. Notation:
Practice Questions for Exam 1
 Practice Questions for Exam 1 1. A used car lot evaluates their cars on a number of features as they arrive in the lot in order to determine their worth. Among the features looked at are miles per gallon
Further Mathematics 2018 CORE: Data analysis Chapter 2 Summarising numerical data
 Chapter 2: Summarising numerical data Further Mathematics 2018 CORE: Data analysis Chapter 2 Summarising numerical data Extract from Study Design Key knowledge Types of data: categorical (nominal and ordinal)
Unit 2: Lesson 10 Measures of Spread Name:
 Unit 2: Lesson 10 Measures of Spread Name: Part 1: Mean Absolute Deviation (nice, but not the measure of spread we ll use ) The heights, in inches, of the players on a basketball team are given below.
MgtOp 215 Chapter 3 Dr. Ahn
 MgtOp 215 Chapter 3 Dr. Ahn Measures of central tendency (center, location): measures the middle point of a distribution or data; these include mean and median. Measures of dispersion (variability, spread):
Objective A: Mean, Median and Mode Three measures of central of tendency: the mean, the median, and the mode.
 Chapter 3 Numerically Summarizing Data Chapter 3.1 Measures of Central Tendency Objective A: Mean, Median and Mode Three measures of central of tendency: the mean, the median, and the mode. A1. Mean The
STAT 200 Chapter 1 Looking at Data - Distributions
 STAT 200 Chapter 1 Looking at Data - Distributions What is Statistics? Statistics is a science that involves the design of studies, data collection, summarizing and analyzing the data, interpreting the
STOR 155 Introductory Statistics. Lecture 4: Displaying Distributions with Numbers (II)
") The UNIVERSITY of NORTH CAROLINA at CHAPEL HILL STOR 155 Introductory Statistics Lecture 4: Displaying Distributions with Numbers (II) 9/8/09 Lecture 4 1 Numerical Summary for Distributions Center Mean
The UNIVERSITY of NORTH CAROLINA at CHAPEL HILL STOR 155 Introductory Statistics Lecture 4: Displaying Distributions with Numbers (II) 9/8/09 Lecture 4 1 Numerical Summary for Distributions Center Mean
Section 2.3: One Quantitative Variable: Measures of Spread
 Section 2.3: One Quantitative Variable: Measures of Spread Objectives: 1) Measures of spread, variability a. Range b. Standard deviation i. Formula ii. Notation for samples and population 2) The 95% rule
ADMS2320.com. We Make Stats Easy. Chapter 4. ADMS2320.com Tutorials Past Tests. Tutorial Length 1 Hour 45 Minutes
 We Make Stats Easy. Chapter 4 Tutorial Length 1 Hour 45 Minutes Tutorials Past Tests Chapter 4 Page 1 Chapter 4 Note The following topics will be covered in this chapter: Measures of central location Measures
CHAPTER 2: Describing Distributions with Numbers
 CHAPTER 2: Describing Distributions with Numbers The Basic Practice of Statistics 6 th Edition Moore / Notz / Fligner Lecture PowerPoint Slides Chapter 2 Concepts 2 Measuring Center: Mean and Median Measuring
Chapter 6 The Standard Deviation as a Ruler and the Normal Model
 Chapter 6 The Standard Deviation as a Ruler and the Normal Model Overview Key Concepts Understand how adding (subtracting) a constant or multiplying (dividing) by a constant changes the center and/or spread
Shape, Outliers, Center, Spread Frequency and Relative Histograms Related to other types of graphical displays
 Histograms: Shape, Outliers, Center, Spread Frequency and Relative Histograms Related to other types of graphical displays Sep 9 1:13 PM Shape: Skewed left Bell shaped Symmetric Bi modal Symmetric Skewed
Chapter 3 Data Description
 Chapter 3 Data Description Section 3.1: Measures of Central Tendency Section 3.2: Measures of Variation Section 3.3: Measures of Position Section 3.1: Measures of Central Tendency Definition of Average
Unit 2. Describing Data: Numerical
 Unit 2 Describing Data: Numerical Describing Data Numerically Describing Data Numerically Central Tendency Arithmetic Mean Median Mode Variation Range Interquartile Range Variance Standard Deviation Coefficient
Percentile: Formula: To find the percentile rank of a score, x, out of a set of n scores, where x is included:
 AP Statistics Chapter 2 Notes 2.1 Describing Location in a Distribution Percentile: The pth percentile of a distribution is the value with p percent of the observations (If your test score places you in
Chapter 1 - Lecture 3 Measures of Location
 Chapter 1 - Lecture 3 of Location August 31st, 2009 Chapter 1 - Lecture 3 of Location General Types of measures Median Skewness Chapter 1 - Lecture 3 of Location Outline General Types of measures What
Chapters 1 & 2 Exam Review
 Problems 1-3 refer to the following five boxplots. 1.) To which of the above boxplots does the following histogram correspond? (A) A (B) B (C) C (D) D (E) E 2.) To which of the above boxplots does the
Quantitative Tools for Research
 Quantitative Tools for Research KASHIF QADRI Descriptive Analysis Lecture Week 4 1 Overview Measurement of Central Tendency / Location Mean, Median & Mode Quantiles (Quartiles, Deciles, Percentiles) Measurement
Chapter 1: Exploring Data
 Chapter 1: Exploring Data Section 1.3 with Numbers The Practice of Statistics, 4 th edition - For AP* STARNES, YATES, MOORE Chapter 1 Exploring Data Introduction: Data Analysis: Making Sense of Data 1.1
Measures of center. The mean The mean of a distribution is the arithmetic average of the observations:
 Measures of center The mean The mean of a distribution is the arithmetic average of the observations: x = x 1 + + x n n n = 1 x i n i=1 The median The median is the midpoint of a distribution: the number
2011 Pearson Education, Inc
 Statistics for Business and Economics Chapter 2 Methods for Describing Sets of Data Summary of Central Tendency Measures Measure Formula Description Mean x i / n Balance Point Median ( n +1) Middle Value
GRAPHS AND STATISTICS Central Tendency and Dispersion Common Core Standards
 B Graphs and Statistics, Lesson 2, Central Tendency and Dispersion (r. 2018) GRAPHS AND STATISTICS Central Tendency and Dispersion Common Core Standards Next Generation Standards S-ID.A.2 Use statistics
Review for Exam #1. Chapter 1. The Nature of Data. Definitions. Population. Sample. Quantitative data. Qualitative (attribute) data
 data") Review for Exam #1 1 Chapter 1 Population the complete collection of elements (scores, people, measurements, etc.) to be studied Sample a subcollection of elements drawn from a population 11 The Nature
Review for Exam #1 1 Chapter 1 Population the complete collection of elements (scores, people, measurements, etc.) to be studied Sample a subcollection of elements drawn from a population 11 The Nature
+ Check for Understanding
 n Measuring Position: Percentiles n One way to describe the location of a value in a distribution is to tell what percent of observations are less than it. Definition: The p th percentile of a distribution
Example 2. Given the data below, complete the chart:
 Statistics 2035 Quiz 1 Solutions Example 1. 2 64 150 150 2 128 150 2 256 150 8 8 Example 2. Given the data below, complete the chart: 52.4, 68.1, 66.5, 75.0, 60.5, 78.8, 63.5, 48.9, 81.3 n=9 The data is
AP Final Review II Exploring Data (20% 30%)
") AP Final Review II Exploring Data (20% 30%) Quantitative vs Categorical Variables Quantitative variables are numerical values for which arithmetic operations such as means make sense. It is usually a measure
AP Final Review II Exploring Data (20% 30%) Quantitative vs Categorical Variables Quantitative variables are numerical values for which arithmetic operations such as means make sense. It is usually a measure
Topic 3: Introduction to Statistics. Algebra 1. Collecting Data. Table of Contents. Categorical or Quantitative? What is the Study of Statistics?!
 Topic 3: Introduction to Statistics Collecting Data We collect data through observation, surveys and experiments. We can collect two different types of data: Categorical Quantitative Algebra 1 Table of
Describing Distributions With Numbers Chapter 12
 Describing Distributions With Numbers Chapter 12 May 1, 2013 What Do We Usually Summarize? Measures of Center. Percentiles. Measures of Spread. A Summary. 1.0 What Do We Usually Summarize? source: Prof.
Lecture Slides. Elementary Statistics Twelfth Edition. by Mario F. Triola. and the Triola Statistics Series. Section 3.1- #
 Lecture Slides Elementary Statistics Twelfth Edition and the Triola Statistics Series by Mario F. Triola Chapter 3 Statistics for Describing, Exploring, and Comparing Data 3-1 Review and Preview 3-2 Measures
Describing Distributions With Numbers
 Describing Distributions With Numbers October 24, 2012 What Do We Usually Summarize? Measures of Center. Percentiles. Measures of Spread. A Summary Statement. Choosing Numerical Summaries. 1.0 What Do
Statistics I Chapter 2: Univariate data analysis
 Statistics I Chapter 2: Univariate data analysis Chapter 2: Univariate data analysis Contents Graphical displays for categorical data (barchart, piechart) Graphical displays for numerical data data (histogram,
A C E. Answers Investigation 4. Applications
 Answers Applications 1. 1 student 2. You can use the histogram with 5-minute intervals to determine the number of students that spend at least 15 minutes traveling to school. To find the number of students,
Descriptive Univariate Statistics and Bivariate Correlation
 ESC 100 Exploring Engineering Descriptive Univariate Statistics and Bivariate Correlation Instructor: Sudhir Khetan, Ph.D. Wednesday/Friday, October 17/19, 2012 The Central Dogma of Statistics used to
Describing Distributions with Numbers
 Describing Distributions with Numbers Using graphs, we could determine the center, spread, and shape of the distribution of a quantitative variable. We can also use numbers (called summary statistics)
Describing distributions with numbers
 Describing distributions with numbers A large number or numerical methods are available for describing quantitative data sets. Most of these methods measure one of two data characteristics: The central
Statistics 528: Homework 2 Solutions
 Statistics 28: Homework 2 Solutions.4 There are several gaps in the data, as can be seen from the histogram. Minitab Result: Min Q Med Q3 Max 8 3278 22 2368 2624 Manual Result: Min Q Med Q3 Max 8 338 22.
Statistics I Chapter 2: Univariate data analysis
 Statistics I Chapter 2: Univariate data analysis Chapter 2: Univariate data analysis Contents Graphical displays for categorical data (barchart, piechart) Graphical displays for numerical data data (histogram,
Expressions and Equations
 8 8.EE.7b Objective Common Core State Standards Expressions and Equations Solving Equations with Variables on Both Sides Another form of multi-step equations involves variables on both sides of the equation.
Perhaps the most important measure of location is the mean (average). Sample mean: where n = sample size. Arrange the values from smallest to largest:
. Sample mean: where n = sample size. Arrange the values from smallest to largest:") 1 Chapter 3 - Descriptive stats: Numerical measures 3.1 Measures of Location Mean Perhaps the most important measure of location is the mean (average). Sample mean: where n = sample size Example: The number
1 Chapter 3 - Descriptive stats: Numerical measures 3.1 Measures of Location Mean Perhaps the most important measure of location is the mean (average). Sample mean: where n = sample size Example: The number
Describing distributions with numbers
 Describing distributions with numbers A large number or numerical methods are available for describing quantitative data sets. Most of these methods measure one of two data characteristics: The central
1.3: Describing Quantitative Data with Numbers
 1.3: Describing Quantitative Data with Numbers Section 1.3 Describing Quantitative Data with Numbers After this section, you should be able to MEASURE center with the mean and median MEASURE spread with
TOPIC: Descriptive Statistics Single Variable
 TOPIC: Descriptive Statistics Single Variable I. Numerical data summary measurements A. Measures of Location. Measures of central tendency Mean; Median; Mode. Quantiles - measures of noncentral tendency
1. Exploratory Data Analysis
 1. Exploratory Data Analysis 1.1 Methods of Displaying Data A visual display aids understanding and can highlight features which may be worth exploring more formally. Displays should have impact and be
Range The range is the simplest of the three measures and is defined now.
 Measures of Variation EXAMPLE A testing lab wishes to test two experimental brands of outdoor paint to see how long each will last before fading. The testing lab makes 6 gallons of each paint to test.
Chapter 6 Group Activity - SOLUTIONS
 Chapter 6 Group Activity - SOLUTIONS Group Activity Summarizing a Distribution 1. The following data are the number of credit hours taken by Math 105 students during a summer term. You will be analyzing
Performance of fourth-grade students on an agility test
 Starter Ch. 5 2005 #1a CW Ch. 4: Regression L1 L2 87 88 84 86 83 73 81 67 78 83 65 80 50 78 78? 93? 86? Create a scatterplot Find the equation of the regression line Predict the scores Chapter 5: Understanding
Midrange: mean of highest and lowest scores. easy to compute, rough estimate, rarely used
 Measures of Central Tendency Mode: most frequent score. best average for nominal data sometimes none or multiple modes in a sample bimodal or multimodal distributions indicate several groups included in
PROBABILITY DENSITY FUNCTIONS
 PROBABILITY DENSITY FUNCTIONS P.D.F. CALCULATIONS Question 1 (***) The lifetime of a certain brand of battery, in tens of hours, is modelled by the f x given by continuous random variable X with probability
After completing this chapter, you should be able to:
 Chapter 2 Descriptive Statistics Chapter Goals After completing this chapter, you should be able to: Compute and interpret the mean, median, and mode for a set of data Find the range, variance, standard
QUANTITATIVE DATA. UNIVARIATE DATA data for one variable
 QUANTITATIVE DATA Recall that quantitative (numeric) data values are numbers where data take numerical values for which it is sensible to find averages, such as height, hourly pay, and pulse rates. UNIVARIATE
Chapter 4.notebook. August 30, 2017
 Sep 1 7:53 AM Sep 1 8:21 AM Sep 1 8:21 AM 1 Sep 1 8:23 AM Sep 1 8:23 AM Sep 1 8:23 AM SOCS When describing a distribution, make sure to always tell about three things: shape, outliers, center, and spread
M 140 Test 1 B Name (1 point) SHOW YOUR WORK FOR FULL CREDIT! Problem Max. Points Your Points Total 75
 SHOW YOUR WORK FOR FULL CREDIT! Problem Max. Points Your Points Total 75") M 140 est 1 B Name (1 point) SHOW YOUR WORK FOR FULL CREDI! Problem Max. Points Your Points 1-10 10 11 10 12 3 13 4 14 18 15 8 16 7 17 14 otal 75 Multiple choice questions (1 point each) For questions
M 140 est 1 B Name (1 point) SHOW YOUR WORK FOR FULL CREDI! Problem Max. Points Your Points 1-10 10 11 10 12 3 13 4 14 18 15 8 16 7 17 14 otal 75 Multiple choice questions (1 point each) For questions
P8130: Biostatistical Methods I
 P8130: Biostatistical Methods I Lecture 2: Descriptive Statistics Cody Chiuzan, PhD Department of Biostatistics Mailman School of Public Health (MSPH) Lecture 1: Recap Intro to Biostatistics Types of Data
ALGEBRA I SEMESTER EXAMS PRACTICE MATERIALS SEMESTER (1.1) Examine the dotplots below from three sets of data Set A
 Examine the dotplots below from three sets of data Set A") 1. (1.1) Examine the dotplots below from three sets of data. 0 2 4 6 8 10 Set A 0 2 4 6 8 10 Set 0 2 4 6 8 10 Set C The mean of each set is 5. The standard deviations of the sets are 1.3, 2.0, and 2.9.
1. (1.1) Examine the dotplots below from three sets of data. 0 2 4 6 8 10 Set A 0 2 4 6 8 10 Set 0 2 4 6 8 10 Set C The mean of each set is 5. The standard deviations of the sets are 1.3, 2.0, and 2.9.
Unit 2: Numerical Descriptive Measures
 Unit 2: Numerical Descriptive Measures Summation Notation Measures of Central Tendency Measures of Dispersion Chebyshev's Rule Empirical Rule Measures of Relative Standing Box Plots z scores Jan 28 10:48
Announcements. Lecture 1 - Data and Data Summaries. Data. Numerical Data. all variables. continuous discrete. Homework 1 - Out 1/15, due 1/22
 Announcements Announcements Lecture 1 - Data and Data Summaries Statistics 102 Colin Rundel January 13, 2013 Homework 1 - Out 1/15, due 1/22 Lab 1 - Tomorrow RStudio accounts created this evening Try logging
Chapter 2 Class Notes Sample & Population Descriptions Classifying variables
 Chapter 2 Class Notes Sample & Population Descriptions Classifying variables Random Variables (RVs) are discrete quantitative continuous nominal qualitative ordinal Notation and Definitions: a Sample is
Int Math 1 Statistic and Probability. Name:
 Name: Int Math 1 1. Juan wants to rent a house. He gathers data on many similar houses. The distance from the center of the city, x, and the monthly rent for each house, y, are shown in the scatter plot.
STRAND E: STATISTICS. UNIT E4 Measures of Variation: Text * * Contents. Section. E4.1 Cumulative Frequency. E4.2 Box and Whisker Plots
 STRAND E: STATISTICS E4 Measures of Variation Text Contents * * Section E4.1 E4.2 Box and Whisker Plots E4 Measures of Variation E4.1 * frequencies are useful if more detailed information is required about
MAFS Algebra 1. FSA EOC Review. Day 19 - Student Packet
 MAFS Algebra 1 FSA EOC Review Day 19 - Student Packet Day 19: FSA EOC Review MAFS.912.A-CED.1.2 1. Lawrence's parents pay him a base allowance of $10 per week and $3.20 per hour for extra chores he completes.
Lecture 11. Data Description Estimation
 Lecture 11 Data Description Estimation Measures of Central Tendency (continued, see last lecture) Sample mean, population mean Sample mean for frequency distributions The median The mode The midrange 3-22
BNG 495 Capstone Design. Descriptive Statistics
 BNG 495 Capstone Design Descriptive Statistics Overview The overall goal of this short course in statistics is to provide an introduction to descriptive and inferential statistical methods, with a focus
Math 14 Lecture Notes Ch Percentile
 .3 Measures of the Location of the Data Percentile g A measure of position, the percentile, p, is an integer (1 p 99) such that the p th percentile is the position of a data value where p% of the data
MT 1810 Calculus II Course Activity I.7: Velocity and Distance Travelled
 MT 1810 Calculus II, CA I.7 P a g e 1 MT 1810 Calculus II Course Activity I.7: Velocity and Distance Travelled Name: Purpose: To investigate how to calculate the distance travelled by an object if you
NAME: DATE: SECTION: MRS. KEINATH
 1 Vocabulary and Formulas: Correlation coefficient The correlation coefficient, r, measures the direction and strength of a linear relationship between two variables. Formula: = 1 x i x y i y r. n 1 s
Chapter. Numerically Summarizing Data Pearson Prentice Hall. All rights reserved
 Chapter 3 Numerically Summarizing Data Section 3.1 Measures of Central Tendency Objectives 1. Determine the arithmetic mean of a variable from raw data 2. Determine the median of a variable from raw data
CHAPTER 5: EXPLORING DATA DISTRIBUTIONS. Individuals are the objects described by a set of data. These individuals may be people, animals or things.
 (c) Epstein 2013 Chapter 5: Exploring Data Distributions Page 1 CHAPTER 5: EXPLORING DATA DISTRIBUTIONS 5.1 Creating Histograms Individuals are the objects described by a set of data. These individuals
Exam: practice test 1 MULTIPLE CHOICE. Choose the one alternative that best completes the statement or answers the question.
 Exam: practice test MULTIPLE CHOICE. Choose the one alternative that best completes the statement or answers the question. Solve the problem. ) Using the information in the table on home sale prices in
Review for the Algebra EOC
 Review for the Algebra EOC The test is Thursday, January 26 th, 2017 The answer key for this review booklet can be found at: www.mrshicklin.pbworks.com 1. A 1,500-gallon tank contains 200 gallons of water.
Lecture 3B: Chapter 4, Section 2 Quantitative Variables (Displays, Begin Summaries)
") Lecture 3B: Chapter 4, Section 2 Quantitative Variables (Displays, Begin Summaries) Summarize with Shape, Center, Spread Displays: Stemplots, Histograms Five Number Summary, Outliers, Boxplots Mean vs.
Lecture 3B: Chapter 4, Section 2 Quantitative Variables (Displays, Begin Summaries) Summarize with Shape, Center, Spread Displays: Stemplots, Histograms Five Number Summary, Outliers, Boxplots Mean vs.
Lecture 2 and Lecture 3
 Lecture 2 and Lecture 3 1 Lecture 2 and Lecture 3 We can describe distributions using 3 characteristics: shape, center and spread. These characteristics have been discussed since the foundation of statistics.
STAT:2020 Probability and Statistics for Engineers Exam 2 Mock-up. 100 possible points
 STAT:2020 Probability and Statistics for Engineers Exam 2 Mock-up 100 possible points Student Name Section [letter/#] Section [day/time] Instructions: 1) Make sure you have the correct number of pages.
7.1: What is a Sampling Distribution?!?!
 7.1: What is a Sampling Distribution?!?! Section 7.1 What Is a Sampling Distribution? After this section, you should be able to DISTINGUISH between a parameter and a statistic DEFINE sampling distribution
Psychology 310 Exam1 FormA Student Name:
 Psychology 310 Exam1 FormA Student Name: 1 Compute the sample mean X forthefollowing5numbers: 1,4,2,3,4 (a) 2. 8 (b) 3.00 (c) 2. 24 (d) 1. 4 (e) None of the above are correct 2 Compute the sample variance
Section 3. Measures of Variation
 Section 3 Measures of Variation Range Range = (maximum value) (minimum value) It is very sensitive to extreme values; therefore not as useful as other measures of variation. Sample Standard Deviation The
Determining the Spread of a Distribution
 Determining the Spread of a Distribution 1.3-1.5 Cathy Poliak, Ph.D. cathy@math.uh.edu Department of Mathematics University of Houston Lecture 3-2311 Lecture 3-2311 1 / 58 Outline 1 Describing Quantitative
Determining the Spread of a Distribution Variance & Standard Deviation
 Determining the Spread of a Distribution Variance & Standard Deviation 1.3 Cathy Poliak, Ph.D. cathy@math.uh.edu Department of Mathematics University of Houston Lecture 3 Lecture 3 1 / 32 Outline 1 Describing
Elisha Mae Kostka 243 Assignment Mock Test 1 due 02/11/2015 at 09:01am PST
 Elisha Mae Kostka 243 Assignment Mock Test 1 due 02/11/2015 at 09:01am PST 1. (1 pt) Luis Gonzalez began his career as a major league baseball player in 1990. You are given a sample of the number of homeruns
Determining the Spread of a Distribution
 Determining the Spread of a Distribution 1.3-1.5 Cathy Poliak, Ph.D. cathy@math.uh.edu Department of Mathematics University of Houston Lecture 3-2311 Lecture 3-2311 1 / 58 Outline 1 Describing Quantitative
8th Grade Standards for Algebra Readiness Solve one-variable linear equations. 3. d 8 = 6 4. = 16 5.
 Solve one-variable linear equations. 1. g 7 = 15 2. p 1 3 = 2 3 3. d 8 = 6 4. 2r 3 = 16 5. 3r 4 = 1 8 6. 4x + 7 = 11 7. 13 = h 7 8. 2(b + 5) = 6 9. 5(r 1) = 2(r 4) 6 Solve one- and two-step linear inequalities
Which boxplot represents the same information as the histogram? Test Scores Test Scores
 01 013 SEMESTER EXAMS SEMESTER 1. Mrs. Johnson created this histogram of her 3 rd period students test scores. 8 Frequency of Test Scores 6 4 50 60 70 80 90 100 Test Scores Which boxplot represents the
Histograms allow a visual interpretation
 Chapter 4: Displaying and Summarizing i Quantitative Data s allow a visual interpretation of quantitative (numerical) data by indicating the number of data points that lie within a range of values, called
Lecture Slides. Elementary Statistics Tenth Edition. by Mario F. Triola. and the Triola Statistics Series. Slide 1
 Lecture Slides Elementary Statistics Tenth Edition and the Triola Statistics Series by Mario F. Triola Slide 1 Chapter 3 Statistics for Describing, Exploring, and Comparing Data 3-1 Overview 3-2 Measures
Chapter 3 Statistics for Describing, Exploring, and Comparing Data. Section 3-1: Overview. 3-2 Measures of Center. Definition. Key Concept.
 Chapter 3 Statistics for Describing, Exploring, and Comparing Data 3-1 Overview 3- Measures of Center 3-3 Measures of Variation Section 3-1: Overview Descriptive Statistics summarize or describe the important