Citation for published version (APA): Lemson, G. (1995). Statistics and dynamics of the perturbed universe s.n.
|
|
|
- Ross Weaver
- 5 years ago
- Views:
Transcription
1 University of Groningen Statistics and dynamics of the perturbed universe Lemson, Gerard IMPORTANT NOTE: You are advised to consult the publisher's version (publisher's PDF) if you wish to cite from it. Please check the document version below. Document Version Publisher's PDF, also known as Version of record Publication date: 1995 Link to publication in University of Groningen/UMCG research database Citation for published version (APA): Lemson, G. (1995). Statistics and dynamics of the perturbed universe s.n. Copyright Other than for strictly personal use, it is not permitted to download or to forward/distribute the text or part of it without the consent of the author(s) and/or copyright holder(s), unless the work is under an open content license (like Creative Commons). Take-down policy If you believe that this document breaches copyright please contact us providing details, and we will remove access to the work immediately and investigate your claim. Downloaded from the University of Groningen/UMCG research database (Pure): For technical reasons the number of authors shown on this cover page is limited to 10 maximum. Download date:
2 Chapter 5 Density proles from dissipationless collapse 1 Introduction In recent years the study of structure formation in the Universe has entered a new regime through the inclusion of hydrodynamic processes. But even though much energy and CPUtime is spent on these dissipative processes, this does not imply that the gravitational, dissipationless aspects of this problem have been fully understood. Obtaining a good, if not complete, understanding of purely gravitational collapse is imperative for various reasons. First, gravity aects the formation of all structures, indeed in the most generally accepted theories of structure formation, it is the single most important agent in starting the collapse in the rst place. Second, probably all structures have gone through a phase where gravity was dominant, even late in their evolution. The hydrodynamic processes then act within a background shaped by gravity (White & Rees, 1978). Third, some structures are believed to have been shaped by gravity alone. Most notable among these are elliptical galaxies and the dark halos that are believed to make up most of the mass of spiral galaxies. A curious problem is that these two classes of objects appear to have very dierent shapes. It has been long appreciated that the R 1=4 {prole, proposed by de Vaucouleurs (1948), gives a good t to the surface brightness proles of many elliptical galaxies (see also Schombert, 1986). Sarazin (1988) suggests that the R 1=4 prole also provides a good t to the surface density distribution of galaxies in clusters, which is supported by West et al. (1987, 1989). The deprojected density prole (Young, 1976) corresponding to the R 1=4 prole is similar to the family of models investigated by Tremaine et al. (1993) and Dehnen (1993), dened by (r) = M R 4R 3 : (5:1) (r+r ) 1+ The well known models by Jae (1983) and Hernquist (1990), which were proposed mainly because they bear such resemblance to the R 1=4 {prole, are obtained for =1and =2 respectively. On the other hand, the dark halos around spiral galaxies are usually modeled 147
3 148 Chapter 5 Density profiles using truncated isothermal spheres (e.g. van Albada et al., 1985): (r) = 0 1+(r=a) 2 : (5:2) This model is used mainly because it explains the at rotation curves of spiral galaxies, which naively imply an asymptotic density prole r 2. Both models have their particular theoretical explanation. Isothermal systems are thought to be the outcome of violent relaxation (Lynden-Bell, 1967), but the fact that violent relaxation is probably never complete has instead been used as an argument to explain the development of R 1=4 proles (May &van Albada, 1984; Hjorth & Madsen, 1991). Indeed, N-body simulations have shown that cold and clumpy initial conditions, thought to be prerequisites for violent relaxation, evolve into objects with approximately R 1=4 surface density proles (van Albada, 1982). More realistic initial conditions, where the initial structure of the proto-cluster was obtained using cosmologically reasonable uctuation spectra, also evolve into objects with density proles corresponding to the de Vaucouleurs form (Dubinski & Carlberg, 1991; Katz, 1991). A completely satisfying, analytical explanation of how violent relaxation leads to objects of this form has so far been lacking and the fact that these results were almost exclusively obtained from more or less isolated collapses has cast some doubt on the relevance of these calculations for objects evolving in cosmologically realistic environments (Zaroubi & Homan, 1993). These problems seem to be absent in an alternative approach, which reproduces powerlaw density proles such as those needed to explain at rotation curves, using generalizations of the spherically symmetric top-hat model (Gunn & Gott, 1972). Originally intended to describe the density proles of ellipticals, this semi-analytical approach, when combined with assumptions about the (power-law) cosmological initial conditions, is able to explain power-law density proles, r, with dependent on the cosmological parameters (Fillmore & Goldreich, 1984; Bertschinger, 1985). These predictions are claimed to be corroborated by cosmological N-body simulations, using power-law initial uctuation spectra (e.g. Quinn et al., 1986; Efstathiou et al., 1988; Crone et al., 1994). This would suggest that, indeed, violent relaxation is not the prime agent determining the shapes of the nal relaxed objects. The main limitation of these cosmological simulations is that the resolution to which the resulting clusters can be probed is much lower than what can be reached in isolated collapse simulations. Consequently, the density proles are much less well determined and unknown force softening eects may play amuch greater role. Furthermore, the analytical results are based on purely radial infall and relaxation. One must doubt whether these calculations are still relevant during the violent collapse phases such as are observed in the N-body simulations. It is unsatisfying that collapse processes governed by the same agent seem to give rise to very dierent outcomes. On the observational side one may claim that the mentioned objects are simply not shaped by gravitational collapse alone. This is probably true to some extent, but one must certainly also doubt that we understand purely gravitational collapse completely. Recently, some results have been obtained, both by observational and theoretical means, which suggest that a more unied view is possible. Sanders & Begeman (1994) have modeled galaxy rotation curves using the density prole suggested
4 5.1 Introduction 149 Figure 1: Comparison of three models for the density prole. The Hernquist and Jae proles are dened in Eq. 5.4, the truncated isothermal prole is dened in Eq by Hernquist (1990) for the dark halo. They obtained excellent ts for the rotation curves using this model, and moreover found a relation between the total mass of the halo and the characteristic scale of the halo model, M / R 2 : (5:3) This relation is equivalent to a relation found by Fish (1964) for elliptical galaxies and to the similar relation for Abell clusters as determined by West et al. (1989). Dubinski & Carlberg (1991) found that the Hernquist model also provides a very good description of the density prole of the CDM halos in their high resolution collapse simulations. Their simulation was not fully cosmological, but they approximated the eects of external structures by introducing a linearly evolving tidal eld. In this way they were able to simulate the collapse of CDM clusters/halos with much higher resolution than would have been possible using fully cosmological simulations. Finally, inchapter 4 of this thesis, it was shown that, whereas clusters in realistic simulations follow the simple top-hat model (Gott & Gunn, 1972; Chapter 4) until turn-around, the outcome of the virialization process diers from the predictions. In the generalization of the top-hat model to spherical density perturbations with a general power-law prole, it is often assumed that all radii recollapse to a xed fraction of their turn-around radius (Gott & Rees, 1975; Homan & Shaham, 1985) and this assumption is conrmed by the semi-analytical calculations of Fillmore & Goldreich (1984) and Bertschinger (1985). However, in chapter 4 it was shown that larger radii collapse by smaller factors than inner ones, showing that these calculations do not correctly describe the relaxation process of clusters in cosmological simulations. In this chapter we will investigate the density proles of these simulated clusters in detail. We will do so by comparing these proles to the Hernquist and Jae proles respectively.
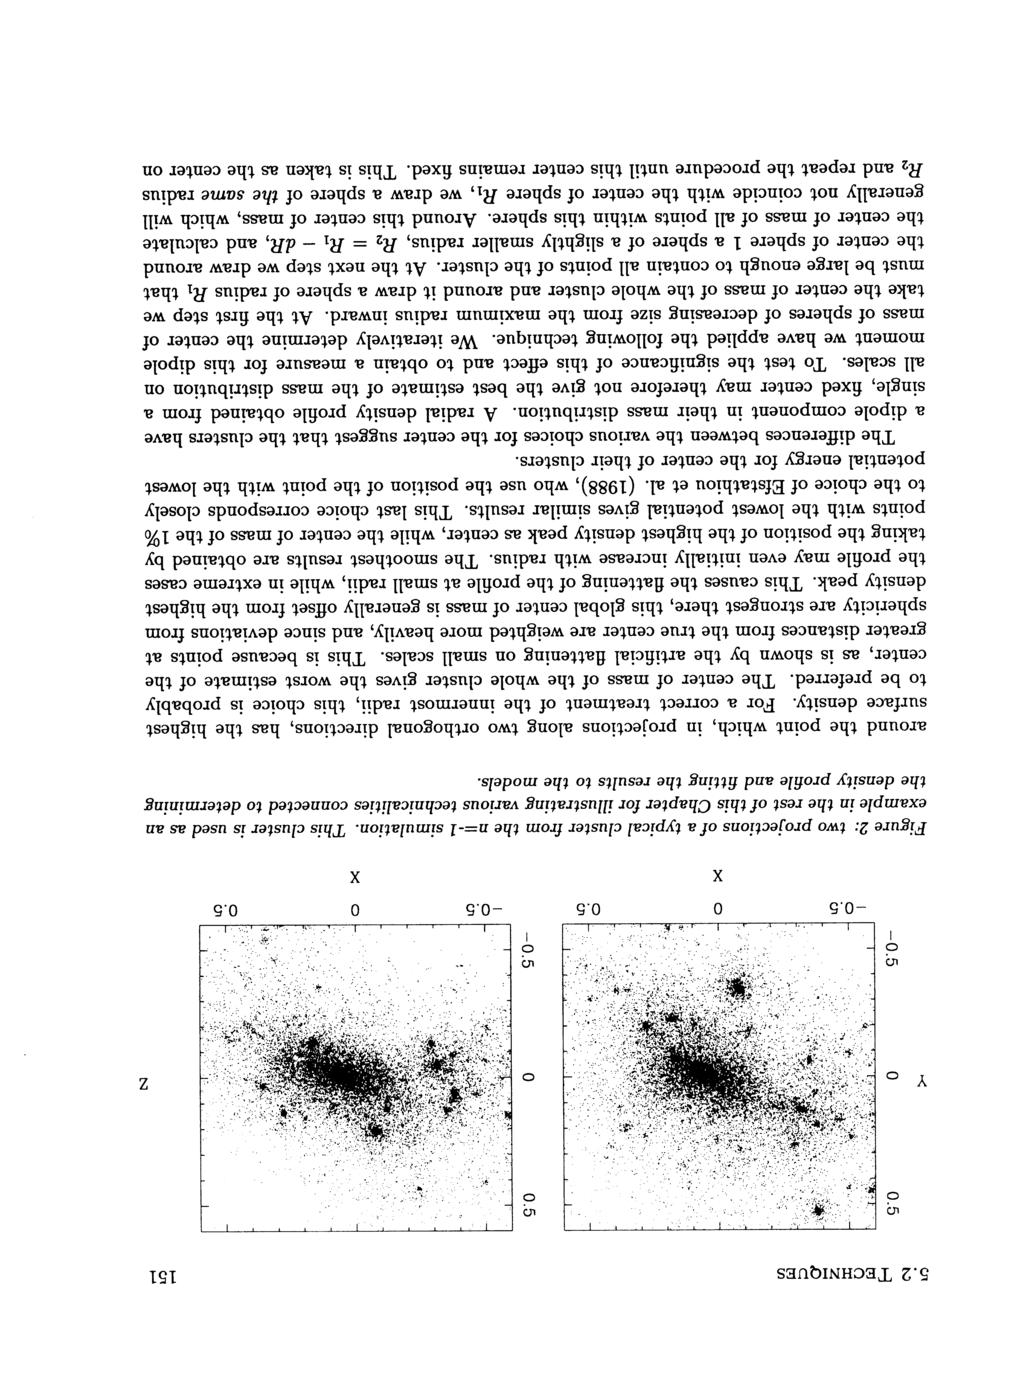
5 150 Chapter 5 Density profiles For completeness, these are dened by M H R H Hernquist : (R) = 2R(R + R H ) 3 Jae : (R) = M J R J 4R 2 (R + R J ) 2 ; (5.4) and they are drawn, together with the densiy prole for a truncated isothermal sphere, in Fig. 1. For this we need to determine accurate density proles, since these models essentially only dier in the central regions. For instance how one chooses the center is of great importance. This will be discussed in the next section. We will t the resulting proles to the various models using non-linear two-parameter ts. We will also perform three-parameter ts to the models dened by (5.1), by adding as a free parameter. Then the parameters obtained from the ts will be correlated and the results will be compared to observed correlations such as Fish's law. We will then investigate the density proles resulting from isolated collapse simulations. Some of these, obtained from extracting protoclusters from the cosmological simulations, were studied already in Chapter 4. Added to these are collapse simulations of initially spherically symmetric clusters with power-law density perturbation proles, and clumpy collapses, similar to those studied by van Albada (1982). We will conclude with a summary and discussion. 2 Techniques 2.1 Methods for determining the density proles In Fig. 2 we plot two projections of a typical cluster extracted from one of the cosmological N-body simulations that are the main object of study of this chapter. These simulations were considered earlier in Chapter 4 and will be described below. Here we expose the problems for estimating radial density proles of clusters and for tting these proles to the models, and we will present techniques to solve these. These problems originate from the fact that simulated clusters are in general not perfectly spherically symmetric structures. This deviation from exact spherical symmetry is most obvious through the occurrence of sub-structure, especially in the outer regions of the cluster, but also through the ellipsoidal shape of the main body. As argued in chapter 4, such deviations appear to have no signicant eects on those aspects of the dynamical evolution that one expects for an object that is exactly spherical. These deviations do however cause problems for estimating the radial density prole. The main problem lies in determining a physically meaningful denition of the cluster center around which to expand the density prole. The eects of incorrectly choosing the center can be seen from Fig. 3. There we show, for the cluster from Fig. 2, binned density proles for various choices for the center, namely, the center of mass of the whole cluster, the median position of the individual cluster particles and the center of mass of respectively the 10% and 1% of the points with the lowest potential energy. Also shown is the prole around the point which, in projections along two orthogonal directions, has the highest surface density. For a correct treatment of the innermost radii, this choice is probably
6
7 152 Chapter 5 Density profiles Figure 3: Density proles for the cluster in Fig. 2, determined using various denitions of the center of the cluster: Peak indicates the peak of the surface density distribution. C.o.M. indicates the center of mass of the whole cluster. Median indicates the median of the coordinates of the points. 10% and 1% indicate the center chosen as the center of mass of the respective number of points with the lowest potential energy. cumulative mass prole and quantitative information of the mismatch between the mass distributions on dierent scales, indicated by the positions of the respective centers. In Fig. 4 we show for the cluster in Fig. 2 the walk that the center performs as function of scale. Also plotted are the various xed centers used in determining the density proles in Fig. 3. Ideally the last step should bring the center to the highest density peak and we see that this indeed is the case. In the same gure we show the spheres corresponding to the moving centers. This gives a nice illustration of the asymmetry in this cluster and shows that the center adjustment is not a smooth process but seems to occur in several steps causing a crowding of the circles at the corresponding radii. In Fig. 5 we show the cumulative mass proles obtained using the moving center result as well as those obtained from the various xed centers. The result from the moving center method is almost exactly equal to the result where the highest density peak is chosen for center. It shows that the precise positioning of the cluster center is most important for the inner regions. It is interesting to speculate whether or not a dipole-mode of this kind, if also existent in dark halos around spiral galaxies, might be observed from the distribution and kinematics of the stars or HI-gas in those galaxies. There are many instances known where the gas
8 5.2 Techniques 153 Figure 4: Determining the cluster center dependent on the sampling radius. The upper diagram gives the cluster centers corresponding to the proles in Fig. 3. : C.o.M ; : median ; : 10% ; : 1% ; : peaks. The triangles correspond to the centers determined by the maximum likelihood method, explained in x 2.2. corresponds to ts to the Jae prole, to ts to the Hernquist prole. The dots trace centers according to the moving center approach as detailed in the text. The two lower frames show the corresponding spheres at two dierent scales.
9 154 Chapter 5 Density profiles Figure 5: Same as Fig. 3, but now for mass proles. has a lopsided distribution (Baldwin et al., 1980; Richter & Sancisi, 1994; Rix & Zaritski, 1995) and there are hints that also the kinematic center is dependent on scale. In M101 for instance, the kinematic center seems to move with increasing radius in the direction of the asymmetric `lobe' (Kamphuis, private communication). Apart from this dipole mode, there are higher order distortions to the shape of the cluster which might inuence the detailed shape of the density prole. The most important of these is the signicant ellipsoidal quadrupole mode in most of the clusters. To determine the eect of this on the density prole, we show in Fig. 6 the density prole of the cluster in Fig. 2 as determined using ellipsoidal shells. The axial ratios and orientation of these shells were determined for one particular value, a, of the major axis. Starting with a sphere of radius a, we iteratively calculate the moment of inertia tensor of the particles inside it, and from this tensor determine the orientation and axial ratios of the corresponding ellipsoid. We then determine all the points inside this ellipsoid and iterate this process until the parameters do not change anymore. The density prole is then determined on concentric ellipsoidal shells with these axial ratios and orientation. In Fig. 6 this prole is plotted not versus the size of its semi-major axis a, but versus the quantity r ell (abc) 1=3, where b and c are the sizes of the other two axes. This is the radius of the sphere that has the same volume as the ellipsoid with the given parameters. With this variable the ellipsoidal density prole agrees almost exactly with the radial density prole. We have therefore in this chapter concentrated exclusively on density proles calculated using spherical shells.
10 5.2 Techniques 155 Figure 6: Density proles for cluster in Fig. 2. The dashed line gives the density prole on ellipsoidal shells, with axial ratios determined by the method detailed in the text. The density is plotted versus the quantity (abc) 1=3, where a, b and c are the three semi-axes of the ellipsoid. The solid line is for spherical shells. 2.2 Fitting techniques After determining the density proles, we want to compare these to the class of models dened by (5.1), which has been proposed as a useful alternative to the R 1=4 {model prole. The present analysis rst concentrates on tting the Hernquist and Jae models to the proles (Hernquist, 1990; Jae, 1983). These models contain two parameters, the total mass M c and a characteristic radius R c, which determines the scale at which the model crosses from a / r 3 to a / r 4 behaviour, where =1;2 for the Jae and Hernquist models respectively. The choice which tting method to use contains a number of subtleties, which will again be discussed with the cluster in Fig. 2asexample. The standard tting methods use 2 -minimization, where 2 NX i=1 w i ( model (r i ; f n g) obs (r i )) 2 (5:5) where the n are the parameters and w i are the weights which are generally taken to be 2 (r i ). Minimization of this function with respect to its parameters gives by construction the minimum-variance solution (e.g. Eadie et al., 1971). However, instead of tting to the density prole itself, one might also t the model to the cumulative mass prole, or for instance to the rotational velocity prole v rot as dened above. This last option would most closely agree with the determination of the density proles of dark halos around
11 156 Chapter 5 Density profiles spiral galaxies (van Albada et al., 1985; Sanders & Begeman, 1994). In general the tted parameters will be dierent for these dierent choices; in many cases, even just tting the model to log() instead of to the itself will already give dierent results. The cause of this can be understood from the maximum likelihood derivation of the 2 {method. The standard assumption is that when the real model is given by ex (r i jm c ;R c ), the probability that one measures obs (r i ) i is normally distributed P ( obs )= 1 p 2 2 i exp (obs;i ex;i ) 2 For N observations a log-likelihood function is dened by (fr i g) 2 log = NX i=1 " NY i=1 2 2 i P (r i jm c ;R c ) # (5:6) ( obs;i ex;i ) 2 + const (5.7) which is to be minimized with respect to the parameters M c and R c. Clearly, when (5.6) gives the correct probability distribution for the value of obs, the distribution resulting from a non-trivial transformation F() will in general not be Gaussian, and while the least squares method will still give the minimum variance solution it will in general be biased. Since we do not know the correct distribution we R have tted the models both to log() R and to the cumulative mass prole, M cum (R) 4 0 r2 (r)dr. The proles were determined both with the highest density peak as center and with the moving center method. The consistency of the dierent methods should give some indication of the bias involved in the tting procedures. Using the least-squares method we also must specify the weights for the individual data points. After xing the center and the size of the bins there are no observational uncertainties left. For the simulations studied here, the data points may be viewed as a sampling of the true density eld, and one expects noise to be introduced by this. In particular, one expects small bins to show greater scatter than larger bins, and we would like to give less weight to their contribution. We have therefore assumed Poisson weights, i.e. we have used the counts in the logarithmic bins as weight: w i = N i. In general, working with unbinned data is preferable to using binned data, since in the process of binning one only uses part of the information available. We have therefore developed yet another method for tting the models to the cluster data. This method is similar to that developed by Sarazin (1980) for tting models to the angular distribution of galaxies in clusters on the sky, but diers from it in certain important aspects. Both Sarazin's and our methods use the positions of all the individual galaxies in the clusters to t the position of the center together with the other model parameters, via a maximumlikelihood technique. For a certain choice of center, x c, and model parameters, in our case M c and R c, Sarazin denes the likelihood function L Sar NY i1 2 i mod (jx i x c jjm c ;R c ) ; (5:8)
12 5.3 Results I 157 where mod is the model. This function is to be maximized with respect to all the parameters, including x c. As Sarazin notes, increasing M c will always increase L Sar and he therefore xes the total mass. For this reason we have chosen a dierent form for the likelihood function, that will allow us to vary the mass in the tting procedure as well. Our choice is based on the cumulative mass prole instead of on the radial density prole. There is no simple, natural form for the corresponding probability distribution and we therefore make the ansatz that the probability that one nds M points within a sphere of radius R around the center has a normal form. The likelihood function is then dened by L(x c ;M c ;R c )= NY i=1 1 p 22 (R i ) exp (M cum (R i ) M model (R i )) 2 =2 2 (R i ) (5:9) where R i = jx i function x c j. Maximizing this function is equivalent to minimizing the log-likelihood = 2 log(l) (i mp M model (R i )) 2 NX i=1 2 (R i ) + log(2 2 (R i )) (5.10) where m p is the mass per particle and the points are ordered such that the individual R i are increasing with i. For the results presented below we have assumed the Poisson form for the variance 2 (R i ) m p M model (R i ). Using the algorithm AMOEBA from Press et al. (1989) we minimize this function for the Jae and Hernquist models. For the cluster in Fig. 2 the centers that are found using this method are plotted as the open and lled triangles in Fig. 4. The center as determined from the t to the Jae model is closer to the highest density peak than the one obtained from the Hernquist t. This is probably due to the fact that the Jae prole is steeper in the inner regions, J / r 2 and the method will search for the steepest density drop which will be associated with the local density maximum. The Hernquist model is atter in the inner regions, / r 1, and may actually t better with the center somewhat displaced from the density maximum, as happens to be the case for this cluster. 3 Results I: cosmological N-body simulations 3.1 Results from the cosmological simulations Our investigations have concentrated on the study of two large cosmological N-body simulations that were provided by Simon White. These have been described elsewhere (Chapter 4; see also White, 1993), and here we will review the most important aspects. Both simulations contain 10 6 particles that were distributed uniformly throughout the simulation cube, but for density perturbations which followed a Gaussian random eld with a power-law power spectrum, P (k) / k n, with n = 1; 0. These were evolved in time with a particleparticle particle-mesh (PPPM) algorithm, where the PM-part used a grid of cells and the PP-part had a force-softening parameter,, of size = L=2500, with L the size of the
13 158 Chapter 5 Density profiles Figure 7: Density proles for massive clusters in n={1 (upper frames) and n=0 (lower frames) simulations, normalized using parameters from ts to Hernquist (left) and Jae (right) model.
14 5.3 Results I 159 Figure 8: Density proles from Fig. 7 averaged over all clusters, dotted lines give uncertainty in the average. The upper dashed lines give Hernquist model (left) and Jae model (right). Bar-codes show the correspondingly renormalized values of the force-softening radius. Also plotted are the tangential and radial velocity dispersions, respectively open squares and lled dots. The lower dashed lines give the model predictions for an isotropic velocity distribution.
15 160 Chapter 5 Density profiles simulation cube (for details of the algorithm see Hockney & Eastwood, 1981; Efstathiou et al. 1985). The clusters under consideration here were extracted from the last output time of the simulations using a standard friends-of-friends (fof) algorithm (e.g. Efstathiou et al. 1985). With a linking length that was 10% of the mean inter-particle spacing, we determined the centers-of-mass of the most massive clusters. Around these centers we determined the spheres within which the overdensity with respect to the whole simulated volume was c = 50, and we took all the points contained in these spheres to form the nal clusters. Note that this is a lower value for the overdensity than the c = 200 used in Chapter 4, and the clusters will consequently be somewhat larger. We used all the clusters which had an `fof-core' containing at least 1000 particles, which yielded 60 clusters for the n={1 simulation and 111 clusters for the n = 0 simulation. To these we added about 25 clusters, whose fof-cores contained between 200 and 1000 particles, and were roughly uniformly chosen from this range. For these clusters we determined density and mass proles around the position of the highest density peak, and mass proles using the moving center method. We tted Hernquist and Jae models to these proles using a standard non-linear least-squares routine. The results from the density prole ts are shown in Fig. 7. In this gure we show all the individual density proles after normalizing them using the tted parameters. In Fig. 8 the individual proles are averaged and compared to the models. Clearly, the Hernquist prole gives an excellent t to the average cluster prole over the whole range of radii and for both the n={1 and n=0 simulations, although it may be somewhat low in the central parts. The Jae prole is equally well able to t the model in the outer parts, but is too steep in the inner parts. The `bar-codes' in Fig. 8 show the distribution of renormalized force-softening radii. The main discrepancy between the models and the mean proles appears at radii smaller than the softening radius. Crone et al. (1994) correct their density proles for this force softening. They use an argument based on an adiabatic invariant of the particle orbits under the change of zero to nite softening. This should steepen the proles and the Jae model might then actually provide the better t. On the other hand, in the inner parts discreteness eects will probably destroy the correspondence of the simulation to dark halos or clusters in the Universe anyway, and we have therefore chosen to present the results without this correction. Fig. 8 also shows the average velocity dispersion proles, both for the radial and the tangential components. The lines drawn through these points give the isotropic solutions for a spherical model cluster, as derived for instance in Tremaine et al. (1993). Although the velocity dispersion is not isotropic for all radii, the model curves t the results reasonably well, with again a discrepancy in the inner regions for the Jae model. Due to the unknown eects of the nite softening radius of the force calculation, no compelling case can be made for either of these two models as providing the best description of the `data'. We havetherefore also performed three-parameter ts to the density proles using the more general class of -models (Tremaine et al., 1993) as dened in Eq In Fig. 9 we show the distribution of the tted values for for all the clusters in the two simulations. The values of are comparable for the two simulations and lie roughly between 1 and 2, the values for the Jae and Hernquist models. The average values of for the two simulations are similar: <>1:6. There is no trend of with mass, but there is a trend
16 5.3 Results I 161 of versus R, such that high values of imply low values of R. R measures the radius at which the logarithmic slope of the prole reaches the value ( 7)=2 and is thus clearly coupled to. This shows that the scale parameter R itself is not well suited to use for a measure of the characteristic scale of the cluster. Below we will show that a combination of R and does provide a good characterization of the size of the clusters. In Fig. 10 we compare the parameters obtained from the dierent prole denitions and tting methods to each other. It shows that in general the methods agree quite well although there are exceptions for individual clusters. The clusters which show the greatest Figure 9: Correlations of parameters from three-parameter ts. M and R vs. Left for clusters from n={1 simulation, right for n=0.
17 162 Chapter 5 Density profiles Figure 10: Comparison of tted parameters for dierent methods for dening the density proles. Plotted are parameters from ts using moving-center method versus density proles around highest density peak (upper panels), and maximum-likelihood ts versus the highest density peak (lower panels). Indicated in the panels are the parameters which are compared. Again, the left panels show the results for the n={1 simulation, right for n=0. discrepancies, generally also show signicant deviations from spherical symmetry, both in the core and in the outer regions. Another interesting relation is the one between the centers found by the moving center
18 5.3 Results I 163 Figure 11: Comparison of the centers found with two dierent algorithms. method at the smallest radius and the centers found by the maximum likelihood method. As Fig. 11 shows, the maximum likelihood t to the Jae model nds the highest density peak with greater accuracy than the t to the Hernquist model. But as Fig. 10 shows, the model parameters that are found, generally agree very well also for the Hernquist ts. 3.2 R / M In Fig. 12 we show the model parameters obtained from the ts to the highest peak density proles. Clearly the two parameters are strongly correlated. A t to apower law relation, R c / Mc gives n = 1 : R H / M 0:490:04 H R j / M 0:660:06 J (5.11) n =0 : R H /M 0:570:04 H R J / M 0:770:06 J (5.12) One notes that the relations depend on the model that is used for tting. The relations for the Hernquist ts agree very nicely with similar relations obtained by Fish (1964) and Kaastra & van Bueren (1981) for elliptical galaxies, West et al. (1989) for clusters of galaxies and Sanders & Begeman (1994) for dark halos. West et al. give a prediction for the expected relation for clusters from power-law power spectra, P (k) / k n : R c / M c ; = 5+n 9+n (5:13) which gives = 0:5; 0:56 for n = 1; 0 respectively. This prediction agrees perfectly with the relations for the Hernquist models. West et al. do not give a derivation of this relation
19 164 Chapter 5 Density profiles Figure 12: Correlations of parameters from two-parameter ts, for Hernquist and Jae model. The lines correspond to the ts in eqs. (5.11) and (5.12) and it is dierent from that more often used in the literature (Chapter 4) R c / M c ; = 5+n 6 (5:14) This relation is closer to the ts to the Jae model, but disagrees with the Hernquist results. The relations found by Fish and Kaastra & van Bueren were determined for quantities directly obtained from the data, i.e. without tting models. In Fig. 13 we show similar results for the present simulations. There we show the specic total and kinetic energies versus the total mass. The potential energy is obtained from the isolated clusters with a particle-particle algorithm (e.g. Hockney & Eastwood, 1981). For the mass we simply take the total number of particles in the cluster multiplied by the individual particle's mass. Clearly these quantities are only rough approximations to the exact values; the eects on the energy from exterior structures is not taken into account, while the mass may be overestimated due to the inclusion of all particles within a density contour = 50, while a more natural choice might be 200. Nevertheless, all these model-independent quantities show strong correlations, which are closer to the results from the Hernquist ts than to those from the Jae ts. In Fig. 14 the correlation between the quantities M and R, obtained from the threeparameter ts to the -models, are shown. This correlation has signicantly greater scatter than the ones obtained with xed. However, when we plot the half-mass radius R 1=2 R =(2 1= 1) instead of R, the correlation is tighter again and, moreover, is very similar to the relations found before for the t to the peak-density proles. The reduction of the scatter is caused by the clear correlation between the value of and the corresponding scale
20 5.3 Results I 165 Figure 13: Characteristic total energy and kinetic energy versus the total mass of the clusters in the cosmological simulations. These quantities are determined directly from the clusters, independent of model ts. The parameters i give the slopes of the tted lines: 1 is obtained from tting the model E=M / M 1, 2 is obtained from tting the model M / (E=M) 1= 2. factor R. This nicely illustrates a point made by Kormendy (1982) about the use of extra free parameters in ts. His main point is that when the main characteristics of an observed prole are already well described by a functional form with say two parameters, adding a third will in general not just serve to describe the remaining characteristics; it will more generally mix with one or both of the original parameters and so spoil the interpretation of these in terms of the physically relevant structural characteristics. In the case at hand, R not only determines the scale, but also the form of the prole and the same so for. It is only a combination of the two that gives information on the spatial size of the clusters. 3.3 Rotation curves For comparing the clusters in the simulations to the dark halos around spiral galaxies, it is useful to plot ducial rotation curves, which are dened by r GM(R) v rot (R) : (5:15) R In Fig. 15 we have plotted this quantity for all clusters individually, normalizing the size of the simulation cube of the last output frame to unity. From plots like these various authors
21 166 Chapter 5 Density profiles Figure 14: Correlation of R and corresponding R 50% with M. Due to correlation of with R (see Fig. 9), correlation of R 50% with mass is tighter. Fitting R 50% / M gives =0:54 0:02 (n={1) and =0:65 0:02 (n=0). have concluded that the scaling models are correct in predicting rotation curves that are declining more steeply with increasing power-law exponent n (e.g. Efstathiou et al., 1988; Warren et al., 1992). We here propose a dierent explanation for this observation that for xed radius, the slope of the rotation curve is steeper in the n = 0 simulation than in the n={1 simulation. From the normalized plots in Fig. 12 we see that in the n={1 simulation, objects in general have a greater characteristic radius than objects of the same mass in the n = 0 simulation. Since clusters in both simulations have density proles that are excellently tted by the Hernquist model, their rotation curves should be similar apart from dierent normalizations. A smaller characteristic radius implies, for the same mass, a steeper prole at the same radius, even when the overall shape of the curves is the same. This observation can therefore not be considered to justify the infall models. One needs to carefully examine the density proles themselves and these are clearly not power-laws. These conclusions are corroborated by the results presented in the lower panels of Fig. 15. In that gure the average rotation curves are shown for the clusters in the two simulations. The averaging was performed using the half-mass radius and the mass of the clusters as they were extracted from the simulations, without any model tting. The gure shows that within the uncertainties the rotation curves are the same for the two simulations, corroborating the conclusions drawn above. Nevertheless one would expect the initial conditions to show up somewhere, be it in the amplitude of the relation R / M or in the value of the exponent. Our observations are limited to two simulations and clearly it would be very useful to repeat the above analysis for a greater range of initial conditions.
22 4. RESULTS II: ISOLATED COLLAPSE SIMULATIONS 167 Figure 15: Upper panels show the rotation curves for the clusters from the simulations, derived from the density proles. Rotation velocity dened by V rot = (M(R)=R) 1=2. Scales normalized such that scale of simulation volume is a=1 at nal time. In the lower panels these rotation curves are normalized by half-mass radius and corresponding velocity and then averaged. 4 Results II: isolated collapse simulations In this section we present the results of a number of isolated collapse simulations that were performed to check the structural properties of clusters evolved from a greater range of initial conditions. Our main aim was again to determine the density prole of the resulting objects and compare these to the Hernquist and Jae models, and also to the more general class of `-models' dened above. Depending on the nature of the initial model, we used two dierent simulation algorithms. In those cases where one expects substructure to develop and relax on timescales short compared to the evolution of the cluster as a whole, we used a version of Hernquist's TREE-code. This code allows one to follow the evolution of clustering with a high spatial resolution over the whole simulation volume. In cases where the predominant evolution was infall onto a central condensation, we used a code originally developed by van Albada (1982), where the potential is expanded in spherical harmonics on a radial grid with highest resolution in the inner parts (SPEXP code). The advantage of this over the TREE code is its speed, the SPEXP algorithm being linearly dependent on the number of particles. Due to the spatial dependence of the force resolution the SPEXP-code is not well suited for following the evolution of small scale structure outside of the inner regions. We studied four types of initial conditions. The rst two classes of models were discussed already in Chapter 4. These models are constructed out of the initial conditions of the
23 168 Chapter 5 Density profiles Figure 16: Density proles for isolated collapse simulations using the TREE-code of clusters extracted from n={1 cosmological simulation. Curves give best ts to Hernquist model (solid line), Jae model (dashed line) and -model (dotted line). The value for is indicated, as are the characteristic radii obtained from the two-parameter ts. n={1 cosmological simulations. For some of the clusters of the nal output time of that simulation, we extracted the corresponding points at the initial time. Around the center of mass of these points a sphere was drawn with a radius of order the maximum distance of the cluster points to the center. The points enclosed by this sphere constituted the nal, enlarged cluster, which we then evolved in isolation using the TREE code. From these
24 5.4 Results II 169 Figure 17: Density proles for isolated collapse simulations using the SPEXP-code (see text), for spherically symmetrized versions of same clusters as in Fig. 16. models, a second set of spherically symmetric protoclusters was constructed by angularly randomizing the positions of the points of these cluster around the center of mass, leaving the initial radius and radial velocity of the points constant. This class of models was evolved using the SPEXP code. In Chapter 4 these clusters were used to compare the evolution in isolation with that in the fully cosmological environment. In Figs. 16 and 17 we show the resulting density proles, determined from the highest density peak of the clusters, together with the best tting model proles, both from the Hernquist and Jae two-parameter ts,
25 170 Chapter 5 Density profiles Figure 18: Half-mass radii and total masses from three-parameter ts for the three versions of the clusters in Fig. 16 and 17. and the -model three-parameter ts. Clearly, the models t the end products of these isolated collapses as well as they did for the average clusters in the fully cosmological simulation. The parameters from the three parameter ts for the three dierent versions of the clusters are compared in Fig. 18. There does not seem to be a systematic eect on the tted parameters, while the ordering in mass and radius between the clusters is preserved. The second class of models should closely correspond to the idealized models that are investigated in the semi-analytical self-similar infall models, supposed to describe the collapse of clusters from power-law initial perturbation spectra (Fillmore & Goldreich, 1984; Bertschinger, 1985; Zaroubi & Homan, 1993). This correspondence should be perfect for our third class of isolated models. This class consists of spherical clusters that have an exactly power-law radial density perturbation : (r) = 1+(r=r 0 ) : (5:16) Their initial expansion velocity was a pure Hubble ow, v(r) =Hr;H 2 =8G=3, to which was added a velocity perturbation in the linearly growing mode corresponding to the density perturbation interior to the radius. We used three choices for the power-law exponent, = 0:5; 1; 1:5, corresponding to power-spectrum exponents, n = 2; 1; 0 respectively. In Fig. 19 we show the nal density proles for six of theses clusters, two for each choice of. These clusters had a uniform component of mass M = 0:05, in the same units as the cosmological simulations, and the density perturbation within the maximum radius was
26 5.4 Results II 171 Figure 19: Density proles for spherical collapse simulations with power-law density perturbation proles. Power-law exponent is indicated, as well as best t for from three-parameter ts to -models. Arrows indicated by H(ernquist) and J(ae) give characteristic scaling radii from two-parameter ts to corresponding models. Lines give best ts for these models as in Fig. 16. (r max )=0:05. The density proles are very well tted by the Hernquist prole and clearly less so by the Jae prole, which in this case is signicant since the resolution is much higher than the characteristic scales of the clusters. In Fig. 20 we plot the characteristic radii versus. There is a clear anti-correlation between the value of and the value of R 50%, which implies that R 50% increases with decreasing n, just as was suggested in the
27 172 Chapter 5 Density profiles Figure 20: Half-mass radii for the clusters in r. 19, determined from ts to Jae, Hernquist and -models, as function of power-law exponent of initial density perturbation prole. previous section. The nal set of models is similar to the clumpy models investigated by van Albada (1982). Spherical, uniform groups of points were uniformly distributed over a spherical region. Both the points within each group and the groups as a whole were given random velocities that were a fraction of the virial velocity of the whole cluster. The clusters were not expanding. For certain choices of the parameters, these models were shown by van Albada to lead to nal surface density proles that were very well tted by a de Vaucouleurs prole (van Albada, 1982). The radial density proles of the clusters simulated here are shown in Fig. 21. The dierent clusters correspond to various choices for the radius of the sub-clusters, the random velocities of the sub-clusters and of the particles within each sub-cluster. The correspondence with the model proles is not very good for these clusters. In all cases the inner regions are too at for both the Jae and the Hernquist models, while the outer regions are too steep. The -model ts are badly constrained and give unphysical values, > 3. The formation of a at, core-like region, which was also observed by van Albada in his models, may be due to the constraint that the course-grained phase space density can not increase to values higher than the initial maximum ne-grained phase space density (e.g. Carlberg, 1986). As Carlberg et al. (1986) show, in such cases dissipation may help to achieve higher core densities.
28 5. SUMMARY AND DISCUSSION 173 Figure 21: Density proles from clumpy collapse simulations using the SPEXP-code. Lines correspond to model ts as in Fig Summary and discussion In this chapter, the question has been addressed of what may be the outcome of purely gravitational collapse processes. We have done so by analyzing the radial density proles of clusters that were formed in dissipationless collapse simulations. Our main aim was to try to resolve the apparent discrepancy between the two main pictures of the approach to equilibrium, namely violent relaxation (Lynden-Bell, 1967) and secondary infall (Fillmore &
29 174 Chapter 5 Density profiles Goldreich, 1984; Bertschinger, 1985). These processes give rise to dierent types of objects, both of which have apparently been observed and reproduced in N-body simulations. Observations show that rotation curves of spiral galaxies are at out to large radii, while the surface density proles of elliptical galaxies are well described by a de Vaucouleurs, R 1=4 prole. The rst observation is explained by assuming that the density prole of the underlying dark halo asymptotically behaves as R 2, while the de Vaucouleurs prole is well reproduced by the so-called Hernquist prole, which behaves asymptotically as R 4. Dark halos are usually equipped with at cores, constant for R small, while the Hernquist model diverges for R 1 ;R! 0. According to Sanders & Begeman (1994), this last characteristic of the Hernquist prole actually would make it an ideal model also for the dark halos of spiral galaxies, since this behaviour might reproduce the successes and implied correlations from MOND ts to observed rotation curves (Begeman et al., 1991). Indeed, Sanders & Begeman (1994) were able to t several rotation curves very well using essentially one parameter Hernquist models, where the total mass and characteristic radii were coupled as R H / M 1=2 H. If dark halos actually have a Hernquist prole and if the mass and radius are related as above, this might explain the success of the MOND ts, without requiring new gravitational physics, and, moreover, would provide an explanation for the Tully-Fisher relation. If indeed dark-halos can be described by the same models as elliptical galaxies, this would strengthen the belief that these objects have originated from similar collapse processes. On the theoretical side, both forms of the density prole in dark halos have been explained using dissipationless collapse processes. Power-law halos result from semi-analytical self-similar infall calculations where r 2 is achieved for the correct choice of initial conditions (Fillmore & Goldreich, 1984; Bertschinger, 1985; Zaroubi & Homan, 1993). These results have found support in various cosmological N-body simulations, in which it was found that rotation curves are atter for (power-law) initial conditions, P (k) / k n, with lower values for n (e.g. Efstathiou et al., 1988; Warren et al., 1992; Crone et al., 1994). On the other hand, collapse simulations from clumpy initial conditions, have reproduced the de Vaucouleurs prole of elliptical galaxies (van Albada, 1982), while high resolution collapse simulations from CDM initial conditions with an approximate inclusion of the external u- niverse produced clusters whose density proles were described by the Hernquist model to high precision (Dubinski & Carlberg, 1991). In this paper we have shown that indeed the Hernquist and to a lesser extent also the Jae models, provide an accurate description of the radial density proles of clusters that were evolved from a range of scale-free initial conditions. This means that the scale-free nature of the initial conditions is broken during the gravitational evolution of the individual clusters. At the same time it was shown that the basic model parameters, namely the mass and the characteristic scale, are strongly correlated: R c = A(n)M (n) c : (5:17) Here we propose that, instead of working on the individual cluster level, as is assumed in the infall models for cluster formation, the initial conditions determine the quantitative properties of this scaling relation. In this picture, the non-power-law shape of the individual cluster proles is determined by collective, violent, relaxation processes, in which the initial
30 5.5 Summary and discussion 175 conditions are remembered only in so far as they determine the form of the above scaling relation. As the articial cold and clumpy collapses show, the functional form of the nal density prole may at least to some level be determined by the initial conditions as well, but for the range of more realistic initial conditions investigated in this work and in the work of other authors, it seems that the -models in general, and the Hernquist model in particular, form a more or less universal class of model proles to which the clusters evolve in their nal relaxation stages. One consequence of this is that the atness of rotation curves of spiral galaxies is not necessarily a consequence of the initial conditions. In the past, rotation curves were derived for clusters in cosmological simulations, which appeared atter for lower values of the exponent n in the power-spectrum P (k) / k n (e.g. Efstathiou et al., 1988). Simple analytical arguments predict at rotation curves for n={2, which happens to be the logarithmic slope of the Cold Dark Matter (CDM) spectrum at galaxy scales. These same arguments do however predict power-law density proles, which are not observed in the simulations investigated here. As shown by Sanders & Begeman (1994), dark halos with a Hernquist density prole can explain the rotation curves around spiral galaxies. To compare their results to the present ones we need to assign physical sizes to the simulated clusters. Since the simulations are essentially scale free, there is no unique way in which such an identication may be obtained (see Barnes & Efstathiou, 1987, for a discussion of several methods). Here we are interested in comparing the correlation between mass to a radius to the observed relation. We will therefore assume that the nal output corresponds to the present time. We will rst assume that a cluster of points corresponds to a mass of M ; the total mass in the simulations was therefore M. Writing the Hubble parameter at present as H 0 = 100h km/s, we obtain for the density in the present Universe c = 3H 2 0 =8G = 2: h 2 (M =Mpc 3 ). We may now calculate the size of the simulating box, which is L = 7:1h 2=3 Mpc. From Fig. 12 we see that a mass of M in the n={1 simulation corresponds to a radius of roughly R 0 = 0:0055 7:1h 2=3 39h 2=3 kpc. For the n=0 simulation the radius is R 0 =27kpc. The results obtained by Sanders & Begeman (1994) indicate that a mass of M corresponds to a radius of R 0 = 123kpc. They took a value of H 0 =75km=s=Mpc for the Hubble constant, which then gives R 0 =47kpc and R 0 =33kpc for n={1 and n=0 respectively. These values fall short of the observed values, but one might expect such a result. The CDM spectrum has a logarithmic slope corresponding to an n={2 power-law spectrum at galaxy scales. For n={2 we expect the characteristic radius to be still larger, which may resolve this mismatch. There is a worse problem with this normalization however. The implied correlation length, the radius at which the two-point correlation function reaches unity, would be r 0 0:5Mpc (for n={1), an order of magnitude smaller than is observed in the Universe (see Chapter 1). One may normalize the simulations such that these values agree, but it turns out that the implied characteristic radii are then even smaller than with the previous normalization. Some interesting questions still await an answer. First, the shape of the dark halos around spiral galaxies is still badly constrained. The present work indicates that halos are essentially nite. This may be an artifact of the limited range of initial conditions that
Does Low Surface Brightness Mean Low Density? W.J.G. de Blok. Kapteyn Astronomical Institute. P.O. Box AV Groningen. The Netherlands.
 Does Low Surface Brightness Mean Low Density? W.J.G. de Blok Kapteyn Astronomical Institute P.O. Box 800 9700 AV Groningen The Netherlands and S.S. McGaugh Department of Terrestrial Magnetism Carnegie
Time /Gyrs
 1 0.8 0.6 0.4 0.2 0 0 20 40 60 80 100 Time /Gyrs 1 0.8 0.6 0.4 0.2 0 0 2 4 6 8 10 Time /Gyrs On the destruction and over-merging of dark halos in dissipationless N-body simulations Ben Moore, Neal Katz
Citation for published version (APA): Martinus, G. H. (1998). Proton-proton bremsstrahlung in a relativistic covariant model s.n.
: Martinus, G. H. (1998). Proton-proton bremsstrahlung in a relativistic covariant model s.n.") University of Groningen Proton-proton bremsstrahlung in a relativistic covariant model Martinus, Gerard Henk IMPORTANT NOTE: You are advised to consult the publisher's version (publisher's PDF) if you
University of Groningen Proton-proton bremsstrahlung in a relativistic covariant model Martinus, Gerard Henk IMPORTANT NOTE: You are advised to consult the publisher's version (publisher's PDF) if you
Citation for published version (APA): Boomsma, R. (2007). The disk-halo connection in NGC 6946 and NGC 253 s.n.
: Boomsma, R. (2007). The disk-halo connection in NGC 6946 and NGC 253 s.n.") University of Groningen The disk-halo connection in NGC 6946 and NGC 253 Boomsma, Rense IMPORTANT NOTE: You are advised to consult the publisher's version (publisher's PDF) if you wish to cite from it.
University of Groningen The disk-halo connection in NGC 6946 and NGC 253 Boomsma, Rense IMPORTANT NOTE: You are advised to consult the publisher's version (publisher's PDF) if you wish to cite from it.
Citation for published version (APA): Fathi, K. (2004). Dynamics and morphology in the inner regions of spiral galaxies Groningen: s.n.
: Fathi, K. (2004). Dynamics and morphology in the inner regions of spiral galaxies Groningen: s.n.") University of Groningen Dynamics and morphology in the inner regions of spiral galaxies Fathi, Kambiz IMPORTANT NOTE: You are advised to consult the publisher's version (publisher's PDF) if you wish to
University of Groningen Dynamics and morphology in the inner regions of spiral galaxies Fathi, Kambiz IMPORTANT NOTE: You are advised to consult the publisher's version (publisher's PDF) if you wish to
2. What are the largest objects that could have formed so far? 3. How do the cosmological parameters influence structure formation?
 Einführung in die beobachtungsorientierte Kosmologie I / Introduction to observational Cosmology I LMU WS 2009/10 Rene Fassbender, MPE Tel: 30000-3319, rfassben@mpe.mpg.de 1. Cosmological Principles, Newtonian
Fundamental Planes and Galaxy Formation
 Fundamental Planes and Galaxy Formation Philip Hopkins, NoviCosmo 2007 Fundamental Planes = Scaling Laws Obeyed by Galaxies vs Origin of scaling laws: Ideally, we d understand every galaxy as an individual:
astro-ph/ Oct 1994
 Formation and Evolution of Galaxies: Lectures given at Les Houches, August 1993 Simon D.M. White Institute of Astronomy Cambridge, England now at Max-Planck-Institut fur Astrophysik Karl{Schwarzschild{Str.
2 Nusser & Sheth N(r) b = r rv N 1 + c r r v 2 ; (1) where b is the background density and r v is the virial radius of the halo, dened as the radius w
 b = r rv N 1 + c r r v 2 ; (1) where b is the background density and r v is the virial radius of the halo, dened as the radius w") Mon. Not. R. Astron. Soc. 000, 000{000 (0000) Printed 24 March 1998 (MN LATEX style le v1.3) Mass growth and density proles of dark matter halos in hierarchical clustering Adi Nusser & Ravi K. Sheth Max-Planck
Mon. Not. R. Astron. Soc. 000, 000{000 (0000) Printed 24 March 1998 (MN LATEX style le v1.3) Mass growth and density proles of dark matter halos in hierarchical clustering Adi Nusser & Ravi K. Sheth Max-Planck
Rotation curves of spiral galaxies
 Rotation curves of spiral galaxies Rotation curves Mass discrepancy Circular velocity of spherical systems and disks Dark matter halos Inner and outer regions Tully-Fisher relation From datacubes to rotation
The mass of a halo. M. White
 A&A 367, 27 32 (2001) DOI: 10.1051/0004-6361:20000357 c ESO 2001 Astronomy & Astrophysics The mass of a halo M. White Harvard-Smithsonian Center for Astrophysics, Cambridge, MA 02138, USA e-mail: mwhite@cfa.harvard.edu
Theoretical simulation of nonlinear spectroscopy in the liquid phase La Cour Jansen, Thomas
 University of Groningen Theoretical simulation of nonlinear spectroscopy in the liquid phase La Cour Jansen, Thomas IMPORTANT NOTE: You are advised to consult the publisher's version (publisher's PDF)
arxiv:astro-ph/ v1 7 Jan 2000
 Biased Estimates of Ω from Comparing Smoothed Predicted Velocity Fields to Unsmoothed Peculiar Velocity Measurements Andreas A. Berlind, Vijay K. Narayanan 1 and David H. Weinberg Department of Astronomy,
AY202a Galaxies & Dynamics Lecture 7: Jeans Law, Virial Theorem Structure of E Galaxies
 AY202a Galaxies & Dynamics Lecture 7: Jeans Law, Virial Theorem Structure of E Galaxies Jean s Law Star/Galaxy Formation is most simply defined as the process of going from hydrostatic equilibrium to gravitational
A Universe in Motion: Testing the Cosmological Paradigm with Galaxy Dynamics. John Dubinski, Toronto
 A Universe in Motion: Testing the Cosmological Paradigm with Galaxy Dynamics John Dubinski, Toronto Outline Cosmology and galaxy dynamics Tools of the trade and computational challenges Case Studies: Triaxial
The motions of stars in the Galaxy
 The motions of stars in the Galaxy The stars in the Galaxy define various components, that do not only differ in their spatial distribution but also in their kinematics. The dominant motion of stars (and
The dark matter crisis
 The dark matter crisis Ben Moore Department of Physics, Durham University, UK. arxiv:astro-ph/0103100 v2 8 Mar 2001 Abstract I explore several possible solutions to the missing satellites problem that
This figure "fig1-1.png" is available in "png" format from:
 This figure "fig1-1.png" is available in "png" format from: http://arxiv.org/ps/astro-ph/9404030v1 This figure "fig2-1.png" is available in "png" format from: http://arxiv.org/ps/astro-ph/9404030v1 This
Exponential Profile Formation in Simple Models of Scattering Processes
 Exponential Profile Formation in Simple Models of Scattering Processes Curtis Struck Iowa State Univ. Work in collab. with B. G. Elmegreen, D. Hunter, H. Salo Lowell Workshop, Oct. 2014 Exponential profiles
A Universal Density Profile from Hierarchical Clustering
 A Universal Density Profile from Hierarchical Clustering Julio F. Navarro 1 Steward Observatory, University of Arizona, Tucson, AZ, 85721, USA. Carlos S. Frenk 2 Physics Department, University of Durham,
We have reanalyzed a data set of 99 low redshift (z < 0:1) Abell clusters. studied previously by Rhee, van Haarlem & Katgert (1989), and determined
 Abell clusters. studied previously by Rhee, van Haarlem & Katgert (1989), and determined") Mon. Not. R. Astron. Soc. 000, 1{36 (1994) The Shapes of Galaxy Clusters Pascal A.M. de Theije, Peter Katgert & Eelco van Kampen Sterrewacht Leiden, P.O.Box 9513, 2300 RA Leiden Received 00 January 1994;
Mon. Not. R. Astron. Soc. 000, 1{36 (1994) The Shapes of Galaxy Clusters Pascal A.M. de Theije, Peter Katgert & Eelco van Kampen Sterrewacht Leiden, P.O.Box 9513, 2300 RA Leiden Received 00 January 1994;
SUPPLEMENTARY INFORMATION
 University of Groningen Direct observation of the spin-dependent Peltier effect Flipse, J.; Bakker, F. L.; Slachter, A.; Dejene, F. K.; van Wees, Bart Published in: Nature Nanotechnology DOI: 10.1038/NNANO.2012.2
System theory and system identification of compartmental systems Hof, Jacoba Marchiena van den
 University of Groningen System theory and system identification of compartmental systems Hof, Jacoba Marchiena van den IMPORTANT NOTE: You are advised to consult the publisher's version (publisher's PDF)
Citation for published version (APA): Wang, Y. (2018). Disc reflection in low-mass X-ray binaries. [Groningen]: Rijksuniversiteit Groningen.
![Citation for published version (APA): Wang, Y. (2018). Disc reflection in low-mass X-ray binaries. [Groningen]: Rijksuniversiteit Groningen.](/thumbs/95/126078116.jpg "Citation for published version (APA): Wang, Y. (2018). Disc reflection in low-mass X-ray binaries. [Groningen]: Rijksuniversiteit Groningen.") University of Groningen Disc reflection in low-mass X-ray binaries Wang, Yanan IMPORTANT NOTE: You are advised to consult the publisher's version (publisher's PDF) if you wish to cite from it. Please check
University of Groningen Disc reflection in low-mass X-ray binaries Wang, Yanan IMPORTANT NOTE: You are advised to consult the publisher's version (publisher's PDF) if you wish to cite from it. Please check
arxiv:astro-ph/ v1 27 Nov 2000
 A&A manuscript no. (will be inserted by hand later) Your thesaurus codes are: 02 (3.13.18) - methods: N-body simulations ASTRONOMY AND ASTROPHYSICS The mass of a halo Martin White arxiv:astro-ph/0011495v1
Citation for published version (APA): Shen, C. (2006). Wave Propagation through Photonic Crystal Slabs: Imaging and Localization. [S.l.]: s.n.
![Citation for published version (APA): Shen, C. (2006). Wave Propagation through Photonic Crystal Slabs: Imaging and Localization. [S.l.]: s.n.](/thumbs/95/124821987.jpg "Citation for published version (APA): Shen, C. (2006). Wave Propagation through Photonic Crystal Slabs: Imaging and Localization. [S.l.]: s.n.") University of Groningen Wave Propagation through Photonic Crystal Slabs Shen, Chuanjian IMPORTANT NOTE: You are advised to consult the publisher's version (publisher's PDF) if you wish to cite from it.
University of Groningen Wave Propagation through Photonic Crystal Slabs Shen, Chuanjian IMPORTANT NOTE: You are advised to consult the publisher's version (publisher's PDF) if you wish to cite from it.
AST1100 Lecture Notes
 AST1100 Lecture Notes 4 Stellar orbits and dark matter 1 Using Kepler s laws for stars orbiting the center of a galaxy We will now use Kepler s laws of gravitation on much larger scales. We will study
astro-ph/ v2 8 Nov 1996
 LARGE-SCALE POWER-SPECTRUM FROM PECULIAR VELOCITIES Tsafrir Kolatt 1;2 and Avishai Dekel 2 1 Harvard-Smithsonian Center for Astrophysics, 60 Garden st., Cambridge, MA 02138. tsafrir@cfa.harvard.edu astro-ph/9512132
This week at Astro Lecture 06, Sep 13, Pick up PE#6. Please turn in HW#2. HW#3 is posted
 This week at Astro 3303 Lecture 06, Sep 13, 2017 Pick up PE#6 Please turn in HW#2 HW#3 is posted Today: Introduction to galaxy photometry Quantitative morphology Elliptical galaxies Reading: Continue reading
University of Groningen. Water in protoplanetary disks Antonellini, Stefano
 University of Groningen Water in protoplanetary disks Antonellini, Stefano IMPORTANT NOTE: You are advised to consult the publisher's version (publisher's PDF) if you wish to cite from it. Please check
The Role of Dissipation in Spheroid Formation
 The Role of Dissipation in Spheroid Formation Philip Hopkins 4/08/08 Lars Hernquist, TJ Cox, John Kormendy, Tod Lauer, Suvendra Dutta, Dusan Keres, Volker Springel Ellipticals & Bulges: Formation in Mergers?
Components of Galaxies: Dark Matter
 Components of Galaxies: Dark Matter Dark Matter: Any Form of matter whose existence is inferred solely through its gravitational effects. -B&T, pg 590 Nature of Major Component of Universe Galaxy Formation
University of Groningen. Hollow-atom probing of surfaces Limburg, Johannes
 University of Groningen Hollow-atom probing of surfaces Limburg, Johannes IMPORTANT NOTE: You are advised to consult the publisher's version (publisher's PDF) if you wish to cite from it. Please check
Princeton December 2009 The fine-scale structure of dark matter halos
 Princeton December 2009 The fine-scale structure of dark matter halos Simon White Max Planck Institute for Astrophysics The dark matter structure of CDM halos A rich galaxy cluster halo Springel et al
astro-ph/ Aug 1995
 THE KINEMATICS OF EMISSION-LINE GALAXIES IN CLUSTERS FROM ENACS A. Biviano 1, P. Katgert 1, A. Mazure 2, M. Moles 3, R. den Hartog 1, P. Focardi 4 astro-ph/958149 31 Aug 1995 1 Sterrewacht Leiden, The
ASTR 610 Theory of Galaxy Formation Lecture 18: Disk Galaxies
 ASTR 610 Theory of Galaxy Formation Lecture 18: Disk Galaxies Frank van den Bosch Yale University, spring 2017 The Structure & Formation of Disk Galaxies In this lecture we discuss the structure and formation
The origin of lopsidedness in galaxies
 The Galaxy Disk in Cosmological Context Proceedings IAU Symposium No. xxx, 2008 c 2008 International Astronomical Union J. Andersen (Chief Editor), J. Bland-Hawthorn & B. Nordström, eds. The origin of
University of Groningen. Statistical Auditing and the AOQL-method Talens, Erik
 University of Groningen Statistical Auditing and the AOQL-method Talens, Erik IMPORTANT NOTE: You are advised to consult the publisher's version (publisher's PDF) if you wish to cite from it. Please check
University of Groningen. Laser Spectroscopy of Trapped Ra+ Ion Versolato, Oscar Oreste
 University of Groningen Laser Spectroscopy of Trapped Ra+ Ion Versolato, Oscar Oreste IMPORTANT NOTE: You are advised to consult the publisher's version (publisher's PDF) if you wish to cite from it. Please
Cosmological Perturbation Theory
 Cosmological Perturbation Theory! Martin Crocce! Institute for Space Science, Barcelona! Cosmology School in Canary Islands, Fuerteventura 18/09/2017 Why Large Scale Structure? Number of modes in CMB (temperature)
{ 2{ disks. The calculated distribution of disk properties also suggests that there are large numbers of galaxies which remain undetected due to biase
 The Formation of Disk Galaxies Julianne J. Dalcanton 1;2 Observatories of the Carnegie Institution of Washington, 813 Santa Barbara Street, Pasadena CA, 91101 ' Princeton University Observatory, Princeton,
Dependence of the inner dark matter profile on the halo mass
 Mon. Not. R. Astron. Soc. 344, 1237 1249 (2003) Dependence of the inner dark matter profile on the halo mass Massimo Ricotti Institute of Astronomy, Madingley Road, Cambridge CB3 0HA Accepted 2003 June
Citation for published version (APA): Hoefman, M. (1999). A study of coherent bremsstrahlung and radiative capture s.n.
: Hoefman, M. (1999). A study of coherent bremsstrahlung and radiative capture s.n.") University of Groningen A study of coherent bremsstrahlung and radiative capture Hoefman, Marieke IMPORTANT NOTE: You are advised to consult the publisher's version (publisher's PDF) if you wish to cite
University of Groningen A study of coherent bremsstrahlung and radiative capture Hoefman, Marieke IMPORTANT NOTE: You are advised to consult the publisher's version (publisher's PDF) if you wish to cite
cluster scaling relations and mass definitions
 cluster scaling relations and mass definitions Andrey Kravtsov Department of Astronomy & Astrophysics Kavli Institute for Cosmological Physics The University of Chicago Abell 85 SDSS Abell 85 SDSS/ Abell
AS1001:Extra-Galactic Astronomy
 AS1001:Extra-Galactic Astronomy Lecture 5: Dark Matter Simon Driver Theatre B spd3@st-andrews.ac.uk http://www-star.st-and.ac.uk/~spd3 Stars and Gas in Galaxies Stars form from gas in galaxy In the high-density
Scaling Relations of late-type galaxies
 Scaling Relations of late-type galaxies - an observational perspective - Lecture I Lecture II Trends along the Hubble sequence Galaxy rotation curves Lecture III Tully-Fisher relations Marc Verheijen Kapteyn
Citation for published version (APA): Kootstra, F. (2001). Time-dependent density functional theory for periodic systems s.n.
: Kootstra, F. (2001). Time-dependent density functional theory for periodic systems s.n.") University of Groningen Time-dependent density functional theory for periodic systems Kootstra, Freddie IMPORTANT NOTE: You are advised to consult the publisher's version (publisher's PDF) if you wish
University of Groningen Time-dependent density functional theory for periodic systems Kootstra, Freddie IMPORTANT NOTE: You are advised to consult the publisher's version (publisher's PDF) if you wish
Kinetic Theory. Motivation - Relaxation Processes Violent Relaxation Thermodynamics of self-gravitating system
 Kinetic Theory Motivation - Relaxation Processes Violent Relaxation Thermodynamics of self-gravitating system negative heat capacity the gravothermal catastrophe The Fokker-Planck approximation Master
distribution of mass! The rotation curve of the Galaxy ! Stellar relaxation time! Virial theorem! Differential rotation of the stars in the disk
 Today in Astronomy 142:! The local standard of rest the Milky Way, continued! Rotation curves and the! Stellar relaxation time! Virial theorem! Differential rotation of the stars in the disk distribution
Galaxy structures described by ECE theory
 1 Galaxy structures described by ECE theory Horst Eckardt A.I.A.S Alpha Institute for Advanced Study (www.aias.us) Abstract Some graphical work is presented to understand how the structure of galaxies
The cosmic distance scale
 The cosmic distance scale Distance information is often crucial to understand the physics of astrophysical objects. This requires knowing the basic properties of such an object, like its size, its environment,
Citation for published version (APA): Sok, R. M. (1994). Permeation of small molecules across a polymer membrane: a computer simulation study s.n.
: Sok, R. M. (1994). Permeation of small molecules across a polymer membrane: a computer simulation study s.n.") University of Groningen Permeation of small molecules across a polymer membrane Sok, Robert Martin IMPORTANT NOTE: You are advised to consult the publisher's version (publisher's PDF) if you wish to cite
University of Groningen Permeation of small molecules across a polymer membrane Sok, Robert Martin IMPORTANT NOTE: You are advised to consult the publisher's version (publisher's PDF) if you wish to cite
Binary star formation
 Binary star formation So far we have ignored binary stars. But, most stars are part of binary systems: Solar mass stars: about 2 / 3 are part of binaries Separations from: < 0.1 au > 10 3 au Wide range
SEMIANALYTICAL DARK MATTER HALOS AND THE JEANS EQUATION
 The Astrophysical Journal, 634:756 774, 2005 December 1 # 2005. The American Astronomical Society. All rights reserved. Printed in U.S.A. SEMIANALYTICAL DARK MATTER HALOS AND THE JEANS EQUATION Crystal
Linear Regression and Its Applications
 Linear Regression and Its Applications Predrag Radivojac October 13, 2014 Given a data set D = {(x i, y i )} n the objective is to learn the relationship between features and the target. We usually start
Peptide folding in non-aqueous environments investigated with molecular dynamics simulations Soto Becerra, Patricia
 University of Groningen Peptide folding in non-aqueous environments investigated with molecular dynamics simulations Soto Becerra, Patricia IMPORTANT NOTE: You are advised to consult the publisher's version
Modified Dark Matter: Does Dark Matter Know about the Cosmological Constant?
 Modified Dark Matter: Does Dark Matter Know about the Cosmological Constant? Douglas Edmonds Emory & Henry College (moving to Penn State, Hazleton) Collaborators Duncan Farrah Chiu Man Ho Djordje Minic
arxiv:astro-ph/ v1 14 Nov 2003
 **TITLE** ASP Conference Series, Vol. **VOLUME***, **YEAR OF PUBLICATION** **NAMES OF EDITORS** The visible matter dark matter coupling arxiv:astro-ph/0311348v1 14 Nov 2003 Renzo Sancisi Osservatorio Astronomico,
Surface Brightness of Spiral Galaxies
 Surface Brightness of Spiral Galaxies M104: SA N4535: SAB LMC: dwarf irregular,barred Normal 1/4-law+exp fits An example of surface brightness profile. The top curve is the sum of exp disk+1/4-bulge. The
A5682: Introduction to Cosmology Course Notes. 11. CMB Anisotropy
 Reading: Chapter 8, sections 8.4 and 8.5 11. CMB Anisotropy Gravitational instability and structure formation Today s universe shows structure on scales from individual galaxies to galaxy groups and clusters
Galaxy Bias from the Bispectrum: A New Method
 Galaxy Bias from the Bispectrum: A New Method Jennifer E. Pollack University of Bonn Thesis Supervisor: Cristiano Porciani Collaborator: Robert E. Smith Motivation 1) Main Objective of state-of-the-art
University of Groningen. Extraction and transport of ion beams from an ECR ion source Saminathan, Suresh
 University of Groningen Extraction and transport of ion beams from an ECR ion source Saminathan, Suresh IMPORTANT NOTE: You are advised to consult the publisher's version (publisher's PDF) if you wish
ASTR 610 Theory of Galaxy Formation Lecture 15: Galaxy Interactions
 ASTR 610 Theory of Galaxy Formation Lecture 15: Galaxy Interactions Frank van den Bosch Yale University, spring 2017 Galaxy Interactions & Transformations In this lecture we discuss galaxy interactions
The Formation and Evolution of Galaxy Clusters
 IAU Joint Discussion # 10 Sydney, July, 2003 The Formation and Evolution of Galaxy Clusters Simon D.M. White Max Planck Institute for Astrophysics The WMAP of the whole CMB sky Bennett et al 2003 > 105
Splashback radius as a physical boundary of clusters
 Splashback radius as a physical boundary of clusters Andrey Kravtsov Department of Astronomy & Astrophysics Kavli Institute for Cosmological Physics The University of Chicago Abell 85 SDSS/ Chandra galaxy
Galaxies: Structure, Dynamics, and Evolution. Elliptical Galaxies (II)
") Galaxies: Structure, Dynamics, and Evolution Elliptical Galaxies (II) Layout of the Course Feb 5: Review: Galaxies and Cosmology Feb 12: Review: Disk Galaxies and Galaxy Formation Basics Feb 19: Disk Galaxies
Galaxies: Structure, Dynamics, and Evolution Elliptical Galaxies (II) Layout of the Course Feb 5: Review: Galaxies and Cosmology Feb 12: Review: Disk Galaxies and Galaxy Formation Basics Feb 19: Disk Galaxies
Chapter 9. Cosmic Structures. 9.1 Quantifying structures Introduction
 Chapter 9 Cosmic Structures 9.1 Quantifying structures 9.1.1 Introduction We have seen before that there is a very specific prediction for the power spectrum of density fluctuations in the Universe, characterised
Survey of Astrophysics A110
 Goals: Galaxies To determine the types and distributions of galaxies? How do we measure the mass of galaxies and what comprises this mass? How do we measure distances to galaxies and what does this tell
R. K. Sheth, H. J. Mo & G. Tormen collapses at time z if the initial overdensity within it exceeds a critical value, sc(z). This critical value depend
. This critical value depend") Mon. Not. R. Astron. Soc. 000, 000{000 (0000) Printed July 1999 (MN LATEX style le v1.4) Ellipsoidal collapse and an improved model for the number and spatial distribution of dark matter haloes Ravi K.
Mon. Not. R. Astron. Soc. 000, 000{000 (0000) Printed July 1999 (MN LATEX style le v1.4) Ellipsoidal collapse and an improved model for the number and spatial distribution of dark matter haloes Ravi K.
Massimo Meneghetti 1, Elena Torri 1, Matthias Bartelmann 2, Lauro Moscardini 3, Elena Rasia 1 and Giuseppe Tormen 1,
 Mem. S.A.It. Vol. 73, 23 c SAIt 2002 Memorie della! "$# %&'()*+,(+ -. Massimo Meneghetti 1, Elena Torri 1, Matthias Bartelmann 2, Lauro Moscardini 3, Elena Rasia 1 and Giuseppe Tormen 1, 1 Dipartimento
The Los Cabos Lectures
 January 2009 The Los Cabos Lectures Dark Matter Halos: 2 Simon White Max Planck Institute for Astrophysics EPS statistics for the standard ΛCDM cosmology Millennium Simulation cosmology: Ωm = 0.25, ΩΛ
The physical origin of stellar envelopes around globular clusters
 The physical origin of stellar envelopes around globular clusters Phil Breen University of Edinburgh in collaboration with A. L. Varri, J. Peñarrubia and D. C. Heggie Current observational evidence Example:
ABSTRACT To determine the actual HI distribution and the velocity eld in the outermost disk of the spiral galaxy M33, a tilted-ring model is tted to 2
 A WARPED DISK MODEL FOR M33 AND THE 21-cm LINE WIDTH IN SPIRAL GALAXIES Edvige Corbelli 1 and Stephen E. Schneider 2 Preprint n. 26/96 1 Osservatorio Astrosico di Arcetri, Largo E. Fermi 5, I-50125 Firenze
Clusters: Observations
 Clusters: Observations Last time we talked about some of the context of clusters, and why observations of them have importance to cosmological issues. Some of the reasons why clusters are useful probes
pseudo- evolution of halo mass and observable-mass relations Andrey Kravtsov The University of Chicago
 pseudo- evolution of halo mass and observable-mass relations Andrey Kravtsov The University of Chicago Baseline model for cluster scaling relations Kaiser 1986, 1991 If mass is defined within a spherical
The Caustic Technique An overview
 The An overview Ana Laura Serra Torino, July 30, 2010 Why the mass of? Small scales assumption of dynamical equilibrium Mass distribution on intermediate scales (1 10 Mpc/h) Large scales small over densities
Galaxy interaction and transformation
 Galaxy interaction and transformation Houjun Mo April 13, 2004 A lot of mergers expected in hierarchical models. The main issues: The phenomena of galaxy interaction: tidal tails, mergers, starbursts When
astro-ph/ Jul 94
 Mon. Not. R. Astron. Soc. 000, 000{000 (1994) The Two-Point Correlation Function of Rich Clusters of Galaxies: Results From An Extended APM Cluster Redshift Survey G. B. Dalton 1, R. A. C. Croft 1, G.
Kinematics of the Solar Neighborhood
 Chapter 15 Kinematics of the Solar Neighborhood Unlike an elliptical galaxy, the Milky Way rotates with a speed much larger than the random velocities of typical stars. Our position inside the disk of
Lecture 7: the Local Group and nearby clusters
 Lecture 7: the Local Group and nearby clusters in this lecture we move up in scale, to explore typical clusters of galaxies the Local Group is an example of a not very rich cluster interesting topics include:
The Wave Nature of Matter Causes Quantization *
 OpenStax-CNX module: m60855 1 The Wave Nature of Matter Causes Quantization * OpenStax Physics with Courseware Based on The Wave Nature of Matter Causes Quantization by OpenStax This work is produced by
arxiv:astro-ph/ v1 20 Nov 1996
 PASJ: Publ. Astron. Soc. Japan 48,?? (2018) Mass of the Galaxy Inferred from Outer Rotation Curve Mareki Honma and Yoshiaki Sofue Institute of Astronomy, University of Tokyo, 2-21-1 Osawa, Mitaka, Tokyo,
THE BOLSHOI COSMOLOGICAL SIMULATIONS AND THEIR IMPLICATIONS
 GALAXY FORMATION - Durham -18 July 2011 THE BOLSHOI COSMOLOGICAL SIMULATIONS AND THEIR IMPLICATIONS JOEL PRIMACK, UCSC ΛCDM Cosmological Parameters for Bolshoi and BigBolshoi Halo Mass Function is 10x
Ensenada March 2008 Galaxy halos at (very) high resolution
 high resolution") Ensenada March 2008 Galaxy halos at (very) high resolution Simon White & Mark Vogelsberger Max Planck Institute for Astrophysics Milky Way halo seen in DM annihilation radiation Aquarius simulation: N200
Ensenada March 2008 Galaxy halos at (very) high resolution Simon White & Mark Vogelsberger Max Planck Institute for Astrophysics Milky Way halo seen in DM annihilation radiation Aquarius simulation: N200
University of Groningen. Statistical inference via fiducial methods Salomé, Diemer
 University of Groningen Statistical inference via fiducial methods Salomé, Diemer IMPORTANT NOTE: You are advised to consult the publisher's version (publisher's PDF) if you wish to cite from it. Please
Dark Matter Halos. They will have a large impact on galaxies
 Dark Matter Halos Dark matter halos form through gravitational instability. Density perturbations grow linearly until they reach a critical density, after which they turn around from the expansion of the
Cooling, dynamics and fragmentation of massive gas clouds: clues to the masses and radii of galaxies and clusters
 of massive gas and radii of M. Rees, J. Ostriker 1977 March 5, 2009 Talk contents: The global picture The relevant theory Implications of the theory Conclusions The global picture Galaxies and have characteristic
Citation for published version (APA): Andogah, G. (2010). Geographically constrained information retrieval Groningen: s.n.
: Andogah, G. (2010). Geographically constrained information retrieval Groningen: s.n.") University of Groningen Geographically constrained information retrieval Andogah, Geoffrey IMPORTANT NOTE: You are advised to consult the publisher's version (publisher's PDF) if you wish to cite from
University of Groningen Geographically constrained information retrieval Andogah, Geoffrey IMPORTANT NOTE: You are advised to consult the publisher's version (publisher's PDF) if you wish to cite from
astro-ph/ Oct 93
 Mon. Not. R. Astron. Soc. 000, 000{000 (1993) The Correlation Function of Rich Clusters of Galaxies in CDM-like Models R. A. C. Croft and G. Efstathiou Department of Physics, University of Oxford, Keble
p(z)
") Chapter Statistics. Introduction This lecture is a quick review of basic statistical concepts; probabilities, mean, variance, covariance, correlation, linear regression, probability density functions and
Chapter Statistics. Introduction This lecture is a quick review of basic statistical concepts; probabilities, mean, variance, covariance, correlation, linear regression, probability density functions and
Galaxy Luminosity Function. Galaxy Luminosity Function. Schechter Function. Schechter Function by environment. Schechter (1976) found that
 found that") Galaxy Luminosity Function Count the number of galaxies as a function of luminosity (or absolute magnitude) Useful for: Understanding galaxy formation (distribution by luminosity implies distribution by
Galaxy Luminosity Function Count the number of galaxies as a function of luminosity (or absolute magnitude) Useful for: Understanding galaxy formation (distribution by luminosity implies distribution by
The fine-scale structure of dark matter halos
 COSMO11, Porto, August 2011 The fine-scale structure of dark matter halos Simon White Max-Planck-Institute for Astrophysics COSMO11, Porto, August 2011 Mark Vogelsberger The fine-scale structure of dark
Mergers between elliptical galaxies and the thickening of the Fundamental Plane
 Mon. Not. R. Astron. Soc. 342, L36 L40 (2003) Mergers between elliptical galaxies and the thickening of the Fundamental Plane A. C. González-García and T. S. van Albada Kapteyn Astronomical Institute,
Dark Matter Detection Using Pulsar Timing
 Dark Matter Detection Using Pulsar Timing ABSTRACT An observation program for detecting and studying dark matter subhalos in our galaxy is propsed. The gravitational field of a massive object distorts
by considering a galactic disk as consisting of a collection of concentric spinning rings, able to tilt with respect to each other, and moving in the
 Interactions between massive dark halos and warped disks Konrad Kuijken Kapteyn Institute, PO Box 800, 9700 AV Groningen, The Netherlands Abstract. The normal mode theory for warping of galaxy disks, in
Journal Club Presentation on The BIMA Survey of Nearby Galaxies. I. The Radial Distribution of CO Emission in Spiral Galaxies by Regan et al.
 Journal Club Presentation on The BIMA Survey of Nearby Galaxies. I. The Radial Distribution of CO Emission in Spiral Galaxies by Regan et al. ApJ, 561:218-237, 2001 Nov 1 1 Fun With Acronyms BIMA Berkely
The dark and visible matter content of low surface brightness disk galaxies Blok, W. J. G. de; McGaugh, S. S.
 University of Groningen The dark and visible matter content of low surface brightness disk galaxies Blok, W. J. G. de; McGaugh, S. S. Published in: The Astrophysical Journal IMPORTANT NOTE: You are advised
astro-ph/ Jan 1995
 UTAP-96/95 January, 995 WEAKLY NONLINEAR EVOLUTION OF TOPOLOGY OF LARGE-SCALE STRUCTURE Takahiko Matsubara Department of Physics, The University of Tokyo Tokyo,, Japan and Department of Physics, Hiroshima
Two Phase Formation of Massive Galaxies
 Two Phase Formation of Massive Galaxies Focus: High Resolution Cosmological Zoom Simulation of Massive Galaxies ApJ.L.,658,710 (2007) ApJ.,697, 38 (2009) ApJ.L.,699,L178 (2009) ApJ.,725,2312 (2010) ApJ.,744,63(2012)
Galaxy Formation! Lecture Seven: Galaxy Formation! Cosmic History. Big Bang! time! present! ...fluctuations to galaxies!
 Galaxy Formation Lecture Seven: Why is the universe populated by galaxies, rather than a uniform sea of stars? Galaxy Formation...fluctuations to galaxies Why are most stars in galaxies with luminosities