ViaLactea. The Milky Way as a Star Formation Engine. OACN Team. A. Mercurio. G. Riccio S. Cavuoti M. Brescia
|
|
|
- Collin Benson
- 5 years ago
- Views:
Transcription


1 ViaLactea The Milky Way as a Star Formation Engine OACN Team A. Mercurio G. Riccio S. Cavuoti M. Brescia

")
")
2 OATS The entire project is led by IAPS (S. Molinari) Duration: 3 years (10/ /2016) IAPS OACN OACT

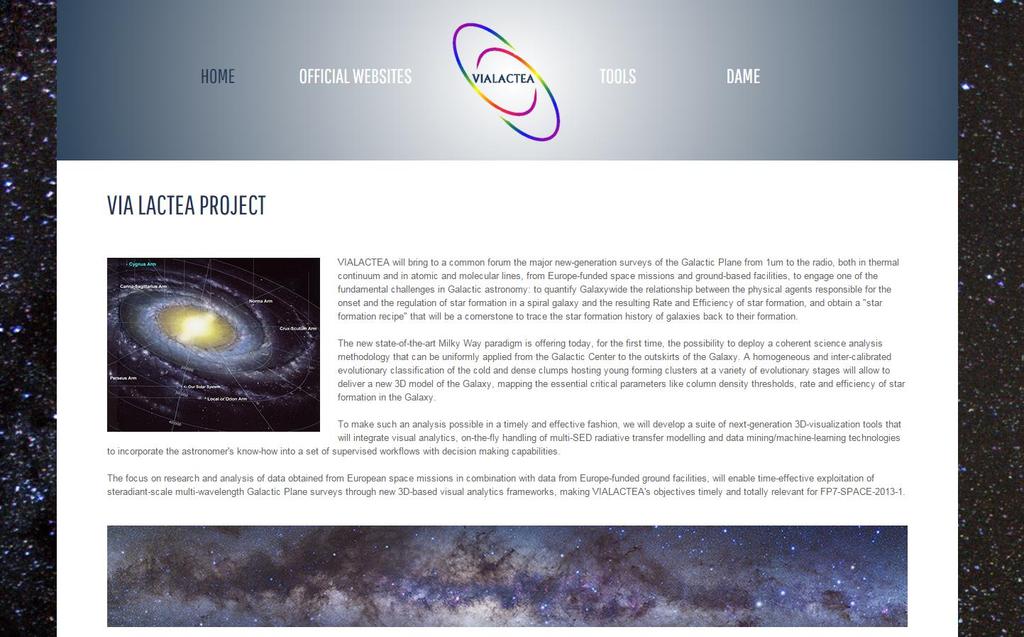
3 The goal is to exploit the combination of all the new-generation Infrared Radio surveys of the Galactic Plane from space missions and ground-based facilities, using a novel data and science analysis paradigm based on 3D visual analytics and data mining framework, to build and deliver a quantitative 3D model of our VIALACTEA Galaxy as a star formation engine that will be used as a template for external galaxies and study star formation across the cosmic time
4 Identify the critical parameters that make star formation different: Spontaneous/triggered Filaments or no filaments? Depending on the Galaxy position w.r.t. spiral arms etc. understand if & how the mix of the ingredients conspire to determine a global SF law
5 Measure the star formation rate and history Galaxy-wide; Formation and fragmentation of Filamentary Molecular Clouds; Determining the relative importance of global vs local, spontaneous vs triggering, agents that give rise to star formation; Understanding star formation laws and the nature of thresholds as a function of ISM properties across a full range of galacto-centric radii metallicity and environmental conditions; Build bottom-up recipes and prescriptions useful for Xgal science.
6

7

8 NIR UKIDSS: J, H, K VISTA: K Mid-IR GLIMPSE: 3.6, 4.5, 5.8, 8.0 [µ] WISE: [3 25] [µ] MIPSGAL: 24 [µ] Far-IR Hi-GAL: 70, 160, 250, 350, 500 [µ] Sub-mm continuum ATLASGAL: 870 [µ] JCMT: 870 [µ] Near-IR, mid-ir and far-ir from Herschel, Spitzer and WISE γ-ray imaging survey by AGILE and FermiLAT Ground facilities: VISTA, JCMT, UKIRT and APEX, FCRAO, NANTEN2, VLA, Parkes, Effelsberg Molecular and atomic line surveys GRS: 13 CO at 21 cm IGPS Radio continuum CORNISH: 5 [GHz] (completed by Spitzer in the mid-ir and focusing on GLIMPSE region) MAGPIS: [ ] [GHz] (overlaps with MIPSGAL, GLIMPSE, ATLASGAL etc ) Molecular Masers Methanol Multi-Beam Survey (MMB): 5 cm methanol maser emission
9 Hosted by OACN MS4


10 Most of the first FTE has been spent to find a common language among members How astronomers see astroinformaticians How astroinformaticians see astronomers with doubtful but promising results

11 Compact source identification through band-merging Q-FULLTREE method design and development done; Q-FULLTREE method debug and preliminary test done; Q-FULLTREE scientific validation in progress; Interaction with OACT+OATS infrastructures for integration and test in progress; Filamentary structure Edge Detection FilExSeC method design and development done; FilExSeC method debug and preliminary test done; FilExSeC scientific validation with IAPS in progress; Started design & development of other methods; Compact source distance estimation design and preliminary study in progress; Started preliminary interaction with IAPS for Knowledge Base definition; Star Forming source evolutionary classification Started design and preliminary study; Started interaction with IAPS for Knowledge Base definition; Bubble structures classification Started interaction with OACT for Knowledge Base definition;

12

13

14
 has been run over the entire Galactic plane. The -71 < l < 67.")
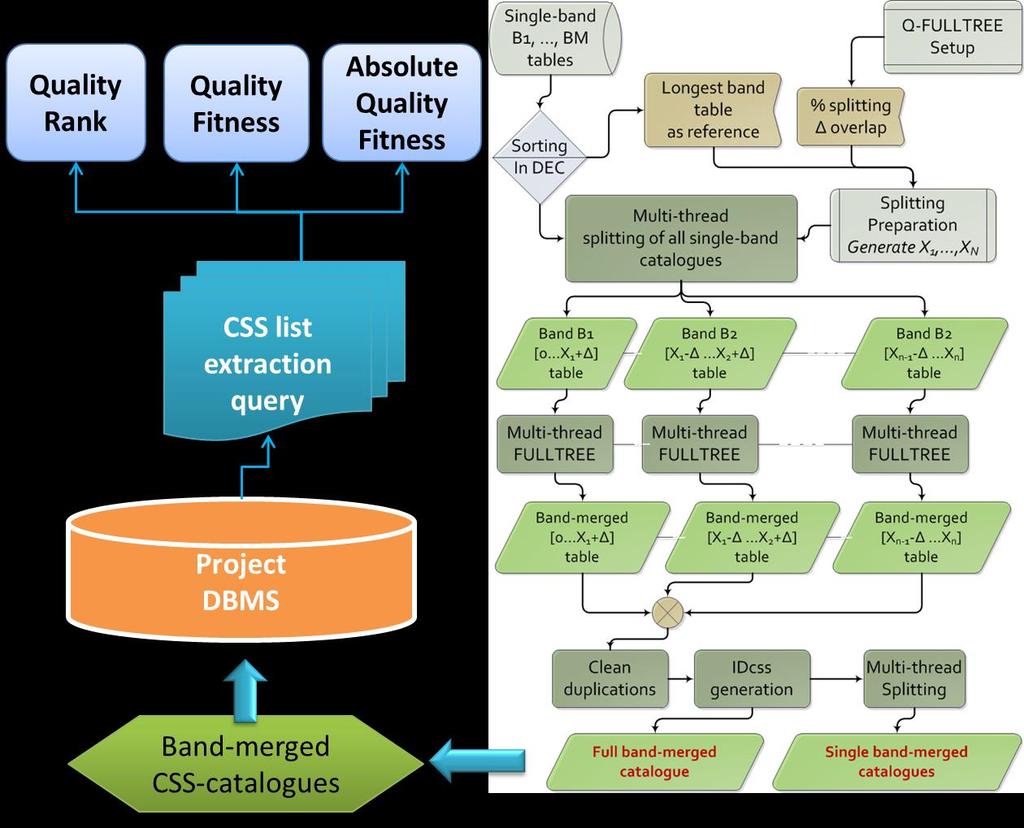
15 Task 1: Compact Source Extraction and band-merging Hi-GAL Source extraction and photometry Band-merging with ancillary information (from near-ir to radio) 70µm 160µm 250µm 350µm The source extraction with CuTEx (Molinari et al., 2010a) has been run over the entire Galactic plane. The -71 < l < 67.5 portion of the HERSHEL/Hi-GAL photometry lists should be band-merged, filtered and complemented with distances and ancillary photometry : MIPSGAL, UKIDSS, WISE, MSX; ATLASGAL, BGPS 500µm A first result from OACN of a band-merged catalogue using a data-mining approach has been implemented for the Herschel bands Captures and maintains multiple counterpart associations; Topological quality flagging; Ingested into a VO-like database so that complex queries are possible; Interfaced with Visualization tools; Massively based on multi-threading parallelization.

16 The data mining approach, named FULLTRE-E (Full Tree on Ellipse), is based on the positional cross-match among sources at different wavelengths, by always respecting the order relationship imposed by spatial resolution. the FULLTRE-E method stores all partial/full bandmerging candidate matches, in order to avoid any loss of potential information, by focusing its action to the assignment of quality flags and a score to each candidate match. x 2 1 Ell x a b bi, x 2 bj 1 candidate match found a and b are the two semi-axes of the ellipse (calculated upon the two given values of FWHM of the source, centre of the ellipse) x and y are the coordinates of the higher resolution counterpart (opportunely corrected by the position angle variation) x bi, x bj a match between two-band sources 2 + y2

![] Merit Score MS CSS = MS x b1, x b2,, x bm = NE TNE NE i=1 CL i Quality Rank QR QR = 1 to the max(ms1, MS2, MS3) QR = 2 to the second higher value](/docs-images/91/105558482/images/17-3.jpg "among MS1, MS2 and QR = 3 to the min(ms1, MS2, MS3) Quality Fitness QF CSS = MS(CSS) N k=1 MS(CSS K ) if exists a CSS j x bi such that QF(CSS j ) > 0.")
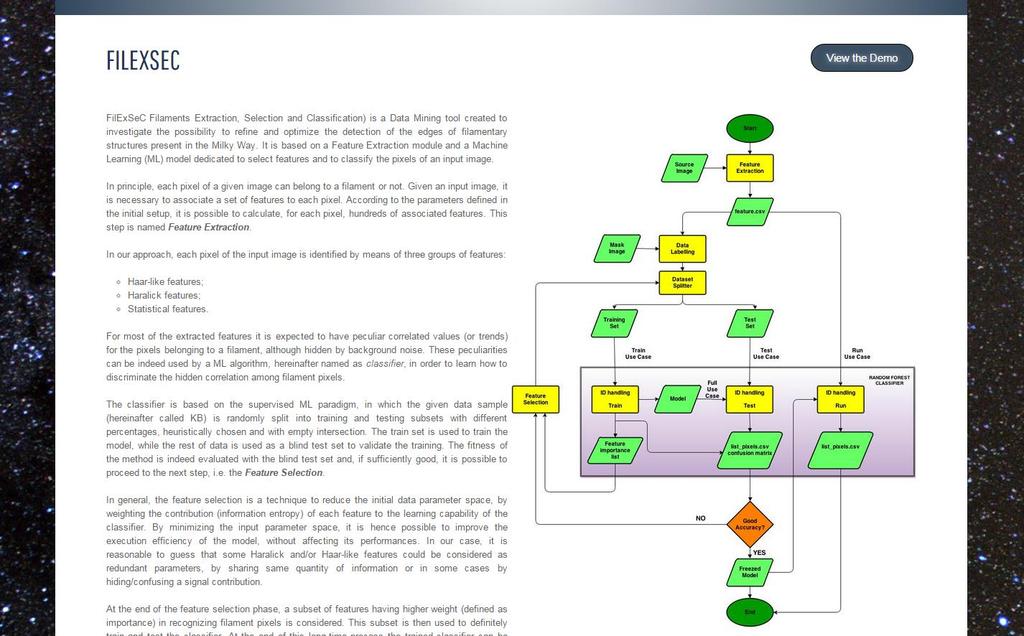
17 x 2 a 2 + y2 b 2 1 Ell x bi, x bj 1 candidate match found CSS = x b1, x b2,, x bm x b1, x b2, x b2, x b3, x b1, x b3,, x bm 1, x bm. Confidence Level CL x bi, x bj = 1 Ell x bi, x bj number of elliptical matches NE Theoretical NE TNE= M 2 = M! CL terms 2! [ M 2!] Merit Score MS CSS = MS x b1, x b2,, x bm = NE TNE NE i=1 CL i Quality Rank QR QR = 1 to the max(ms1, MS2, MS3) QR = 2 to the second higher value among MS1, MS2 and QR = 3 to the min(ms1, MS2, MS3) Quality Fitness QF CSS = MS(CSS) N k=1 MS(CSS K ) if exists a CSS j x bi such that QF(CSS j ) > 0. 5, then AQF CSS j else AQF CSS j = 0 j = 1 N = 1
")
 5 bands: on a bi-cpu 1.6GHz, 16 cores: 27 days 3.3 hours On a quad-cpu 2.4GHz, 32 cores: 23 days 1.")
18 The wrapping system built around the original FULLTREE module is designed to improve the computing performance of the entire band-merging tool. Based on: Split %: the percentage of splitting used to generate sub-tables of the input singleband catalogues; Δ overlap: the quantity of overlap (in arcmin) around which to replicate catalogue entries in the sub-tables; Pivot band: the reference band related to the longest single-band catalogue. Worst gain in speedup: 200x (mostly higher) 5 bands: on a bi-cpu 1.6GHz, 16 cores: 27 days 3.3 hours On a quad-cpu 2.4GHz, 32 cores: 23 days 1.3 hours On CT cluster (1 CPU 2.4 GHz, 12 cores): 29 days 3,15 hours

19


20 The information provided by the Q-FULLTREE output as a starting point of a workflow in which information coming from different analysis modules could be correlated to improve the overall knowledge


21 FULLTREE-CSS-catalogue main bandmerged source catalogue Example of a full match (5 Hi-GAL bands, from 500µ to 70µ) In the light-blue sub-table all the intermediate CSS found are shown


22 MS = ELL500
23 ELL500 70B 70A 250A 250B 500 Example of 3 CSS with 3-band matches CSS 1 = A-70A MS 1 = 2.12 QR 1 = 1 QF 1 = 0.44 CSS 2 = B-70A MS 2 = 0,65 QR 2 = 3 QF 2 = 0.14 CSS 3 = B-70B MS 3 = 2,01 QR 3 = 2 QF 3 = B 70A


24 ELL500 70B 70A 250A 250B 500 Example of 3 CSS with 3-band matches CSS 1 = A-70A MS 1 = 2.12 QR 1 = 1 QF 1 = 0.44 CSS 2 = B-70A MS 2 = 0,65 QR 2 = 3 QF 2 = 0.14 CSS 3 = B-70B MS 3 = 2,01 QR 3 = 2 QF 3 = B 70A
25 Example of 3 CSS with 3-band matches 70B CSS 1 = A-70A ELL B MS 1 = 2.12 QR 1 = 1 QF 1 = A 250A 500 X? CSS 2 = B-70A MS 2 = 0,65 QR 2 = 3 QF 2 = 0.14 CSS 3 = B-70B MS 3 = 2,01 QR 3 = 2 QF 3 = 0.42? AQF = 0 250B 70A
26

27 Task 1: Filamentary structure detection Production of column density maps of entire galactic plane Automated filament extraction workflow for Hi- GAL survey Column density maps with the identified filaments The filament extraction code was run on the column density maps covering the region between Galactic longitude , with different threshold levels equal to 2.5, 3. and 3.5 times the local standard deviation of the minimum eigenvalue (Schisano et al., 2014) OACN Data Mining goal: To refine the edges; To extend filament regions. The right calculation of physical quantities related to filaments strongly depends on their dimensions, so the correct definition of edges is crucial.

28 FilExSeC (Filaments Extraction, Selection and Classification), a data mining tool to refine and optimize the detection of the edges of filamentary structures. The method consists in two main phases: Feature Extraction: a set of features depending by its neighbors is associated to each pixel of the input image Classification: image pixels are classified as filamentary or background, by using a supervised Machine Learning method, trained by these features A further phase, Feature Selection, finds the most relevant features. By reducing the initial data parameter space, it is possible indeed to improve the execution efficiency of the model, without affecting its performances.
29 Given an input image, it is possible to characterize each pixel by means of a set of features. 3 types of features are extracted for each pixel: Haralick features (Haralick, 1979); Haar-like features (Viola & Jones, 2001); Statistical features. For most of the extracted features it is expected to have peculiar correlated values (or trends) for the pixels belonging to a filament, although hidden by background noise. These peculiarities can be indeed used by a ML algorithm in order to learn how to discriminate the hidden correlation among filament pixels
 Contrast m = (i j) 2 C i,j i j Energy i j 2 C i,j Entropy C i,j log C i,j i j Correlation i j (i μ i )(j μ j")
30 Haralick Features (1979) Based on co-occurrence matrix (GLCM) Element C i,j represents, for a fixed distance and direction, the probability to have two pixels in the image at that distance, with grey level Z i and Z j, respectively Haralick features extracted from C i,j /(number of pairs) Contrast m = (i j) 2 C i,j i j Energy i j 2 C i,j Entropy C i,j log C i,j i j Correlation i j (i μ i )(j μ j )C i,j σ i σ j Robert Haralick

31 Paul Viola used templates Haar-like Features (2001) Each Haar-like variable involves 2 or 3 interconnected black and white rectangles (masks or templates) Values of each feature are obtained by sliding masks on the image and calculating: Statistical Features For each pixel, the following features are calculated in a centered window: gradients (horizontal, vertical, main diagonal, secondary diagonal) Mean, standard deviation, skewness, kurtosis, entropy, range Moreover, the pixel value is considered as a Statistical Feature too

32 Leo Breiman Random Forest Classifier (2001) The classifier prefigures 3 use cases: Train: the classifier is trained to discriminate between filamentary and background pixels; Test: the classifier is evaluated by a blind test dataset; Run: the trained and validated classifier is used on new real images.
 to reduce the parameter space, by weighting the contribution carried by each feature to the")
 in recognizing filament pixels is considered.")
33 Mark A. Hall Feature Selection (Backward Elimination 1999) to reduce the parameter space, by weighting the contribution carried by each feature to the learning capability of the classifier. So it is possible to improve the execution efficiency of the model, without affecting its performances. At the end of this phase, a subset of features having higher weight (defined as importance) in recognizing filament pixels is considered. This subset is then used to definitely train and test the classifier with new training and testing subsets. Tests revealed that Haralick features are useless
34 Main Output: A CSV table Pixel identification id, row, column Statistical features Haar-like features Haralick features Pixel Value Output 1 filament 0 background Confirmed Filament Pixels Undetected Filament Pixels CFP UFP pixels correctly recognized as belonging to a filament pixels of filaments classified as background Confusion Matrix: Pixels grouped in 4 categories New Filament Pixels NFP background pixels classified as belonging to a filament Confirmed Background Pixels CBP background pixels correctly recognized Importance Feature Importance pixels in terms of importance Index Statistical + Haar-like Haralick

35 In order to evaluate FilExSeC, several tests have been performed. They have been useful to: evaluate the robustness of the method; evaluate the performances of the algorithm; optimize Input Image the parameters settings. Test have been performed by: Varying the number and type of features: Haralick yes/no Pixel value yes/no Stats yes/no Different Haar-like templates Different settings of Haralick, Haar-like and Statistical windows Varying the configuration of the classifier Different number of trees of the Random Forest (1000 or 10000) Using different datasets: Lupus region; Hi-GAL strips; Using different ratios for Train and Test set
36 EXP DATA FEATURE EXTRACTION RANDOM FOREST FILAMENT STATISTICS BACKGROUND STATISTICS TRAIN TEST HARALICK HAAR-LIKE STAT SETUP PURITY COMPLETENESS DICE PURITY COMPLETENESS DICE ID name % name % windows template windows windows trees max depth min split min leaf % % % % % % T1a lupusiii 15 lupusiii 85 5x5, 7x7, 9x9 9x9 to 24x24 5x5, 7x7, 9x none T1b lupusiii 30 lupusiii 70 5x5, 7x7, 9x9 9x9 to 24x24 5x5, 7x7, 9x none T1c lupusiii 60 lupusiii 40 5x5, 7x7, 9x9 9x9 to 24x24 5x5, 7x7, 9x none T2 lupusiii 100 lupusi 100 5x5, 7x7, 9x9 9x9 to 24x24 5x5, 7x7, 9x none T3a lupusi 100 lupusiii 100 5x5, 7x7, 9x9 9x9 to 24x none T3b lupusiii 100 lupusi 100 5x5, 7x7, 9x9 9x9 to 24x none T4 lupusiii 100 lupusi 100 5x5, 7x7, 9x9 9x9 to 24x24 5x5, 7x7, 9x none T5 lupusi 100 lupusiii 100 5x5, 7x7, 9x9 9x9 to 24x24 5x5, 7x7, 9x none T6a Hi-GAL Hi-GAL x5, 7x7, 9x9 9x9 to 24x24 5x5, 7x7, 9x none ,24 21,93 34,72 98,32 99,90 99,11 T6b Hi-GAL Hi-GAL x5, 7x7, 9x9 9x9 to 24x24 5x5, 7x7, 9x none ,85 20,71 33,14 98,11 99,90 99,00 T6c Hi-GAL Hi-GAL x5, 7x7, 9x9 9x9 to 24x24 5x5, 7x7, 9x none ,00 38,53 46,62 98,18 99,20 98,69 T6d Hi-GAL Hi-GAL x5, 7x7, 9x9 9x9 to 24x24 5x5, 7x7, 9x none ,24 36,87 45,45 97,98 99,18 98,58 T7a lupusi 100 lupusiii 100 9x9 to 24x24 3x3, 5x5, 7x7, 9x none ,32 54,66 65,37 98,54 99,59 99,07 T7b lupusi 100 lupusiii 100 2x2 to 24x24 5x5, 7x7, 9x none ,23 55,64 66,37 98,58 99,61 99,09 T7c lupusi 100 lupusiii 100 2x2 to 24x24 3x3, 5x5, 7x7, 9x none ,73 56,94 67,45 98,62 99,61 99,11 T8a Hi-GAL 60 Hi-GAL 40 5x5, 7x7, 9x9 9x9 to 24x24 5x5, 7x7, 9x none T8b Hi-GAL 80 Hi-GAL 20 5x5, 7x7, 9x9 9x9 to 24x24 5x5, 7x7, 9x none T9a Hi-GAL 80 Hi-GAL 20 2x2 to 24x24 3x3, 5x5, 7x7, 9x none ,41 43,00 57,86 98,49 99,85 99,16 T9b Hi-GAL 80 Hi-GAL 20 1x1 to 24x24 3x3, 5x5, 7x7, 9x none ,52 43,62 58,45 98,49 99,85 99,16 T9c Hi-GAL 80 Hi-GAL 20 2x2 to 24x24 1x1, 3x3, 5x5, 7x7, 9x none ,59 44,98 59,89 98,52 99,86 99,19 T9d Hi-GAL 80 Hi-GAL 20 1x1 to 24x24 1x1, 3x3, 5x5, 7x7, 9x none ,39 44,88 54,80 98,54 99,86 99,19 T10a Hi-GAL Hi-GAL all * 1x1, 3x3, 5x5, 7x7, 9x none ,88 43,75 57,74 98,78 99,83 99,30 T10b Hi-GAL Hi-GAL all * 1x1, 3x3, 5x5, 7x7, 9x none ,12 42,63 56,81 98,63 99,82 99,22 T10c Hi-GAL Hi-GAL all * 1x1, 3x3, 5x5, 7x7, 9x none ,67 51,82 60,85 98,57 99,45 99,01 T10d Hi-GAL Hi-GAL all * 1x1, 3x3, 5x5, 7x7, 9x none ,62 49,64 58,97 98,39 99,40 98,89 T11 lupusi 100 lupusiii 100 all * 1x1, 3x3, 5x5, 7x7, 9x none ,41 63,88 73,09 98,83 99,65 99,24 T12a HI-GAL 100 HI-GAL all * T12b HI-GAL 100 HI-GAL all * T12c HI-GAL 100 HI-GAL all * 1x1, 3x3, 5x5, 7x7, 9x10 1x1, 3x3, 5x5, 7x7, 9x10 1x1, 3x3, 5x5, 7x7, 9x none none none ,08 54,14 61,47 96,80 98,44 97, ,06 71,14 60,12 98,06 95,7 96, ,21 72,70 60,78 98,05 95,38 96,69
37 Type Parameters Features Max. Num. Name Template Values Black rectangle from 2x2 to dimensions 24x24 Black rectangle from 2x4 to dimensions 12x24 Haar-like Haralick Statistical Number of black rectangles 1-2 Black rectangle from 1 to 24 dimensions d =1,2,3,4 directions = 0, 45, 90, 135 windows = 5x5 7x7 9x9 windows = 3x3 5x5 7x7 9x9 windows = 1x1 Difference between black and white rectangles Contrast, Energy, Entropy, Correlation Gradients (vertical, horizontal, diagonal) Mean Std Skewness - Kurtosis Entropy Range Pixel Value

38 Lupus I Lupus I Mask Lupus region Sub-region I & III Tests T1 T2 T3 T4 T5 T7 T11 Lupus III Lupus III Mask

39 Column density map (250µ) of Hi-GAL deg region: 2973x1001 pixels Tests T6 T8 T9 T10 T12 (as Train set)
 of Hi-GAL")


40 Column density map (250µ) of Hi-GAL deg region Tests T12 (as Test sets) Hi-GAL Hi-GAL Hi-GAL
 of Hi-GAL")


41 Column density map (250µ) of Hi-GAL deg region Tests T12 (as Test sets) Hi-GAL Mask Hi-GAL Mask Hi-GAL Mask
42 Test T2: Lupus III Training Lupus I Test Test T5: Lupus I Training Lupus III Test Same Features Train/Test dataset inverted LupusI T2 T2/T5 TEST FIL BG purity T2 61% 99% T5 77% 98% completeness T2 67% 98% T5 50% 100% DICE T2 64% 99% T5 61% 99% Performances depend on the train image quality. The results confirm the capability to extend the filament pixel regions LupusIII T5 CFP NFP CBP UFP purity = CFP CFP + NFP completeness = DICE = CFP CFP + UFP 2 purity complet. purity + complet.

43 Test T3a: Lupus I Training Lupus III Test Statistical Features Excluded CFP NFP CBP UFP T3a FIL BG Purity 48% 98% Completeness 29% 99% DICE 36% 98% LupusIII Without statistical features the performances strongly decrease. Haar-like + Haralick give a lower contribute
44 FEATURE EXTRACTION HAAR-LIKE STATISTICAL HARALICK ID tmpl windows windows PIXEL T5 Y 9x9 to 24x24 5x5, 7x7, 9x9 N T7c N 2x2 to 24x24 3x3, 5x5, 7x7, 9x9 N T11 N all 2x2 to 24x24 3x3, 5x5, 7x7, 9x9 Y T5 T11 T7c T5 T7c T11 FIL (%) BG (%) FIL (%) BG (%) FIL (%) BG (%) Purity ,41 98,83 Complet ,88 99,65 DICE ,09 99,24
45 Test image: T12a (Hi-GAL ) Training image (Hi-GAL 224)
 T12a FIL BG Purity")

46 Test image: T12a (Hi-GAL ) T12a FIL BG Purity 71.08% 96.80% Completeness 54.14% 98.44% DICE 61.47% 97.61%
47 Test image: T12b (Hi-GAL ) Training image (Hi-GAL 224)
 T12b FIL BG Purity")

48 Test image: T12b (Hi-GAL ) T12b FIL BG Purity 52.06% 98.06% Completeness 71.14% 95.70% DICE 60.12% 96.86%
49 Test image: T12c (Hi-GAL ) Training image (Hi-GAL 224)

50 Test image: T12c (Hi-GAL ) T12c FIL BG Purity 52.21% 98.05% Completeness 72.70% 95.38% DICE 60.78% 96.69%
51 Robustness of the method The features mostly contributing to classification are always the same, regardless of the datasets; Comparing tests on the same region by slightly varying training set, the results show extremely low % of background detection difference (always < 0.5%) and of filament (max 6.75%) High Performances Global efficiency grows up by choosing a more realistic training set; High capability to identify additional filament pixels with respect to the traditional method. However, a certain number of very little filamentary structures was not recognized, by confusing them as background Best Configuration Haralick features are useless All Haar-like templates needed with rectangles size up to 24x24 Windows for Statistical features 3x3 5x5 7x7 9x9 Pixel value is very important A low number of trees is sufficient for the best classification (1000 trees) Next step is to verify, together with IAPS astronomers, the results obtained by FilExSeC from a physical point of view, by calculating, for example, the variation of filament s mass function by adding the new filament pixels found

52 The main limitation of FilExSec is that it works with masks obtained by traditional methods. This causes a bias on our performances. It is necessary to find a method directly working on original images without any priors At this time, we are under investigation on new edge detectors: Boosted Edge Learning (Dollar et al. 2006) gpb (global Probability of boundary) (Arbelaez et al. 2011) Beam-curve Pyramid based edge detector (Alpert et al. 2010) Curvelets and Wavelets (Starck et al and Mallat 1998) Fuzzy Logic Edge Detectors (Becerikli et al. 2005) Canny and Sobel filters enhancement (Canny 1986 and Sobel 2014)


53 Original image Intermediate mask Traditional thresholding gradients Filament detection Filament optimization FilExSeC To combine different filament detection methods to improve the global performances OR Other methods Other methods Other methods Other method
54
55
56 An evolutionary classification tool for ViaLactea, will catalogue clumps in terms of the evolutionary stage and mass regime of the ongoing star formation. There are two components that need to be developed at the foundation of the classification tool: 1. an evolutionary classification toolbox 2. a set of star-forming clumps in known stages of evolution to be used as a training/test-set for machine-learning algorithms...and adopt some kind of evolutionary scheme Data-mining approaches to source classification Weak Gated Classification We know nothing about the sources evolutionary stage; Identify over-densities in the given parameter space (e.g., built on the evolutionary toolbox, plus any other available evidence); Data are then grouped into clusters: groups of data entries sharing common but a priori unknown correlations among parameter space features. Supervised Classification For a subsample of points, its category/class is well known; Need order of 10 3 objects to be used as a training set; Balanced population of classes in the training set.

57 Luminosity/mass diagram IR color distribution Mass/radius relationship Association with masers Association with radio continuum Outflow indicators YSO IR-color spatial association Others? ambiguity Quiescent / pre-stellar SF clumps source class prediction Knowledge Base Proto-stellar Hot molecular cores Ultra-compact HII regions Evolved HII regions Train set Validation set Test set Fuzzy/cross-entropy


58 Luminosity/mass diagram IR color distribution Mass/radius relationship Association with masers Association with radio continuum Outflow indicators YSO IR-color spatial association Others? ambiguity Quiescent / pre-stellar SF clumps source class prediction Knowledge Base Proto-stellar Hot molecular cores Ultra-compact HII regions Evolved HII regions Train set Validation set Test set Fuzzy/cross-entropy

59
VIALACTEA: the Milky Way as a Star Formation Engine
 Giuseppe Riccio 1, Ugo Becciani 2, Massimo Brescia 1, Robert Butora 3, Stefano Cavuoti 1, Alessandro Costa 2, Anna Maria Di Giorgio 4, Akos Hajnal 5, Gabor Hermann 5, Peter Kacsuk 5, Istvan Marton 5, Amata
protostelle, classe 0, caratterizzate da un'intensa emissione alle lunghezze della radiazione submillimetrica, che però diviene molto debole a λ<10 µm
 Data Mining protostelle, classe 0, caratterizzate da un'intensa emissione alle lunghezze della radiazione submillimetrica, che però diviene molto debole a λ
Fragmentation in Hi-GAL clumps
 Fragmentation in Hi-GAL clumps Davide Elia M. Pestalozzi, S. Molinari, S. Pezzuto, E. Schisano, A.M. Di Giorgio ALMA Cycle 2 Proposal Fragmentation in Hi-GAL clumps (ID 2013.1.01193) Pestalozzi, M., Busquet,
Global star formation in the Milky Way from the VIALACTEA Project
 IRAS 100µm 47 > l > 36 Global star formation in the Milky Way from the VIALACTEA Project S. Molinari INAF/IAPS, Rome IAPS, Arcetri, Catania, Univ. Salento, Napoli, Trieste D. Elia, A.M. Di Giorgio, M.
Filamentary Structures in the Galactic Plane Morphology, Physical conditions and relation with star formation
 Background: Column Density Map from Herschel Observation of Galactic Plane Hi-GAL project - field centered at (l,b) )=(224,0 ) Filamentary Structures in the Galactic Plane Morphology, Physical conditions
The Red MSX Source Survey. Massive Star Formation in the Milky Way. Stuart Lumsden University of Leeds
 The Red MSX Source Survey Massive Star Formation in the Milky Way Stuart Lumsden University of Leeds RMS Team: Melvin Hoare, Rene Oudmaijer, Heather Cooper, Ben Davies (Leeds) Joe Mottram (Exeter) James
An evolutionary sequence for high-mass stars formation
 Introduction Results & Conclusions Summary An evolutionary sequence for high-mass stars formation Andrea Giannetti Dipartimento di Astronomia, Università di Bologna; Istituto di Radioastronomia In collaboration
ATLASGAL: APEX Telescope Large Area Survey of the Galaxy
 ATLASGAL: APEX Telescope Large Area Survey of the Galaxy MPG/Germany: F. Schuller (PI), K. Menten, F. Wyrowski (MPIfR), H. Beuther, T. Henning, H. Linz, P. Schilke ESO countries: M. Walmsley (co-pi), S.
Star Formation & the FIR properties of Infrared Dark Clouds in the Hi-GAL Science Demonstration Field. Mark Thompson and the Hi-GAL Consortium
 Star Formation & the FIR properties of Infrared Dark Clouds in the Hi-GAL Science Demonstration Field Mark Thompson and the Hi-GAL Consortium Infrared Dark Clouds Cold dense clouds seen in extinction against
Galactic plane surveys: What have/will we learn(ed)? Henrik Beuther
? Henrik Beuther") Galactic plane surveys: What have/will we learn(ed)? Henrik Beuther M51 The Whirlpool Galaxy Blue: PAWS CO Red: THINGS HI Colors: multi-color HST Courtesy: T.A. Rector High-mass stars: Strong impact on
Galactic plane surveys: What have/will we learn(ed)? Henrik Beuther M51 The Whirlpool Galaxy Blue: PAWS CO Red: THINGS HI Colors: multi-color HST Courtesy: T.A. Rector High-mass stars: Strong impact on
Energy Sources of the Far IR Emission of M33
 Energy Sources of the Far IR Emission of M33 Hinz, Reike et al., ApJ 154: S259 265 (2004). Presented by James Ledoux 24 µm 70 µm 160 µm Slide 1 M33 Properties Distance 840kpc = 2.7 Mlyr (1'' ~ 4 pc) Also
Machine Learning Methods for Radio Host Cross-Identification with Crowdsourced Labels
 Machine Learning Methods for Radio Host Cross-Identification with Crowdsourced Labels Matthew Alger (ANU), Julie Banfield (ANU/WSU), Cheng Soon Ong (Data61/ANU), Ivy Wong (ICRAR/UWA) Slides: http://www.mso.anu.edu.au/~alger/sparcs-vii
Photometric Redshifts with DAME
 Photometric Redshifts with DAME O. Laurino, R. D Abrusco M. Brescia, G. Longo & DAME Working Group VO-Day... in Tour Napoli, February 09-0, 200 The general astrophysical problem Due to new instruments
Machine Learning Applications in Astronomy
 Machine Learning Applications in Astronomy Umaa Rebbapragada, Ph.D. Machine Learning and Instrument Autonomy Group Big Data Task Force November 1, 2017 Research described in this presentation was carried
Star Formation. Answering Fundamental Questions During the Spitzer Warm Mission Phase
 Star Formation Answering Fundamental Questions During the Spitzer Warm Mission Phase Lori Allen CfA John Carpenter, Caltech Lee Hartmann, University of Michigan Michael Liu, University of Hawaii Tom Megeath,
Anatomy of the S255-S257 complex - Triggered high-mass star formation
 Proceedings Title IAU Symposium Proceedings IAU Symposium No. IAUS237, 2006 A.C. Editor, B.D. Editor & C.E. Editor, eds. c 2006 International Astronomical Union DOI: 00.0000/X000000000000000X Anatomy of
RAMPS: The Radio Ammonia Mid-Plane Survey. James Jackson Institute for Astrophysical Research Boston University
 RAMPS: The Radio Ammonia Mid-Plane Survey James Jackson Institute for Astrophysical Research Boston University High Frequency Workshop, Green Bank, 21 September 2015 Collaborators (partial list) Taylor
SKINAKAS OBSERVATORY. Astronomy Projects for University Students PROJECT GALAXIES
 PROJECT 7 GALAXIES Objective: The topics covered in the previous lessons target celestial objects located in our neighbourhood, i.e. objects which are within our own Galaxy. However, the Universe extends
SOFIA follow-ups of high-mass clumps from the ATLASGAL galactic plane survey
 SOFIA follow-ups of high-mass clumps from the ATLASGAL galactic plane survey Friedrich Wyrowski, Rolf Güsten, Karl Menten, Helmut Wiesemeyer, Timea Csengeri, Carsten König, Silvia Leurini & James Urquhart
A100 Exploring the Universe: The Milky Way as a Galaxy. Martin D. Weinberg UMass Astronomy
 A100 Exploring the Universe: The Milky Way as a Galaxy Martin D. Weinberg UMass Astronomy astron100-mdw@courses.umass.edu November 12, 2014 Read: Chap 19 11/12/14 slide 1 Exam #2 Returned and posted tomorrow
Infall towards massive star forming regions
 Infall towards massive star forming regions Friedrich Wyrowski, Rolf Güsten, Karl Menten, Helmut Wiesemeyer & Bernd Klein MPIfR Bonn 1 Outline Infall is a fundamental process in SF! ATLASGAL Infall in
Chapter 15 The Milky Way Galaxy. The Milky Way
 Chapter 15 The Milky Way Galaxy The Milky Way Almost everything we see in the night sky belongs to the Milky Way We see most of the Milky Way as a faint band of light across the sky From the outside, our
The Radio Galaxy Zoo Data Release 1: classifications for 75,589 sources
 The Radio Galaxy Zoo Data Release 1: classifications for 75,589 sources O. Ivy Wong & Radio Galaxy Zoo Team ICRAR/University of Western Australia SPARCS VII the precursors awaken, 19 July 2017 1 All-sky
Astroinformatics in the data-driven Astronomy
 Astroinformatics in the data-driven Astronomy Massimo Brescia 2017 ICT Workshop Astronomy vs Astroinformatics Most of the initial time has been spent to find a common language among communities How astronomers
Real Astronomy from Virtual Observatories
 THE US NATIONAL VIRTUAL OBSERVATORY Real Astronomy from Virtual Observatories Robert Hanisch Space Telescope Science Institute US National Virtual Observatory About this presentation What is a Virtual
Lecture 23 Internal Structure of Molecular Clouds
 Lecture 23 Internal Structure of Molecular Clouds 1. Location of the Molecular Gas 2. The Atomic Hydrogen Content 3. Formation of Clouds 4. Clouds, Clumps and Cores 5. Observing Molecular Cloud Cores References
Reduced data products in the ESO Phase 3 archive (Status: 02 August 2017)
") Reduced data products in the ESO Phase 3 archive (Status: 02 August 2017) The ESO Phase 3 archive provides access to reduced and calibrated data products. All these data are stored in standard formats
Reduced data products in the ESO Phase 3 archive (Status: 02 August 2017) The ESO Phase 3 archive provides access to reduced and calibrated data products. All these data are stored in standard formats
Analysis of Evolutionary Trends in Astronomical Literature using a Knowledge-Discovery System: Tétralogie
 Library and Information Services in Astronomy III ASP Conference Series, Vol. 153, 1998 U. Grothkopf, H. Andernach, S. Stevens-Rayburn, and M. Gomez (eds.) Analysis of Evolutionary Trends in Astronomical
Tracing Star Formation in the Milky Way Galaxy with Infrared Bubbles
 The Milky Way Project: Tracing Star Formation in the Milky Way Galaxy with Infrared Bubbles Sarah Kendrew (MPIA, Heidelberg) + The Zooniverse, Milky Way Project Science Team and 35,000+ Users Galactic
GMC as a site of high-mass star formation
 ALMA Image: N159W GMC as a site of high-mass star formation From galaxy evolution to individual star formation kpc 1-100pc GMCs: 10 4-10 6 Mo n(h 2 ) ~ 1000cm -3 Clumps, Cores 10 2-10 3 Mo n(h 2 ) ~ >10
Rick Ebert & Joseph Mazzarella For the NED Team. Big Data Task Force NASA, Ames Research Center 2016 September 28-30
 NED Mission: Provide a comprehensive, reliable and easy-to-use synthesis of multi-wavelength data from NASA missions, published catalogs, and the refereed literature, to enhance and enable astrophysical
The Planck Catalogue of Galactic Cold Clumps
 The Planck Catalogue of Galactic Cold Clumps L. Montier on behalf of the Cold Core Project I Overview History of the PGCC 2007: First meeting about the detection method 2009: First internal release with
Terahertz (THz) Astronomy from Antarctica. New opportunities for groundbreaking science
 Astronomy from Antarctica. New opportunities for groundbreaking science") Terahertz (THz) Astronomy from Antarctica New opportunities for groundbreaking science The Life Cycle of matter in the Galaxy remains poorly understood. some UV, X-rays 21 cm radio???? visible light infrared
Terahertz (THz) Astronomy from Antarctica New opportunities for groundbreaking science The Life Cycle of matter in the Galaxy remains poorly understood. some UV, X-rays 21 cm radio???? visible light infrared
ESO Phase 3 Data Release Description. Data Collection ATLASGAL Release Number 1 Data Provider
 ESO Phase 3 Data Release Description Data Collection ATLASGAL Release Number 1 Data Provider Frederic Schuller, K. Immer, Y. Contreras, T. Csengeri, J. S. Urquhart Date 19.01.2016 Abstract The APEX Telescope
A cooperative approach among methods for photometric redshifts estimation
 A cooperative approach among methods for photometric redshifts estimation Stefano Cavuoti 1, Massimo Brescia 1, Giuseppe Longo 2, Valeria Amaro 2, Civita Vellucci 2 1 INAF - Observatory of Capodimonte,
Milky Way SKA: the ISM, star formation and stellar evolution with the SKA. Mark Thompson, Grazia Umana, and the Our Galaxy SWG
 Milky Way SKA: the ISM, star formation and stellar evolution with the SKA Mark Thompson, Grazia Umana, and the Our Galaxy SWG Uncovering the ecology of baryons Graphic courtesy Naomi McClure- Griffiths
High Redshift Universe
 High Redshift Universe Finding high z galaxies Lyman break galaxies (LBGs) Photometric redshifts Deep fields Starburst galaxies Extremely red objects (EROs) Sub-mm galaxies Lyman α systems Finding high
VISTA HEMISPHERE SURVEY DATA RELEASE 1
 Release date (will be set by ESO) VISTA HEMISPHERE SURVEY DATA RELEASE 1 PROPOSAL ESO No.: 179.A-2010 PRINCIPAL INVESTIGATOR: Richard McMahon Authors: R. McMahon, M. Banerji, N. Lodieu for the VHS Collaboration
Analyzing Spiral Galaxies Observed in Near-Infrared
 Analyzing Spiral Galaxies Observed in Near-Infrared Preben Grosbøl European Southern Observatory Karl-Schwarzschild-Str. 2, D-85748 Garching, Germany Abstract A sample of 54 spiral galaxies was observed
Learning theory. Ensemble methods. Boosting. Boosting: history
 Learning theory Probability distribution P over X {0, 1}; let (X, Y ) P. We get S := {(x i, y i )} n i=1, an iid sample from P. Ensemble methods Goal: Fix ɛ, δ (0, 1). With probability at least 1 δ (over
The Ṁass- loss of Red Supergiants
 The Ṁass- loss of Red Supergiants Dr. Donald F. Figer Director, Center for Detectors Speaker: Yuanhao (Harry) Zhang RIT 9/12/13 1 9/12/13 2 Outline IntroducJon MoJvaJon Objects Method Need for SOFIA/FORCAST
Multi-wavelength study of the Milky Way Galaxy
 29 th ASI Meeting ASI Conference Series, 2011, Vol. 3, pp 79 83 Edited by Pushpa Khare & C. H. Ishwara-Chandra Multi-wavelength study of the Milky Way Galaxy Shashikiran Ganesh Physical Research Laboratory,
MIT Invitational, Jan Astronomy C. 2. You may separate the pages, but do not forget to put your team number at the top of all answer pages.
 MIT Invitational, Jan 2019 Astronomy C Competitors: School name: Team number: INSTRUCTIONS 1. Please turn in all materials at the end of the event. 2. You may separate the pages, but do not forget to put
Multi-wavelength analysis of Hickson Compact Groups of Galaxies.
 Multi-wavelength analysis of Hickson Compact Groups of Galaxies. Thodoris Bitsakis Department of Physics, University of Crete Paper: Bitsakis T., Charmandaris V., da Cunha E., Diaz-Santos T., Le Floc h
The JCMT Legacy Survey
 The JCMT Legacy Survey Surveying the Milky Way in the Submillimetre Antonio Chrysostomou (JAC) and the JCMT Legacy Survey teams Outline Quick Introduction of JCMT and its instrumentation HARP/ACSIS SCUBA-2
A100H Exploring the Universe: Discovering Galaxies. Martin D. Weinberg UMass Astronomy
 A100H Exploring the Universe: Discovering Galaxies Martin D. Weinberg UMass Astronomy astron100h-mdw@courses.umass.edu April 05, 2016 Read: Chap 19 04/05/16 slide 1 Exam #2 Returned by next class meeting
The SKYGRID Project A Calibration Star Catalog for New Sensors. Stephen A. Gregory Boeing LTS. Tamara E. Payne Boeing LTS. John L. Africano Boeing LTS
 The SKYGRID Project A Calibration Star Catalog for New Sensors Stephen A. Gregory Boeing LTS Tamara E. Payne Boeing LTS John L. Africano Boeing LTS Paul Kervin Air Force Research Laboratory POSTER SESSION
Protoclusters in the Milky Way: Physical properties of massive starless & star-forming clumps from the BGPS. Brian Svoboda (Arizona)
") Protoclusters in the Milky Way: Physical properties of massive starless & star-forming clumps from the BGPS Brian Svoboda (Arizona) Cygnus X in BGPS & WISE Image Credit: Adam Ginsburg Y. Shirley (Arizona)
Protoclusters in the Milky Way: Physical properties of massive starless & star-forming clumps from the BGPS Brian Svoboda (Arizona) Cygnus X in BGPS & WISE Image Credit: Adam Ginsburg Y. Shirley (Arizona)
The Milky Way Laboratory. Cara Battersby Harvard-Smithsonian Center for Astrophysics
 The Milky Way Laboratory Cara Battersby Harvard-Smithsonian Center for Astrophysics The Milky Way Laboratory Figure Credit: NASA / JPL-Caltech / R. Hurt (SSC-Caltech) The Milky Way Laboratory 1. What is
Star Formation. Spitzer Key Contributions to Date
 Star Formation Answering Fundamental Questions During the Spitzer Warm Mission Phase Lori Allen CfA John Carpenter, Caltech Lee Hartmann, University of Michigan Michael Liu, University of Hawaii Tom Megeath,
Tricks of Resolution and Dynamics
 Tricks of Resolution and Dynamics A disk-like object that isn t: IRAS 23033+5951 Brenda Matthews (HIA/NRC, Canada) Michael Reid (CfA/McMaster) Reid & Matthews, 2007, submitted to ApJ Motivation: Understanding
Accretion Disks. Review: Stellar Remnats. Lecture 12: Black Holes & the Milky Way A2020 Prof. Tom Megeath 2/25/10. Review: Creating Stellar Remnants
 Lecture 12: Black Holes & the Milky Way A2020 Prof. Tom Megeath Review: Creating Stellar Remnants Binaries may be destroyed in white dwarf supernova Binaries be converted into black holes Review: Stellar
Earliest phases of high mass star formation in the Galactic Plane
 Earliest phases of high mass star formation in the Galactic Plane Sarolta Zahorecz Konkoly Observatory PhD student at ELTE, Hungary + at ESO, Germany In collaboration with: Viktor Toth (ELTE) Izaskun Jimenez-Serra
Planck and Virtual Observatories: Far Infra-red / Sub-mm Specificities
 JF Sygnet (Planck HFI DPCM) Planck and Virtual Observatories: Far Infra-red / Sub-mm Specificities Planck Mission, Planck Data and its Specificities (4) Data Treatment and its Specificities (4) Planck
Massively Star-Forming Dusty Galaxies. Len Cowie JCMT Users Meeting
 Massively Star-Forming Dusty Galaxies Len Cowie JCMT Users Meeting The luminous dusty star-formation history: We are using SCUBA-2 to address three questions What fraction of the SF is in luminous dusty
Revealing the Large Scale Distribution of Star Formation in the Milky Way with WISE
 Revealing the Large Scale Distribution of Star Formation in the Milky Way with WISE Xavier Koenig Yale University WISE @ 5 Conference Feb 11 2015 Collaborators: David Leisawitz Debbie Padgett Luisa Rebull
Understanding the tracers of star formation
 Understanding the tracers of star formation Kazi Rygl (ESA-ESTEC) Cygnus X region, HOBYS (F. Motte, M. Hennemann)/Herschel/ESA 22 Jan 2015, Bologna Overview Evolutionary phases of star formation Age determinations:
Astr 5465 Feb. 5, 2018 Kinematics of Nearby Stars
 Astr 5465 Feb. 5, 2018 Kinematics of Nearby Stars Properties of Nearby Stars Most in orbit with the Sun around Galactic Center Stellar Kinematics Reveal Groups of Stars with Common Space Motion (Moving
The Superbubble Power Problem: Overview and Recent Developments. S. Oey
 The Superbubble Power Problem: Overview and Recent Developments S. Oey It has been known for decades that superbubbles generated by massive star winds and supernovae are smaller than expected based on
R. D. Gehrz a E. E. Becklin b, and Göran Sandell b
 Infrared Spectroscopic Studies with the Stratospheric Observatory for Infrared Astronomy (SOFIA) a E. E. Becklin b, and Göran Sandell b a University of Minnesota b Universities Space Research Association
The International Galactic Plane Survey (IGPS)
") The International Galactic Plane Survey (IGPS) A Comprehensive View of the Galactic Interstellar Medium Charles Kerton - NRC Canada - HIA - DRAO The structure and evolution of a galaxy is controlled by
The International Galactic Plane Survey (IGPS) A Comprehensive View of the Galactic Interstellar Medium Charles Kerton - NRC Canada - HIA - DRAO The structure and evolution of a galaxy is controlled by
Infrared Dark Clouds seen by Herschel and ALMA
 Infrared Dark Clouds seen by Herschel and ALMA Ke Wang ESO Fellow www.eso.org/~kwang Collaborators: Qizhou Zhang, Xing (Walker) Lu, Izaskun Jimenez-Serra 1 IR-dark clouds: shadows in infrared sky Image
Galaxies. Need a (physically) meaningful way of describing the relevant properties of a galaxy.
 meaningful way of describing the relevant properties of a galaxy.") Galaxies Aim to understand the characteristics of galaxies, how they have evolved in time, and how they depend on environment (location in space), size, mass, etc. Need a (physically) meaningful way of
Galaxies Aim to understand the characteristics of galaxies, how they have evolved in time, and how they depend on environment (location in space), size, mass, etc. Need a (physically) meaningful way of
NRAO Instruments Provide Unique Windows On Star Formation
 NRAO Instruments Provide Unique Windows On Star Formation Crystal Brogan North American ALMA Science Center Atacama Large Millimeter/submillimeter Array Expanded Very Large Array Robert C. Byrd Green Bank
19.3 The History of the Milky Way. Our goals for learning: What clues to our galaxy's history do halo stars hold? How did our galaxy form?
 19.3 The History of the Milky Way Our goals for learning: What clues to our galaxy's history do halo stars hold? How did our galaxy form? What clues to our galaxy's history do halo stars hold? Halo Stars:
CS 231A Section 1: Linear Algebra & Probability Review
 CS 231A Section 1: Linear Algebra & Probability Review 1 Topics Support Vector Machines Boosting Viola-Jones face detector Linear Algebra Review Notation Operations & Properties Matrix Calculus Probability
Mapping the column density and dust temperature structure of IRDCs with Herschel
 Mapping the column density and dust temperature structure of IRDCs with Herschel N. Pere=o 1,2, G.A. Fuller 2, R. Plume 3, L. Anderson, J. Bally, C. Ba=ersby, M. Beltran, J. Kirk, C. Lenfestey, D. Marshall,
CS 231A Section 1: Linear Algebra & Probability Review. Kevin Tang
 CS 231A Section 1: Linear Algebra & Probability Review Kevin Tang Kevin Tang Section 1-1 9/30/2011 Topics Support Vector Machines Boosting Viola Jones face detector Linear Algebra Review Notation Operations
within entire molecular cloud complexes
 The earliest phases of high-mass stars within entire molecular cloud complexes Frédérique Motte (CEA-Saclay, AIM) Collaborators: S. Bontemps (Obs Bordeaux), N. Schneider, J. Grac (CEA-Saclay), P. Schilke,
Near-Infrared Imaging Observations of the Orion A-W Star Forming Region
 Chin. J. Astron. Astrophys. Vol. 2 (2002), No. 3, 260 265 ( http: /www.chjaa.org or http: /chjaa.bao.ac.cn ) Chinese Journal of Astronomy and Astrophysics Near-Infrared Imaging Observations of the Orion
Boosting: Algorithms and Applications
 Boosting: Algorithms and Applications Lecture 11, ENGN 4522/6520, Statistical Pattern Recognition and Its Applications in Computer Vision ANU 2 nd Semester, 2008 Chunhua Shen, NICTA/RSISE Boosting Definition
Mining Digital Surveys for photo-z s and other things
 Mining Digital Surveys for photo-z s and other things Massimo Brescia & Stefano Cavuoti INAF Astr. Obs. of Capodimonte Napoli, Italy Giuseppe Longo Dept of Physics Univ. Federico II Napoli, Italy Results
Molecules at High Redshift (CO in Spitzer and Herschel-selected High-z Samples) David T. Frayer (NRAO), H-ATLAS, GOODS-H, FIDEL, and Zpectrometer
 David T. Frayer (NRAO), H-ATLAS, GOODS-H, FIDEL, and Zpectrometer") Molecules at High Redshift (CO in Spitzer and Herschel-selected High-z Samples) David T. Frayer (NRAO), H-ATLAS, GOODS-H, FIDEL, and Zpectrometer Teams Frayer (1) Background! IRAS ULIRG/LIRGs showed good
Molecules at High Redshift (CO in Spitzer and Herschel-selected High-z Samples) David T. Frayer (NRAO), H-ATLAS, GOODS-H, FIDEL, and Zpectrometer Teams Frayer (1) Background! IRAS ULIRG/LIRGs showed good
Multi-instrument, multiwavelength. energy sources with the Virtual Observatory
 Multi-instrument, multiwavelength study of high energy sources with the Virtual Observatory Caroline Bot 1,2, François Bonnarel 1,2, René Goosmann 2 and Françoise Genova 1,2 1: Centre de Données astronomiques
Galaxy Ecosystems Adam Leroy (OSU), Eric Murphy (NRAO/IPAC) on behalf of ngvla Working Group 2
, Eric Murphy (NRAO/IPAC) on behalf of ngvla Working Group 2") Next Generation Very Large Array Working Group 2 HI in M74: Walter+ 08 CO in M51: Schinnerer+ 13 Continuum in M82: Marvil & Owen Galaxy Ecosystems Adam Leroy (OSU), Eric Murphy (NRAO/IPAC) on behalf of
Next Generation Very Large Array Working Group 2 HI in M74: Walter+ 08 CO in M51: Schinnerer+ 13 Continuum in M82: Marvil & Owen Galaxy Ecosystems Adam Leroy (OSU), Eric Murphy (NRAO/IPAC) on behalf of
Protoplanetary discs of isolated VLMOs discovered in the IPHAS survey
 Protoplanetary discs of isolated VLMOs discovered in the IPHAS survey Luisa Valdivielso Casas Collaborators: E. Martín, H. Bouy, E. Solano,J. Drew,R. Greimel 1 IAC - ULL 14 de septiembre 2010 Outline Introduction
Data Mining: Concepts and Techniques. (3 rd ed.) Chapter 8. Chapter 8. Classification: Basic Concepts
 Chapter 8. Chapter 8. Classification: Basic Concepts") Data Mining: Concepts and Techniques (3 rd ed.) Chapter 8 1 Chapter 8. Classification: Basic Concepts Classification: Basic Concepts Decision Tree Induction Bayes Classification Methods Rule-Based Classification
Data Mining: Concepts and Techniques (3 rd ed.) Chapter 8 1 Chapter 8. Classification: Basic Concepts Classification: Basic Concepts Decision Tree Induction Bayes Classification Methods Rule-Based Classification
Temporal and spatial approaches for land cover classification.
 Temporal and spatial approaches for land cover classification. Ryabukhin Sergey sergeyryabukhin@gmail.com Abstract. This paper describes solution for Time Series Land Cover Classification Challenge (TiSeLaC).
Neural Networks Learning the network: Backprop , Fall 2018 Lecture 4
 Neural Networks Learning the network: Backprop 11-785, Fall 2018 Lecture 4 1 Recap: The MLP can represent any function The MLP can be constructed to represent anything But how do we construct it? 2 Recap:
ASTR 101 Introduction to Astronomy: Stars & Galaxies
 We observe star-gas-star cycle operating in Milky Way s disk using many different wavelengths of light! ASTR 101 Introduction to Astronomy: Stars & Galaxies Infrared light reveals stars whose visible light
From the VLT to ALMA and to the E-ELT
 From the VLT to ALMA and to the E-ELT Mission Develop and operate world-class observing facilities for astronomical research Organize collaborations in astronomy Intergovernmental treaty-level organization
The Planetary Nebula Spectrograph
 Chapter 2 The Planetary Nebula Spectrograph The Planetary Nebula Spectrograph (PN.S) and the principles ofcounter-dispersed imaging are described in this chapter. A full description of PN.S, its motivation,
Star Formation in GMCs: Lessons from Herschel Observations of the Aquila Complex
 Herschel PACS/SPIRE map of Aquila (Gould Belt survey) ORISTARS erc project Lab. AIM, Paris-Saclay, France Ph. André, A. Men'shchikov, N. Schneider, S. Bontemps, D. Arzoumanian, N. Peretto, P. Didelon,
The Interstellar Medium in Galaxies: SOFIA Science
 The Interstellar Medium in Galaxies: SOFIA Science Margaret Meixner (STScI) Xander Tielens (NASA/Ames/Leiden Univ.), Jesse Dotson (NASA/ARC), Bruce Draine (Princeton), Mark Wolfire (U. Maryland), Jackie
Lecture Two: Galaxy Morphology:
 Lecture Two: Galaxy Morphology: Looking more deeply at the Hubble Sequence Galaxy Morphology How do you quantify the properties of galaxies? and how do you put them in groups which allow you to study physically
C. Watson, E. Churchwell, R. Indebetouw, M. Meade, B. Babler, B. Whitney
 Reliability and Completeness for the GLIMPSE Survey C. Watson, E. Churchwell, R. Indebetouw, M. Meade, B. Babler, B. Whitney Abstract This document examines the GLIMPSE observing strategy and criteria
Addendum: GLIMPSE Validation Report
 August 18, 2004 Addendum: GLIMPSE Validation Report The GLIMPSE Team 1. Motivation In our Validation Report of Jan. 30, 2004, we produced reliability calculations and discussed photometric accuracy estimates
ASTR 101 Introduction to Astronomy: Stars & Galaxies
 ASTR 101 Introduction to Astronomy: Stars & Galaxies We observe star-gas-star cycle operating in Milky Way s disk using many different wavelengths of light Infrared light reveals stars whose visible light
Classifying Galaxy Morphology using Machine Learning
 Julian Kates-Harbeck, Introduction: Classifying Galaxy Morphology using Machine Learning The goal of this project is to classify galaxy morphologies. Generally, galaxy morphologies fall into one of two
Cosmic Hide and Seek: Tracking Missing and Invisible Matter in the Universe. Sheila Kannappan Physics & Astronomy Department UNC Chapel Hill
 Cosmic Hide and Seek: Tracking Missing and Invisible Matter in the Universe Sheila Kannappan Physics & Astronomy Department UNC Chapel Hill narrow meaning of visible : λ=400-700nm Light = Electromagnetic
View of the Galaxy from within. Lecture 12: Galaxies. Comparison to an external disk galaxy. Where do we lie in our Galaxy?
 Lecture 12: Galaxies View of the Galaxy from within The Milky Way galaxy Rotation curves and dark matter External galaxies and the Hubble classification scheme Plotting the sky brightness in galactic coordinates,
arxiv: v1 [astro-ph.ga] 20 Apr 2016
![arxiv: v1 [astro-ph.ga] 20 Apr 2016](/thumbs/93/112464895.jpg "arxiv: v1 [astro-ph.ga] 20 Apr 2016") Astronomy & Astrophysics manuscript no. Catalog release paper 8 astroph c ESO 2016 April 21, 2016 arxiv:1604.05911v1 [astro-ph.ga] 20 Apr 2016 Hi-GAL, the Herschel infrared Galactic Plane Survey: photometric
Astronomy & Astrophysics manuscript no. Catalog release paper 8 astroph c ESO 2016 April 21, 2016 arxiv:1604.05911v1 [astro-ph.ga] 20 Apr 2016 Hi-GAL, the Herschel infrared Galactic Plane Survey: photometric
Science Olympiad Astronomy C Division Event Golden Gate Invitational
 Science Olympiad Astronomy C Division Event Golden Gate Invitational University of California, Berkeley Berkeley, CA February 9, 2019 Team Number: Team Name: Instructions: 1) Please turn in all materials
The Plato Input Catalog (PIC)
") The Plato Input Catalog (PIC) Giampaolo Piotto and the WP130000 group Dipartimento di Fisica e Astronomia Universita di Padova Because of the huge size of PLATO field (~2124 sq deg) and the consequent
The Plato Input Catalog (PIC) Giampaolo Piotto and the WP130000 group Dipartimento di Fisica e Astronomia Universita di Padova Because of the huge size of PLATO field (~2124 sq deg) and the consequent
The Star Formation Observatory (SFO)
") Beyond JWST... STScI, Mar 26 27 2009 Slide 1 The Star Formation Observatory (SFO) From Cosmic Dawn to Our Solar System: A Next-Generation UV Optical Space Facility for the Study of Star Formation Rolf
Beyond JWST... STScI, Mar 26 27 2009 Slide 1 The Star Formation Observatory (SFO) From Cosmic Dawn to Our Solar System: A Next-Generation UV Optical Space Facility for the Study of Star Formation Rolf
SUPERVISED LEARNING: INTRODUCTION TO CLASSIFICATION
 SUPERVISED LEARNING: INTRODUCTION TO CLASSIFICATION 1 Outline Basic terminology Features Training and validation Model selection Error and loss measures Statistical comparison Evaluation measures 2 Terminology
Multi-wavelength Surveys for AGN & AGN Variability. Vicki Sarajedini University of Florida
 Multi-wavelength Surveys for AGN & AGN Variability Vicki Sarajedini University of Florida What are Active Galactic Nuclei (AGN)? Galaxies with a source of non-stellar emission arising in the nucleus (excessive
arxiv: v1 [astro-ph.ga] 16 Dec 2012
![arxiv: v1 [astro-ph.ga] 16 Dec 2012](/thumbs/73/68506550.jpg "arxiv: v1 [astro-ph.ga] 16 Dec 2012") Astronomy & Astrophysics manuscript no. main c ESO 2012 December 18, 2012 arxiv:1212.3848v1 [astro-ph.ga] 16 Dec 2012 Triggered/sequential star formation? A multi-phase ISM study around the prominent IRDC
Astronomy & Astrophysics manuscript no. main c ESO 2012 December 18, 2012 arxiv:1212.3848v1 [astro-ph.ga] 16 Dec 2012 Triggered/sequential star formation? A multi-phase ISM study around the prominent IRDC
Modern Image Processing Techniques in Astronomical Sky Surveys
 Modern Image Processing Techniques in Astronomical Sky Surveys Items of the PhD thesis József Varga Astronomy MSc Eötvös Loránd University, Faculty of Science PhD School of Physics, Programme of Particle
The Milky Way Galaxy and Interstellar Medium
 The Milky Way Galaxy and Interstellar Medium Shape of the Milky Way Uniform distribution of stars in a band across the sky lead Thomas Wright, Immanuel Kant, and William Herschel in the 18th century to