Focus-diverse, empirical PSF models for the ACS/WFC
|
|
|
- Job McBride
- 5 years ago
- Views:
Transcription

1 Instrument Science Report ACS/WFC Focus-diverse, empirical PSF models for the ACS/WFC Andrea Bellini, Jay Anderson, & Norman A. Grogin November 20, 2018 Space Telescope Science Institute, 3700 San Martin Drive, Baltimore, MD Abstract Focus variations, primarily due to uneven Sun heating of the telescope tube, have a significant impact on the shape of the ACS/WFC point-spread function (PSF). These variations can be properly accounted for on an image-by-image basis by perturbing the library PSF models (Anderson & King 2006) when many bright, relatively isolated stars are present: a luxury that many HST users do not enjoy. This report presents an exploratory analysis of these focus variations and describes the procedures to obtain focus-diverse, spatially-variable PSF models from flc ACS/WFC images taken with the two most commonly used filters: F606W and F814W. The new PSF models are shown to be superior to the library PSF models, particularly when the focus level is extreme, and provide results comparable to those obtained by PSF-perturbation techniques without the need for populated stellar fields in an image. Future analyses will comprise the construction of focus-diverse PSF models for the several other commonly used filters of the ACS/WFC and their implementation in the hst1pass reduction package. 1. Introduction The relatively stable environment of low Earth orbit allows the Hubble Space Telescope s (HST s) Point-Spread Functions (PSFs) to be extremely stable and offer superior astrometric and 1 Copyright c 2003 The Association of Universities for Research in Astronomy, Inc. All Rights Reserved.
2 2 photometric quality with respect to any ground-based facility. The current, state-of-the-art, static library of empirical PSF models for the Wide-Field Channel (WFC) of the Advanced Camera for Surveys (ACS) are discussed in detail in Anderson & King (2006). These PSFs are supersampled by a factor of four with respect to the ACS/WFC pixels, and map spatial variations across each CCD using a 9 5 array (see Fig. 1). The best PSF model for a given location on a CCD can be obtained through bi-linear interpolation of the four surrounding PSFs of the array. The fraction of light in the core of the library PSFs varies by ±3.7% with respect to the average PSF computed over the entire WFC. The central pixel of the average PSF contains around 20% of the total star light. Even though the Earth s atmosphere has no effect on the HST PSFs, periodic focus variations cause the fraction of light in the core of the PSFs to change by up to 5%. This is due to the so-called breathing : uneven heating of the telescope tube by the Sun as HST enters or exits the Earth s shadow, or it changes orientation relative to the Sun (see, e.g., Sahu, Lallo, & Makidon 2007; Di Nino et al. 2008). This causes focus variations greater than 6 µm over timescales of less than a week. On timescales longer than a month or so, temperature variations average out. But there can still be longer-term focus variations, caused for example by outgassing of the spacecraft which leads to a progressive shrinking of the metering truss (Di Nino et al. 2008). As a result, the secondary mirror is constantly moving toward the primary, and secondary-mirror moves are commanded when needed to compensate for this trend (Di Nino et al. 2008). As already pointed out in Anderson & King (2006), the library PSFs can be perturbed on an image-by-image basis to account for these focus changes. The perturbation of the library PSFs is now a common practice is high-precision stellar-population studies of dense star systems (e.g., Bellini et al and references therein), but it requires the images to always contain at least a few hundred relatively bright and isolated stars: a luxury that many HST users do not enjoy. Recently, Anderson & Bedin (2017) explored the feasibility of deriving a focus-diverse set of spatially-variable PSF models for the Uv-VISible (UVIS) channel of the Wide-Field Camera 3 (WFC3) detector on-board the HST. The authors made use of several hundred images of the globular cluster M4 taken with the F467M filter, and demonstrated that it is indeed possible to characterize the time dependence of the shape of the PSFs using a one-parameter family of PSFs regulated by telescope focus. The authors also show that just a handful of stars in an image (compared to the few hundred stars required for perturbation) are sufficient to pinpoint the best focus-diverse PSF model for a given exposure. If the ACS/WFC PSFs can also be easily characterized as a function of focus, then it will be also possible to empirically construct a set of both spatially- and focus-diverse, high-quality PSF models for the filters of the ACS/WFC. Clearly, having access to a set of focus-diverse PSF models for the ACS/WFC would be a great benefit to the entire astronomical community.

 the local difference with respect to the average PSF, shown using a linear zscale.")
3 3 Fig. 1. (Top:) location of the 9 10 PSF models on the two WFC CCDs, according to the recipes of Anderson & King (2006). Red marks denote a few key locations that will be used later to show focus-dependent variations. (Bottom-left:) 9 10 PSF models of the F606W filter in logarithmic z-scale. (Bottom-right:) the local difference with respect to the average PSF, shown using a linear zscale. Dark (bright) pixels mean less (more) flux in the local PSFs with respect to the single PSF averaged over the entire detector. Pixel variations range from 3.8% to +3.6%.
4 4 Table 1 List of Pre-Qualifying ACS/WFC Images Total number of ACS images Total number of ACS/WFC full frames Short exposures (30s < t exp < 337s) 4587 Long exposures (t exp 337s) Filter Total pre-sm4 post-sm4 F435W F475W F502N F550M F555W F606W F625W F658N F660N F775W F814W F850LP F892N Public data available at the end of In bold the filters analyzed in this work. 2. Sifting through the HST archive A large number of full-frame ACS/WFC exposures are needed to construct focus-diverse PSF models, to allow the mapping of even extreme (and uncommon) focus positions with adequate statistics. In addition, images need to contain enough (at least 300 or so) bright (S/N >30), relatively isolated 1 and unsaturated stars (hereafter, the good stars), so that high-fidelity, spatially-variable PSF models can be constructed free of pixel-phase errors (see, e.g., Anderson & King 2000). At the end of 2017, out of the 103,801 publicly available ACS/WFC full-frame images, there were 88,129 with suitably long exposure times ( 30 seconds). Because of small but significant changes in both the ACS/WFC geometric distortion and the PSF shape after the camera was repaired during HST Servicing Mission 4 (SM4) in 2009 (more later), the PSF analysis has been performed separately for pre- and post-sm4 WFC images. Table 1 shows the total number of full-frame ACS/WFC images available for each filter. The F606W and F814W filters are by far 1 Isolated stars are defined as those sources with no brighter neighbor within 12 pixels.
5 5 the most utilized, and therefore the first choices in the filter-by-filter PSF analysis. Future reports will focus on other commonly-used filters. 3. Choosing the right images Starting with the 7016 pre-sm4 full-frame F606W images, the next step is to identify those among them containing at least 300 good stars. This was accomplished by modifying the software package hst1pass a soon-to-be-released consolidation of several photometric-reduction tools developed by J. Anderson for HST cameras to execute on the WFC raw-format fits files. This software runs a single wave of source finding and performs PSF-fitting photometry using the empirical library PSF models described in detail in Anderson & King (2006). Figure 2 shows a histogram of the number of bright sources found in each exposure. The quality-of-fit (QFIT) parameter 2 of hst1pass discriminates between stars (0< QFIT<0.25) and extended sources, blends, and cosmic ray detections, all characterized by higher QFIT values. The QFIT parameter indicates how well a source has been fit with the PSF models (See Anderson et al. 2008). QFIT values close to zero mean that the PSFs and the stars have very similar shapes (a value of zero implies a perfect match). The higher the QFIT values, the more discordant the shape of the PSF is from that of the fitted source. Finally, saturated sources are defined as those with a central pixel containing more than 40,000 ADUs. The histogram in Fig. 2 is color-coded according to the fraction of stars (green), extended sources (blue), and saturated stars (red) found in each exposure. For the 2015 pre-sm4 images containing at least 300 good stars, each was then processed with the ACS calibration pipeline CALACS to produce dark, bias, flat-field and CTE-corrected flc images. 4. The pre-sm4 F606W Phylogram The software hst1pass is run again, this time only on these 2015 flc images. In addition, at odds with the previous run, hst1pass perturbed the library PSFs using the good stars found in each image. The perturbation array is designed to vary between a single perturbed PSF up to 5 5 perturbed PSFs across the ACS/WFC full frame. Different regions of a full-frame ACS/WFC exposure are affected differently by changes in focus (more in Sect. 5), so the 5 5 perturbation array is the preferred choice to better reproduce the effects of focus variations. At least 20 good stars are needed per perturbed PSF in the array, to mitigate low-number statistics effects. 2 The QFIT is defined as the sum over the fitting aperture of the absolute difference between the pixel values pix i,j (sky subtraced) and the scaled PSF values ψ i,j, normalized by the pixel values: pix i,j sky Z ψ i,j, where i,j pix i,j sky Z is the flux of the source within the fitting aperture.
6 6 Fig. 2. Histogram of the number of bright sources (S/N > 30) measured on the 7016 full frame, pre-sm4 F606W ACS/WFC raw exposures. Saturated sources are in red. Extended sources, blends and cosmic-ray detections are in blue. Well-measured stars are in green. These selections resulted in 1347 exposures that were used to construct 5 5 perturbation PSF arrays. For each of these images, the good stars are fitted with the library PSFs appropriate for their location in the image. The library PSFs are then subtracted, and the residuals are
7 7 averaged over each region in the image and collected into the perturbation array. The perturbation array is then projected into the 9 10 array space of the library PSFs, and summed to the library PSFs themselves to obtain a new set of 9 10 improved PSFs for that particular image. The process is iterated and, at each iteration, the residuals of the PSF fit become increasingly smaller, implying that the new PSF models are converging to match the actual shape of the stars in that image. Convergence is reached when the difference in the residuals from one iteration to the next is smaller than < The next step is to construct the so-called phylogram plot, following the recipes described in great detail in Anderson & Bedin (2017). The phylogram is a two-dimensional plot that represents multidimensional differences between the image-tailored PSFs in terms of differences between points in a two-dimensional space. Phylograms are commonly used in biology (in particular, in phylogenetics) to highlight differences between species in terms of the total difference of their DNA code. In the current study, for each image pair i,j, the quantity d i,j gives the normalized sum of the absolute value of the differences between the pixels of the 9 10 array of PSFs. Two images with similar (different) PSFs will have a small (large) d i,j value. The phylogram plot is populated by adding one point at a time, where each point corresponds to one of the 1347 images. The first point is placed at the origin (0,0). The second point can be placed anywhere on a circle of radius d 1,2 around the first point. Once the second point is placed, the third point can be placed in only two positions on the phylogram that are d 1,3 away from the first point, and d 2,3 away from the second point. Starting from the fourth point, there are no exact solutions, and the location of each of the already-placed points is allowed to slightly adjust itself in such a way as to minimize the sum of all placement errors. (see Anderson & Bedin 2017 for an in-depth description of the method). Figure 3 show the phylogram of the 1347 pre-sm4 F606W images. At odds with the phylogram Anderson & Bedin (2017), which is based WFC3/UVIS F467M exposures (their Fig. 5), the phylogram in Fig. 3 is clearly bi-modal on one side, with an inner and an outer bend, and presents significant spread that is not related to placement errors (red points and inset in Fig. 3). The ACS/WFC is located off-center on the focal plane, while the WFC3/UVIS is at the center of the focal plane: this could play some role in producing the differences between the WFC3/UVIS and the ACS/WFC phylograms. Accurate focus models 3 can be obtained for most of the 1347 images shown in Figure 3. The temperature-dependent part of these models come from Di Nino et al. (2008), while the long-term secular component is based on Niemi et al. (2010). Figure 4 illustrates the relationship between the average focus models and the pre-sm4 F606W phylogram. The position of the secondary mirror of HST was adjusted three times between the installment of ACS and when the camera failed in 2007, in order to account for focus drifts due to outgassing of the spacecraft (Di Nino et al. 2008). The top panels of Fig. 4 show the histograms of the focus models separated into 3
8 8 Fig. 3. (Main panel:) Phylogram of pre-sm4 F606W exposures. Each open square represents an image. The relative distance between squares corresponds to the global absolute difference between their PSFs. The orientation and zero point of the plot are arbitrary. The inset shows the placement error as a function of exposure number. Images with high placement errors are marked in red in both panels, showing no obvious correlations between placement errors and image position on the phylogram.
9 9 Fig. 4. On top, the histograms of focus models for pre-sm4 F606W images taken at particular secondary-mirror (SM) offsets. The histograms are divided into 5 groups and color coded from red to blue from the most negative to the most positive groups, respectively. Note that only a few images belong to the red group in the leftmost SM offset, while the red groups of the other two SM offsets are empty. The second row of panels shows the phylogram plots of images taken at the three secondary-mirror offsets. The remaining panels highlight where images of different focus groups are located on the (now grayed out) phylograms.
10 10 the time intervals in between secondary-mirror adjustments. The three panels on the second row illustrate the phylogram plots for the same periods, showing that points on the phylogram move progressively to the lower part as the secondary-mirror offset increases. The focus histograms are divided into 5 groups spaced every 4 µm, and color coded from red to blue from the most negative to the most positive groups, respectively. The remaining panels of Fig. 4 show where images of different focus groups are located on the phylogram. Not much can be said about the rightmost panels, due to low-number statistics. For the first two secondary-mirror positions it seems that, on average, images with negative focus levels do not preferentially populate the lower end of the phylogram, which is instead preferentially populated by images characterized by more positive focus values. To better understand if and how other parameters might be at play in determining the shape of the ACS/WFC phylogram, different telescope and exposure conditions extracted from the image headers are analyzed in Fig. 5. No significant correlations are found with the Moon angle (as expected since the Moon angle does not significantly affect the thermal load on the telescope), nor with the primary-use detector. The points in the phylogram correlate with the angle between the Sun and the V1 axis (Sun angle), with the inner bend being populated by images with larger Sun angles, while the outer bend is less affected. Early observations are found to mostly populate the inner bend, while the vast majority of the later observations are on the outer bend. Images affected by relatively small jitter RMS are predominantly in the inner bend. It also appears that exposure time affects the location of the PSFs on the phylogram, with shorter exposures predominantly on the outer bend. This can be interpreted as the focus level being almost constant within a short observation, while long observations have sufficient time to map somewhat larger focus variations, resulting in focus-averaged PSFs. Because of the need to accommodate parallel buffer dumps during ACS/WFC full-frame image sequences, WFC observations are typically longer than 337 seconds, to maximize the on sky telescope time. Finally, it appears that the Sun altitude over the Earth limb (Sun alt angle) has also some effect on the location of the PSFs on the phylgram: images characterized by a large Sun alt values preferentially populate the outer regions of both bends. 5. PSF modeling Since both the location and the orientation of the points in the phylogram are arbitrary, the points are rotated so that their profile resembles a U shape, hereafter the reference phylogram (Fig. 6). This phylogram is arbitrarily divided into 18 distinct regions/groups. This is a trade-off between the need of a fine sampling of PSF variations and enough statistics within each sample. The plan is to derive a set of spatially-varying PSF models for each of these regions. These sets will be representative of the full focus variation affecting pre-sm4 F606W exposures.
11 11 Fig. 5. These panels illustrate possible correlations between the location of the images on the phylogram and various parameters: Moon and Sun angle with respect to the V1 axis of the telescope, altitude of the Sun above the Earth s limb, epoch, the primary-use instrument, jitter RMS, and exposure time. See the text for details.
12 12 Fig. 6. Reference phylogram (similar to Fig. 3 but shifted and rotated so that it resembles a U shape). The phylogram is divided into 18 distinct regions (focus groups). The images within each region are used to construct 18 sets of spatially-variable, focus-diverse PSF models. The gray points outside the focus regions are considered as considered as outliers and are not used to define the focus-diverse PSF models. These points are reasonably close to one of the focus regions, so that the associated focus-diverse PSF models can still be successfully used for them as well.
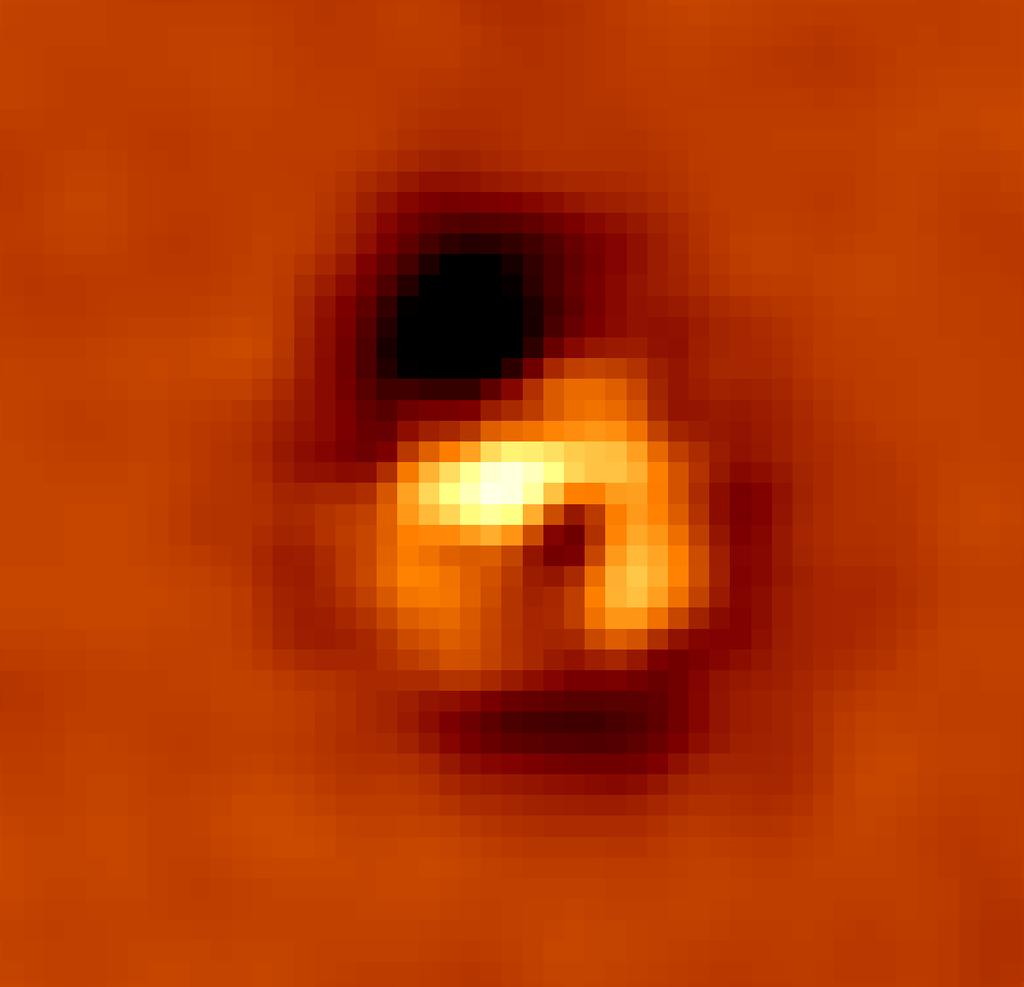
13 13 Because of the undersampled nature of HST detectors, many stars at different sub-pixel positions are necessary to obtain PSF models that are free of pixel-phase errors. This can be achieved either by taking multiple dithered observations of the same field (e.g., Anderson & King 2000), or by using multiple observations of different fields. Following the prescriptions given in Anderson & Bedin (2017), the construction of the focus-diverse PSF models started by determining preliminary positions and fluxes of stars in the associated images of each group using the available library PSFs. The PSF-fitting residuals were then used to construct an initial array of 9 10 spatially-variable PSF models. With the new PSFs, new and improved stellar positions and fluxes are obtained, which in turn are used to construct improved PSF models. This procedure is very similar to that used in Sect. 4 to derive tailored PSF models to each image. The main advantage here is that many images with similar focus properties are combined at once, providing many more stars to directly constrain the full 9 10 array of PSF models, instead of having to rely on projections from a less-optimal 5 5 perturbation array. As done in Anderson & Bedin (2017), stellar fluxes are measured through a 5-pixel-radius circular aperture. This accounts for the flux that landed outside the 5 5-pixel square aperture used by the PSF-fitting routine. To better illustrate how focus affects the PSF shape, Fig. 7 reports the same reference phylogram space plane of Fig. 6, but this time the points of the 18 regions are replaced by a zoomed-in view of the differences between the central pixels of the top-left PSF of the 9 10 array which is at location (1,10) (see Fig. 1) with respect to the corresponding library PSF. There is a continuous transformation of the residuals moving from groups 1 to 14. The residuals start from having a cross-like shape in the core, with less flux along one direction and more flux along the perpendicular direction (group 1). Then, they evolve towards a shape more similar to that of the library PSF, but with less flux in the core (groups 7,8), and finally they exhibit more flux in the core but less flux in an annulus just outside the core at the opposite extreme of the focus level (groups 11 14). Groups 15 to 18 on the inner bend show an overall similar (but not identical) residual behavior as groups 6 to 12. Figure 8 illustrates the focus dependence of the PSF residuals with respect to the library PSF at 14 other array locations (all the remaining locations shown in red in Fig. 1). Again, the shape of the residuals continuously changes when moving from group 1 to group 14, with groups 16 to 18 generally showing similar trends to groups 6 to 12. It is worth noting that, while for instance the residuals of the PSF at location (1,1) start negative in the core and evolve towards positive values, the core of residuals of PSF at location (6,5) stars positive in groups 1 3, then becomes negative in groups 5 10, and returns positive again in groups Clearly, focus variations have different effects in different locations of the WFC detector. This is why focus variations cannot be easily de-coupled from spatial variations. Table 2 lists the peak-to-peak pixel variations of the focus-diverse PSF arrays with respect to


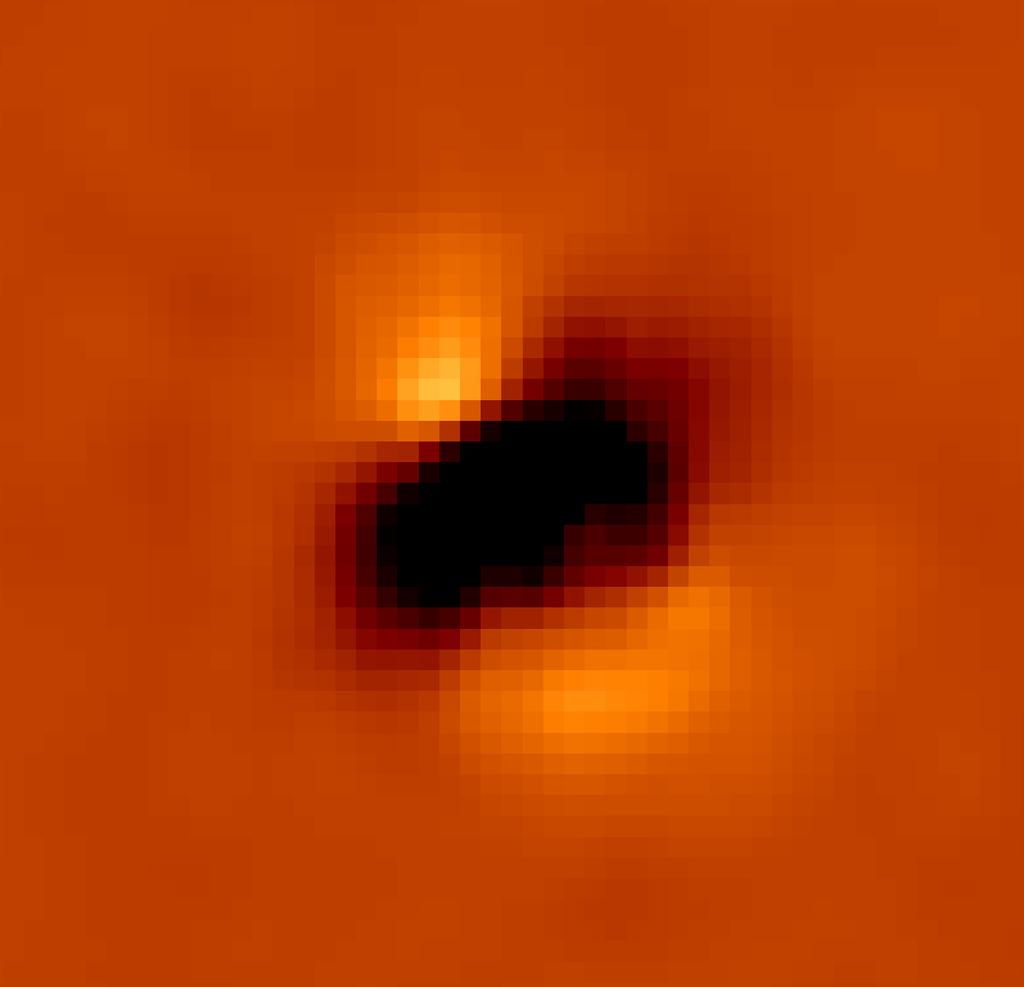


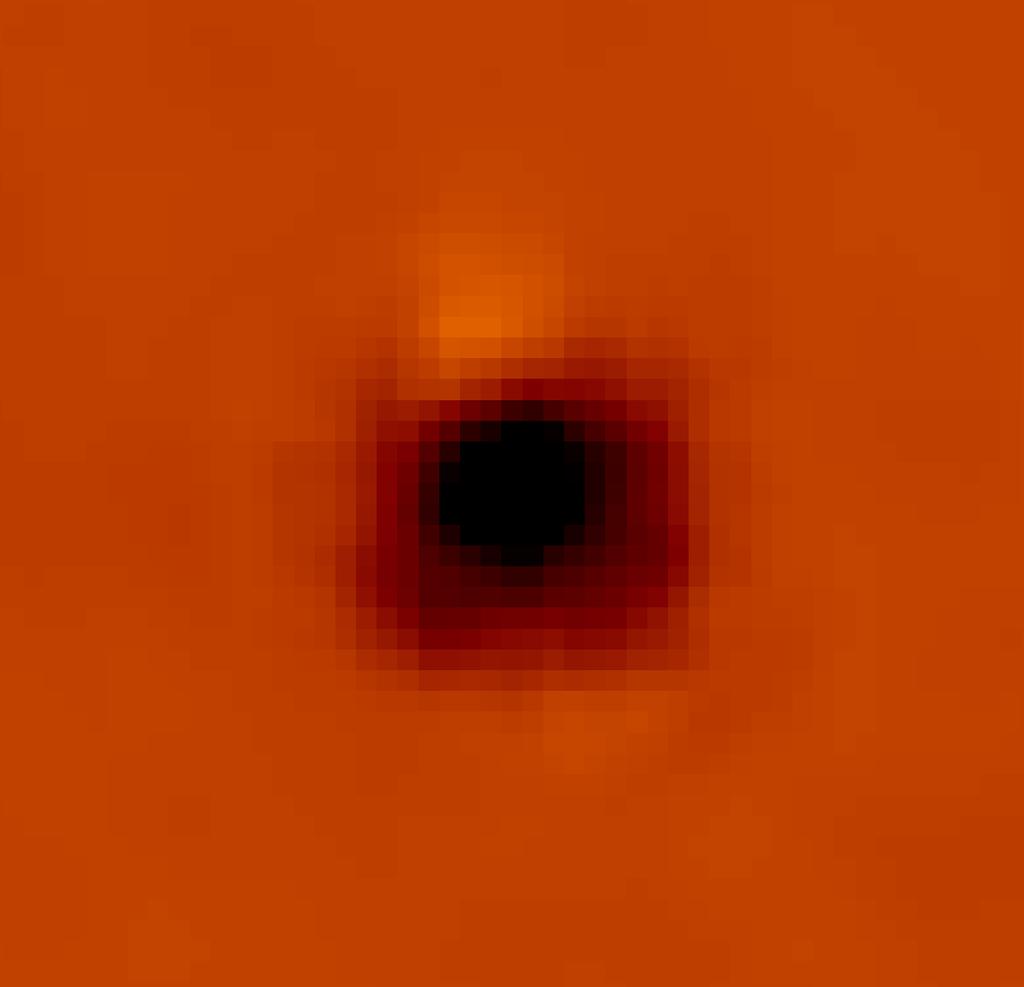

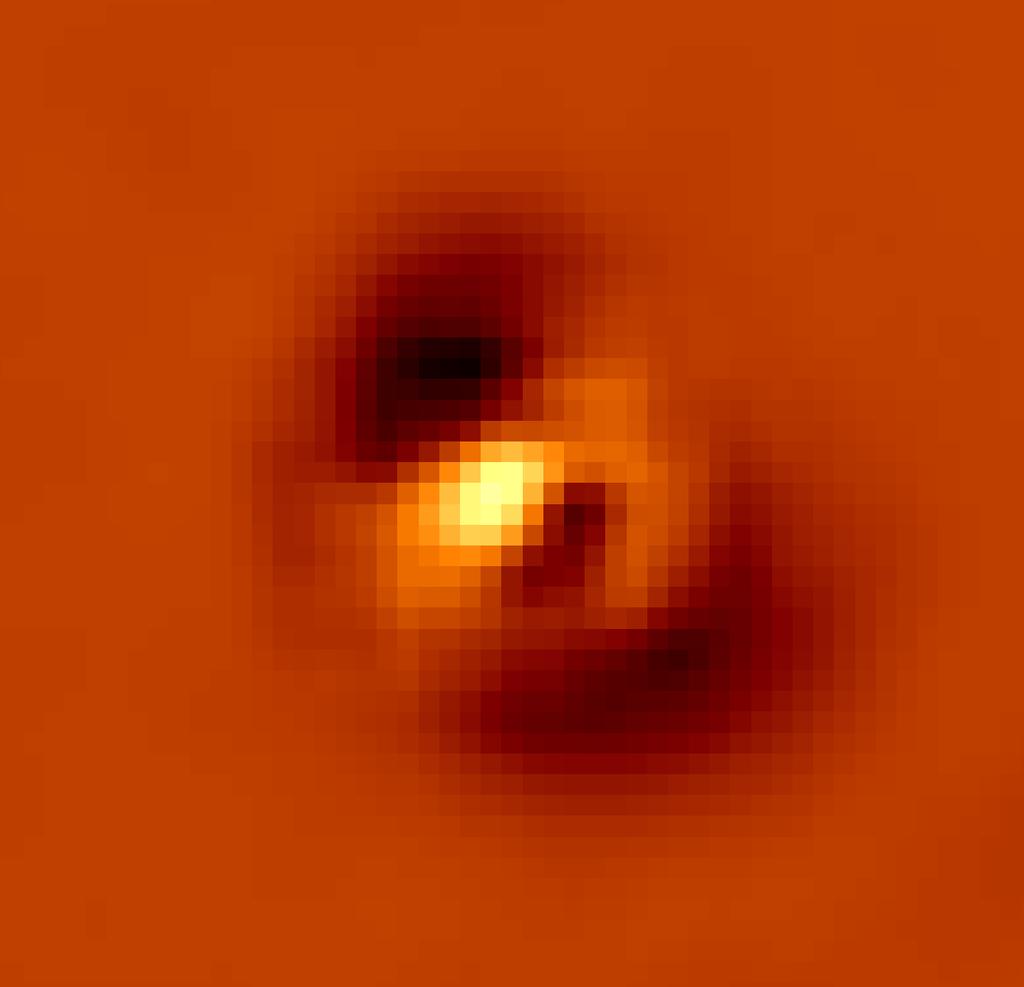
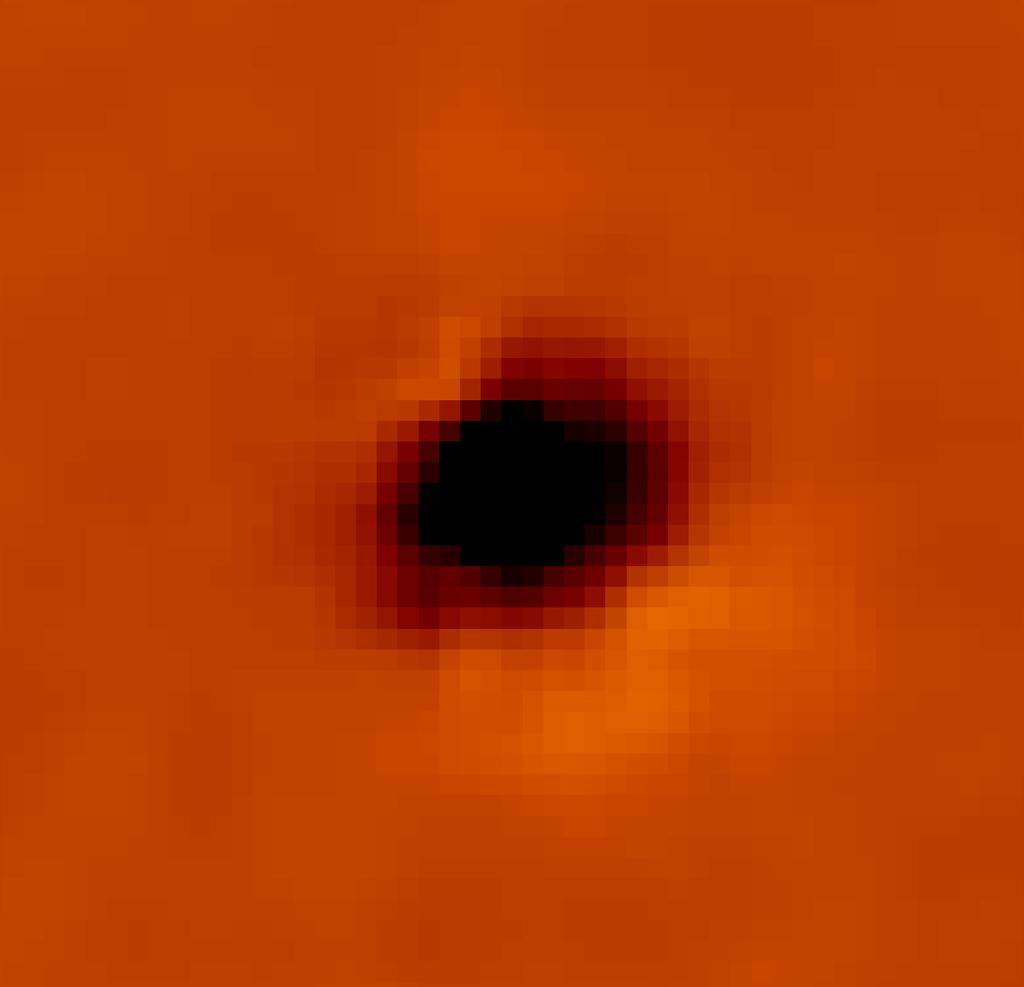
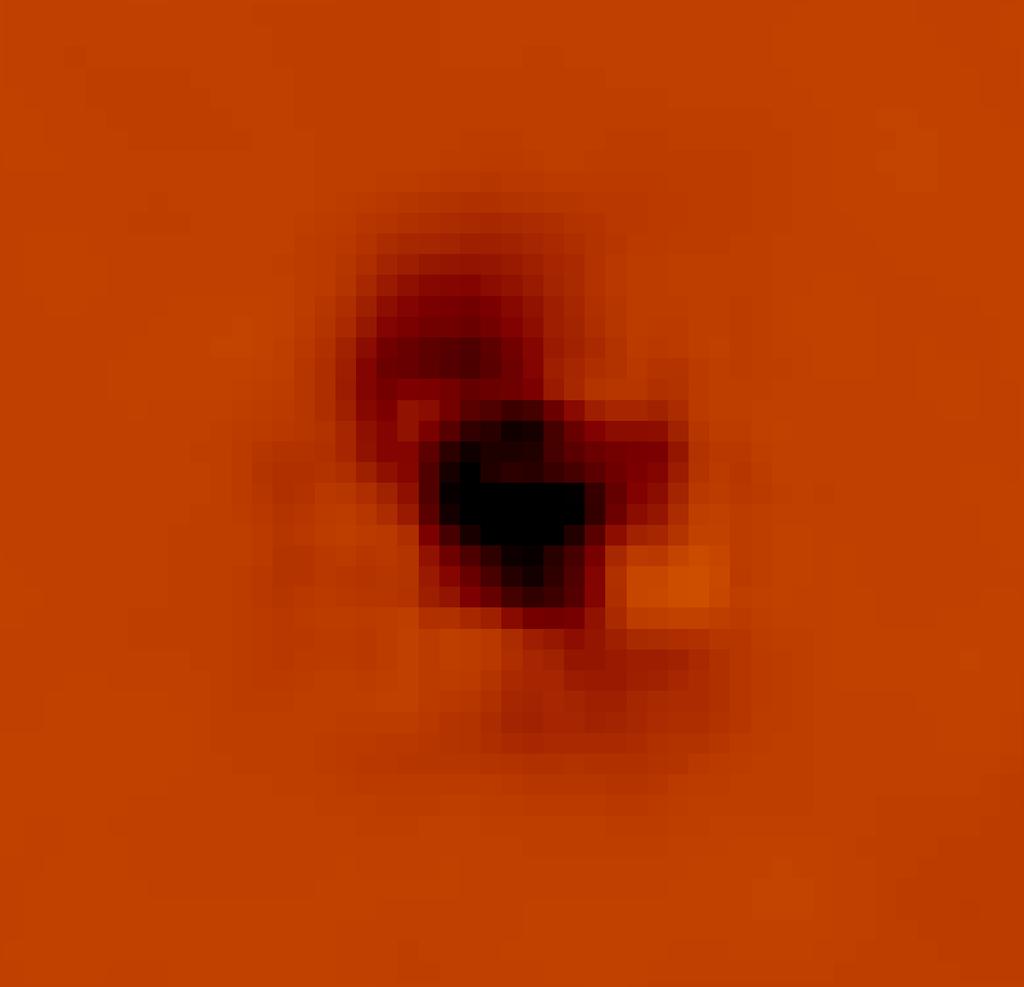

14 14 Fig. 7. Variation of the focus-diverse PSF at location (1,10) i.e., the top-left PSF of the WFC1 CCD with respect to the library PSF. Note the smooth and continuous variation from one extreme of the reference phylogram to the other.
 (9,5) (1,8) (6,8) (9,8) (6,10) (9,10) Fig. 8. Variation of 14 selected PSFs (the same marked in red in Fig. 1 except for PSF (1,10), which is shown in Fig.")
15 15 Group 1 Group 2 Group 3 Group 4 Group 5 Group 6 Group 7 Group 8 Group 9 Group 10 Group 11 Group 12 Group 13 Group 14 Group 15 Group 16 Group 17 Group 18 (1,1) (6,1) (9,1) (1,3) (6,3) (9,3) (1,5) (6,5) (9,5) (1,8) (6,8) (9,8) (6,10) (9,10) Fig. 8. Variation of 14 selected PSFs (the same marked in red in Fig. 1 except for PSF (1,10), which is shown in Fig. 7) with respect to the library PSF as a function of focus group. the library PSFs. 6. Results One way to test how well the shape of the new focus-diverse PSF models resembles that of the stars in an image is through the analysis of the QFIT parameter. Recently, Hoffmann & Anderson (2017) used the QFIT parameter to demonstrate the superiority of the empirical PSF models over the theoretical TinyTim PSFs (see Fig. 9). In what follows, it is shown that the focus-diverse PSF models derived in the present study are superior to the library of empirical PSFs. The library PSF models are generally similar to the focus-diverse PSF models of groups 6

16 16 Table 2 Peak-to-Peak Variations of the Focus-Diverse PSFs with respect to the Library PSF as a Function of Focus Group Group Min Max Group Min Max Group Min Max 1 3.0% +4.3% 7 2.5% +0.2% % +4.0% 2 3.1% +2.6% 8 2.2% +0.4% % +5.7% 3 3.4% +1.7% 9 1.4% +0.9% % +5.1% 4 3.5% +0.7% % +1.5% % +0.6% 5 3.1% +0.5% % +2.4% % +1.8% 6 2.9% +0.3% % +3.0% % +3.5% Fig. 9. Reproduction from Hoffmann & Anderson (2017, their Fig. 4). The panels show a comparison of the QFIT parameter as a function of instrumental magnitude for sources measured on the same image using the library PSFs (EFFPSF, left) and Tiny Tim PSFs (TTIMPSF, right). Well-measured sources are in red.
17 17 Fig. 10. Comparison of the QFIT parameter as a function of instrumental F606W magnitude for six images in the focus group 1 as measured by the library PSFs (black) and the focus-diverse PSFs (red). to 10, so the QFIT values of images belonging to these focus groups are not expected to be much different. In fact, only marginal improvements are found using the focus-diverse models. On the other hand, the difference between the focus-diverse and library PSF models is maximized for the extreme groups 1 and 14. A set of six randomly-selected images in these two extreme groups are used to measure the QFIT parameter of their sources (Figs. 10 and 11 for groups 1 and 14, respectively) via library PSF fitting (black) and focus-diverse PSF fitting (red). In both figures, the QFIT values of well-exposed stars measured by the library PSFs is as high as , while the average QFIT value for the focus-diverse measurements is 0.05 or less. The two gray vertical lines in the figures mark the range of the saturation onset, which varies spatially across the WFC field of view. QFIT values <0.05 are generally consistent with what is achievable by perturbing the library PSFs on an image-by-image basis, but this task requires an abundance of bright, isolated stars in each image. Here the focus-diverse models are simply applied without perturbation. The
18 18 Fig. 11. Similar to Fig. 10 but for six random images in the focus group 14. improvement with respect to the library PSFs is clear. When many stars are also available, it is possible to further refine the focus-diverse PSF models via PSF perturbation. To show this, stellar positions and fluxes of sources are measured for the image j9it02i6q flc.fits (focus group 14, see Fig. 12) using the library PSFs (black), the focus-diverse PSFs (red), and by perturbing the focus-diverse PSFs using a 5 5 perturbation array (blue). The top panel of the figure shows QFIT values versus instrumental magnitudes for the three measuring methods, illustrating the further improvement offered by PSF perturbation. Most importantly, the lower panels in Fig. 12 highlight the presence of pixel-phase errors when the library PSF models are used under extreme focus level conditions. Since stars in the image are at random sub-pixel locations, their measured positions should uniformly populate the pixel-phase space. The figure shows that this is not the case when stars are measured with the library PSFs. The core of the library PSFs is too shallow and results in non-negligible systematic effects in the measured stellar positions. Stars measured with the focus-diverse PSF models, on the other hand, do a much better job in mitigating pixel-phase systematic errors: a clear advantage
19 19 Fig. 12. (Top:) the QFIT versus instrumental magnitude for sources in one of the images in the focus group 14 as measured by the library PSFs (black) the focus-diverse PSFs (red), and by perturbing the focus-diverse models (blue). (Bottom:) Pixel-phase space distribution of sources measured with the library PSFs (left, in black), the focus-diverse PSFs (center, in red), and the perturbed focus-diverse PSFs (right, blue). for astrometric applications (see, e.g., Bellini et al. 2014). The analysis presented thus far has comprised only pre-sm4 F606W images but, as part of this study, new focus- and spatially-variable PSF models are also obtained for post-sm4 F606W images, as well as for the F814W filter (both pre- and post-sm4). The left panel of Fig. 13 shows the phylogram plot for post-sm4 F606W observations, to be compared to that for pre-sm4 observations in Fig. 3. As for the pre-sm4 phylogram, Fig. 13 also exhibits a multi-modal distribution of points on one side, the locations of which do not correlate with the placement errors of the phylogram-construction process (inset). As for the pre-sm4 case, correlations are found between the different phylogram bends and the angle between the Sun and the V1 axis, the exposure time, the epoch of observation, and the Sun altitude above the Earth s limb. No correlations are found for the other parameters shown in Fig. 5.
20 20 Fig. 13. Similar to Fig. 3 (left) and Fig. 6 (right) but for post-sm4 F606W images. Fig. 14. Similar to Fig. 6 but for pre- (left) and post-sm4 (right) F814W images. Note the clear difference between the two phylograms. On the right panel of Fig. 13 the reference post-sm4 F606W phylogram is divided into 20 arbitrarily-defined focus groups. Note the differences between the shape of the pre- and post-sm4 reference phylograms of the F606W filter (Figs. 13 versus 6). The pre-/post-sm4 difference of the
21 21 ACS/WFC reference phylograms is even clearer for the F814W filter in Fig. 14, as a consequence of a general PSF shape change of the ACS/WFC after SM4. The focus-diverse PSF models of the post-sm4 F606W images, as well as of the pre- and post-sm4 F814W images provide similar improvements with respect to the library PSFs as those described above for the pre-sm4 F606W images. 7. Conclusions The present study shows that, by and large, the ACS/WFC PSFs vary in a predictable way as a function of focus variation. These variations can be easily seen on a phylogram-like plot of the relative differences between the image-tailored empirical PSFs. At odds with the phylogram of the WFC3/UVIS (Anderson & Bedin 2017, e.g., their Fig. 6), the phylogram of the ACS/WFC is multi-modal on one side, with different tails of the distribution correlating with epoch, exposure time, the angle between the Sun and the V1 axis, and the altitude of the Sun above the Earth s limb. Jitter RMS and the primary-use detector show no significant correlations with in the phylogram plot. The process of constructing focus-diverse, spatially-variable PSF models started by collecting all suitable full-frame ACS/WFC images from the existing non-proprietary archive. The sample is divided according to the filter used. In addition, a distinction was made between pre- and post-sm4 observations, since both the shape of the PSFs and the geometric distortion of the ACS/WFC have changed since the camera was repaired during SM4. Phylogram plots were derived starting from the two most-commonly-used filters of the ACS/WFC: F606W and F814W. The phylograms are arbitrarily divided into regions of similar focus level, and a spatially-variable array of 9 10 PSFs is obtained for each region. The QFIT parameter is used to verify that the new PSF are able to more closely match the actual shape of the stars in the images than the static library PSFs. The new PSFs provide similar results to what can be achieved by perturbing the library PSFs on an image-by-image basis, but without the need of hundreds of stars in the image. When enough stars are available on an image, the focus-diverse PSF models can be further refined via perturbation techniques. A critical aspect of the new PSF models is that they minimize pixel-phase systematic errors that affect measurements made with the library PSF in extreme focus conditions. Future analyses will comprise the construction of focus-diverse PSF models for the several other commonly used filters of the ACS/WFC. A handful of stars in an image will then be enough to identify the closest focus-diverse PSFs to the particular focus level of any image. These PSFs can then be interpolated to provide a precise set of PSF models for the particular focus of the image. The new focus-diverse PSF models will be compatible with the hst1pass software package (Anderson in preparation).
22 22 Far future plans involve the construction of an interactive web tool that, given an image and a position on either the flc or the drc files, returns the optimal PSF model for that position, resampled to the drc pixel space if needed. References Anderson, J., & King, I. R. 2000, PASP, 112, 1360 Anderson, J., & King, I. R. 2006, ACS-ISR Anderson, J., & Bedin, L. R. 2017, MNRAS, 470, 948 Bellini, A., Anderson, J., van der Marel, R. P., et al. 2014, ApJ, 797, 115 Bellini A., Anderson, J., Bedin, L. R., et al. 2017, ApJ, 84, 6 Di Nino, D., Makidon, R. B., Lallo, M., et al. 2008, ACS-ISR Hoffmann, S., & Anderson, J. 2017, ASC-ISR Niemi, S.-M., & Lallo, M. 2010, ISR TEL Sahu, K. C., Lallo, M., & Makidon, R. B. 2007, ACS-ISR
The Impact of x-cte in the WFC3/UVIS detector on Astrometry
 Instrument Science Report WFC3 2014-02 The Impact of x-cte in the WFC3/UVIS detector on Astrometry Jay Anderson April 4, 2014 ABSTRACT Recent observations of the center of globular cluster Omega Centauri
Evaluation of a temperaturebased
 Instrument Science Report TEL 2011-01 Evaluation of a temperaturebased HST Focus Model Colin Cox and Sami-Matias Niemi. March 22, 2011 ABSTRACT A study of the history of the HST focus measurements compared
Breathing, Position Drift, and PSF Variations on the UVIS Detector
 SPACE TELESCOPE SCIENCE INSTITUTE Operated for NASA by AURA Instrument Science Report WFC3 1-1 Breathing, Position Drift, and PSF Variations on the UVIS Detector L. Dressel July 13, 1 ABSTRACT This study
Study of the evolution of the ACS/WFC sensitivity loss
 Instrument Science Report ACS 2013 01 Study of the evolution of the ACS/WFC sensitivity loss Leonardo Úbeda and Jay Anderson Space Telescope Science Institute January 28, 2013 ABSTRACT We present a study
HST Temporal Optical Behavior: Models and Measurements with ACS
 2005 HST Calibration Workshop Space Telescope Science Institute, 2005 A. Koekemoer, P. Goudfrooij, and L. Dressel, eds. HST Temporal Optical Behavior: Models and Measurements with ACS R. B. Makidon, S.
A Study of the Time Variability of the PSF in F606W Images taken with WFC3/UVIS
 Instrument Science Report WFC3 2015-08 A Study of the Time Variability of the PSF in F606W Images taken with WFC3/UVIS Jay Anderson, Matthew Bourque, Kailash Sahu, Elena Sabbi, Alex Viana May 28, 2015
Cross-Talk in the ACS WFC Detectors. I: Description of the Effect
 Cross-Talk in the ACS WFC Detectors. I: Description of the Effect Mauro Giavalisco August 10, 2004 ABSTRACT Images acquired with the Wide Field Channel (WFC) of the Advanced Camera for Surveys (ACS) are
WFC3/UVIS and IR Multi-Wavelength Geometric Distortion
 SPACE TELESCOPE SCIENCE INSTITUTE Operated for NASA by AURA Instrument Science Report WFC 2012-07 WFC3/UVIS and IR Multi-Wavelength Geometric Distortion V. Kozhurina-Platais, M. Dulude, T. Dahlen, C. Cox
ACS PSF variations with temperatures
 Instrument Science Report ACS 07-12 ACS PSF variations with temperatures Kailash C. Sahu, Matt Lallo, Russ Makidon September 18, 2007 ABSTRACT We have used the HST ACS/WFC observations of a Galactic bulge
Here Be Dragons: Characterization of ACS/WFC Scattered Light Anomalies
 Instrument Science Report ACS 2016-06 Here Be Dragons: Characterization of ACS/WFC Scattered Light Anomalies Blair Porterfield, Dan Coe, Shireen Gonzaga, Jay Anderson, Norman Grogin November 1, 2016 Abstract
Space-Based Imaging Astrometry: Life with an Undersampled PSF. Jay Anderson STScI Feb 15, 2012
 Space-Based Imaging Astrometry: Life with an Undersampled PSF Jay Anderson STScI Feb 15, 2012 Overview of the Talk Astrometry with HST 3 critical issues Science General Microlensing Extensions to WFIRST
FLAT FIELDS FROM THE MOONLIT EARTH
 Instrument Science Report WFPC2 2008-01 FLAT FIELDS FROM THE MOONLIT EARTH R. C. Bohlin, J. Mack, and J. Biretta 2008 February 4 ABSTRACT The Earth illuminated by light from the full Moon was observed
WFC3 IR Blobs, IR Sky Flats and the measured IR background levels
 The 2010 STScI Calibration Workshop Space Telescope Science Institute, 2010 Susana Deustua and Cristina Oliveira, eds. WFC3 IR Blobs, IR Sky Flats and the measured IR background levels N. Pirzkal 1 Space
The in-orbit wavelength calibration of the WFC G800L grism
 The in-orbit wavelength calibration of the WFC G800L grism A. Pasquali, N. Pirzkal, J.R. Walsh March 5, 2003 ABSTRACT We present the G800L grism spectra of the Wolf-Rayet stars WR45 and WR96 acquired with
APLUS: A Data Reduction Pipeline for HST/ACS and WFC3 Images
 APLUS: A Data Reduction Pipeline for HST/ACS and WFC3 Images Wei Zheng 1,AmitSaraff 2,3,LarryBradley 4,DanCoe 4,AlexViana 4 and Sara Ogaz 4 1 Department of Physics and Astronomy, Johns Hopkins University,
Photometric Techniques II Data analysis, errors, completeness
 Photometric Techniques II Data analysis, errors, completeness Sergio Ortolani Dipartimento di Astronomia Universita di Padova, Italy. The fitting technique assumes the linearity of the intensity values
NICMOS Status and Plans
 1997 HST Calibration Workshop Space Telescope Science Institute, 1997 S. Casertano, et al., eds. NICMOS Status and Plans Rodger I. Thompson Steward Observatory, University of Arizona, Tucson, AZ 85721
Calibration Goals and Plans
 CHAPTER 13 Calibration Goals and Plans In This Chapter... Expected Calibration Accuracies / 195 Calibration Plans / 197 This chapter describes the expected accuracies which should be reached in the calibration
Accuracy of the HST Standard Astrometric Catalogs w.r.t. Gaia
 Instrument Science Report WFC3 2018-01 Accuracy of the HST Standard Astrometric Catalogs w.r.t. Gaia V. Kozhurina-Platais, N. Grogin, E. Sabbi February 16, 2018 Abstract The goal of astrometric calibration
First On-orbit Measurements of the WFC3-IR Count-rate Non-Linearity
 First On-orbit Measurements of the WFC3-IR Count-rate Non-Linearity A. G. Riess March 10, 2010 ABSTRACT Previous HgCdTe detectors on HST have suffered from a count-rate dependent non-linearity, motivating
Keeping the Hubble Space Telescope in focus.
 Keeping the Hubble Space Telescope in focus. Colin Cox and Matthew Lallo, Space Telescope Science Institute, 3700 San Martin Drive, Baltimore, Maryland, 21218 ABSTRACT The Hubble Space Telescope is a Ritchie-Chrétien
The WFC3 IR Blobs Monitoring
 The WFC3 IR Blobs Monitoring N. Pirzkal, B. Hilbert Nov 13, 2012 ABSTRACT We present new results on the WFC3 IR Blobs based on analysis of data acquired using the WFC3 IR channel from 2010 to 2012. In
Earth Flats. 1. Introduction. Instrument Science Report ACS R. C. Bohlin, J. Mack, G. Hartig, & M. Sirianni October 25, 2005
 Instrument Science Report ACS 2005-12 Earth Flats R. C. Bohlin, J. Mack, G. Hartig, & M. Sirianni October 25, 2005 ABSTRACT Since the last ISR 2003-02 on the use of Earth observations for a source of flat
The Accuracy of WFPC2 Photometric Zeropoints
 The Accuracy of WFPC2 Photometric Zeropoints Inge Heyer, Marin Richardson, Brad Whitmore, Lori Lubin July 23, 2004 ABSTRACT The accuracy of WFPC2 photometric zeropoints is examined using two methods. The
Astrometric Performance of STIS CCD CTI Corrections on Omega Cen Images
 Instrument Science Report STIS 2015-05 Astrometric Performance of STIS CCD CTI Corrections on Omega Cen Images John Biretta, Sean Lockwood, and John Debes September 28, 2015 ABSTRACT We are in the process
Improving the Absolute Astrometry of HST Data with GSC-II
 The 2005 HST Calibration Workshop Space Telescope Science Institute, 2005 A. M. Koekemoer, P. Goudfrooij, and L. L. Dressel, eds. Improving the Absolute Astrometry of HST Data with GSC-II A. M. Koekemoer,
Calibration of ACS Prism Slitless Spectroscopy Modes
 The 2005 HST Calibration Workshop Space Telescope Science Institute, 2005 A. M. Koekemoer, P. Goudfrooij, and L. L. Dressel, eds. Calibration of ACS Prism Slitless Spectroscopy Modes S. S. Larsen, M. Kümmel
Updated flux calibration and fringe modelling for the ACS/WFC G800L grism
 Updated flux calibration and fringe modelling for the ACS/WFC G800L grism H. Kuntschner, M. Kümmel, J. R. Walsh January 25, 2008 ABSTRACT A revised flux calibration is presented for the G800L grism with
WFC3 Calibration Using Galactic Clusters
 Instrument Science Report WFC3 2009-006 WFC3 Calibration Using Galactic Clusters E. Sabbi, J. Kalirai, A. Martel, S. Deustua, S.M. Baggett, T. Borders, H. Bushouse, M. Dulude, B. Hilbert, J. Kim Quijano,
ACS after SM4: RELATIVE GAIN VALUES AMONG THE FOUR WFC AMPLIFIERS
 Instrument Science Report ACS 2009-03 ACS after SM4: RELATIVE GAIN VALUES AMONG THE FOUR WFC AMPLIFIERS R. C. Bohlin, A. Maybhate, & J. Mack 2009 October 8 ABSTRACT For the default setting of gain=2, the
Relative Astrometry Within ACS Visits
 Instrument Science Report ACS 2006-005 Relative Astrometry Within ACS Visits Richard L. White August 07, 2006 ABSTRACT The log files from APSIS, the ACS science team s image processing pipeline, have been
Lab 4: Differential Photometry of an Extrasolar Planetary Transit
 Lab 4: Differential Photometry of an Extrasolar Planetary Transit Neil Lender 1, Dipesh Bhattarai 2, Sean Lockwood 3 December 3, 2007 Abstract An upward change in brightness of 3.97 ± 0.29 millimags in
AstroBITS: Open Cluster Project
 AstroBITS: Open Cluster Project I. Introduction The observational data that astronomers have gathered over many years indicate that all stars form in clusters. In a cloud of hydrogen gas, laced with helium
Time Dependence of ACS WFC CTE Corrections for Photometry and Future Predictions
 Time Dependence of ACS WFC CTE Corrections for Photometry and Future Predictions Adam Riess, Jennifer Mack May 5, 2004 ABSTRACT We present measurements of photometric losses due to imperfect parallel and
WFPC2 Cycle 7 Calibration Plan
 Instrument Science Report WFPC2-97-06 WFPC2 Cycle 7 Calibration Plan S. Casertano and the WFPC2 group August 18, 1997 ABSTRACT This report describes in detail the WFPC2 observations planned to maintain
WFC3/IR Persistence as Measured in Cycle 17 using Tungsten Lamp Exposures
 WFC3/IR Persistence as Measured in Cycle 17 using Tungsten Lamp Exposures Knox S. Long, Sylvia Baggett, Susana Deustua & Adam Riess November 17, 2010 ABSTRACT Like most IR arrays, the IR detector incorporated
Extraction of Point Source Spectra from STIS Long Slit Data
 1997 HST Calibration Workshop Space Telescope Science Institute, 1997 S. Casertano, et al., eds. Extraction of Point Source Spectra from STIS Long Slit Data J. R. Walsh Spect Telescope European Coordinating
Persistence in the WFC3 IR Detector: Spatial Variations
 SPACE TELESCOPE SCIENCE INSTITUTE Operated for NASA by AURA WFC3 Instrument Science Report 2015-16 Persistence in the WFC3 IR Detector: Spatial Variations Knox S. Long, Sylvia M. Baggett, & John W. MacKenty
WFC3/UVIS Photometric Transformations
 Instrument Science Report WFC3 2014-016 WFC3/UVIS Photometric Transformations Kailash Sahu, Susana Deustua and Elena Sabbi January 05, 2017 ABSTRACT We provide photometric transformation coefficients for
Performance of the NICMOS ETC Against Archived Data
 Performance of the NICMOS ETC Against Archived Data M. Sosey June 19, 2001 ABSTRACT A robust test of the newest version of the NICMOS Exposure Time Calculator (ETC) was conducted in order to assess its
C. Watson, E. Churchwell, R. Indebetouw, M. Meade, B. Babler, B. Whitney
 Reliability and Completeness for the GLIMPSE Survey C. Watson, E. Churchwell, R. Indebetouw, M. Meade, B. Babler, B. Whitney Abstract This document examines the GLIMPSE observing strategy and criteria
Dark Rate of the STIS NUV Detector
 SPACE TELESCOPE SCIENCE INSTITUTE Operated for NASA by AURA Instrument Science Report STIS 2011-03 Dark Rate of the STIS NUV Detector Wei Zheng 1, Charles Proffitt 2, and David Sahnow 1 1 Department of
What do we do with the image?
 Astro 150 Spring 2018: Lecture 7 page 1 Reading: Chapter 6, Sect. 6.4; Chapter 14 + assignment posted on Astro 150 website Homework: questions on special reading - answers due in lecture Thursday Exam
Data Processing in DES
 Data Processing in DES Brian Yanny Oct 28, 2016 http://data.darkenergysurvey.org/fnalmisc/talk/detrend.p Basic Signal-to-Noise calculation in astronomy: Assuming a perfect atmosphere (fixed PSF of p arcsec
Lecture 8. October 25, 2017 Lab 5
 Lecture 8 October 25, 2017 Lab 5 News Lab 2 & 3 Handed back next week (I hope). Lab 4 Due today Lab 5 (Transiting Exoplanets) Handed out and observing will start Friday. Due November 8 (or later) Stellar
BetaDrizzle: A Redesign of the MultiDrizzle Package
 The 2010 STScI Calibration Workshop Space Telescope Science Institute, 2010 Susana Deustua and Cristina Oliveira, eds. BetaDrizzle: A Redesign of the MultiDrizzle Package A. S. Fruchter, W. Hack, N. Dencheva,
CLASH MCT Program Progress Report. Progress Report on the CLASH Multi-Cycle Treasury Program By Marc Postman
 Progress Report on the CLASH Multi-Cycle Treasury Program By Marc Postman CLASH Summary and Science Priorities: The Cluster Lensing and Supernova survey with Hubble (CLASH) couples the gravitational lensing
The TV3 ground calibrations of the WFC3 NIR grisms
 The TV3 ground calibrations of the WFC3 NIR grisms H. Kuntschner, H. Bushouse, J. R. Walsh, M. Kümmel July 10, 2008 ABSTRACT Based on thermal vacuum tests (TV3; March/April 2008), the performance of the
People Involved. PAST STAFF: Pierre Bély, John Hershey, John Krist, George Hartig, Hashima Hasan, Chris Burrows, Kamel Houari, others.
 People Involved PAST STAFF: Pierre Bély, John Hershey, John Krist, George Hartig, Hashima Hasan, Chris Burrows, Kamel Houari, others. PRESENT STAFF: Stefano Casertano, Russ Makidon, Ron Gilliland, Matt
WFC3 TV3 Testing: Orbital Cycling Effects on IR Images
 WFC3 TV3 Testing: Orbital Cycling Effects on IR Images H. Bushouse March 26, 2009 ABSTRACT Orbital cycling tests were performed on WFC3 during Thermal-Vacuum test #3 in order to assess the impact of changing
ACS CCDs UV and narrowband filters red leak check
 Instrument Science Report ACS 2007-03 ACS CCDs UV and narrowband filters red leak check Marco Chiaberge and Marco Sirianni May 01, 2007 ABSTRACT We present results of the observations of the star 15 Mon,
On-orbit Calibration of ACS CTE Corrections for Photometry
 On-orbit Calibration of ACS CTE Corrections for Photometry Adam Riess August 15, 2003 ABSTRACT We present the first on-orbit calibration of the photometric losses due to imperfect CTE on ACS HRC and WFC.
COS FUV Focus Determination for the G140L Grating
 Instrument Science Report COS 2012-01 COS FUV Focus Determination for the G140L Grating Parviz Ghavamian 1 Space Telescope Science Institute, Baltimore, MD October 03, 2012 ABSTRACT The procedures for
Improved Photometry for G750L
 SPACE TELESCOPE SCIENCE INSTITUTE Operated for NASA by AURA Instrument Science Report STIS 2015-01(v1) Improved Photometry for G750L R.C. Bohlin 1, C.R. Proffitt 1 1 Space Telescope Science Institute,
Open Cluster Research Project
 Open Cluster Research Project I. Introduction The observational data indicate that all stars form in clusters. In a cloud of hydrogen gas, laced with helium and a trace of other elements, something triggers
Kepler photometric accuracy with degraded attitude control
 Kepler photometric accuracy with degraded attitude control Hans Kjeldsen, Torben Arentoft and Jørgen Christensen-Dalsgaard KASOC, Stellar Astrophysics Centre, Aarhus University, Denmark - 25 July 2013
A Fast Algorithm for Cosmic Rays Removal from Single Images
 A Fast Algorithm for Cosmic Rays Removal from Single Images Wojtek Pych David Dunlap Observatory, University of Toronto P.O. Box 360, Richmond Hill, Ontario, Canada L4C 4Y6 and Copernicus Astronomical
Observer Anomaly(?): Recent Jitter and PSF Variations
: Recent Jitter and PSF Variations") Instrument Science Report TEL 2005-01 Observer Anomaly(?): Recent Jitter and PSF Variations R. L. Gilliland gillil@stsci.edu February 2005 Abstract An anomaly in the HST Pointing Control System (PCS) has
Instrument Science Report TEL 2005-01 Observer Anomaly(?): Recent Jitter and PSF Variations R. L. Gilliland gillil@stsci.edu February 2005 Abstract An anomaly in the HST Pointing Control System (PCS) has
The Cygnus Loop/Veil Nebula Hubble Space Telescope. William P. Blair Department of Physics and Astronomy The Johns Hopkins University September, 2015
 The Cygnus Loop/Veil Nebula Hubble Space Telescope William P. Blair Department of Physics and Astronomy The Johns Hopkins University September, 2015 Overall context: The Cygnus Loop, or Veil Nebula as
Data Reduction - Optical / NIR Imaging. Chian-Chou Chen Ph319
 Data Reduction - Optical / NIR Imaging Chian-Chou Chen (T.C.) @ Ph319 Images at different wavelengths... Images at different wavelengths... However, the raw data are always not as pretty Why? The total
SBC L-Flat Corrections and Time-Dependent Sensitivity
 SBC L-Flat Corrections and Time-Dependent Sensitivity J. Mack, R. Gilliland, R. van der Marel, and R. Bohlin November 17, 2005 ABSTRACT The uniformity of the SBC detector response has been assessed using
SBC FLATS: PRISM P-FLATS and IMAGING L-FLATS
 Instrument Science Report ACS 2006-08 SBC FLATS: PRISM P-FLATS and IMAGING L-FLATS R. C. Bohlin & J. Mack December 2006 ABSTRACT The internal deuterium lamp was used to illuminate the SBC detector through
Commissioning of the Hanle Autoguider
 Commissioning of the Hanle Autoguider Copenhagen University Observatory Edited November 10, 2005 Figure 1: First light image for the Hanle autoguider, obtained on September 17, 2005. A 5 second exposure
OPTICAL PHOTOMETRY. Observational Astronomy (2011) 1
 1") OPTICAL PHOTOMETRY Observational Astronomy (2011) 1 The optical photons coming from an astronomical object (star, galaxy, quasar, etc) can be registered in the pixels of a frame (or image). Using a ground-based
OPTICAL PHOTOMETRY Observational Astronomy (2011) 1 The optical photons coming from an astronomical object (star, galaxy, quasar, etc) can be registered in the pixels of a frame (or image). Using a ground-based
Updates to the COS/NUV Dispersion Solution Zero-points
 Instrument Science Report COS 017-0 Updates to the COS/NUV Dispersion Solution Zero-points Rachel Plesha 1, Paule Sonnentrucker 1,, Cristina Oliveira 1, Julia Roman-Duval 1 1 Space Telescope Science Institute,
High accuracy imaging polarimetry with NICMOS
 Rochester Institute of Technology RIT Scholar Works Articles 11-6-28 High accuracy imaging polarimetry with NICMOS Daniel Batcheldor G. Schneider D.C. Hines Follow this and additional works at: http://scholarworks.rit.edu/article
Detection of Exoplanets Using the Transit Method
 Detection of Exoplanets Using the Transit Method De nnis A fanase v, T h e Geo rg e W a s h i n g t o n Un i vers i t y, Washington, DC 20052 dennisafa@gwu.edu Abstract I conducted differential photometry
WFPC2 Dark Current vs. Time
 WFPC2 Dark Current vs. Time J. Mack, J. Biretta, S. Baggett, C. Proffitt June 7, 2001 ABSTRACT On-going measurements of the dark current in the WFPC2 detectors indicate that the average level of dark current
Scattered Light from the Earth Limb Measured with the STIS CCD
 Instrument Science Report STIS 98 21 Scattered Light from the Earth Limb Measured with the STIS CCD Dick Shaw, Merle Reinhart, and Jennifer Wilson 17 June 1998 ABSTRACT We describe a recent program to
1. INTRODUCTION ABSTRACT
 Simulations of E-ELT telescope effects on AO system performance Miska Le Louarn* a, Pierre-Yves Madec a, Enrico Marchetti a, Henri Bonnet a, Michael Esselborn a a ESO, Karl Schwarzschild strasse 2, 85748,
1 The Preliminary Processing
 AY 257 Modern Observational Techniques...23 1 The Preliminary Processing Frames must be corrected for a bias level and quantum efficiency variations on all scales. For a minority of CCDs and most near-ir
Predicted Countrates for the UV WFC3 Calibration Subsystem using Deuterium Lamps
 Predicted Countrates for the UV WFC3 Calibration Subsystem using Deuterium Lamps S.Baggett, J. Sullivan, and M. Quijada May 17,24 ABSTRACT Predicted WFC3 calibration subsystem countrates have been computed
PROJECT GLOBULAR CLUSTERS
 PROJECT 5 GLOBULAR CLUSTERS Objective: The objective of this exercise is the calculation of the core and tidal radius of a globular cluster in the Milky Way. Measure the tidal radius of a globular cluster
Fringe Correction for STIS Near-IR Long-Slit Spectra using Contemporaneous Tungsten Flat Fields
 1997 HST Calibration Workshop Space Telescope Science Institute, 1997 S. Casertano, et al., eds. Fringe Correction for STIS Near-IR Long-Slit Spectra using Contemporaneous Tungsten Flat Fields Paul Goudfrooij
Transiting Exoplanet in the Near Infra-red for the XO-3 System
 Transiting Exoplanet in the Near Infra-red for the XO-3 System Nathaniel Rodriguez August 26, 2009 Abstract Our research this summer focused on determining if sufficient precision could be gained from
High Signal-to-Noise, Differential NICMOS Spectrophotometry
 Instrument Science Report NICMOS 2003-001 High Signal-to-Noise, Differential NICMOS Spectrophotometry R.L. Gilliland, S. Arribas January 7, 2003 ABSTRACT We report analysis for NICMOS CAL/9642, High S/N
Absolute Flux Calibration for STIS First-Order, Low-Resolution Modes
 Instrument Science Report STIS 97-14 Absolute Flux Calibration for STIS First-Order, Low-Resolution Modes Ralph Bohlin, Space Telescope Science Institute Nicholas Collins, Hughes STX/LASP/GSFC Anne Gonnella,
An Algorithm for Correcting CTE Loss in Spectrophotometry of Point Sources with the STIS CCD
 An Algorithm for Correcting CTE Loss in Spectrophotometry of Point Sources with the STIS CCD Ralph Bohlin and Paul Goudfrooij August 8, 2003 ABSTRACT The correction for the change in sensitivity with time
Attempts to Mitigate Trapping Effects in Scanned Grism Observations of Exoplanet Transits with WFC3/IR
 SPACE TELESCOPE SCIENCE INSTITUTE Operated for NASA by AURA WFC3 Instrument Science Report 2014-14 Attempts to Mitigate Trapping Effects in Scanned Grism Observations of Exoplanet Transits with WFC3/IR
The shapes of faint galaxies: A window unto mass in the universe
 Lecture 15 The shapes of faint galaxies: A window unto mass in the universe Intensity weighted second moments Optimal filtering Weak gravitational lensing Shear components Shear detection Inverse problem:
Project for Observational Astronomy 2018/2019: Colour-magnitude diagram of an open cluster
 Project for Observational Astronomy 018/019: Colour-magnitude diagram of an open cluster Søren S. Larsen November 9, 018 1 1 Colour-magnitude diagram for an open cluster 1.1 Background The colour-magnitude
COS FUV Dispersion Solution Verification at the New Lifetime Position
 SPACE TELESCOPE SCIENCE INSTITUTE Operated for NASA by AURA Instrument Science Report COS 2013-06(v1) COS FUV Dispersion Solution Verification at the New Lifetime Position Paule Sonnentrucker 1, Julia
arxiv:astro-ph/ v1 12 Nov 2003
 A Fast Algorithm for Cosmic Rays Removal from Single Images Wojtek Pych arxiv:astro-ph/0311290v1 12 Nov 2003 David Dunlap Observatory, University of Toronto P.O. Box 360, Richmond Hill, Ontario, Canada
Lecture 9. November 1, 2018 Lab 5 Analysis
 Lecture 9 November 1, 2018 Lab 5 Analysis News Lab 2 Handed back with solution; mean: 92.1, std dev: 5.5 Lab 3 Handed back next week (I hope). Lab 4 Due November 1 (today) News Lab 5 (Transiting Exoplanets)
Lab 7: The H-R Diagram of an Open Cluster
 Lab 7: The H-R Diagram of an Open Cluster Due Date: 2007 Nov 27 (after thanksgiving) 1 Introduction: The HR Diagram In this two week project you will do absolute (not differential) photometry with a CCD
GALEX GR1 Instrument Performance and Calibration Review
 GALEX GR1 Instrument Performance and Calibration Review Patrick Morrissey Caltech Operations Overview GALEX is operating quite smoothly in 2004. Active space weather has mostly dissipated. FUV is shut
WFC3 Cycle 18 Calibration Program
 Instrument Science Report WFC3 2011-14 WFC3 Cycle 18 Calibration Program S. Deustua June 30 2011 The WFC3 Cycle 18 Calibration Program runs from October 2010 through September 2011, and will measure and
You, too, can make useful and beautiful astronomical images at Mees: Lesson 3
 You, too, can make useful and beautiful astronomical images at Mees: Lesson 3 Calibration and data reduction Useful references, besides Lessons 1 and 2: The AST 142 Projects manual: http://www.pas.rochester.edu/~dmw/ast142/projects/project.pdf
SPACE TELESCOPE SCIENCE INSTITUTE. ACS Polarization Calibration: Introduction and Progress Report
 1 ACS Polarization Calibration: Introduction and Progress Report J. Biretta, V. Platais, F. Boffi, W. Sparks, J. Walsh Introduction: Theory / ACS Polarizers / Supported Modes Potential Issues for ACS Polarization
The Effective Spectral Resolution of the WFC and HRC Grism
 The Effective Spectral Resolution of the WFC and HRC Grism A. Pasquali, N. Pirzkal, J.R. Walsh, R.N. Hook, W. Freudling, R. Albrecht, R.A.E. Fosbury March 7, 2001 ABSTRACT We present SLIM simulations of
Ay Fall 2012 Imaging and Photometry Part I
 Ay 122 - Fall 2012 Imaging and Photometry Part I (Many slides today c/o Mike Bolte, UCSC) Imaging and Photometry Now essentially always done with imaging arrays (e.g., CCDs); it used to be with single-channel
Virgo Ego Scientific Forum VESF school 2011 Optical Image Analysis Tutorial by Marica Branchesi
 Virgo Ego Scientific Forum VESF school 2011 Optical Image Analysis Tutorial by Marica Branchesi The main goal of present laboratory is to introduce the students to Optical Image Analysis processing for
Selection of stars to calibrate Gaia
 Highlights of Spanish Astrophysics VIII, Proceedings of the XI Scientific Meeting of the Spanish Astronomical Society held on September 8 12, 2014, in Teruel, Spain. A. J. Cenarro, F. Figueras, C. Hernández-
CHAPTER 10 Techniques for Background Measurement and Mosaicing
 CHAPTER 10 Techniques for Background Measurement and Mosaicing In This Chapter... Introduction / 139 Chopping and Dithering Strategies / 141 Chopping and Dithering Patterns / 143 Examples / 147 Orienting
7. Telescopes: Portals of Discovery Pearson Education Inc., publishing as Addison Wesley
 7. Telescopes: Portals of Discovery Parts of the Human Eye pupil allows light to enter the eye lens focuses light to create an image retina detects the light and generates signals which are sent to the
RADIATION DAMAGE IN HST DETECTORS
 RADIATION DAMAGE IN HST DETECTORS Marco Sirianni, European Space Agency, Space Telescope Science Institute Max Mutchler, Space Telescope Science Institute Abstract: Key words: We present an analysis of
Updated Measurements of ACS/SBC Dark Rates
 Instrument Science Report ACS 2017-04 Updated Measurements of ACS/SBC Dark Rates R.J. Avila May 3, 2017 Abstract The results of dark rate monitoring programs for the ACS/SBC are presented here. The dark
AAG TPoint Mapper (Version 1.40)
") AAG TPoint Mapper (Version 1.40) AAG_TPointMapper works together with Maxim DL, Pinpoint, TheSky6 and TPoint to automate the process of building a TPoint model for a GOTO telescope connected to TheSky6.
AAG TPoint Mapper (Version 1.40) AAG_TPointMapper works together with Maxim DL, Pinpoint, TheSky6 and TPoint to automate the process of building a TPoint model for a GOTO telescope connected to TheSky6.
1. Give short answers to the following questions. a. What limits the size of a corrected field of view in AO?
 Astronomy 418/518 final practice exam 1. Give short answers to the following questions. a. What limits the size of a corrected field of view in AO? b. Describe the visibility vs. baseline for a two element,
Exploring Data. Keck LRIS spectra. Handbook of CCD Astronomy by Steve Howell Chap. 4, parts of 6
 Exploring Data Keck LRIS spectra Handbook of CCD Astronomy by Steve Howell Chap. 4, parts of 6 FITS: Flexible Image Transport System Digital file format used to store astronomical images, data, and catalogs.