The use of high density concrete in the armourlayer of breakwaters
|
|
|
- Virgil Hancock
- 5 years ago
- Views:
Transcription
 Prof. Ir. K. d Angremond (TUDelft) Dr. Ir. M.R.A. van Gent (WL Delft Hydraulics) Ir. W.D.A. van t Zelfde (De Weger architects and consulting engineers) Ir.")
1 The use of high-density concrete in the armourlayer of breakwaters The use of high density concrete in the armourlayer of breakwaters Flume tests on high density concrete elements R. Triemstra, master thesis Committee: Prof. Dr. Ir. J.C. Walraven (TUDelft) Prof. Ir. K. d Angremond (TUDelft) Dr. Ir. M.R.A. van Gent (WL Delft Hydraulics) Ir. W.D.A. van t Zelfde (De Weger architects and consulting engineers) Ir. J.M.J. Spijkers (TUDelft) february 2000 PREFACE Flume tests on high density concrete elements
2 The use of high-density concrete in the armourlayer of breakwaters This report is part of my master thesis at Delft University of Technology, The Netherlands. It describes flume tests performed at WL Delft Hydraulics during October The model tests investigate the behaviour of high-density concrete armour elements under wave attack. In the first part of this report a general study on breakwater design in the past is given. In the second part of this report the results of the model tests on high-density concrete elements are presented. A comparison with normal density concrete elements is made and a conclusion about the validity of stability formulae is drawn. Acknowledged are the members of the committee for the given support and assistance. Special thanks to WL Delft Hydraulics, and MINELCO for making the flume tests possible. Roelof Triemstra February 2000 Flume tests on high density concrete elements
3 The use of high-density concrete in the armourlayer of breakwaters ABSTRACT Introduction The stability of armour units is described by several formulae like Iribarren s, Hudson s and Van der Meer s. In these formulae the required weight of the armour elements depends strongly on the density of the used material. Therefore it may be useful to change this density. According to the stability formulae, higher density will result in lighter and smaller units. Smaller units may reduce the costs. Literature study In all formulae the stability of armour elements is expressed by the dimensionless stability number H s / D. This stability number is a function of several parameters like unit shape, placing method, slope angle etc. In this function or ρ are not present but there is a linear relation between H s /D and. Stability formulae for breakwater armour elements are based on model experiments with elements with densities up to approximately 3200 kg/m 3. In the past several improvements on stability formulae and breakwater design were made. Several different shapes of armour units were developed and wave spectra were introduced in flume testing. By these improvements the stability formulae are refined and validated. Now it is possible to make concrete with a density up to 4000 kg/m 3. According to the stability formulae this will result in very small and light armour units. But the stability formulae are until now not validated for densities up to 4000 kg/m 3. It is not known whether the linear relation between H s /D and is still valid for these densities or not. In order to investigate the validity of stability formulae and the linear relation between H s /D and for high densities, experiments are recommended. Flume tests During October 1999 flume tests on concrete elements with a density up to 4000 kg/m 3 were performed in the Scheldt Basin of WL Delft Hydraulics, location de Voorst, The Netherlands. In order to investigate whether these high-density elements behave as expected and to compare the test results also tests with normal density (approximately 2300 kg/m 3 ) were performed. The elements were attacked by irregular waves. Elements were placed by hand as well as dumped on the slope. It is concluded that the high density and normal density concrete elements do behave in a different way during placing of the elements. High-density concrete elements tend to lay more random on a slope. In order to compare test results in a correct way a new criterion, called laying-roughness is developed. Conclusions The following main conclusions are drawn: - The high-density concrete elements in this investigation are under equal loading conditions at least as stable as the normal density concrete elements. - The high-density concrete elements do behave as expected based on stability formulae. - The linear relation between H s /D and in the stability formulae for armour elements is still valid for densities up to 4000 kg/m 3. Flume tests on high density concrete elements
4 The use of high-density concrete in the armourlayer of breakwaters CONTENTS page PREFACE ABSTRACT CONTENTS INTRODUCTION General Problem BREAKWATER DESIGN General Iribarren Hudson General Tests set-up Wave climate Volume weights Determination of damage Conclusions Van der Meer General Test set-up Wave climate Volume weights Determination of damage Conclusions Comparison of formulae DEVELOPMENT OF ARMOURELEMENTS IN BREAKWATERDESIGN General High density Concrete Expectations on High Density Concrete Experiments with High Density Concrete CONCLUSIONS AND FORMULATION OF PROBLEM General Tests Flume tests on high density concrete elements 1
5 The use of high-density concrete in the armourlayer of breakwaters 4.3 Type of elements Comparing the results GEOMETRY OF STRUCTURE Introduction Armourlayer and elements Filterlayers Slope angle Crest-height Foreshore and waterdepth TEST EQUIPMENT AND PROCEDURE WAVE CLIMATE TEST PROGRAM RESULTS OF PLACING METHODS Problems Roughness Visualising the roughness Conclusion TEST RESULTS Introduction Normal density concrete elements General Stability curves Discussion High density concrete elements General Stability curves Discussion Comparing High Density to Normal Density Concrete elements Introduction Comparison based on roughness of laying criterion Discussion Flume tests on high density concrete elements 2
6 The use of high-density concrete in the armourlayer of breakwaters 10.5 Validity of stability formulae for high densities CONCLUSIONS AND RECOMMENDATIONS Conclusions Recommendations REFERENCES LIST OF SYMBOLS LIST OF TABLES LIST OF FIGURES LIST OF FORMULAE APPENDIX A: CONSIDERATIONS AND DICISIONS APPENDIX B: CROSS SECTION OF TESTED STRUCTURE APPENDIX C: FILTER LAYERS AND CORE MATERIAL APPENDIX D: SCHELDT BASIN AND PLACES OF WAVE GAUGES APPENDIX E: RELATION DEEP WATER WAVE SHALLOW WATER WAVE APPENDIX F: EXCEENDANCE CURVES AND ENERGY DENSITY SPRECTRA APPENDIX G: TEST SCHEDULE AND TEST RESULTS APPENDIX H: PICTURES OF SLOPES BEFORE AND AFTER TESTING APPENDIX I: PICTURES USED FOR DETERMINING ROUGHNESS Flume tests on high density concrete elements 3
7 The use of high-density concrete in the armourlayer of breakwaters 1 INTRODUCTION 1.1 General De Weger Architects and Consulting Engineers and MINELCO (a Swedish supplier of magnetite) are interested in using concrete elements with a volume weight of approximately 4000 kg/m 3 in the armourlayer of breakwaters. Such high densities can be reached by using magnetite (iron ore) as concrete aggregate. The stability of armour units is described by several formulae like Iribarren s, Hudson s and Van der Meer s. In all formulae the stability of armour elements is expressed by the dimensionless stability number H s / D. This stability number is a function of several parameters like unit shape, placing method, slope angle etc. In this function or ρ are not present but there is a linear relation between H s /D and. According to the stability formulae, higher density will result in smaller and lighter units. Smaller units may reduce the costs. Example (Van t Zelfde, [1998]): Aveco has studied the effects if, in breakwaters at the Maasvlakte, blocks with a higher bulk density were used. This study shows that for concrete elements with a bulk density of 2.2 tons/m 3, elements with a weight of 42.5 tons will be required. With equal loading conditions concrete elements with a volume weight of 4.0 tons/m 3, only have to weigh 5 tons. Furthermore the layer thickness of the concrete elements reduces from 5.5 to 2.4 m. Stability formulae are based on experiments with elements with densities up to approximately 3200 kg/m 3. Uncertain is whether these formulae are valid for densities up to 4000 kg/m 3 or not. An expectation of the behaviour of high-density units based on the formulae is therefore not enough. Experiments have to be taken to investigate the validity of stability formulae and the linear relation between H s / D for densities up to 4000 kg/m Problem The problem studied in this report is: Are stability formulae for breakwater armour elements still valid when high densities are used? The aim of the investigation is to make a comparison between the stability of armour-elements of high-density concrete and normal density concrete and to draw a conclusion about the validity of stability formulae for elements with high density (up to 4000kg/m 3 ). Flume tests on high density concrete elements 4
8 The use of high-density concrete in the armourlayer of breakwaters PART ONE LITERATURE STUDY Flume tests on high density concrete elements 5
9 The use of high-density concrete in the armourlayer of breakwaters 2 BREAKWATER DESIGN 2.1 General Breakwater design was for many years a question of trial and error. Short before WW II Iribarren [1938] developed a theoretical model for the stability of stones on a slope under wave attack. Later Hudson [1959] performed experiments on stones and even tetrapodes to optimise the results found by Iribarren. Where Iribarren focussed on a theoretical approach, assisted by some experiments, Hudson concentrated on collecting a large data set from hydraulic model experiments. In both cases experiments were carried out using then standard techniques. Both subjected models to regular, monochromatic, waves. Later others, like Van der Meer [1988], discussed influences of factors not studied by Iribarren and Hudson like storm duration and wave period. They subjected models to irregular waves. Model investigations are influenced by a lot of unaccounted irregularities and unknown variables. These variables are brought together in special coefficients depending on: - shape of the block - thickness of the armour layer - manner of placing units - roughness and interlocking capacity of the units - type of wave attack - head or trunk section of breakwater - angel of incidence of wave attack - size and porosity of underlying material - crest level - crest type - wave period - shape of foreshore In this chapter a presentation of the different stability formulae is given. It describes the methods of deriving the formulae and their advantages and disadvantages. 2.2 Iribarren Iribarren observed the forces acting on a unit on slope. He found some forces responsible for stability: - weight of the unit - buoyancy of the unit - wave force - frictional resistance These forces can be brought to equilibrium. Iribarren developed a formula based on several parameters. The required weight is a function of parameters like unitshape, breakwater slope and specific weight of the elements (Iribarren, [1938]). Iribarren developed the following stability formula: Flume tests on high density concrete elements 6
10 The use of high-density concrete in the armourlayer of breakwaters 2.3 Hudson 1 H s = N 3 ( µ cosα ± sinα). formula 2.1 D In which: H s = wave height (m) = relative density (ρ r - ρ w )/ρ w, ρ w = density of water, ρ r = density of unit (kg/m 3 ) D = nominal diameter element, (W/ρ) 1/3 µ = coefficient of friction α = angle of slope N depends on the shape of the block and must be derived from model experiments, it is a function of the damage level. µ can be determined as the angle of internal friction. Iribarren s formula is not sufficient accurate to be used in designing rubble mound breakwaters unless it is used on conjunction with values of N. N varies appreciable with the coefficient of friction µ. Values of µ are difficult to obtain because µ varies with armour unit shape and method of placing and even from test to test General Hudson wanted to develop a more general stability equation. He made an analytical study on wave attack on slopes and described characteristics of the motion of water particles when short-period wind waves encounter a rubble mound breakwater. During experiments (since 1942 at U.S. Army Engineer Waterways Experiment Station, Vicksburg) Hudson found data about stability, porosity and thickness of armour layers of quarry-stone and tetrapodes. The required weight of the armour units is according to Hudson a function of several parameters like shape of unit, breakwater slope and specific weight of element Tests set-up In Hudson s test series (Hudson [1959]) design-wave heights were determined for breakwater sections of sufficient height to prevent overtopping. Design wave height is defined as the maximum wave height measured at the location of a proposed breakwater before it is constructed which will not damage the cover layer. No damage means the removal of up to one per cent of the total number of armour units in the cover layer. The design wave heights for the no-damage criterion (H D=0 ) were determined by subjecting test sections to waves made successively higher until the maximum wave height was found that would not remove more than one per cent of the armour units from the cover layer. Flume tests on high density concrete elements 7
11 The use of high-density concrete in the armourlayer of breakwaters Wave climate Hudson performed experiments with regular waves. He did not take into account the statistic and random character of wave attack and storm duration. Therefore these parameters are not present in his formula Volume weights The densities of the used materials in Hudson s tests were between 2146 kg/m 3 and 3076 kg/m Determination of damage Hudson related the removal of elements in the cover layer to the number of total elements in the area from 1 *H s below still water level to 1*H s above still water level. The removal of up to 1 percent is called no damage Conclusions Hudson developed the following stability formula for armour units: H s = ( K D cotα) D 1 3. formula 2.2 The coefficient K D in the formula varies primarily with the shape of the unit and is a function of the damage level. Hudson s formula is well known because of its simplicity. It can be used for designing breakwaters in an easy way. Hudson developed his formula based on experiments taken with slopes from 1:1,5 to 1:4. Because of this, Hudson s formula can only be used within this interval. 2.4 Van der Meer General Between 1965 and 1970 several investigations were made on breakwater design because of shortcomings of Hudson s formula. It does e.g. not include the influence of the wave period and random waves. Some investigators like Ahrends, Pilarsky and de Boer showed the importance of the wave period, but their tests were performed with regular waves (Van der Meer [1985]). Others like Thompson and Shuttler investigated the influence of storm duration. It became possible to generate irregular waves and Thompson and Shuttler described the behaviour of breakwater units exposed to random waves. Instead of Ahrends c.s. they found no clear dependency on wave period. Van der Meer however found a clear dependency on wave period reanalysing their data Test set-up Van der Meer performed lots of experiments because of his doctoral thesis. He investigated a lot of variables. Mostly all tests were performed using stones. He only performed a few tests with cubes (Van der Meer [1986]). These test were performed on slopes 1:1,5. The crest was of sufficient height to prevent overtopping at the start of damage. Van der Meer placed cubes randomly on the slope by using a bucket. In this way the armour layer was build in horizontal layers from the toe up to the crest Wave climate Flume tests on high density concrete elements 8
12 The use of high-density concrete in the armourlayer of breakwaters Van der Meer used irregular waves. He found an influence of the storm duration on static stability. After N (number of waves)=0 to N=500 or 1000 the damage increase reduces. According to Van der Meer it could be expected that after N=1000 the damage development is completed Volume weights Van der Meer's tests were performed with stones of densities between 1950 kg/m3 and 3050 kg/m3. The density of the cubes was 2340 kg/m Determination of damage Van der Meer used a clear and measurable definition of damage. He expressed the damage (S) by dividing the erosion area in the cross section by the nominal diameter of the stones (D n = (W/ρ) 1/3 ). For tests with concrete cubes he used an other definition of damage. Damage was defined as the total number of cubes eroded within a width of one nominal diameter divided by the number of nominal diameters in a width of one meter, resulting in damage number N od. Cubes displaced out of their coloured band were counted only (Van de Meer [1986]). N od = 2 is called failure Conclusions Van der Meer developed several formulae for quarry stones, cubes, tetrapodes, doloses and accropodes. The formula derived for concrete cubes attacked by irregular, plunging waves reads as follows: 0.4 H s N od 0.1 = s. formula om D N In which: H s =H 1/3 or 4 m 0, where m 0 is the zeroth of the energy density spectrum. For deep-water conditions both definitions give almost the same values. s 0m = the ratio between the wave-height at the toe of the construction and the wavelength, calculated for deep water (2πH s /gt 2 m ). It is therefore a fictitious steepness. N od = damage number (see Section 2.4.5) D = nominal diameter concrete cube, (W/ρ) 1/3 Van der Meer performed lots of experiments varying a large number of parameters. He found minimum stability for the transition from breaking (plunging) waves to non-breaking (surging) waves. It is possible to put his formula in a figure by showing the damage number N od to the dimensional stability number H s / D. Figures of stability formulae with test results given by Van der Meer show a lot of scatter for the stability curves which include both the scatter to be expected in nature and the scatter due to the curve fitting. This scatter can be taken into account by the stability formula resulting in confidence bands. The 90% confidence bands are drawn in Figure 2.1. Flume tests on high density concrete elements 9
13 The use of high-density concrete in the armourlayer of breakwaters formula Nod % conf. band % conf. band Hs/deltaD Figure 2.1: Van der Meer-formula for cubes with 90% confidence bands 2.5 Comparison of formulae Comparing the stability formulae of the previous sections it is concluded that the stability of armour units in all formulae is expressed by the dimensionless stability number H s / D. In all formulae the influence of wave height, element density and relative density is equal. In the formulae the stability number is a function of several parameters and depends on unit shape, placing method, slope angle et cetera, but not on or ρ. Although the function differs from formula to formula, in all formulae there is a linear relation between H s /D and. Therefore a general stability formula reads as follows: H D s = K K2 K n x 1. formula 2.4 In which: H s = characteristic wave height D = nominal diameter element K 1,2,n = functions signifying the influence of slope angel, damage level, number of waves, wave period, etc. = relative density (ρ r - ρ w )/ρ w, ρ w = density of water, ρ r = density of unit (kg/m 3 ) x =1 Flume tests on high density concrete elements 10
14 The use of high-density concrete in the armourlayer of breakwaters 3 DEVELOPMENT OF ARMOURELEMENTS IN BREAKWATERDESIGN 3.1 General It is recommended to continue the model work started by Iribarren, Hudson and Van der Meer in order to improve and refine the design formulae. It is also recommended to investigate the influence of parameters not investigated earlier on the stability of armour elements. In order to improve stability of armour units several options can be investigated e.g.: - increasing K D in Hudson s formula by using special shaped units - decreasing slope - increasing density of used material In the past, several different unit shapes are developed in order to increase K D. Shapes developed are: - tetrapode - akmon - dolos - accropode - quadripode - tribar - hexapod The advantage of these elements is the high K D -number for these elements in Hudson s formula. The higher the K D number the less weight per unit will be required. The effect of decreasing the slope can be calculated by the formula and is investigated by several experiments in the past. The effect of changing the density of the used material is investigated by only a very few experiments in the past. In order to get more information about the influence of changing the density, more experiments are recommended. 3.2 High density Concrete Expectations on High Density Concrete Observing formula 2.4 it is seen that increasing the density of units with equal loading conditions will reduce the required size (and therefore the required weight) of the armour units. The effect of the density on the resistance against wave action can be calculated and visualised by e.g. Hudson s formula. In Figure 3.1 (Ito [1994]) the effect of the ρ r /ρ w (the density of the used material divided by the density of the water) on H/H c (the design wave height by given ρ r divided by the design wave height by standard ρ=2254 kg/m 3 ) is shown. In this figure the armour unit-size, K D and the slope angel are constant. It is seen that the design wave height for armour units with ρ r 4000kg/m 3 (ρ r /ρ w = 3) is about 1,5 times the design wave height for armour units with normal concrete (ρ r =2254 kg/m 3 ) of the same size. Flume tests on high density concrete elements 11
15 The use of high-density concrete in the armourlayer of breakwaters Influence density on Hs according to Hudson H/Hc ρr/ρw Sr Figure 3.1: the effect of the density on the damage causing wave-height It is possible to calculate the influence of using high-density material on the required sizes and weight of the elements. The formulae mentioned in Chapter 2 express the stability in the dimensionless stability number H s / D. Using this stability number it is possible to calculate the influence of changing the density of the used material on the sizes of the elements (for otherwise identical conditions): H H s s = 1D1 2D2 That means a relation between D 1 and D 2 : D D 1 2 = 2 1 Using a density of 4000 kg/m 3 in stead of 2200 kg/m 3 results in the following 1 and 2 : = = 1, = = 2, The nominal diameter of the units will then reduce by a factor: Flume tests on high density concrete elements 12
16 The use of high-density concrete in the armourlayer of breakwaters D D 2 2,90 = 1,15 1 = 2,5 The weight will reduce by a factor: W W D1 ρ1 2, = = = D2 ρ ,6 In Table 3.1 a comparison between armour units made of normal-density concrete and high-density concrete is given. ρ = 2200kg/m 3 ρ =4000kg/m 3 W (weight) 100% 12% V (volume) 100% 6% D n (nominal diameter) 100% 40% Layer thickness (2 elements) 100% 40% Units/ m 3 (porosity 35%) 100% 1560% Table 3.1: comparison between normal density and high density concrete elements Experiments with High Density Concrete As stated in Section 1.1 and 2.3 stability formulae are derived using concrete with standard densities. Therefore it is not known whether the formulae are valid for high densities or not. Reviewing the formulae it is not to be expected that highdensity concrete will behave in a different way, but that is not sure. It is also possible that the relation between wave-height and size of unit become relevant by reducing the sizes of the armour units. Based on several formulae and theory of breakwaters nothing about the behaviour of high density concrete under wave attack, can be stated for sure. Therefore experiments must prove whether stability formulae are valid for high densities or not. Until now only a few experiments with high-density concrete elements (ρ > ± 3200 kg/m 3 ) are taken. Ito [1994] did some experiments with high-density tetrapodes. Densities in these tests were between 17,8 kn/m 3 and 42,8 kn/m 3. The design wave height of these armour units was nearly similar. The damage of the tetrapodes of each different specific gravity should therefore be similar to each other. However, damage curves differed due to specific gravity. The damage-curves showed more damage for higher densities. Ito also showed the relationship between Hudson s stability coefficient K D, and the specific gravity. In Hudson s formula the stability number should be constant because it should depend mainly on the shape of the armour unit and other parameters, but not on. Therefore the stability coefficient must be independent of the change of specific gravity. But K D values showed by Ito scatter wildly for the different specific gravities. That means that, according to Ito s test results, the power of in the expression H s / D is 1. Ito concluded that there is a relationship between K D and the specific gravity. K D decreases with increasing specific gravity. He also concluded that the stability of high specific gravity armour blocks in his investigation, was significantly affected by scale effects due to very small units. Flume tests on high density concrete elements 13
17 The use of high-density concrete in the armourlayer of breakwaters In order to obtain more information about the behaviour of high-density concrete elements, more flume tests are recommended. Flume tests on high density concrete elements 14
18 The use of high-density concrete in the armourlayer of breakwaters 4 CONCLUSIONS AND FORMULATION OF PROBLEM 4.1 General In the past several stability formulae have been derived and refined. All formulae were only validated for densities of max kg/m 3. Now it is possible to make concrete with a density up to 4000 kg/m 3 by using magnetite as aggregate. According to stability formulae it may be economic to use high-density concrete in the armourlayer of breakwaters. In order to investigate the behaviour of high-density concrete elements, the validity of stability formulae and the linear relation between H s /D and for high densities, flume test are recommended. 4.2 Tests Tests with high-density concrete elements are to be compared with test with normal density concrete elements. Therefore test with high-density concrete elements must be similar to test with normal density concrete elements. In these tests only the difference in density is important. All other parameters should be constant. 4.3 Type of elements Because of the fact no tests with high-density concrete elements have been carried out until now (except by Ito[1994]), high-density model elements are not available and are to be made. Cubes are the easiest to make; therefore cubes are the most likely elements to use in high-density concrete flume tests. Iribarren and Hudson started testing on quarry run. Later cubes were introduced and after cubes elements characterised by great interlocking capacity. Stability of elements with great interlocking capacity is dictated by their weight and their interlocking capacity. The stability of cubes is dictated only by their weight and not by the capacity of interlocking. Stability of elements can be expressed in contributions of weight, interlocking capacity and increase of density. The contribution of weight on the stability of normal density concrete elements is set at 100%. Using high density concrete the elements have to weigh only 12% of the weight of normal density concrete elements (see Table 3.1). This difference in weight is caused by the increase of density. The elements do have the same stability under identical conditions. It can be stated in that way that 12% of the stability of high density concrete elements comes from the contribution of weight and the other 88% from the contribution of the increase of density. Using interlocking armour elements reduces the required weight as well. Part of the stability is then contributed by the weight and part by the interlocking capacity. It is possible to show the contribution of the interlocking capacity in the same way of showing the contribution of weight. In Figure 4.1 the contributions on stability of weight, interlocking capacity and increase of density is given for cubes (K D = 6.8), tetrapodes (K D = 8.3) and dolosses (K D = 22). Flume tests on high density concrete elements 15
19 The use of high-density concrete in the armourlayer of breakwaters 100% 90% % 70% 60% 50% contribution of interlocking contrubution of increase of density contribution of weight 40% 82 30% 20% % 0% 12 rho = 2200 rho = 4000 rho = 2200 rho = 4000 rho = 2200 rho = 4000 cube KD = 6.8 tetrapod KD = 8.3 dolos KD = Figure 4.1: contributions on stability It is seen from Figure 4.1 that the contribution of the increase of density on the stability decreases with increasing interlocking capacity. Therefore the effect of changing the density on the stability will be showed the best by elements without interlocking capacity. Tests with elements with interlocking capacity will show the effect of changing the density in a less absolute way. Therefore testresults on the effect of changing the density will be more sensitive for irregularities and model effects when elements with interlocking capacity will be used. The sizes of high-density concrete model elements will be very small because of reduction of weight. Furthermore, the weight and sizes of elements will also reduce by using elements with interlocking capacity. Smaller elements will result in a smaller test scale. Using cubes (without interlocking capacity) results in the largest test-scale, minimising scale effects. Summarising it is concluded that cubes are the most likely elements to use in model tests on the behaviour of high-density concrete elements. 4.4 Comparing the results In order to investigate whether high-density concrete elements perform in a minor or superior way normal density concrete elements do, the results of the tests must be compared. Also results can be compared to expectations based on Hudson and Van der Meer. A conclusion about the validity of stability formulae for high densities can be made by investigating the relation between H s /D and. Flume tests on high density concrete elements 16
20 The use of high-density concrete in the armourlayer of breakwaters PART TWO FLUME TESTS Flume tests on high density concrete elements 17

21 The use of high-density concrete in the armourlayer of breakwaters 5 GEOMETRY OF STRUCTURE 5.1 Introduction In order to investigate the validity of stability formulae for high-density concrete, several tests were performed. The tests for this investigation were theoretical tests. That means no prototype was scaled. Elements were placed on a simple slope and attacked by waves of different height, in order to obtain a relation between wave-height and damage. In order to link up with current investigations the elements were attacked by irregular waves. All tests were performed in the Scheldt Basin of WL Delft Hydraulics, location the Voorst (see also Chapter 6). One cross-section was used for the tests. This cross-section was subsequently used for tests with normal density elements as well as for tests with high-density elements. Because of the theoretical aspect of the study no breakwater-section was build but an infinite slope was used, preventing overtopping. In the following sections the dimensions and used materials are described. In Appendix A several decisions taken in the next sections are motivated. A drawing of the cross-section is given in Appendix B. 5.2 Armourlayer and elements In order to investigate the effect of the density on the stability, models of two different densities were used. Model weights were obtained for each density using a constant Hudson design wave height. In that way the design wave height of the model elements becomes nearly equal, despite difference in density. The used elements are cubes. A design wave height of 14 cm was used (dictated by the capacity of the flume), resulting in the elements of Table 5.1(according to Hudson s formula, K D =6.8, cotα= 1.5, ρ w =1000 kg/m 3 ). Element γ (kg/m 3 ) (mean value) W (kg) (mean value) Dn (m) 1 (Normal Density Concrete) 2328 (var = 3.7%) (var= 4.4%) (High Density Concrete) 3907 (var = 2.4%) (var= 3.1%) Table 5.1: sizes and weigths of used elements All tests with normal density concrete elements were performed with elements number 1, all tests with high-density concrete elements were performed with elements number 2. In Figure 5.1 a picture of the elements is given. The elements did have a different surface. Elements number 1 were made of Figure 5.1: picture of model elements epoxy and elements number 2 of cement with magnetite. Elements number 1 Flume tests on high density concrete elements 18
22 The use of high-density concrete in the armourlayer of breakwaters were painted. Elements number 2 were painted except the grey coloured one s (=1/6 of all elements). The painted elements number 2 were painted on five sides, one side was not painted. The painted and non-painted sides do have a slight difference in coefficient of friction. This is shown by a little experiment. Cubes of normal density and cubes of high density (painted as well as nonpainted) were placed on a horizontal wooden board. While lifting one side of the board the slope angle at the start of movement was measured. The angles are listed in Table 5.2. NDC HDC Nr. painted painted side non-painted side Average 26,88 26,18 32,48 Table 5.2: cubes on wooden board, angle at start of movement 5.3 Filterlayers In total 3 different filter materials have been used (see also Table 5.3): 1. A filter layer between the required filter layer for tests with normal density concrete and the required filter layer for tests with high density concrete, used for tests with normal and high density concrete (filter1 see Appendix C). 2. A filter layer used only for test with high-density concrete (filter 2, see Appendix C). 3. A filter layer used only for test with normal density concrete (filter 3, see Appendix C) D n 50 (m) Filter 1 0,012 Filter 2 0,008 Filter 3 0,019 Table 5.3: used filterlayers The design process of the filter layers is described in Appendix A. The core consisted of a huge amount of quarry run. This was granular material without specifications. This material was covered with a layer of about 15 cm of core-material with specifications of Appendix C. 5.4 Slope angle Almost all slope angles applied by Hudson and Van der Meer were 1:1,5. This slope angle was also used in this investigation. 5.5 Crest-height To prevent overtopping a high crest was used. The distance from the crown above still water level was equal to 1,5 times the maximum wave height and set at 0.30 m. 5.6 Foreshore and waterdepth Waves were generated on deep water with a depth of 0,70 m. The waves reached the structure on a sloping foreshore. A straight slope of 1:110 was used as foreshore. This is a very flat slope in order to maintain deep-water conditions. Flume tests on high density concrete elements 19
23 The use of high-density concrete in the armourlayer of breakwaters The waterdepth at the toe of the structure was 0,57 m, considered to be deepwater conditions. Flume tests on high density concrete elements 20
24 The use of high-density concrete in the armourlayer of breakwaters 6 TEST EQUIPMENT AND PROCEDURE All tests have been performed in the Scheldt Basin at WL Delft Hydraulics, location de Voorst. The size of the basin is 26,4 * 14 meter. The structure was build on a distance of 21,90 meter from the wave-board in a 1 meter wide flume consisting of two walls 1,2 meter high (see Appendix D). On deep water and at the structure, wave-heights were measured. Therefore three wave gauges were placed on deep water (5,00m; 5,46m and 5,78m from the waveboard) and three wave gauges at the toe of the construction (21,17m; 21,61m and 20,90m from the waveboard)(see Appendix D). After all tests some tests without structure were taken in order to measure the wave-height at the place of the structure without reflection. Waves were measured on deep and shallow water. The relation between those two values is given in Appendix E. With this relation the wave height at the construction during testing was determined. The armourlayer consisted of two layers of cubes. In order to compare the results of tests with different elements, the porosity of al tests was taken constant. For the tests with normal density cubes approximately 950 cubes (D n50 = 0,0443 m) were placed on approximately 0,127 m 3, resulting in a porosity of 35% [(1 (950*0, )/0,127)*100%]. For the tests with high density cubes approximately 3840 cubes (D n50 = 0,0221 m) were placed on approximately 0,063 m 3, resulting in a porosity of 34%[(1 (3840*0, ) /0,063)*100%]. Van der Meer used for his tests with cubes a porosity of 33% (van der Meer [1986]). Cubes were placed in coloured bands, two cubes wide. Two different placing methods were used: 1. Placing: cubes were placed by hand in horizontal layers from the toe up to the crest. 2. Dumping: the amount of cubes required for one coloured band was placed in a bucket. This bucket was emptied on the slope. The cubes were slightly rearranged by hand. In this way the armourlayer was also built in horizontal layers from the toe up to the crest. In total 8 different test series were performed. Each test series consisted of 5 or 6 runs with increasing wave-heights but with the same wave-steepness, resulting in different wave-periods. After each test, pictures were taken and damage was determined by counting cubes eroded within a width of one nominal diameter. After runs of the same test series the armourlayer was not rebuilt. After each complete test series the armourlayer was removed and rebuilt. In order to get reliable results, tests were repeated several times. Flume tests on high density concrete elements 21
25 The use of high-density concrete in the armourlayer of breakwaters 7 WAVE CLIMATE In total 8 different test series were performed. All tests were performed with irregular waves using standard JONSWAPspectrum. An example of the exceedance curves and energy density spectra of wave gauge 2 is given in Appendix F. Each test series consisted of 5 or 6 runs with different wave-heights but with similar wave-steepness, resulting in different wave-periods. In total 43 runs were performed. The following waves were used: % of design wave height % of design wave height % of design wave height % of design wave height % of design wave height % of design wave height The design wave for the normal density cubes and the high-density cubes as given in Section are respectively 0,129 m and 0,140 m. The 100%-wave for the tests was set at 0,14 m. All runs were performed with 1000 waves. According to Van der Meer the damage-development is completed then (see Section 2.4.3). Van der Meer used the following stability-formula for cubes (see also Section 2.4): s N = 6.7 D N 0.4 od s H. formula om The wave-steepness was taken constant for all runs. The wave-steepness on deep water (2πH s /gt p 2 ) was set at 0,050% resulting in a fictitious steepness s om at the construction (2πH s /gt m 2 ) of approximately 0,059% (using measured values). Van der Meer [1988] found minimum stability for the transition from breaking (plunging) waves to non-breaking (surging) waves. The breakertype is defined by the breaker parameter ξ = tan α/ s. Transition from plunging to surging waves is found for ξ = 2,5 to 3,5. This region was derived for quarry run and is also to a less extent applicable for cubes. The breaker parameter ξ for the tests in this investigation is 3,0 and in the region of minimum stability. Flume tests on high density concrete elements 22
26 The use of high-density concrete in the armourlayer of breakwaters 8 TEST PROGRAM Six different types of profiles were attacked by waves in 8 different test series: 1. Slope covered with dumped normal density cubes, filter 1 (series T1000) 2. Slope covered with dumped high density cubes, filter 1 (series T2000) 3. Slope covered with dumped high density cubes, filter 2 (series T3000 and T5000) 4. Slope covered with placed high density cubes, filter 2 (series T4000 and T6000) 5. Slope covered with placed normal density cubes, filter 3 (series T7000) 6. Slope covered with dumped normal density cubes, filter 3 (series T8000) The tests are performed according the test-schedule of Table 8.1: Test number Placing Gamma Dn Wave % Duration(min) method (kg/m3) filter 1 T1002 Dumped T1003 Dumped T1004 Dumped T1005 Dumped T2001 Dumped T2002 Dumped T2003 Dumped T2004 Dumped T2005 Dumped filter 2 T3001 Dumped T3002 Dumped T3003 Dumped T3004 Dumped T3005 Dumped T4001 Placed T4002 Placed T4003 Placed T4004 Placed T4005 Placed T4006 Placed T5001 Dumped T5002 Dumped T5003 Dumped T5004 Dumped T5005 Dumped T6001 Placed T6002 Placed T6003 Placed T6004 Placed T6005 Placed T6006 Placed filter 3 Placed Flume tests on high density concrete elements 23
27 The use of high-density concrete in the armourlayer of breakwaters T7001 Placed T7002 Placed T7003 Placed T7004 Placed T7005 Placed T7006 Placed T8001 Dumped T8002 Dumped T8003 Dumped T8004 Dumped T8005 Dumped Table 8.1: test program In Appendix G the test-schedule is given with the results of wave measuring, measured periods, number of displaced cubes and the damage numbers. In Appendix H several pictures of slopes before and after testing are given. Flume tests on high density concrete elements 24
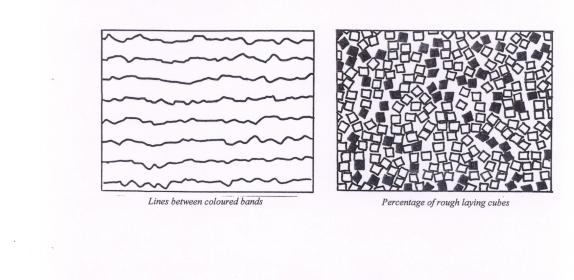
28 The use of high-density concrete in the armourlayer of breakwaters 9 RESULTS OF PLACING METHODS 9.1 Problems Cubes of both densities were placed as well as dumped. During placing the highdensity concrete elements and the normal density concrete elements behaved in a different way. The normal density cubes settled after placing by hand, resulting in a very constant placing pattern. Placing high-density cubes by hand did not show this. High-density cubes did remain in exactly the same position as they were placed. Therefore after placing, these elements did lay more random. Highdensity cubes did not tend to settle after placing. This was also observed when cubes where dumped. High-density concrete elements dumped on the slope did lay much more random than normal density concrete elements. This problem is possibly caused by the different coefficient of friction of the used materials (see also Section 5.2.1). 9.2 Roughness The method of placing is not important for the stability of the elements. Cubes do not know in what way there were placed. The way cubes are laying on the slope is however very important for the stability. The roughness of laying does influence the mobility and therefore the stability of the cubes. By translating the way cubes are laying on a slope in the roughness of laying, it is possible to compare cubes which do lay in the same way on the slope to each other. 9.3 Visualising the roughness In Figures 9.1 and 9.3 a method of visualising the roughness of a slope covered with cubes is shown. Pictures of slopes covered with normal and high-density elements by hand and by bucket were compared. The pictures of high-density concrete elements were enlarged until these elements were as big as the normal density elements. A sheet was placed on the pictures. Lines were drawn between the coloured bands. This resulted in Figure 9.1A - 9.1D. (for figures see appendix I) Placed normal density concrete elements Figure 9.1A: roughness of cubes laying on the slope, lines between coulored bands Flume tests on high density concrete elements 25
29 The use of high-density concrete in the armourlayer of breakwaters Dumped normal density concrete elements Figure 9.1B: roughness of cubes laying on the slope, lines between coulored bands Placed high density concrete elements Figure 9.1C: roughness of cubes laying on the slope, lines between coulored bands Dumped high density concrete elements Figure 9.1D: roughness of cubes laying on the slope, lines between coulored bands Flume tests on high density concrete elements 26
30 The use of high-density concrete in the armourlayer of breakwaters Another sheet was placed on the pictures and all elements were copied on the sheet. Elements positioned in the way of Figure 9.2A (flat) were kept white, elements positioned in the ways of Figure 9.2B (rough) were painted black. For figures see appendix I A (flat front) B (edge or corner) Figure 9.2: positions of cubes on the slope This results in Figure 9.3A 9.3D. Placed normal density concrete elements g = 12,5% Figure 9.3A: roughness of cubes laying on the slope, percentage of rough laying cubes Dumped Placed high normal density concrete elements g = 31,5% 26,5% Dumped high density concrete elements g = 51% Figure 9.3B: 9.3C: roughness of cubes laying on the slope, percentage of rough laying cubes Flume tests on high density concrete elements 27 Figure 9.3D: roughness of cubes laying on the slope, percentage of rough laying cubes
31 The use of high-density concrete in the armourlayer of breakwaters In this way a new parameter is introduced called laying-roughness which can be shown by above-mentioned methods. It must be mentioned that the way of determining the roughness in this section is a comparative way of determining. Although it is not an absolute way, the shown trend is consistent. By repeating the described method (also by different people) the same trend was shown. 9.4 Conclusion It is seen from Figures 9.1 and 9.3 that the same method of placing did not result in the same laying-roughness for both element-types. Dumped high-density cubes did lay more random than normal density cubes placed in the same way. High-density cubes placed by hand did also lay more random than normal density cubes placed by hand. High-density cubes placed by hand did lay almost as random as normal density cubes placed by bucket. The pictures and copied areas of the pictures used for the visualisation of Figures 9.1 and 9.3 are presented in Appendix I. Flume tests on high density concrete elements 28
32 The use of high-density concrete in the armourlayer of breakwaters 10 TEST RESULTS 10.1 Introduction In this chapter the test results are presented. Aim of the project is to compare the test results of normal and high density concrete elements to each other and to investigate whether the linear relation between H s /D and is still valid for high densities or not. In Sections 10.2 and 10.3 stability curves for normal density concrete respectively high density concrete elements are presented. In these sections the results are also compared to Van der Meer s and Hudson s expectations. In Section 10.4 the comparable stability curves for normal and high density concrete elements are presented. These stability curves are in Section 10.5 used to investigate the linear relation between H s /D and Normal density concrete elements General In total 3 test series with normal density concrete elements were performed (T1000, T7000, T8000). Series T1000 and T8000 did have the same placing method but different filter. Series T7000 and T8000 did have the same filter layer but different placing method Stability curves By showing N od (see Section 2.4.5) to the dimensionless stability number H s / D n it is possible to visualise the test results. In Figure 10.1 the results and the expectations according to Van der Meer's formula are given. In this investigation H s = 4 m 0 is used Nod T1000 (dumped, filter1) T7000 (placed, filter3) T8000 (dumped, filter3) vdmeer-formula 90% conf. band 90% conf. band Hs/deltaDn Figure 10.1: stability curves Normal Density Concrete elements Flume tests on high density concrete elements 29
33 The use of high-density concrete in the armourlayer of breakwaters The weight and sizes of the used cubes as given in Section have been calculated with Hudson s formula. The used K D value was 6.8 corresponding with the removal of 0-5% of all elements in the cover layer. Hudson used a cover layer from 1*H s below still water level to 1*H s above still water level. In this investigation cubes were laying on the slope from 2 * H s below still water level to 1,5 * H s above still water level. It was seen after the tests that almost all displaced cubes were cubes laying in the area of 1 * H s below still water level to 1*H s above still water level. The design wave of the normal density cubes according to Hudson is 0,129 m, resulting in a stability number of 2,2. Test series T1000, T7000 and T8000 showed for that stability number a removal of 1.1%, 0% and 3.6% of all cubes in the area from 1*H s below still water level to 1*H s above still water level Discussion It is seen from Figure 10.1 that placing cubes by hand resulted in less damage than expected based on Van der Meer's investigations. This is explained by the fact Van der Meer placed his cubes not by hand but with a bucket. By placing cubes by hand they lay less random and therefore more stable. Test-results for cubes dumped on the slope are according to the expectations and within the 90% confidence bands. There is a slight difference between results with filter 1 and filter 3. By failure (N od = 2) cubes on filter 3 are a little bit more stable. This is explained by the fact that filter 3 is more suited for the cubes (see Section 5.3) and D n50 of filter 1 is too small. A filter with a larger D n50 may result in a better embedding of the armourlayer. All tests show a removal of 0% - 5% of all elements in the area of 1 * H s below still water level to 1*H s above still water level, according to Hudson s expectations High density concrete elements General In total 5 test series with high-density concrete elements were performed (T2000 T6000). Series T2000, T3000 and T5000 did have the same placing method but T2000 a different filter. Series T4000 and T6000 did have the same filter layer but different placing method Stability curves By showing N od (see Section 2.4.5) to the dimensionless stability number H s / D n it is possible to visualise the test results. In Figure 10.2 the results and the expectations according to Van der Meer's formula are given. In this investigation H s = 4 m 0 is used. Flume tests on high density concrete elements 30
34 The use of high-density concrete in the armourlayer of breakwaters Nod T2000 (dumped, filter 1) T3000 (dumped, filter 2) T4000 (placed, filter 2) T5000 (dumped, filter 2) T6000 (placed, filter 2) vdmeer-formula 90% conf. band 90% conf. band Hs/deltaDn Figure 10.2: stability curves High Density Concrete elements The weight and sizes of the used cubes as given in Section have been calculated with Hudson s formula. The used K D value was 6.8 corresponding with the removal of 0-5% of all elements in the cover layer. Hudson used a cover layer from 1*H s below still water level to 1*H s above still water level. In this investigation cubes were laying on the slope from 2 * H s below still water level to 1,5 * H s above still water level. It was seen after the tests that almost all displaced cubes were cubes laying in the area of 1 * H s below still water level to 1*H s above still water level. The design wave of the high-density cubes according to Hudson is 0,140 m, resulting in a stability number of 2,2. Test series T6000, T4000, T2000 and T5000 showed for that stability number a removal 1.1%, 1.1%, 3.5% and 3.8% of all cubes in the area from 1*H s below still water level to 1*H s above still water level. Test series T3000 did have for that stability number a removal of 5.1% in the area from 1*H s below still water level to 1*H s above still water level Discussion Cubes placed by hand are a lot more stable than cubes dumped on the slope (this was also seen on normal density cubes). Cubes dumped on the slope are less stable than expected. By N od = 2, two of the 3 curves are between the 90% confidence bands, one is out of the band. Test series T2000, T4000, T5000 and T6000 show a removal of 0% - 5% of all elements in the area of 1 * H s below still water level to 1*H s above still water level, according to Hudson s expectations. Test series T3000 show a removal of >5% in the area of 1 * H s below still water level to 1*H s above still water level. It is seen from Figure 10.2 that the effect of changing the filter layer on the stability is almost negligible. Cubes on filter 1 looks like a little more stable however filter 2 is more suited. This is possibly caused by the fact that D n50 of filter 1 is a little too large resulting in a better embedding of the armourlayer. Flume tests on high density concrete elements 31
35 The use of high-density concrete in the armourlayer of breakwaters Because the influence of the filter layer is almost negligible in comparison with the effect of placement, test series T2000, T3000 and T5000 as well as T4000 and T 6000 can be considered as repetition-test. The results of the tests with high-density concrete elements are very reliable because of two reasons. In the first place the results of repetition-tests do not differ a lot. In the second place the test were performed with a very large number of elements (almost 4 times the number of normal density elements) reducing the influence of unaccounted irregularities Comparing High Density to Normal Density Concrete elements Introduction In order to say in what way high-density concrete elements behave compared to equivalent normal density elements, a comparison between the test results must be made. Comparing the results as given in Sections 10.1 and 10.2 at first sight it seems right to say that high-density concrete elements perform in a minor way than normal density concrete elements do. Placing the cubes in the same way gives stability curves for high-density concrete, which are on the left side of the curves of normal density concrete. Comparing the results of high-density concrete elements with Van der Meer using the same placing method Van der Meer used, gives stability curves which are on the edges of the 90% confidence bands. However, almost all tests (except one) give damage as expected based on Hudson s formula. Comparing the results there are problems. It looks right to compare results of tests with the same placing method to each other. The placing method is however not the most important criterion, the result of placing method is more important (see Chapter 9) Comparison based on roughness of laying criterion In Chapter 9 it is stated that placing high-density cubes by hand will result in the same roughness as dumping normal density cubes on the slope. Considering the remarks made in Chapter 9 it now can be concluded that normal density concrete elements dumped on the slope are to be compared with high-density concrete elements placed by hand. It is not known in what way the elements did lay on the slope in Van der Meer s tests. Van der Meer used the same normal density concrete elements as used in this investigation (Van der Meer [1986]). He dumped the elements on the slope by using a bucket. Therefore it seems right to say that the elements used by Van der Meer did lay as rough as the normal density concrete elements dumped on the slope in this investigation. Because of this and of remarks made in Chapter 9, it can be stated that Van der Meer's curve is applicable for high-density concrete elements placed by hand and not for high-density concrete elements dumped by bucket. Flume tests on high density concrete elements 32
36 The use of high-density concrete in the armourlayer of breakwaters In Figure 10.3 the stability curves of test with NDC elements placed by bucket and HDC elements placed by hand are given Nod NDC, T1000 (dumped, filter 1) HDC, T4000 (placed, filter 2) HDC, T6000 (placed, filter 2) NDC, T8000 (dumped, filter 3) vdmeer-formula 90% conf. band 90% conf. band Hs/deltaDn Figure 10.3: stability curves comparable Normal and High Density Concrete elements Discussion Reviewing the test results of Section 10.1 and 10.2 using the roughness of laying criterion, it can be concluded that the high-density concrete elements are at least as stable as the normal density concrete elements (see Figure 10.3). It also can be concluded that the high-density concrete elements do behave at least as expected based on the formulae Validity of stability formulae for high densities As mentioned in Section 2.5 a general stability formula for armour elements reads: H D s = K1 K2 K n x. formula 2.4 In all formulae there is a linear relation between H s /D and. That means x in formula 2.4 is 1. This linear relation is until now not validated for high densities up to 4000 kg/m 3. With the test results as presented in Figure 10.3 now it is possible to investigate the power of in formula 2.4 for high densities. In Figure 10.4 the relation between H s /D and for different N od is given, using the test results of Section For each N od the average value of tests with the same density was used. Flume tests on high density concrete elements 33
37 The use of high-density concrete in the armourlayer of breakwaters test results for Nod= test result for Nod=1 Hs/D 5.0 test results for Nod= test results for Nod= delta Figure 10.4: relation between H s /D and obtained from test results If there is a linear relation between H s /D and it is possible to draw a straight line between points of the same N od. According to formula 2.4 all lines should go trough the origin (0,0) of Figure 10.4 (H s /D=0 for =0). Drawing lines between the points and the origin of Figure 10.4, resulted in Figure test results for Nod= test result for Nod=1 Hs/D 5.0 test results for Nod= test results for Nod= delta Figure 10.5: lines between test results and origin Flume tests on high density concrete elements 34
38 The use of high-density concrete in the armourlayer of breakwaters It is seen from Figure 10.5 that it is not possible to draw exactly a straight line between the origin and the test results. In Table 10.1 the gradient ( [H s /D]/ [ ]) of the different parts of the lines of Figure 10.5 are given. gradient part 1 gradient part 2 N od = 0,5 2,3 2,4 N od = 1,0 2,4 2,8 N od = 1,5 2,6 3,1 N od = 2,0 2,8 3,2 Table 10.1: gradienst of lines of Figure 10.5 It is seen from Table 10.1 that there is a slight difference in gradient for the first and second part of the lines of Figure Although there is a slight difference in gradients it is seen that there is a tendency that the relation between H s /D and is linear. The gradients of part 2 of all lines are a little above the gradients of part 1. That means that in this investigation there is at least a linear relation between H s /D and for high density concrete elements. According to this, the high density concrete elements in this investigation tend to be a little more stable under equal loading conditions than normal density concrete elements. This was also seen in Section Because there is only a very slight difference in gradients of Table 10.1 and a very slight deviation from a straight line of the lines in Figure 10.5, it is concluded that the linear relation between H s /D and is still valid for densities up to 4000 kg/m 3. In other words: the power of in formula 2.4 is still 1 (x=1). Flume tests on high density concrete elements 35
39 The use of high-density concrete in the armourlayer of breakwaters 11 CONCLUSIONS AND RECOMMENDATIONS 11.1 Conclusions - Stability of elements on slope is largely influenced by the laying-roughness of the elements. - The laying-roughness of the elements is changing from placing method to placing method as well as from density to density. - It is not correct to compare results of tests with the same placing method to each other. - It is correct to compare results of tests with the same laying-roughness to each other. - Using the laying-roughness-criterion it is very well possible to compare elements of different densities in a correct way. - The high-density concrete elements used in this investigation are, under equal loading conditions at least as stable as the normal density concrete elements. - The high-density concrete elements do behave like expected based on stability formulae. - The linear relation between H s /D and in stability formulae for breakwater armour elements is still valid for densities up to 4000kg/m 3. - It seems to be that the well-known stability formulae for breakwater armour elements are valid for densities up to 4000 kg/m Recommendations - In this investigation, cubes with a slight difference in coefficient of friction were used. It is not known in what way the stability of elements is influenced by this difference in coefficient of friction. Reviewing Iribarren s formula (formula 2.1, Section 2.1) it can be expected that cubes with a higher coefficient of friction will be more stable. In Hudson s and Van der Meer s formula the coefficient of friction is not present. Only 1/6 of the high-density cubes had a higher coefficient of friction. Therefore the results may be influenced a little by this difference. In order to eliminate the influence of this coefficient, tests with elements with the same coefficient of friction are recommended. - The Reynolds-number of the used high-density cubes was 2,6*10 4. According to Dai and Kamel [1969] scale-effects can be expected for Reynolds-numbers below 3*10 4. Therefore, the results obtained in this investigation are to be verified in large-scale test. - In this investigation the influences of only a very few parameters are investigated. More tests with a large number of different parameters will result in a more general statement about the validity of stability formulae for high densities. Flume tests on high density concrete elements 36
40 REFERENCES Dai, Y.B. and Kamel, A.M., 1969 Scale effect tests for rubble-mound breakwaters Hydraulic Model Investigation, research report H-69-2 U.S. Army Engineer Waterways Experiment Station, Corps of Engineers, Vicksburg, Mississippi, USA Hudson, R.Y., 1959 Laboratory investigation of rubble-mound breakwaters Proc. ASCE 85 WW 3, ASCE, New York Hudson, R.Y., 1975 Reliability of rubble-mound breakwater stability models Miscellaneous Paper H-75-5, Hydraulics Laboratory, U.S. Army Engineer Waterways Experiment Station, Vicksburg, USA Hudson, R.Y., Herman, F.A., Sager, R.A., Whalin, R.W., Keulegan, G.H., Chatham jr, C.E. and Hales, L.Z., 1979 Coastal Hydraulic Models Special Report No. 5 U.S. Army, Corps of Engineers, Coastal Engineering Research Centre, Iribarren Cavanilles, R, 1938 Una formula para al calculo de los diques de escollera, Madrid Translated and published in the January 1949 Bulletin of the Beach Erosion Board, Office, Chief of Engineers, Department of the Army. Which is used in this paper. Ito, Masahiro; Iwagaki, Yuichi; Murakami, Hiroshi; Nemoto, Kenji; Yamamoto, Masato and Hanzawa, Minoru, 1994 Stability of high-specific Gravity Armor Blocks Coastal Engineering 1994, Proceedings of the twenty-fourth international conference, October 23-28, 1994, Kobe Liu, T and Wang, D., 1984 Analysis of Similarity of Dumped Blocks in Model Test on River Closure and the Determination of Model Scale Proceedings Symposium on Scale Effects in Modelling Hydraulic Structures, Esslingen am Neckar, Germany, pag International Association for Hydraulic Research Meer, J.W. van der, 1985 Stability of rubble-mound revetments and breakwaters under random wave attack, Proceedings of the conference on Breakwaters 85, pag , Institution of Civil Engineers, Thomas Telford, London
41 Meer, J.W. van der, 1988 Rock slopes and gravel beaches under wave attack Doctoral thesis approved by Delft University of Technology, Delft Hydraulics, Delft, The Netherlands Zelfde, W.D.A. van t, Freriks, E. and Zevenbergen, C., 1998 Minelco s magnitite dense aggregate Mol, A., Ligteringen, H., Groenveld, R.L. and Pita, C.R.A.M., 1983 West Breakwater, Sines Study of Armour Stability, Proc. ASCE Conference Coastal Structures 83, Virginia, USA Oumeraci, H, 1984 Scale effects in Coastal Hydraulic Models Proceedings Symposium on Scale Effects in Modelling Hydraulic Structures, Esslingen am Neckar, Germany, pag International Association for Hydraulic Research Stive, R.J.H., 1984 Wave impact on uniform steep slopes at approximately prototype scale Proceedings Symposium on Scale Effects in Modelling Hydraulic Structures, Esslingen am Neckar, Germany, pag International Association for Hydraulic Research Shore protection manual, 1975 U.S. army coastal engineering research center
42 LIST OF SYMBOLS α slope angel of construction D n nominal diameter, (W/ρ r ) 1/3 G acceleration of gravity H s significant wave height K D stability coefficient in Hudson formula M 50 average mass of stone class m 0 zeroth moment of spectrum N number of waves N od damage number in Van der Meer formula Re Reynolds number ρ r density element ρ w density water T p peak period T m mean period s 0m wave steepness V volume of element W weight of element ξ surf similarity parameter
43 LIST OF TABLES Table 3.1 comparison between normal density and high-density concrete elements Table 5.1 sizes and weights of used elements Table 5.2 cubes on wooden board, angle at start of movement Table 5.3 used filterlayers Table 8.1 test program Table 10.1 gradients of lines of Figure 10.5
44 LIST OF FIGURES Figure 2.1 Van der Meer formula for cubes with 90% confidence bands Figure 3.1 the effect of the density on the damage causing wave height Figure 4.1 contributions on stability Figure 5.1 picture of model elements Figure 9.1A-D roughness of cubes laying on the slope, lines between coloured bands Figure 9.2 position of cubes on the slope Figure 9.3A-D roughness of cubes laying in the slope, percentage of rough laying cubes Figure 10.1stability curves Normal Density Concrete elements Figure 10.2stability curves High-Density Concrete elements Figure 10.3stability curves comparable Normal and High Density Concrete elements Figure 10.4relation between H s /D and obtained from test results Figure 10.5lines between test results and origin
45 LIST OF FORMULAE Formula 2.1 Formula 2.2 Formula 2.3 Formula 2.4 Iribarren formula Hudson formula Van der Meer formula for cubes general stability formula
46 APPENDIX A CONSIDERATIONS AND DICISIONS
47 11.3 Considerations and scale-effects Dynamic similarity would be obtained for rouble mound stability models if the models are constructed geometrically similar to their prototypes and if both the Froude- (U/ (gd)) and Reynolds- (Ud/ν) numbers are equal, model to prototype, or model to model by comparing two. It is not possible to take Froude and Reynolds both equal. In breakwater-models in which gravity plays a role, scaling according to Froude s law is required. It can be calculated that in that case the scale of the dynamic viscosity ν in the Reynolds-number is equal to (linear-scale) 3/2. It is seen that the use of a practical linear scale will result in a non-existing required viscosity for the model fluid. The most practical model fluid is water, and water is used in all rubble mound stability models. Thus perfect dynamic similarity can not be obtained and some dissimilarity between model and prototype action will occur. This dissimilarity is called scale effects (Hudson [1975]). Reviewing the Hudson formula it can be calculated that K D is affected by the Reynolds-number. K D is proportional of the 2nd power of the Reynolds number (Ito [1994]): K D 2 e R = C. formula A.1 ξ 4 ( S 1) r 3 R It is seen from formula A.1 that decreasing the Reynolds-number decreases the K D value. When the Reynolds number is small, K D become very small, resulting in higher required unit weights according to Hudson s formula. Ito [1994] concluded that after approximately Reynolds-number = 1*10 5, K D gradually reaches a constant. In other words if the Reynolds-number is high enough, scale-effects caused by not scaling the viscosity of the liquid are negligible. These conclusions are also drawn by Hudson [1975, 1979] and Dai and Kamel [1969]. Van der Meer investigated in his doctoral thesis several authors on scale effects (Dai and Kamel, Thompson, Broderick and Ahrens, Jensen and Klinting, Sörensen and Jensen, Burcharth and Frigaard) and concluded that the results are not throughout consistent. Lowest values for which no scale effects will be present can be set at Re=1*10 4 4*10 4 (Van der Meer [1988]). Others (Owen [1985]) discussed Re=3*10 4 as too conservatives and give values of Re = 8*10 3 or even 3*10 3 (referring to Mol, Jensen and Klinting, Shuttler). In table A.1 minimum Reynolds numbers given by several authors are listed. Minimum Reynolds number Dai and Kamel [1969] 3 * 10 4 Oumeraci [1984] 3 * 10 4 Stive [1984] 3 * 10 4 Liu [1984] 1 * 10 4 Van der Meer [1988] 1 * * 10 4 Owen [1985] 3 * * 10 3 Table A.1: minimum Reynolds numbers It must be mentioned that the minimum values listed in table A.1 are estimations. No absolute minimum values are given by the authors. Furthermore the values given by Dai and Kamel were derived for the start of damage, no scale effects were present for higher damage levels. Experiments with high density tetrapodes described by Ito [1994] (see also paragraph 2.6.3) give more damage using high density elements than using normal density elements under same waveattack. Densities in these tests were between 17,8 kn/m 3 and 42,8 kn/m 3. Reynolds-numbers differ from 2,2*10 4 to 4,6*10 4 and higher. The damage-curves of these tests show more damage for higher densities. These results are, according to Ito, caused by above mentioned scale effects due to very small units. Considerations about these results and conclusions must be given because the
48 damage of the high density-elements looks like progressive damage. Therefore the damage is likely caused by other aspects, like e.g. placing method. The Reynolds-numbers of the cubes for the present investigation are listed in table A.2 (Re = g H D n /ν, using design wave height for H). Reynolds number Elements 1 (NDC) 5,2 * 10 4 Elements 2 (HDC) 2,6 * 10 4 Table A.2: Reynolds numbers used elements According to values given by some authors of table A.1 scale effects are to be expected for elements number 2. In order to obtain experiments not influenced by scale-effect several options have been investigated (see also table A.3): 1. The most proper way is to make Reynolds for both elements> 3*10 4. But the 140% wave-height for Reynolds > 3*10 4 can not be generated in the flume. 2. Another option is to investigate the influence of using the same element-size for normal and high density concrete, instead of using the same wave-height. The Reynolds-number of the normal concrete elements then reach a value of approximately 1,8*10 4, also < 3*10 4. Therefore this is not a proper option. 3. Using the same Reynolds-number for both densities will eliminate the scale-effects by comparing the results (both experiments are influenced by the same scale effects). This is however not a usual way, because the model-scale for these test are not equal and scaling to a prototype will be difficult. option Element D n Reynolds 140% waveheight 1 1 (NDC) 0,025 m 3 * ,26 m 2 1 (NDC) 0,022 m 2,6 * ,20 m 2 (HDC) 0,022 m 1,8 * ,065 m 3 1 (NDC) 0,022 m 2,6 * ,20 m 2 (HDC) m 2,6 * m Table A.3: options to eleminate scale effects These considerations lead to the following conclusions: 1. Using the same wave-height (dictated by the maximum wave in the flume) for experiments with both densities, will result in minimum Reynolds-numbers of approximately 2,6* Using Reynolds-numbers > 3*10 4 is not possible because of the maximum wave in the flume. 3. Using the same elements-size will result in even lower values of Re. 4. Using the same Reynolds-numbers is not usual. Using the same wave height for experiments with both densities is the best option, although Reynolds < 3*10 4. Based on above mentioned references of Van der Meer and Owen and following discussions with several experts of TUDelft De Weger and WL Delft Hydraulics, no scale-effects are to be expected with experiments with Reynolds-numbers of 2,5*10 4. Furthermore (see earlier mentioned remarks) the values of minimum Reynolds numbers are not as absolute as given in table A.1. Therefore it was decided to perform experiments with the elements as mentioned in paragraph with the same wave-height for normal density and high-density elements Ratio armourlayer/filterlayer
49 The ratio between the armour layer and filter layers is normally dictated by weight. More important than the ratio in weight is the geometry. Calculation of the filter layer based on the ratio in weight will only satisfy if the density of the armour layer- and filter layer-material is the same. The formula for the ratio between armour- and filter material is: 1 1 =. formula A M 50, filter a * M 50, armour For tests with armour-elements of normal density the following filter material is required: M 50, filter = 1/10 à 1/25 * 0,203 = à 0,008 kg By using filter material with ρ 2600 kg/m 3, D n50 = W = 0.020m ρ m D n50, armour (by using normal density elements) = m, that means a ratio between D n50, armour and D n50, filter of 2,3 to 3,1. Using the same ratio between D n50, armour and D n50, filter for the high-density elements results in D n50, filter = 0,007 to 0,010 m, see table A.4 D n50, armour D n50, filter (m) NDC-elements 0,044 0,015 0,020 HDC-elements 0,022 0,007 0,010 Table A.4: required filterlayers In total 3 different filter materials have been used (see also table A.5): 1. A filter layer between the required filter layer for tests with normal density concrete and the required filter layer for tests with high density concrete, used for tests with normal and high density concrete (filter1 see Appendix C. 2. A filter layer calculated with above-mentioned relations, used for test with high-density concrete (filter 2, see Appendix C). 3. A filter layer calculated with above-mentioned relations, used for test with normal density concrete (filter 3, see Appendix C) D n 50 (m) Filter 1 0,012 Filter 2 0,008 Filter 3 0,019 Table A.5: used filterlayers The core consisted of a huge amount of quarry run. This was granular material without specifications. This material was covered with a layer of about 15 cm of core-material with specifications of Appendix B.
50 APPENDIX B CROSS SECTION OF TESTED STRUCTURE
51
52 APPENDIX C FILTER LAYERS AND CORE MATERIAL
53 M 50 (gram) D n50 (cm) Filter Filter Filter core Exceedance curves 100 filter 1 filter 2 filter 3 core % W (gram)
54 APPENDIX D SCHELDT BASIN AND PLACES OF WAVE GAUGES
55 APPENDIX E RELATION DEEP WATER WAVE SHALLOW WATER WAVE
56 Relation deep water wave - shallow water wave shallow water wave 5% deep water wave
57 APPENDIX F EXCEEDANCE CURVES AND ENERGY DENSITY SPECTRA
58 APPE
59 NDIX G TEST SCHEDULE AND TEST RESULTS
60 Test number Gamma (kg/m3) Dn delta Wave % Height (m) Tp0(s) Tm0(s) Duration(min) Hs/deltaDn number of displaced cubes Nod filter 1 T1002 (dumped) T T T T2001 (dumped) T T T T filter 2 T3001 (dumped) T T T T T4001 (placed) T T T T T T5001 (dumped) T T T T T6001 (placed) T T T T T filter 3 T7001 (placed) T T T T T T8001 (dumped) T T T T
61 APPENDIX H PICTURES OF SLOPES BEFORE AND AFTER TESTING
62
63
64
65
66
67
68
69
70
71
72

73
74
75

76
77
78
79
80
81 APPENDIX I PICTURES USED FOR DETERMINING ROUGHNESS


82
83

84

85
86
6. Stability of cubes, tetrapods and accropode
 6. Stability of cubes, tetrapods and accropode J. W. VAN DER MEER, Delft Hydraulics Laboratory SYNOPSS. Results of an extensive research program on stability of rubble mound revetments and breakwaters
Design of Breakwaters Rubble Mound Breakwater
 Design of Breakwaters Rubble Mound Breakwater BY Dr. Nagi M. Abdelhamid Department of Irrigation and Hydraulics Faculty of Engineering Cairo University 013 Rubble mound breakwater Dr. Nagi Abdelhamid Advantages
Hydraulic stability of antifer block armour layers Physical model study
 Hydraulic stability of antifer block armour layers Physical model study Paulo Freitas Department of Civil Engineering, IST, Technical University of Lisbon Abstract The primary aim of the study is to experimentally
INVESTIGATIONS ON QUARRY STONE TOE BERM STABILITY
 INVESTIGATIONS ON QUARRY STONE TOE BERM STABILITY Markus Muttray 1, Bas Reedijk 1, Richard de Rover 1, Bart van Zwicht 1 Model test results from four experimental studies have been compiled in a data set
A COMPARISON OF OVERTOPPING PERFORMANCE OF DIFFERENT RUBBLE MOUND BREAKWATER ARMOUR
 A COMPARISON OF OVERTOPPING PERFORMANCE OF DIFFERENT RUBBLE MOUND BREAKWATER ARMOUR Tom Bruce 1, Jentsje van der Meer 2, Leopoldo Franco and Jonathan M. Pearson 4 This paper describes a major programme
Stability of Breakwaters Armored with Heavy Concrete Cubes
 Project: Peute Breakwater Phase 1 WOWW2010, Berlin 30.09.2010 Dipl.-Ing. Mayumi Wilms Dipl.-Ing. Nils Goseberg Prof. Dr.-Ing. habil. Torsten Schlurmann Franzius-Institute for Hydraulic, Waterways and Coastal
PORE PRESSURES IN RUBBLE MOUND BREAKWATERS
 CHAPTER 124 PORE PRESSURES IN RUBBLE MOUND BREAKWATERS M.B. de Groot 1, H. Yamazaki 2, M.R.A. van Gent 3 and Z. Kheyruri 4 ABSTRACT Economic breakwater design requires knowledge of the wave induced pore
ROCK SLOPES WITH OPEN FILTERS UNDER WAVE LOADING: EFFECTS OF STORM DURATION AND WATER LEVEL VARIATIONS
 ROCK SLOPES WITH OPEN FILTERS UNDER WAVE LOADING: EFFECTS OF STORM DURATION AND WATER LEVEL VARIATIONS Marcel R.A. van Gent 1, Guido Wolters 1 and Ivo M. van der Werf 1 Rubble mound breakwaters and revetments
Stability of Gravel on Mild Slopes in Breaking Waves. Marieke Wit
 Stability of Gravel on Mild Slopes in Breaking Waves Marieke Wit November 2015 I Stability of Gravel on Mild Slopes in Breaking Waves Master of Science Thesis E. Marieke Wit - 1521535 Delft, November
Recent Advances in Stability Formulae and Damage Description of Breakwater Armour Layer
 Australian Journal of Basic and Applied Sciences, 3(3): 2717-2827, 2009 ISSN 1991-8178 Recent Advances in Stability Formulae and Damage Description of Breakwater Armour Layer Babak Kamali and Roslan Hashim
ANALYSIS OF WAVE REFLECTION FROM STRUCTURES WITH BERMS THROUGH AN EXTENSIVE DATABASE AND 2DV NUMERICAL MODELLING
 ANALYSIS OF WAVE REFLECTION FROM STRUCTURES WITH BERMS THROUGH AN EXTENSIVE DATABASE AND 2DV NUMERICAL MODELLING Barbara Zanuttigh 1, Jentsje W. van der Meer 2, Thomas Lykke Andersen 3, Javier L. Lara
The influence of core permeability on armour layer stability
 The influence of core permeability on armour layer stability A theoretical research to give the notional permeability coefficient P a more physical basis Master of science thesis by H.D. Jumelet Delft
CHAPTER 102. Ponta Delgada Breakwater Rehabilitation Risk Assessment with respect to Breakage of Armour Units
 CHAPTER 102 Ponta Delgada Breakwater Rehabilitation Risk Assessment with respect to Breakage of Armour Units H. Ligteringen \ J.C. van der Lem \ F. Silveira Ramos Abstract The outer portion of the Ponta
Numerical Modelling of Coastal Defence Structures
 Numerical Modelling of Coastal Defence Structures Overtopping as a Design Input Parameter Master s Thesis in the International Master s Programme Geo and Water Engineering MATTHIEU GUÉRINEL Department
Aalborg Universitet. Seawall Overtopping Tests sea erosion study : Sohar Cornice Frigaard, Peter. Publication date: 1990
 Downloaded from vbn.aau.dk on: marts 22, 209 Aalborg Universitet Seawall Tests sea erosion study : Sohar Cornice Frigaard, Peter Publication date: 990 Document Version Publisher's PDF, also known as Version
CHAPTER 134 WAVE RUNUP AND OVERTOPPING ON COASTAL STRUCTURES
 CHAPTER 134 WAVE RUNUP AND OVERTOPPING ON COASTAL STRUCTURES J.P. de Waal 1 ' and J.W. van der Meer 2 ' Introduction Delft Hydraulics has recently performed various applied research studies in physical
On berm breakwaters. Adrian Bãtãcui. Radu Ciocan. - an investigation into recession and overtopping -
 On berm breakwaters - an investigation into recession and overtopping - Adrian Bãtãcui Radu Ciocan Aalborg University M.Sc in Structural and Civil Engineering Master Thesis, Spring 2013 School of Engineering
Small Scale Field Experiment on Breaking Wave Pressure on Vertical Breakwaters
 Open Journal of Marine Science, 2015, 5, 412-421 Published Online October 2015 in SciRes. http://www.scirp.org/journal/ojms http://dx.doi.org/10.4236/ojms.2015.54033 Small Scale Field Experiment on Breaking
Design - Overview. Design Wave Height. H 1/3 (H s ) = average of highest 1/3 of all waves. H 10 = 1.27H s = average of highest 10% of all waves
 = average of highest 1/3 of all waves. H 10 = 1.27H s = average of highest 10% of all waves") esign - Overview introduction design wave height wave runup & overtopping wave forces - piles - caisson; non-breaking waves - caisson; breaking waves - revetments esign Wave Height H /3 (H s ) = average
esign - Overview introduction design wave height wave runup & overtopping wave forces - piles - caisson; non-breaking waves - caisson; breaking waves - revetments esign Wave Height H /3 (H s ) = average
The probabilistic optimisation of the revetment on the dikes along the Frisian coast
 The probabilistic optimisation of the revetment on the dikes along the Frisian coast M. Hussaarts, J.K. Vrijling, P.H.A.J.M. van Gelder Subfaculty of Civil Engineering, Delft University of Technology,
Advances in Neural Networks for prediction
 Symposium on EurOtop Unesco IHE Delft, September 10, 2014 Coasts, Marine Structures and Breakwaters Edinburgh, Sep 18-20, 2013 Advances in Neural Networks for prediction Outline Background CLASH project:
Probabilistic Neural Network for Predicting the Stability numbers of Breakwater Armor Blocks
 Copyright c 2007 ICCES ICCES, vol.2, no.2, pp.35-40, 2007 Probabilistic Neural Network for Predicting the Stability numbers of Breakwater Armor Blocks Doo Kie Kim 1, Dong Hyawn Kim 2, Seong Kyu Chang 1
5 Physical processes and design tools CIRIA C
 Physical processes and design tools 6 8 9 0 CIRIA C68 8 Physical processes and design tools CHAPTER CONTENTS. Hydraulic performance.......................................... 8.. Hydraulic performance related
Rock Sizing for Small Dam Spillways
 Rock Sizing for Small Dam Spillways STORMWATER MANAGEMENT PRACTICES Photo 1 Rock-lined spillway on a construction site sediment basin Photo 2 Rock-lined spillway on a small farm dam 1. Introduction A chute
WEIGHT AND STABILITY ASSESSMENT OF SINGLE LAYERS OF ORDERLY PLACED OR PITCHED NATURAL ROCK
 WEIGHT AND STABILITY ASSESSMENT OF SINGLE LAYERS OF ORDERLY PLACED OR PITCHED NATURAL ROCK Nisa Nurmohamed 1, Gosse Jan Steendam 2 and Jentsje van der Meer 2 In the Netherlands a special type of dike protection
Appendix 15 Computational Methodology
 Appendix 15 Computational Methodology Introduction This Appendix describes the process used by the risk team to determine the final loss exceedence values in the risk analysis. The process involved the
Rock Sizing for Waterway & Gully Chutes
 Rock Sizing for Waterway & Gully Chutes WATERWAY MANAGEMENT PRACTICES Photo 1 Rock-lined waterway chute Photo 2 Rock-lined gully chute 1. Introduction A waterway chute is a stabilised section of channel
Rehabilitation of Existing Seawall in Fujairah to Withstand Cyclone Conditions
 Journal of the Persian Gulf (Marine Science)/Vol. 4/No. 11/March 20113/7/31-38 Rehabilitation of Existing Seawall in Fujairah to Withstand Cyclone Conditions Ashoor, Arash; 1* ; Trindade, Jorge 2 1- Senior
Optimal Inspection Planning with Time-Dependent Reliability Analysis. Application to Rubble-Mound Breakwaters
 Optimal Planning with Time-Dependent Reliability Analysis. Application to Rubble-Mound Breakwaters Nguyen Dai Viet a*, P.H.A.J.M van Gelder a, H.J. Verhagen a and J.K. Vrijling a a Delft University of
Motions and Resistance of a Ship in Regular Following Waves
 Reprinted: 01-11-2000 Revised: 03-10-2007 Website: www.shipmotions.nl Report 440, September 1976, Delft University of Technology, Ship Hydromechanics Laboratory, Mekelweg 2, 2628 CD Delft, The Netherlands.
Numerical simulation of wave overtopping using two dimensional breaking wave model
 Numerical simulation of wave overtopping using two dimensional breaking wave model A. soliman', M.S. ~aslan~ & D.E. ~eeve' I Division of Environmental Fluid Mechanics, School of Civil Engineering, University
Estimation of Peak Wave Stresses in Slender Complex Concrete Armor Units
 Downloaded from vbn.aau.dk on: januar 19, 2019 Aalborg Universitet Estimation of Peak Wave Stresses in Slender Complex Concrete Armor Units Howell, G.L.; Burcharth, Hans Falk; Rhee, Joon R Published in:
Estimation of Overtopping Flow Velocities on Earthen Levees Due to Irregular Waves
 January 008 Estimation of Overtopping Flow Velocities on Earthen Levees Due to Irregular Waves by Steven A. Hughes PURPOSE: This Coastal and Hydraulics Engineering Technical Note (CHETN) provides empirical
Vertical Wall Structure Calculations
 Vertical Wall Structure Calculations Hydrodynamic Pressure Distributions on a Vertical Wall (non-breaking waves two time-varying components: the hydrostatic pressure component due to the instantaneous
CHAPTER 134. Hydraulic Stability Analysis of Leeside Slopes of Overtopped Breakwaters
 CHAPTER 134 Abstract Hydraulic Stability Analysis of Leeside Slopes of Overtopped Breakwaters M. D. Kudale 1 and N. Kobayashi 2 The hydraulic stability of armor units on the leeside slope of an overtopped
[1] Performance of the sediment trap depends on the type of outlet structure and the settling pond surface area.
![[1] Performance of the sediment trap depends on the type of outlet structure and the settling pond surface area.](/thumbs/76/74245181.jpg "[1] Performance of the sediment trap depends on the type of outlet structure and the settling pond surface area.") Sediment Trench SEDIMENT CONTROL TECHNIQUE Type 1 System Sheet Flow Sandy Soils Type 2 System [1] Concentrated Flow Clayey Soils Type 3 System [1] Supplementary Trap Dispersive Soils [1] Performance of
Sediment Trench SEDIMENT CONTROL TECHNIQUE Type 1 System Sheet Flow Sandy Soils Type 2 System [1] Concentrated Flow Clayey Soils Type 3 System [1] Supplementary Trap Dispersive Soils [1] Performance of
CHAPTER 122 CONCRETE ARMOR UNIT STRUCTURAL DESIGN CRITERIA
 CHAPTER 122 CONCRETE ARMOR UNIT STRUCTURAL DESIGN CRITERIA CD. Anglln, AM and R.D. Scott, AM ASCE 1 D.J. Turcke 2 ABSTRACT A comprehensive examination of the structural response of breakwater armor units
DUNE EROSION NEAR SEA WALLS: MODEL-DATA COMPARISON
 DUNE EROSION NEAR SEA WALLS: MODEL-DATA COMPARISON Pieter van Geer 1, Bram de Vries 2, Ap van Dongeren 1 and Jaap van Thiel de Vries 1,2 This paper describes the validation of the dune erosion model XBeach
ABOUT SOME UNCERTAINTIES IN THE PHYSICAL AND NUMERICAL MODELING OF WAVE OVERTOPPING OVER COASTAL STRUCTURES
 ABOUT SOME UNCERTAINTIES IN THE PHYSICAL AND NUMERICAL MODELING OF WAVE OVERTOPPING OVER COASTAL STRUCTURES Romano A 1, Williams H E 2, Bellotti G 1, Briganti R 2, Dodd N 2, Franco L 1 This paper presents
MECHANICAL BEHAVIOUR OF DAMAGED HDPE GEOMEMBRANES
 MECHANICAL BEHAVIOUR OF DAMAGED HDPE GEOMEMBRANES Guangming Xu, Mingchang Yang, Xianghai Zong Geotechnical Engineering Department, Nanjing Hydraulic Research Institute, China gmxu@nhri.cn Abstract HDPE
Pirai river (Bolivia)
") Pirai river (Bolivia) Confluent of the Amazon river which average discharge is only 6 m3/s, but with peak discharge over 5000 m3/s, a challenge for river basin management and for flood control HYDROEUROPE
Pirai river (Bolivia) Confluent of the Amazon river which average discharge is only 6 m3/s, but with peak discharge over 5000 m3/s, a challenge for river basin management and for flood control HYDROEUROPE
COASTAL STRUCTURES WITH OPEN FILTERS UNDER WAVE LOADING
 Proceedings of the 6 th International Conference on the Application of Physical Modelling in Coastal and Port Engineering and Science (Coastlab16) Ottawa, Canada, May 10-13, 2016 Copyright : Creative Commons
Paul de Groot. The thesis committee consists of: Prof. dr. ir. M.J.F. Stive Prof. dr. ir. L.C. Van Rijn Ir. S.G.J. Aarninkhof Ir. G.
 Preface This thesis is the result of a study, investigating the swash zone sediment transport processes. The first part of the thesis work has taken place on the University of Queensland, in Brisbane,
GOING WITH THE FLOW (1 Hour)
") GOING WITH THE FLOW (1 Hour) Addresses NGSS Level of Difficulty: 3 Grade Range: 3-5 OVERVIEW In this activity, students use a stream table to model the processes of erosion and streambed formation. The
GOING WITH THE FLOW (1 Hour) Addresses NGSS Level of Difficulty: 3 Grade Range: 3-5 OVERVIEW In this activity, students use a stream table to model the processes of erosion and streambed formation. The
1.6.5 Corrosion Control
 TECHNICAL STANDARDS AND COMMENTARIES FOR PORT AND HARBOUR FACILITIES IN JAPAN (3) Performance verification of SRC Members 1 The steel and reinforced concrete (SRC) members shall be designed against the
An Improved Design Method for the Riprap of Earthfill Dams of Large Reservoirs
 CHAPTER 163 An Improved Design Method for the Riprap of Earthfill Dams of Large Reservoirs Jean-Pierre Tournier 1, Pierre Dupuis 1, Raymond Ares Abstract Since impounding of the various reservoirs of the
LARGE-SCALE EXPERIMENTS ON THE BEHAVIOUR OF LOW CRESTED AND SUBMERGED BREAKWATERS IN PRESENCE OF BROKEN WAVES
 LARGE-SCALE EXPERIMENTS ON THE BEHAVIOUR OF LOW CRESTED AND SUBMERGED BREAKWATERS IN PRESENCE OF BROKEN WAVES Mario Calabrese 1, Diego Vicinanza 2, and Mariano Buccino 3 Abstract: Functional degn of low
ing. A. Kragten May 2008 KD 378
 Basic knowledge about electrical, chemical, mechanical, potential and kinetic energy to understand literature about the generation of energy by small wind turbines ing. A. Kragten May 2008 KD 378 It is
New formulae for prediction of wave overtopping at inclined structures with smooth impermeable surface
 New formulae for prediction of wave overtopping at inclined structures with smooth impermeable surface Author Etemad Shahidi, Amir, Jafari, Ebrahim Published 2014 Journal Title Ocean Engineering DOI https://doi.org/10.1016/j.oceaneng.2014.04.011
Coefficient of Friction
 HOUSTON COMMUNITY COLLEGE SYSTEMS SOUTHWEST COLLEGE COLLEGE PHYSICS I PHYS 1401 PRE LAB QUESTIONS Due before lab begins. Coefficient of Friction 1) Explain briefly the different types of frictional forces.
Rock Sizing for Batter Chutes
 Rock Sizing for Batter Chutes STORMWATER MANAGEMENT PRACTICES Photo 1 Rock-lined batter chute Photo 2 Rock-lined batter chute 1. Introduction In the stormwater industry a chute is a steep drainage channel,
PART 2:! FLUVIAL HYDRAULICS" HYDROEUROPE
 PART 2:! FLUVIAL HYDRAULICS" HYDROEUROPE 2009 1 HYDROEUROPE 2009 2 About shear stress!! Extremely complex concept, can not be measured directly!! Computation is based on very primitive hypotheses that
Advanced Hydraulics Prof. Dr. Suresh A Kartha Department of Civil Engineering Indian Institute of Technology, Guwahati
 Advanced Hydraulics Prof. Dr. Suresh A Kartha Department of Civil Engineering Indian Institute of Technology, Guwahati Module - 2 Uniform Flows Lecture - 6 Design of Channels for Uniform Flow (Refer Slide
U-Shaped Sediment Traps
 U-Shaped Sediment Traps SEDIMENT CONTROL TECHNIQUE Type 1 System Sheet Flow Sandy Soils Type 2 System Concentrated Flow Clayey Soils [1] Type 3 System Supplementary Trap Dispersive Soils [1] Generally
Page No xxvii. Erratum / Correction
 NOTES: This list of 2 February 2016 refers to the B/W version of 2012, which is a reprint of the original Manual of 2007. That reprint contains, contrary to the statement in the preface, not all errata
The use of a floating quay for container terminals. 1. Introduction
 The use of a floating quay for container terminals. M. van der Wel M.vanderWel@student.tudelft.nl Ir. J.G. de Gijt J.G.deGijt@tudelft.nl Public Works Rotterdam/TU Delft Ir. D. Dudok van Heel D.DudokvanHeel@gw.rotterdam.nl
PARAMETERS INFLUENCING WAVE RUN-UP ON A RUBBLE MOUND BREAKWATER. Bjorn Van de Walle', Julien De Rouck', Luc Van Damme', Peter Frigaard', Marc Willems'
 7613 0307 012 6701 /1111 ~ 111/1/11 11III 11 m~ IIIIIIIII1~11 1111 PARAMETERS INFLUENCING WAVE RUN-UP ON A RUBBLE MOUND BREAKWATER Bjorn Van de Walle', Julien De Rouck', Luc Van Damme', Peter Frigaard',
1.060 Engineering Mechanics II Spring Problem Set 8
 1.060 Engineering Mechanics II Spring 2006 Due on Monday, May 1st Problem Set 8 Important note: Please start a new sheet of paper for each problem in the problem set. Write the names of the group members
Observational Methods and
 Observational Methods and NATM System for Observational approach to tunnel design Eurocode 7 (EC7) includes the following remarks concerning an observational method. Four requirements shall all be made
RISK ASSESSMENT OF COASTAL DEFENCES
 RISK ASSESSMENT OF COASTAL DEFENCES TERRY HEDGES (University of Liverpool) MARIA TERESA REIS (Posford Duvivier) T.S.Hedges & M.T.Reis, June 1999 PARASODE (Probabilistic Assessment of Risks Associated with
Application of Energy Approach to Estimating Scour Depth
 Nature and Science, (), 004, Zhang, et al, Application of Energy Approach Application of Energy Approach to Estimating Scour Depth Xiaodong Zhang 1, Zhiping Liu 1, Chuan Liang, Qiang Fu 3 (1. IWHR, Beijing
PROBABILISTIC DESIGN METHOD OF LEVEE AND FLOODWALL HEIGHTS FOR THE HURRICANE PROTECTION SYSTEM IN THE NEW ORLEANS AREA
 PROBABILISTIC DESIGN METHOD OF LEVEE AND FLOODWALL HEIGHTS FOR THE HURRICANE PROTECTION SYSTEM IN THE NEW ORLEANS AREA Mathijs van Ledden Haskoning Inc., 1 Galleria Blvd., Metairie, LA70001, United States,
Low Gradient Velocity Control Short Term Steep Gradient Channel Lining Medium-Long Term Outlet Control Soil Treatment Permanent [1]
![Low Gradient Velocity Control Short Term Steep Gradient Channel Lining Medium-Long Term Outlet Control Soil Treatment Permanent [1]](/thumbs/87/96478185.jpg "Low Gradient Velocity Control Short Term Steep Gradient Channel Lining Medium-Long Term Outlet Control Soil Treatment Permanent [1]") Rock Linings DRAINAGE CONTROL TECHNIQUE Low Gradient Velocity Control Short Term Steep Gradient Channel Lining Medium-Long Term Outlet Control Soil Treatment Permanent [1] [1] The design of permanent installations
Rock Linings DRAINAGE CONTROL TECHNIQUE Low Gradient Velocity Control Short Term Steep Gradient Channel Lining Medium-Long Term Outlet Control Soil Treatment Permanent [1] [1] The design of permanent installations
The effect of stope inclination and wall rock roughness on backfill free face stability
 The effect of stope inclination and wall rock roughness on backfill free face stability Dirige, A. P. E., McNearny, R. L., and Thompson, D. S. Montana Tech of the University of Montana, Butte, Montana,
Fluid Mechanics Prof. S.K. Som Department of Mechanical Engineering Indian Institute of Technology, Kharagpur
 Fluid Mechanics Prof. S.K. Som Department of Mechanical Engineering Indian Institute of Technology, Kharagpur Lecture - 42 Flows with a Free Surface Part II Good morning. I welcome you to this session
CLASH FP5 - EESD. Workpackage 7. Quantification of Measurement Errors, Model and Scale Effects Related to Wave Overtopping
 COMMISSIO OF THE EUROPEA COMMUITIES CREST LEVEL ASSESSMET OF COASTAL STRUCTURES BY FULL-SCALE MOITORIG, EURAL ETWORK PREDICTIO AD HAZARD AALYSIS O PERMISSIBLE WAVE OVERTOPPIG CLASH FP5 - EESD EVK3-CT-2001-00058
Rock Sizing for Drainage Channels
 Rock Sizing for Drainage Channels STORMWATER MANAGEMENT PRACTICES Photo 1 Rock-lined drainage channel Photo 2 Rock-lined catch drain (during construction phase) 1. Introduction Rock size is primarily dependent
WAVE LOADS ON RUBBLE MOUND BREAKWATER CROWN WALLS IN LONG WAVES
 WAVE LOADS ON RUBBLE MOUND BREAKWATER CROWN WALLS IN LONG WAVES Mads Sønderstrup Røge 1, Nicole Færc Cristensen 1, Jonas Bjerg Tomsen 1, Jørgen Quvang Harck Nørgaard 1, Tomas Lykke Andersen 1 Tis paper
Combined classifier quantifier model: A 2-phases neural model for prediction of wave overtopping at coastal structures
 Available online at www.sciencedirect.com Coastal Engineering 55 (2008) 357 374 www.elsevier.com/locate/coastaleng Combined classifier quantifier model: A 2-phases neural model for prediction of wave overtopping
 Comparison of shear pile force and moment in slippage reinforced with shear pile Mona Mohamadi 1, Abolfazl Eslami, Farhad Nabizade 1 1. Department of Technology, Guilan University, Iran. Department of
Hydrostatics and Stability Dr. Hari V Warrior Department of Ocean Engineering and Naval Architecture Indian Institute of Technology, Kharagpur
 Hydrostatics and Stability Dr. Hari V Warrior Department of Ocean Engineering and Naval Architecture Indian Institute of Technology, Kharagpur Module No. # 01 Lecture No. # 09 Free Surface Effect In the
RESERVOIR DRAWDOWN RATES/RESERVOIR DRAWDOWN TEST Iron Gate, Copco (I & II), and JC Boyle Dams
, and JC Boyle Dams") TECHNICAL MEMORANDUM No. 1 TO: Michael Bowen California Coastal Conservancy Geotechnical & Earthquake Engineering Consultants CC: Eric Ginney Philip Williams & Associates PREPARED BY: Paul Grant SUBJECT:
TECHNICAL MEMORANDUM No. 1 TO: Michael Bowen California Coastal Conservancy Geotechnical & Earthquake Engineering Consultants CC: Eric Ginney Philip Williams & Associates PREPARED BY: Paul Grant SUBJECT:
Landslide stability analysis using the sliding block method
 Landslide stability analysis using the sliding block method E. Lino, R. Norabuena, M. Villanueva & O. Felix SRK Consulting (Peru) S.A., Lima, Peru A. Lizcano SRK Consulting (Vancouver) S.A., British Columbia,
UNIVERSITY OF MANITOBA
 PAGE NO.: 1 of 6 + Formula Sheet Equal marks for all questions. No marks are subtracted for wrong answers. Record all answers on the computer score sheet provided. USE PENCIL ONLY! Black pen will look
EXAMPLES (SEDIMENT TRANSPORT) AUTUMN 2018
 AUTUMN 2018") EXAMPLES (SEDIMENT TRANSPORT) AUTUMN 2018 Q1. Using Cheng s formula estimate the settling velocity of a sand particle of diameter 1 mm in: (a) air; (b) water. Q2. Find the critical Shields parameter diameter
EXAMPLES (SEDIMENT TRANSPORT) AUTUMN 2018 Q1. Using Cheng s formula estimate the settling velocity of a sand particle of diameter 1 mm in: (a) air; (b) water. Q2. Find the critical Shields parameter diameter
The Dynamic Response Analysis of Concrete Gravity Dam under the Earthquake
 Copyright 2013 Tech Science Press SL, vol.9, no.1, pp.23-36, 2013 The Dynamic Response Analysis of Concrete Gravity Dam under the Earthquake Yang Lu 1, Li Shi-Min 1, Cao Peng 2 and Shen Xin-Pu 1 Abstract:
Shear Stress Estimates for Combined Wave and Surge Overtopping at Earthen Levees
 Shear Stress Estimates for Combined Wave and Surge Overtopping at Earthen Levees by Norberto C. Nadal and Steven A. Hughes PURPOSE: The Coastal and Hydraulics Engineering Technical Note (CHETN) described
Erosion of sand under high flow velocities
 Delft University of Technology Faculty of Mechanical, Maritime and Materials Engineering Department of Offshore Engineering Erosion of sand under high flow velocities Author: Juneed Sethi MSc Thesis Thesis
Determining rock quantities using swathe techniques on Maasvlakte 2
 Determining rock quantities using swathe techniques on Maasvlakte 2 Marnix KOL 1, Huibert-Jan LEKKERKERK 2, Eric PEETERS 1, René ROELS 1, Tjebbe WESTERBEEK 2 1: PUMA, the Netherlands; 2: Port of Rotterdam,
Coarse Sediment Traps
 Coarse Sediment Traps SEDIMENT CONTROL TECHNIQUE Type 1 System Sheet Flow Sandy Soils Type 2 System [1] Concentrated Flow Clayey Soils [2] Type 3 System Supplementary Trap Dispersive Soils [1] Though primarily
Mooring Model for Barge Tows in Lock Chamber
 Mooring Model for Barge Tows in Lock Chamber by Richard L. Stockstill BACKGROUND: Extensive research has been conducted in the area of modeling mooring systems in sea environments where the forcing function
MODELLING OF SEDIMENTATION OF DREDGED TRENCHES AND CHANNELS UNDER THE COMBINED ACTION OF TIDAL CURRENTS AND WAVES
 MODELLING OF SEDIMENTATION OF DREDGED TRENCHES AND CHANNELS UNDER THE COMBINED ACTION OF TIDAL CURRENTS AND WAVES D.J.R. Walstra 1, L.C. Van Rijn 1, S.E. Hoogewoning 2, S.G.J. Aarninkhof 1 Abstract: The
GEOTECHNICAL ENGINEERING ECG 503 LECTURE NOTE ANALYSIS AND DESIGN OF RETAINING STRUCTURES
 GEOTECHNICAL ENGINEERING ECG 503 LECTURE NOTE 07 3.0 ANALYSIS AND DESIGN OF RETAINING STRUCTURES LEARNING OUTCOMES Learning outcomes: At the end of this lecture/week the students would be able to: Understand
Physics 2c Lecture 9. Recap of Entropy. First part of chapter 18: Hydrostatic Equilibrium Measuring Pressure Pascal's Law Archimedes Principle
 Physics 2c Lecture 9 Recap of Entropy First part of chapter 18: Hydrostatic Equilibrium Measuring Pressure Pascal's Law Archimedes Principle Defining Entropy Macroscopic Definition of entropy difference:
Effects of horizontal vibration on hopper flows of granular materials
 PHYSICS OF FLUIDS VOLUME 11, NUMBER 1 JANUARY 1999 Effects of horizontal vibration on hopper flows of granular materials M. L. Hunt, R. C. Weathers, A. T. Lee, and C. E. Brennen Division of Engineering
CHAPTER 199 ARTIFICIAL SAND FILLS IN WATER
 CHAPTER 199 ARTIFICIAL SAND FILLS IN WATER J. van 't Hoff 1, M.B. de Groot 2, J.C. Winterwerp 3 H. Verwoert 4 and W.T. Bakker 5 l Introduction Experience has been obtained on the construction of sand fills
Working Scientifically Physics Equations and DfE Maths skills BOOKLET 1
 Working Scientifically Physics Equations and DfE Maths skills BOOKLET 1 Published date: Summer 2016 version 1 3 Working scientifically Science is a set of ideas about the material world. We have included
Evaluation of tsunami force on concrete girder by experiment simulating steady flow
 Journal of Structural Engineering Vol.61A (March 215) JSCE Evaluation of tsunami force on concrete girder by experiment simulating steady flow Li Fu*, Kenji Kosa**, Tatsuo Sasaki*** and Takashi Sato****
CONCEPTS Conservational Channel Evolution and Pollutant Transport System
 CONCEPTS Conservational Channel Evolution and Pollutant Transport System Eddy J. Langendoen Watershed Physical Processes Research Unit National Sedimentation Laboratory USDA Agricultural Research Service
Sediment Transport Mechanism and Grain Size Distributions in Stony Bed Rivers. S.FUKUOKA 1 and K.OSADA 2
 Sediment Transport Mechanism and Grain Size Distributions in Stony Bed Rivers S.FUKUOKA 1 and K.OSADA 1 Professor, Research and Development Initiative, Chuo-University, 1-13-7 Kasuga Bunkyo-ku, Tokyo,
Deep Foundations 2. Load Capacity of a Single Pile
 Deep Foundations 2 Load Capacity of a Single Pile All calculations of pile capacity are approximate because it is almost impossible to account for the variability of soil types and the differences in the
Integrated Design of Coastal Structures and Adaptation to Climate Change Hazards
 5 th International Conference on Environmental Science and Technology Rhodes, Greece, 3 August to 2 September 27 Integrated Design of Coastal Structures and Adaptation to Climate Change Hazards Mallıourı
Reliability analysis of the Caldicot Levels flood defence system by using Dutch reliability methods for flood defences. Flooding of Caldicot Levels
 Reliability analysis of the Caldicot Levels flood defence system by using Dutch reliability methods for flood defences Flooding of Caldicot Levels Failure of embankment without additional structures Failure
CHAPTER 137 POLOS PACKING DENSITY AND EFFECT OF RELATIVE BLOCK DENSITY. by J.A. ZWAMBORN
 CHAPTER 137 POLOS PACKING DENSITY AND EFFECT OF RELATIVE BLOCK DENSITY by J.A. ZWAMBORN ABSTRACT Accuracy and compatibility of measuring and testing techniques are discussed briefly and a plea is made
Chapter (12) Instructor : Dr. Jehad Hamad
 Instructor : Dr. Jehad Hamad") Chapter (12) Instructor : Dr. Jehad Hamad 2017-2016 Chapter Outlines Shear strength in soils Direct shear test Unconfined Compression Test Tri-axial Test Shear Strength The strength of a material is the
Chapter (12) Instructor : Dr. Jehad Hamad 2017-2016 Chapter Outlines Shear strength in soils Direct shear test Unconfined Compression Test Tri-axial Test Shear Strength The strength of a material is the
Page 1. Chapters 2, 3 (linear) 9 (rotational) Final Exam: Wednesday, May 11, 10:05 am - 12:05 pm, BASCOM 272
 9 (rotational) Final Exam: Wednesday, May 11, 10:05 am - 12:05 pm, BASCOM 272") Final Exam: Wednesday, May 11, 10:05 am - 12:05 pm, BASCOM 272 The exam will cover chapters 1 14 The exam will have about 30 multiple choice questions Consultations hours the same as before. Another review
Final Exam: Wednesday, May 11, 10:05 am - 12:05 pm, BASCOM 272 The exam will cover chapters 1 14 The exam will have about 30 multiple choice questions Consultations hours the same as before. Another review
Seismic Evaluation of Tailing Storage Facility
 Australian Earthquake Engineering Society 2010 Conference, Perth, Western Australia Seismic Evaluation of Tailing Storage Facility Jonathan Z. Liang 1, David Elias 2 1 Senior Geotechnical Engineer, GHD
ICSE Board Class IX Physics Paper 1
 ICSE Board Class IX Physics Paper 1 Time: 2 hrs Total Marks: 80 General Instructions: 1. Answers to this paper must be written on the paper provided separately. 2. You will not be allowed to write during
Entrance exam Master Course
 - 1 - Guidelines for completion of test: On each page, fill in your name and your application code Each question has four answers while only one answer is correct. o Marked correct answer means 4 points
Open Channel Hydraulics I - Uniform Flow
 PDHonline Course H138 (2 PDH) Open Channel Hydraulics I - Uniform Flow Instructor: Harlan H. Bengtson, Ph.D., PE 2012 PDH Online PDH Center 5272 Meadow Estates Drive Fairfax, VA 22030-6658 Phone & Fax: