Key Comparison CCAUV.A-K4
|
|
|
- Jason Chambers
- 5 years ago
- Views:
Transcription
1 Final Report on the Key Comparison CCAUV.A-K4 Abstract The Key Comparison CCAUV.A-K4 has been carried out under the auspices of the Consultative Committee for Acoustics, Ultrasound and Vibration (CCAUV) of the International Bureau of Weights and Measures (BIPM). The participating NMI s are the Instituto Nacional de Metrologia, Normalizacao e Qualidade Industrial (INMETRO, Brazil), the Centro Nacional de Metrología (CENAM, Mexico), the Laboratoire National de Métrologie et d'essais (LNE, France), the National Metrology Institute of Japan (NMIJ, Japan), the Korea Research Institute of Standards and Science (KRISS, Korea), and the Physikalisch-Technische Bundesanstalt (PTB, Germany). The role of the Pilot laboratory was undertaken by the DFM and CENAM. The measurements took place between January 007 and February 008. The time schedule was organized in a single star configuration. Two LSaP microphones were circulated. This report includes the measurement results from the participants, information about their calibration methods, and the analysis leading to the assignation of the degrees of equivalence. Prepared by Salvador Barrera-Figueroa, Lars Nielsen and Knud Rasmussen Danish Primary Laboratory of Acoustics Danish Fundamental Metrology Ltd. Matematiktorvet 307 DK-800 Kgs. Lyngby, Denmark Andrés E. Pérez Matzumoto and José Noé Razo Razo Centro Nacional de Metrología Carretera a Los Cués km 4.5 El Marqués, Querétaro, México. CP 7646
2 Content 1 Introduction 3 Comparison protocol 3 3 Travelling microphones Calibration methods 5 4 Calibration methods and reported results Microphone parameters Microphone sensitivities 14 5 Analysis of the results Degrees of equivalence Equivalence and consistence of results 18 6 Results Reference values 0 6. Degrees of equivalence per laboratory Degrees of equivalence 5 7 Conclusions 7 8 References 7 Appendix A Determination of the correlation coefficients 8 Appendix B INMETRO corrections to reported results 9 Appendix C Uncertainty budgets 30
3 1 Introduction The CCAUV.A-K4 is a Key comparison realised under the auspices of the CCAUV-BIPM. The standards circulated among the laboratories were two LSaP microphones of the type Brüel & Kjær Both microphones were also standards used for the CCAUV.A-K3. The microphones had to be calibrated using the reciprocity technique under free-field conditions in the frequency range from 1 khz to 31.5 khz (optionally up to 40 khz), and the open-circuit free-field sensitivity level had to be reported at the nominal preferred 1/3 rd octave band. The participating NMIs are the Instituto Nacional de Metrologia, Normalizacao e Qualidade Industrial (INMETRO, Brazil), the Centro Nacional de Metrología (CENAM, Mexico), the Laboratoire National de Métrologie et d'essais (LNE, France), the National Metrology Institute of Japan (NMIJ, Japan), the Korea Research Institute of Standards and Science (KRISS, Korea), and the Physikalisch-Technische Bundesanstalt (PTB, Germany). The National Physical Laboratory (NPL, UK) and the National Institute of Standards and Technology (NIST, USA) were included in the original time schedule, however they resigned participating during the course of the comparison. The time schedule was organized in a single star configuration. The role of the Pilot laboratory was undertaken by the DFM and CENAM. The measurements took place between February 007 and February 008. This report includes the measurement results from the participants, information about their calibration methods, uncertainty budgets, and the analysis leading to the assignation of the degrees of equivalence. Comparison protocol The September 006 Draft technical protocol for the key comparison CCAUV.A-K4 was presented during the 5th meeting of CCAUV on September 006, and the subsequently prepared October 006 Draft was used for this key comparison. This protocol is based on the CCAUV.A-K3 protocol with some additional clarifications. It was emphasized that the calibrations had to be performed at the preferred nominal frequencies rather than the exact frequencies. It was also recommended that the laboratories should report the results using three decimals. In this report, results are presented in the same way they were declared. The microphones were transported in all cases by means of a courier company selected by each participant. The container used under the courier transportation was provided by DFM. The actual participants are listed in table 1: Table 1. Participants in the CCAUV.A-K4 key comparison Participant Acronym Country Country code Regional Metrology Organization Danish Primary Laboratory for Acoustics. DFM Denmark DK EURAMET Danish Fundamental Metrology LTD. Centro Nacional de Metrología CENAM Mexico MX SIM Korea Research Institute of Standards KRISS Korea KR APMP and Science National Metrology Institute of Japan NMIJ Japan JP APMP Laboratoire national de métrologie et LNE France FR EURAMET d'essais Physikalisch-Technische Bundesanstalt PTB Germany DE COOMET (EURAMET) Instituto Nacional de Metrologia, Normalizacão e Qualidade Industrial INMETRO Brazil BR SIM
4 3 Travelling microphones Two LS microphones, Brüel & Kjær 4180, serial numbers and , were supplied by DFM and circulated among the participants. The DFM has monitored the microphones since the beginning of the comparison. The monitoring consisted of free-field reciprocity calibrations and also pressure reciprocity calibrations. The DFM also performed free-field reciprocity measurements from 1 khz as stated in the protocol. Figure 1 shows DFM s results of the control calibrations for some selected frequencies during the comparison span. Figure 1 also shows the difference with respect to a common average for the two microphones over the whole frequency range. No significant trend was observed in the control calibrations. Sensitivity difference (db) Normalised sensitivity (db) Microphone Frequency (khz) Microphone /07 06/07 09/07 1/07 04/08 date Sensitivity difference (db) Normalised sensitivity (db) Microphone Frequency (khz) Microphone /07 06/07 09/07 1/07 04/08 date Figure 1. Upper charts: Difference of the sensitivity level obtained at each calibration at DFM with respect to their common average for each microphone as a function of frequency (DFM s uncertainty bounds are shown). Lower charts: Changes in the sensitivity level of the microphones as a function of time. The sensitivity level has been normalized to the level of the first measurement. Blue line: 1 khz; red line khz; black line 5 khz; and magenta line 10 khz.
5 4 Calibration methods and reported results 4.1. Calibration methods A description of the calibration methods and the reporting of results of each laboratory is given below as submitted by each laboratory. No editing of the contents but a small amount of reformatting has been performed. Consequently, table, equation and figure numbers and references do not follow the numbering of the report. DFM: Free-field calibration of LS microphones. The free-field sensitivity of LS microphones are determined by conducting a reciprocity calibration in accordance with IEC [1]. The calibrations were performed in a small, specially designed anechoic room of about 1.4 m 1.50 m 1.7 m free dimensions. The reflection coefficient of the lining material is below -40 db above 1 khz. Measurement method The electrical transfer impedance is measured in linear frequency steps of 10 Hz from 3 khz (initially 960 Hz) to 51 khz. Due to the unavoidable poor signal-to-noise ratio and reflections from the environment a special technique has been developed based on narrow-band filtering in both frequency- and time domain [] Filtering in the frequency domain is applied by using a B&K Pulse Analyzer in the SSR-mode when measuring the transfer impedance. To enter the time domain by applying an inverse FFT-technique to the measurement result, the missing low frequency values down to 0 Hz are estimated as follows: The average pressure response (normalized at 50 Hz) has been determined for a large number of BK type 4180 microphones. The free-field to pressure sensitivity diffraction has been calculated as well using the Boundary Element Method [3]. The missing values of the transfer impedance from 10 Hz to 3 khz (resp. 1kHz) are then estimated from the above normalized responses, the absolute pressure sensitivity of the involved microphones at the actual environmental conditions and assuming an acoustic centre of 4.74 mm. To avoid sudden jumps in the transfer impedance the calculated values are blended into the measurement results over a frequency range of 100 Hz. Above 51 khz the measurements are extended to 70 khz by a linear extrapolation of the measurement results from khz in order to avoid an abrupt high-frequency cut-off when applying the inverse FFT-technique. Next, in the time domain, a time window of 0.9 ms is applied to eliminate the unwanted part of the signal and the remaining signal is converted back to the frequency domain. The final free-field sensitivities are then calculated in accordance with IEC using the above manipulated transfer impedances.
6 Acoustic centres The acoustic centres used are derived from a linear regression analysis of the above manipulated transfer impedances at four distances (corrected for air attenuation). This has been done for a large number of microphones and the average value has been expressed as a polynomial slightly different from the values in reference [4]. Correction to reference environmental conditions In general, calibrations will be performed at the following environmental conditions: + a static pressure of ± 3 kpa + a temperature of 3 ± 1 C and + a relative humidity of 50 ± 15 %RH The calibration results are corrected to reference environmental conditions by applying the individual static pressure- and temperature coefficients valid for the pressure sensitivity, i.e., the additional influence of the radiation impedance has been neglected. Correction to nominal frequencies The correction of the measured sensitivities in steps of 10 Hz to the required nominal frequencies has been performed by a simple linear interpolation between the measured sensitivities. References [1] IEC , Measurement microphones Part 3: Primary method for free-field calibration of laboratory standard microphones by the reciprocity technique. [] S. Barrera Figueroa, New methods for transducer calibration: Free-field reciprocity calibration of condenser microphones, PhD thesis, Ørsted DTU, Technical University of Denmark, 003. [3] S. Barrera Figueroa, K. Rasmussen, and F. Jacobsen, On experimental determination of the free-field correction of laboratory standard microphones at normal incidence, Metrologia 44, pp (007). [4] S. Barrera Figueroa, K. Rasmussen, and F. Jacobsen, The acoustic center of laboratory standard microphones, Journal of the Acoustical Society of America 10, pp (006). CENAM: a) Procedure: 510-AC-P.105: Calibración primaria de micrófonos patrón mediante la técnica de reciprocidad en campo libre (Primary calibration of standard microphones by the reciprocity technique in free-field). b) Instrumentation: + Microphone B&K Type 4180, SN: Microphone B&K Type 4180, SN: Reciprocity apparatus B&K Type 5998, SN: Polarization voltage meter B&K Type 5981, SN: Signal Analyzer B&K Type 3560D/3110, SN: Measuring Amplifier B&K Type 610, SN:
7 + Calibrator Fluke Type 5700A, SN: Environmental Monitoring System CENAM SN 063. c) Measurement: c.1) Determination of the free-field sensitivity modulus The open circuit sensitivity is determined by means of the reciprocity technique according to IEC , [1], using a set of three microphones of the same type, {1,, 3}. The microphone under test is sequentially acoustically coupled in pairs, {1-, 1-3 and -3}, at known distances within the two microphones in a field essentially free of acoustic reflections (free-field). The sensitivity of the microphone is obtained from the measurements of the electrical transfer impedance function, and the calculation of the acoustical transfer impedance between the three pairs of microphones. Electrical transfer impedance is measured in the frequency range from 1 15 Hz to 5 99 Hz with a 18 Hz resolution, using a dual channel digital signal analyzer. A cleaning procedure, based on time selective window, is applied to reduce acoustic reflections, microphone interference and cross-talk between the measurement channels. Sensitivity levels for 1/3 octave frequencies above 3 khz are calculated by linear interpolation from the set of measurement results in the frequency range given above, according to: M f, f M high M f, freq = M f, f + ) (1) low f f high f, flow ( freq flow low where: freq : frequency of interest in [Hz]; f low : frequency immediately below freq, in [Hz] in the set of measurement result; f high : frequency immediately above freq, in [Hz] in the set of measurement result; M f,freq : sensitivity level corresponding to the frequency freq, in [db re 1V/Pa]; M f,flow : sensitivity level corresponding to the frequency f low, in [db re 1V/Pa] M f,fhigh : sensitivity level corresponding to the frequency f high, in [db re 1V/Pa] Free-field sensitivity levels for frequencies below 3 khz are calculated through a free-field correction, determined from measured free-field and pressure sensitivity levels. A ninth degree polynomial fitting is calculated for each free-field correction, obtained from repeated measurements. For frequencies below 500 Hz it is assumed that both sensitivity levels, free field and pressure, are equal. Then the free-field correction calculated, through the polynomial fitting, for frequencies from 1 khz to 3 khz is used to determine the corresponding free-field sensitivity level. Four different separation distances, between each pair of microphones, are used in each measurement; these are given in table A: Table A: Separation distances used during the electrical transfer impedance measurements, for each pair of microphones. Number Distance / mm Corrections for the position of the acoustic centre are applied, and the corresponding correction factors for static pressure and temperature are used to obtain the sensitivity at reference conditions ( kpa and K (3 ºC)). Polarizing voltage of 00 V ± 0.04 V is applied to both, transmitter and receiving, measuring channels.
8 c.) Acoustic centre and environmental coefficients Positions for acoustic centre are obtained from reference []. Static pressure coefficients are determined for each microphone using the pressure sensitivity levels obtained by the reciprocity technique for five static pressures from 81 kpa to kpa. Later a linear regression fitting is used to obtain the corresponding coefficient for frequencies from 15 Hz up to 31.5 khz. Temperature coefficient is calculated using the typical value given by the manufacturer and the polynomial approximation given in [3]. The Environmental conditions of measurement are shown in table B Table B: Environmental conditions of measurement for each standard Microphones Static Pressure: ± 0.35 kpa ± 0.31 kpa Temperature:.47 ± 1.89 C.0 ± 1.44 C Relative Humidity: 3.50 ± 9.55 % ± 7.09 % d) Results a e) Uncertainty: The expanded measurement uncertainty is obtained multiplying the standard combined uncertainty by a coverage factor, k =, which gives a confidence level of al least 95 %, under the assumption that the probability distribution function for the measurand is approximately normal. The measurement uncertainty is estimated according to the Mexican National Standard NMX-CH- 140-IMNC-00: Guía para la Expresión de la Incertidumbre en las Mediciones, which is equivalent to the Guide for the Expression of Uncertainties in Measurement: BIPM, IEC, IFCC, ISO, IU- PAC, IUPAP, OIML (1995). The uncertainty value given in this certificate, does not take into account the contributions due to long term stability, drift and transportation for the calibrated instrument. f) Traceability: Calibration results are traceable to the kilogram (kg), Kelvin (K), second (s), metre (m) and ampere (A), base units of the SI, through the Mexican National Standards for Barometric Pressure (CNM-PNM-4), Temperature (CNM-PNE-), Time (CNM-PNE-1), Length (CNM-PNM-) and Intensity of Alternating Current (CNM-PNE-10), maintained by CENAM. References: [1] IEC International Standard 61094/3. Measurement microphones Part 3: Primary method for freefield calibration of laboratory standard microphones by the reciprocity technique. a Note: CENAM results are presented in the next sub-section.
9 [] Salvador Barrera-Figueroa, Knud Rasmussen and Finn Jacobsen, The acoustic center of laboratory standard microphones, J. Acoust. Soc. Am. 10 (5), (006). [3] Brüel & Kjær. Technical Review No Properties and calibration of laboratory standard microphones & Uncertainties in microphone frequency response. ISSN KRISS: The dimensions of the anechoic chamber used for the free-field calibration are.3 m (depth),. m (width), and.4 m (height). The microphones are mounted on 1.7 mm diameter vertical rods. The distance between two microphones is adjusted by a computer controlled servo motor and encoder with the resolution of 1 mm. The voltage ratio functions are measured using Reciprocity Calibration Apparatus (B&K 5998) and PULSE (B&K 3560C). The frequency is swept from 0.8 khz to 51 khz in linear frequency steps of 10 Hz. The number of measurement at each frequency is increased until the statistical uncertainty of the measurement response (i.e., twice the standard deviation) is less than 0.01 db. A perfect free-field facility of no interference from walls and obstacles is not readily available in practice, so it has led to the use of signal processing techniques to eliminate the reflections from boundaries. In addition, an electrical interference noise due to imperfect insulation of measuring instruments, so-called cross-talk, should be eliminated with the same manner. The time selective windowing technique for effective removal of multi-path noises is widely utilized for reciprocity calibrations, but it is still short in overcoming the limitations imposed by overlapped signals, in particular at low frequencies. Based on FFT analysis, the leakage due to the limited frequency range makes the overlap problem worse, not to be perfectly separated. Instead of conventional low pass filter designed to have a flat response in the frequency range of interest, Chebyshev window shaped function is selected because of its low sidelobe levels. After multi-path noise removal, the voltage ratio functions are restored by compensation with inversing filtering. The free-field sensitivity level at the nominal preferred 1/3rd octave centre frequencies is calculated with the linear interpolation between those at two adjacent frequencies. The free-field sensitivity levels near 1 khz are estimated by the interpolation technique between the pressure sensitivity levels at the low frequencies and the free-field sensitivities at the high frequencies. The distances between two microphones are varied from 100 mm to 300 mm with 50 mm step. The final results are the average of these five measurements. The acoustic centres used for the sensitivity calculation are the nominal values given in IEC :1995. The acoustic centres for the higher frequencies were obtained by extrapolation method. NMIJ: The free-field sensitivity was determined in compliance with IEC :1995, using a reciprocity calibration system developed by NMIJ. In the system, both the signal generation and the signal processing were executed by a dual-channel FFT analyzer, model CF-50 of ON0 SOKKI Co. Signal to noise ratio was improved by the synchronous waveform averaging method. The insert voltage technique was used to cancel the effect of the gain and impedance of an electrical circuit. The calibration was performed by using software of our own making. Sound absorbing wedges made of glasswool are attached on the inside walls, ceiling and floor of an anechoic chamber. The inner space of the anechoic chamber is (W) 9.5 m by (L) 8.0 m by (H) 7. m. The cutoff frequency of the anechoic chamber is 40 Hz. The temperature and humidity inside the anechoic chamber are well controlled (3.0 ± 0.5 ºC and 50 ± 5 %, respectively).
10 The sensitivity was corrected to the reference environmental conditions by using K. Rasmussen's method [I]. At 31.5 khz, only pressure dependency has been corrected because of no reliable temperature coefficients. At 40.0 khz, neither pressure nor temperature dependency has been corrected because of no reliable pressure and temperature coefficients. The calibrations were normally carried out using only B&K type 4180 microphones. At low frequencies below 5000 Hz, however, type WS microphones (B&K type 4165 and type 4190) with cavity rings (B&K UA085) were also used to achieve high signal to noise ratio because the sensitivity of these microphones was about 10 db higher than that of type 4180 microphones. B&K type 4165 microphones were just used as the transmitter microphones and B&K type microphones were used as the reciprocal microphones. To minimize the influence of sound reflection, the virtual pulse technique was applied [, 3]. In this technique, firstly the voltage transfer function (VTF) between the input terminal of the transmitter microphone and the output terminal of the receiver microphone was measured by using swept-sine signal. The bandwidth of the swept-sine signal was 00 Hz (1 khz khz), 400 Hz (.0 khz - 5 khz), khz (6.3 khz khz) and 4 khz (16 khz - 40 khz), respectively. The centre frequency of swept-sine signal was equal to each measurement frequency. Secondly, the pulse response of VTF was computationally calculated by multiplying the virtual pulse signal by the VTF in the frequency domain. The influence of sound reflection could be minimized by the convolution of the pulse response and a window function [, 3]. The acoustic centres were calculated from the VTFs by using least square method. In the VTFs measurements, the actual distances were set to 10, 15 and 0 cm (1000 Hz Hz) and 15, 0 and 5 cm (6300 Hz Hz), respectively. The microphones used for determining the acoustic centre were the same as the calibration. The influence of reflection was similarly minimized by the virtual pulse method [, 3]. Values of the air attenuation coefficients were obtained according to IEC Annex B. Density of air was calculated in compliance with IEC , Annex F.1 (Density of humid air). Reference [1] K. Rasmussen, "The static pressure and temperature coefficients of laboratory standard microphones," Metrologia 36 (1999). [] T.Fujimori, "Free-field calibration of "1/-in" microphone," 3 rd. joint meeting of ASA and ASJ (1996). [3] T. Fujimori et. al, "Measurement of acoustic center position of LSP Laboratory standard microphones," J. Acoust. Soc. Jpn. ( J ) 58, (00). LNE: According to the technical protocol of the key comparison CCAUV.A-K4 (October 006), this report completes the two standard calibration certificates issued from LNE after the key comparison CCAUV.A-K4 in order to provide additional information on the calibration method. All the pieces of information required in the technical protocol ( reporting results) are listed below in the following paragraphs.
11 The environmental conditions during the calibrations. Pressure : to hpa Temperature :.8 to 3. C Relative humidity : 44 to 50 % The actual distance(s) used between the microphones during the calibrations. The results given in the calibration certificate correspond to the mean values of three calibrations obtained using three distances. The used distances between microphones body (not including frontal cavity depth) are: 5 cm, 30 cm and 35 cm. Values of the temperature and pressure coefficients of the microphones used in the calculations. The temperature and pressure coefficients of the microphones are calculated using the polynomial constants given by the manufacturer (technical review N 1 001) and using a constant microphone resonant frequency of 3 khz. A summary of the uncertainty calculation and the overall uncertainties calculated for a coverage factor of k=. The budget was sent before the comparison starts. The effect on the reported results. Air density is calculated using the polynomial formula given in Report PL11b, 1997 DTU. The effect on sensitivity calculation seems to be lower than db. Air attenuation coefficient is calculated using the polynomial formula given in Report PL11b, 1997 (DTU). The effect on sensitivity calculation seems to be lower than db. The values of the acoustic centres used in the calculation. Acoustic centres used in calculation are those given in IEC :1995. For frequencies greater than 0 khz, this value is set to 0 mm. Calibration results using three decimals (if not already given in the certificate). Calibration results are given with 3 decimals in the calibration certificate and with a full resolution in the additional results spreadsheet. The interpolation technique used if the actual measurements are not performed at the required frequencies. None interpolation technique is used: calibrations are carried out at the required frequencies. The technique used to estimate the free-field sensitivity at low frequencies if a direct calibration is not available. Free field calibrations are carried out at the all the nominal preferred 1/3-octave frequencies from 1000 to Hz. However in order to provide acoustical disturbances filtering, calibration requires additional frequency points which are measured for frequencies greater than 950 Hz and estimated above. That estimation involves the individual pressure sensitivity of each microphone and the diffraction correction given in IEC/TS
12 The effect of the diffraction correction is lower than 0.01 db on the free-field sensitivity at 1 khz and negligible for the other frequencies. PTB: Methodology for free field calibration CCAUV-A-K4 The calibration was performed as a reciprocity calibration according to IEC in an electrically shielded anechoic chamber with a net volume of about 15 m 3 and free dimensions of about.0 x.0 x 3.7 m 3. The microphone mounts were vertically placed half-inch hollow tubes holding the receiver preamplifier (B&K 645) and the transmitter housing. An essentially constant voltage of approximately 6 V (rms) was directly fed to the terminals of the transmitter housing and measured by one channel of a dual channel FFT analyzer type Ono Sokki 6400 which also provided the transmitter voltage and performed a phase-locked averaging of the input signals. The other channel of the analyzer was connected to the receiver chain, consisting of the preamplifier type B&K 645, a measuring amplifier type B&K 636 and a third-octave filter type B&K The gain of the receiver chain, including the loading of the receiver microphone by the preamplifier, was determined using the insert voltage technique. The analyzer measured the ratio of the FFT spectra of both channels. In order to calculate the transmitter current, the effective capacitance of the transmitter microphones was measured for all frequencies by means of a capacitance bridge type QuadTech 7600 using a specific microphone housing. The electrical transfer impedance was then calculated from the spectral ratio, the receiver channel gain and the effective transmitter microphone capacitance. The polarization voltage for the transmitter microphone was provided by a modified microphone front-end type Norsonic 336, for the receiver microphone it was generated within the B&K 636 measuring amplifier. The polarization voltages were checked by a differential voltmeter type Fluke 893A. For each measurement frequency several electrical transfer impedance measurements were performed in linear distance steps, distance ranges and number of steps are given in the certificates. The electrical transfer impedance per frequency was finally derived from a linear regression analysis of the electrical transfer impedance over the microphone distance. The open circuit free-field sensitivity was calculated using the formulae and data given in the current edition of IEC and transformed to the reference conditions, see certificate. Because all calibrations were performed at the required frequencies, no interpolation technique was applied. INMETRO: The basic procedure to calibrate microphones in free-field is described in the international standard IEC The calibration method used by INMETRO employs digital signal processing techniques to identify and to minimize the effect of the components that interfere in the determination of the sensitivity of the microphones. Among these components, crosstalk, multiple backscattering and sound reflections inside the anechoic chamber are considered. The crosstalk was suppressed using the subtraction technique. A correction file including the magnitude and phase response of a dummy microphone with similar capacitance to the B&K4180 is first
13 obtained. Then, all voltage measurements of the receiver microphone are corrected by the subtraction of this correction file. This procedure allows the suppression of this specific component, which interferes most strongly in the result of the reciprocity method in free field. The multiple backscattering between the microphones and the other sound reflections present in the impulse response of the voltage output of the receiver microphone were suppressed by using a time-selective signal processing technique. A hybrid non-symmetric time-window function formed by the combination hanning-rectangular-hanning with width of respectively ms, 11 ms, 0.85 ms was used for the time-selection of the direct sound. The measurements of the electrical impedance were carried out at the distances between the microphones of 170 mm, 00 mm, 40 mm and 300 mm. The analyzer was configured for a resolution of 1.47 Hz between frequency bins. The interpolation technique used to obtain the sensitivities at the preferred nominal frequencies was the simple arithmetic mean between the results measured at the adjacent lower and upper frequency bins. Table 1 presents the values of the used acoustic centres for the determination of the sensitivity of the B&K4180 microphones serial numbers and Table 1 Acoustic centres in metres. a The measured sensitivities at the environmental conditions of the laboratory were corrected to the reference environmental conditions. The correction method used is the one described in IEC (1995) for measurements up to 31.5 khz. This same correction method was also applied up to the frequency of 40 khz. INMETRO used the values [of the temperature and static pressure coefficients] described in Rasmussen, Metrologia 36 (1999). 4.. Microphone parameters Besides the open-circuit, free-field sensitivities of the microphones, the protocol requested that the laboratories should submit additional microphone parameters: Values of the temperature and pressure coefficients used in the calculations, and values of the acoustic centres used in the calculation, The values of the temperature and pressure coefficients reported by each laboratory are given in the following tables and 3. The values of the acoustic centre are given in the table 4 below. Table. Microphone parameters DFM CENAM KRISS NMIJ LNE PTB INMETRO Front cavity depth (mm) N.R. N.R. N.R Temp. coeff. at 50 Hz (db/k) Static press. coeff. at 50 Hz (db/kpa) Resonance frequency (Hz) N.R N.R. a Note: This table is omitted here. The acoustic centres are presented in the following section.
14 Table 3. Microphone parameters DFM CENAM KRISS NMIJ LNE PTB INMETRO Front cavity depth (mm) N.R. N.R. N.R Temp. coeff. at 50 Hz (db/k) Static press. coeff. at 50 Hz (db/kpa) Resonance frequency (Hz) N.R N.R. Table 4. Acoustic centre (in mm) as a function of frequency reported by each laboratory. Frequency (Hz) DFM CENAM KRISS NMIJ LNE PTB INMETRO Microphone sensitivities Each laboratory reported their results after their own measurement round. Once all data was gathered, a preliminary analysis was made, and it showed that there were some discrepancies among laboratories. A few laboratories were asked to review their submission, and to resubmit if it was necessary, with an explanation of the reason for the review. All but one laboratory (NMIJ) declined to resubmit. NMIJ sent the reviewed data with the following explanation. NMIJ found two errors and corrected the free-field sensitivity levels and acoustic centres accordingly. (1) As described in Sec. 4.1, NMIJ used the virtual pulse method to minimize the influence of sound reflection. At 16 khz and above, the delay time to separate the direct sound from the reflected sound was wrongly set to be 5 ms instead of correct 0.5 ms. Therefore, the influence of sound reflection among the transmitter and receiver microphones still remained in the VTF (voltage transfer function). Acoustic centres were also incorrect due to the same reason. () At 31.5 khz, unintended data were acquired from the FFT analyzer because the frequency was specified by mistake. The following tables show frequency dependence of free-field sensitivity levels for each microphone and values of the acoustic centres before and after correction.
15 The open-circuit, free-field sensitivity level reported by each laboratory for each microphone at each frequency is given in the tables 5 and 6 below. The sensitivity level is given in db re 1 V/Pa. The uncertainties in db declared by each laboratory are listed in table 7. Table 5. Free-field sensitivity level of the microphone in db re 1 V/Pa Frequency (Hz) DFM CENAM KRISS NMIJ LNE PTB INMETRO * * * * * * Note: The values marked with * have been excluded from the calculation of the Key Comparison Reference value (see 5.) Table 6. Free-field sensitivity level of the microphone in db re 1 V/Pa Frequency (Hz) DFM CENAM KRISS NMIJ LNE PTB INMETRO * * * * * * * * Note: The values marked with * have been excluded from the calculation of the Key Comparison Reference value (see 5.)
16 Table 7. Expanded uncertainties in db using a coverage factor of k=, as declared by the participant laboratories Frequency (Hz) DFM CENAM KRISS NMIJ LNE PTB INMETRO
17 5 Analysis of the results 5.1. Degrees of equivalence The nature of this comparison, with seven participants following a single loop with two travelling standards, should make it possible to use simple methods for estimating the comparison reference value such as those used in the comparisons CCAUV.A-K1 and CCAUV.A-K3. The methodology used in this report is similar to the one used in the Key Comparison CCAUV.A-K3 [1]. In general, a linear model described by Ey ( )= X ahas to be solved for each frequency. In the model a is a vector of parameters of the model, E(y) is the expectation of the measurements and X is the design matrix; these values are the values that should have been measured in absence of uncertainty. The vector y is conformed by the n measurement values provided by the participants on at least one of the circulated measurement objects. The elements of the design matrix are known a priori with zero uncertainty. The parameters a 1 a k, k 1, are unknown and have to be estimated from the n measurement results provided by the participants y, and the associated covariance matrix Σ. The covariance matrix Σ is the sum of two matrixes: Σ meas, which contains the square of the uncertainties claimed by the participants (diagonal elements) and the covariances between the provided measurement results (off-diagonal elements), and Σ object, which contains only diagonal elements that describe the estimated variance of the value of the measurand due to random instability of the circulated objects. Once these matrices have been built, the unknown parameters in the model and the reference values of the comparison can be estimated following the rest of the procedure described in reference []. In the analysis presented in this report it has been assumed that the correlation for two results y i and y j provided by different participants is equal to 0. In the case of two results y i and y j provided by the same participant, a common correlation coefficient for all participants has been assumed. The common correlation coefficient ρ was determined by the pilot laboratory using its own data, as described in Annex A. Additionally, the circulated measurement objects were considered stable, so that Σ object = 0 in the analysis. The covariance matrix and the matrix of the results of the participants are constructed using the data supplied by the participants. Because no further linking to any existing comparison is to be made, no additional matrixes with data from such a comparison are built. The model looks then as E M E E M E ( y ) 1,1 ( y1,7 ) ( y ),1 ( y ),7 1 M 1 = 0 M 0 0 M 0 a1, 1 a M 1 (1) where E(y i,j ) is the expected value of the i-th standard being measured in the j-th laboratory in the loop. The elements of the vector a i are the parameters to be estimated for the standard i. The covariance matrix is a 14 x 14 matrix that contains the declared uncertainties from each laboratory. The correlation value for measurements carried in the same laboratory is frequency dependent, and it was determined from the measurements made at the pilot laboratory. See Appendix A for a detailed explanation of the calculation of the correlations.
18 Once these matrices are complete, the estimates of the unknown parameters of the model can be calculated using: aˆ = CX C = T r 1 r T 1 1 ( X Σ X ), r Σ r y r r, () where y r and X r are obtained from y and X given in (1) by deleting the rows associated with the laboratories excluded from the calculation of the reference values, and Σ r is the covariance matrix associated with the reduced data set y r The reference values of the comparison and the associated covariance matrix should be calculated using: yˆ = Xaˆ, V (ˆ) y = XV (ˆ) a X T. (3) The degrees of equivalence are obtained using: V D = A ( y yˆ), T ( D ) = A V ( y yˆ ) A, ii ii T (4) where D ii is the degrees of equivalence per laboratory, A is an averaging matrix. The interlaboratory degrees of equivalence can be estimated using [1]: D = D D ij ii jj, ( ij ) = ii + jj ij ji, V D u u u u (5) where D ij is the inter-laboratory deviation. The u xx elements are obtained from equation (4). 5.. Equivalence and consistency of results As the participating laboratories are measuring the same item, it can be assumed that the reported results are drawn from a normal distribution. This hypothesis is tested by means of an observed χ - distributed estimator, as described in []. The degrees of freedom of the χ distribution are ν = n-k, where n is the number of measurements (14 for most frequencies) and k the number of standards ( LSaP microphones). To accept the hypothesis with a significance of 5 %, the probability P{ χ (ν)>χ obs} has to be larger than 5 %. During the course of the comparison, any anomalous results need to be identified by the pilot laboratory. Any laboratory whose results show deviations judged to be irregular must be contacted in order to have an opportunity to revise their results. Details of this process are given in section 4.3. Identifying discrepant measurements Once all data was collected, and the participants reported any problem with their measurement, the analysis method in [] was implemented. This method uses the normalized deviations that were calculated for every frequency and measurement. The method assumes that the normalized deviations are distributed as N(0,1). Therefore, if the modulus of a particular normalized deviation is
19 greater than, the corresponding measurement can be considered discrepant with a significance of 5 %. Handling of discrepant measurements If a measurement has been judged to be discrepant, it should be excluded from the least squares calculation of the reference values. Otherwise the calculated reference values cannot be considered to be proper estimates of the SI values of the quantities represented by the circulated objects. If there is a discrepant measurement y ij in a key comparison and the uncertainty assigned to this measurement is very small, the key comparison reference value will be attracted to this discrepant result. As a consequence the remaining results might appear to be discrepant as well even if they are mutually consistent. Since one discrepant measurement will always have a value d ij larger than the values d kj, i k of two or more mutually consistent values, the value y ij with the larger value d ij should be excluded first. A repeated least squares adjustment of the reference values will then show if there are further discrepant results. The procedure of excluding discrepant results one by one can be summarized as follows: 1. Identify the result y ij with the largest value d ij > in the (reduced) set of results.. Exclude the result y ij from the reduced set of results. 3. Repeat the least squares adjustment of reference values for the reduced set of results. 4. If the results in the reduced set are not mutually consistent, continue at point 1. It has to be emphasized, that the discrepant results are excluded only from the calculation of the reference values and not from the key comparison as such. It is therefore still necessary to calculate the deviations of the discrepant results from the reference values and the uncertainties of these deviations. Reference [] gives a detailed explanation of the procedure.
20 6 Results 6.1. Reference values As in previous comparisons, there is not a single key comparison reference value, but one per frequency associated with each one of the standards circulated. The reference values are listed below in table 8. These values were obtained using the procedure described in the previous section. Some discrepant results were found at some frequencies. In all cases where a discrepant measurement was found, this measurement result or results have been excluded from the determination of the reference values (see tables 5 and 6 in section 4.3). Table 8. Reference values for the comparison. Free-field sensitivity levels M f in db re 1V/Pa and expanded uncertainty U (k = ) in db. Freq (Hz) M f U k = M f U k = Degrees of equivalence per laboratory The deviation of the measurements, that is, the reported measurements in table 5 and 6 minus their respective reference value in table 8 are plotted in figure.
21 Figure. Deviations of the free-field sensitivity levels of each microphone reported by the participant laboratories: (a) microphone , and (b) microphone The degrees of equivalence per laboratory were determined as mentioned in the previous section (equation (4)). Figure 3 below shows average deviation in db per laboratory as a function of frequency. Tables 9 and 10 present the degrees of equivalence and their uncertainties in tabular form. Figure 3. Average deviation in db per laboratory and frequency.
22 Table 9. Degrees of equivalence per laboratory as function of frequency: deviations (db). Frequency (Hz) DFM CENAM KRISS NMIJ LNE PTB INMETRO Table 10. Degrees of equivalence per laboratory as function of frequency: uncertainty k = (db) Frequency (Hz) DFM CENAM KRISS NMIJ LNE PTB INMETRO
23 The degrees of equivalence calculated for the frequencies,.5 khz, 4.0 khz, 8.0 khz, and 0.0 khz are shown in figure 4.
24 Figure 4 Inter-laboratory degrees of equivalence at.5 khz, 4 khz, 8 khz, and 0.0 khz. Table 11 shows the results of the χ test applied to the comparison results for specified values of the correlation coefficient between results provided by the same laboratory. As demonstrated in [1], when high correlation coefficients are used, the test tends to fail. This is simply because a high correlation forces the differences to be the same for the two standards, and that may not be the case. Although at some frequencies the result of the χ test is low, in general this test has been considered satisfactory when the correlation between measurements of the same laboratory takes the values tabulated in Appendix A. Table 11. Results of the χ test as described in []. The correlation coefficients used in the calculations are shown in the table in Appendix A. Frequency (Hz) P{ χ (ν)>χ obs} % % % % % % % % % % % % % % % % %
25 6.3 Degrees of equivalence inter-laboratory Tables 1, 13, 14 and 15 contain the inter-laboratory degrees of equivalence of this comparison. Table 1. Inter-laboratory degrees of equivalence at.5 khz. The upper triangle contains the differences (db); the lower triangle contains the uncertainties k = (db).5 khz DFM CENAM KRISS NMIJ LNE PTB INMETRO DFM CENAM KRISS NMIJ LNE PTB INMETRO Table 13. Inter-laboratory degrees of equivalence at 4.0 khz. The upper triangle contains the differences (db); the lower triangle contains the uncertainties k = (db) 4.0 khz DFM CENAM KRISS NMIJ LNE PTB INMETRO DFM CENAM KRISS NMIJ LNE PTB INMETRO Table 14. Inter-laboratory degrees of equivalence at 8.0 khz. The upper triangle contains the differences (db); the lower triangle contains the uncertainties k = (db) 8.0 khz DFM CENAM KRISS NMIJ LNE PTB INMETRO DFM CENAM KRISS NMIJ LNE PTB INMETRO
26 Table 15. Inter-laboratory degrees of equivalence at 0.0 khz. The upper triangle contains the differences (db); the lower triangle contains the uncertainties k = (db) 0.0 khz DFM CENAM KRISS NMIJ LNE PTB INMETRO DFM CENAM KRISS NMIJ LNE PTB INMETRO Page 6 of 44
27 7 Conclusions The aim of the Key Comparison CCAUV.A-K4 is to establish reliable equivalence between National Metrology Institutes for free-field calibration of Laboratory Standard microphones of the type LSaP. The initial plans involved nine participants. However, once the comparison was underway, two laboratories decided to decline from participating. Two LSaP microphones were circulated among the participants in a single star configuration. All participants reported the free-field sensitivity and other microphone parameters such as acoustic centre, environmental coefficients, etc. The reported sensitivities have been analysed using a least-squares technique similar to the one used in the Key Comparison CCAUV.A-K3. All laboratories were included in the estimation of the reference values. There is no preceding comparison with which the obtained degrees of equivalence can be compared. 8 References [1] V. Cutanda-Henríquez, and K. Rasmussen, Final Report on the Key Comparison CCAUV.A- K3, Centro Nacional de Metrología, México, Danish Primary Laboratory for Acoustics, Denmark, May 006. [] L. Nielsen, Identification and handling of discrepant measurements in key comparisons, Danish Institute of Fundamental Metrology, DFM-01-R8, 00. Page 7 of 44
28 Appendix A Determination of the correlation coefficients The correlation coefficients used in the analysis were determined from a relatively large set of freefield sensitivity data gathered at DFM from all the control measurements carried out on the travelling standards. The DFM s own uncertainty budget was also used in the determination of the correlation coefficients. In principle, this calculation should only be valid for DFM s correlation coefficients, but it has been chosen to use them for all laboratories. In the following, all operations are referred to this set of measurements. The covariance was determined as the sum of the contributors to the uncertainty of the measurement that affect the sensitivities of both microphones in a similar manner, including the reproducibility, that is, the type B contributors. Some of these contributors are: the environmental variables, the polarising voltage, the reference impedance, the effective distance between microphones, and the mathematical manipulations. ( M f M f ) = ui Cov,, B 1 (A.1) where M f1 and M f are the free-field sensitivities of the microphones, and u i is the i th uncertainty type B component in the uncertainty budget. In order to have a more realistic estimate of the experimental reproducibility, the experimental correlation coefficient of the sensitivities of the two microphones, ρ xy, was calculated, and used for determining the experimental covariance by means of: (, ) ρ xy σ σ, Cov A M f 1 M f = 1 (A.) where σ 1, and σ are the standard deviations of the free-field sensitivity of each microphone. Finally, the correlation coefficient at each frequency was determined using the sum of all covariances divided by the product of the combined variance of the two microphones (which is the same for the two microphones): Cov = ( M f 1, M f ) + Cov B ( M f 1, M f ). A ρ (A.3) umf 1 umf The correlation coefficients obtained by such a procedure are presented in the table below. Frequency (Hz) Correlation Frequency (Hz) Correlation Page 8 of 44
29 Appendix B INMETRO corrections to reported results During the process of reviewing the draft A, INMETRO requested to introduce some corrections to the data originally reported. Table B1 contains the original and revised sensitivities of the two microphones. The reason given by INMETRO for this correction is the following: The sensitivity results reported in the cancelled documents (i.e. calibration certificates DIMCI 009/008 and 010/008) where erroneously referred to the nominal centre frequencies of 3rdoctave band, as requested by the measurement protocol of the comparison CCAUV.A-K4. It was detected that these sensitivity results refer to the exact centre frequencies of 3rd-octave bands of base, which are obtained by the equation 1000*N/3, where N is an integer. This situation implies that some frequencies match but others are different. A coincidence between the nominal and exact frequencies within the frequency range of the comparison is obtained at 1 khz, khz, 4 khz, 8 khz and 16 khz. Unfortunately, the INMETRO only perceived this fact after the confirmation sent to you. The mismatch between some of the frequencies reported and the ones requested in the protocol implies in significant differences that required this communication. Table B1 Original and revised sensitivity level data for the two microphones. Sensitivity level (db re 1 V/Pa) Freq (Hz) Original Revised Original Revised Page 9 of 44
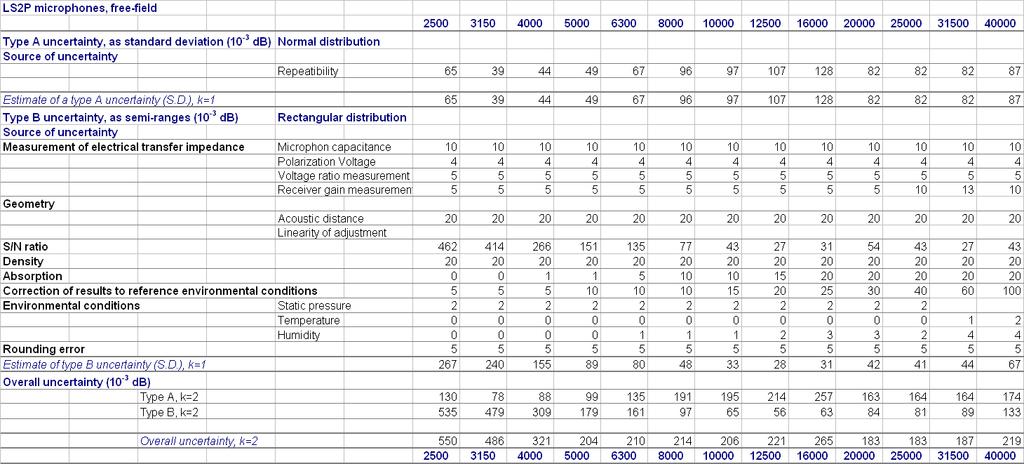
30 Appendix C Uncertainty budgets Uncertainty budgets were requested of all participants. The budgets are reproduced here as they were received from the participants. No editing of the contents but a small amount of reformatting has been performed. Table, equation and figure numbers do not follow the numbering in the report. Page 30 of 44
31 DFM The condensed uncertainty budget for a free-field reciprocity calibration of B&K type 4180 microphones are given in the table below. The free-field sensitivity is determined as the average of the results derived using four measuring distances between mm for type B&K The background for the budget is given in the following remarks: 1. The figures represent the combined effects of the uncertainty on the distance between the microphone diaphragms (0.05 mm), front cavity depth (0.05 mm) and acoustic centres ( mm) referred to the average distance of 40 mm.. The figures represent the combined effects of the measurement uncertainties on static pressure (50 Pa), temperature (0.5 K) and relative humidity (10 %). 3. The figures represent the combined effects of the measurement uncertainties on static pressure (50 Pa), temperature (0.5 K) and relative humidity (10 %). 4. The figures represent the effect of the basic uncertainty on the equations for calculating the absorption and density of humid air. 5. The figures represent the combined effects of the uncertainty on the measurement impedance and voltage ratios (3 ratios each derived from 4 voltage measurements). 6. The figures represent the uncertainty on the polarizing voltage (40 mv) and the non-linear relation between polarizing voltage and microphone sensitivity. 7. The figures represent the possible errors introduced by the signal manipulations, such as digital filtering, inverse FFT-applications and subsequent removal of reflections in the time domain etc. 10. The figures represent the uncertainty on applying a correction for dependence of static pressure and temperature on the microphone sensitivity. (Uncertainty on resonance frequency, on low-frequency value of static pressure coefficient and on temperature coefficient, allowed deviation from reference conditions 3 kpa respectively 1 K). Page 31 of 44
32 Uncertainty budget for free-field reciprocity calibration of B&K 4180 microphones Components of type B uncertainties in db*1000 Frequency khz Source 1 Effective distance Density of air Air absorption Environmental equations Electrical transfer impedance Polarizing voltage Mathematical manipulations Rounding of results σ ( ) 1/ B = u / Components of type A uncertainties in db* Allowed reproducibility Overall uncertainty in db*1000 at measurement conditions ( ) 1/ σ = σ + σ A B Uncertainty on corrections to reference environmental conditions in db* Correction to reference conditions Overall uncertainty in db*1000 at reference conditions (k=) Expanded uncertainty in db Declared CMC values * * Not included in the CMC Page 3 of 44

33 CENAM
34 KRISS Electrical Transfer Impedance Symbol Uncertainty Unit Series Capacitor C Table nf Voltage Ratio VR Table Inherent Noise Measured Distortion Measured Frequency f Table Hz Reveiver Ground Shield B&K Transmitter Ground Shield B&K Microphone Parameters Acoustic Center 1 mm Polarizing Voltage Uo V Measurement Conditions Distance between Microphones l 0.1 mm Static Pressure Ps kpa Temperature T K Relative Humidity RH % Processing of Results Rounding Error db Repeatability of Measurements Table Static Pressure Corrections Table Temperature Corrections Table Sjgnal Processing Error ,05 Sum Expanded Uncertainty (k=) Stated Uncertainty

35 NMIJ Page 35 of 44
36 LNE Free field calibration of microphones by the reciprocity technique Uncertainty evaluation J-N Durocher, D. Rodrigues, LNE july 007 Microphone sensitivity product The module of the microphone sensitivity product is given by (microphone 1 as receiver and as emitter): M αd' U1 D' 0 1. M = 10 I ρ1 f U 1 = Z is the measured electrical transfert impedance e With 1 I - f is the frequency - D is the distance between the acoustic center of the microphones D =D-δ where δ is the acoustic center position (relative to the diaphragm) and D the distance between the microphone diaphragms (δ is assumed independent of the microphone). - ρ1 is the air density during the measurement of Z e1 - α is the air absorbtion (assumed constant during the 3 Z e measurements) Expressed in db, the above microphone sensitivity product become : ( M 1M ) = L1 + CD CR + C f + D K sys L + L = lg ' α with C = lg( D') C = 0lg( ρ ) C 0lg( / ) D 0 R1 1 f = f And where K sys corresponds to the systematic deviation from the ideal conditions (K sys is a null correction only used for uncertainties calculation) K + Sys = K pole + K polr + Kϑ E + KϑR + K Echos + K Elec K Air with : - Polarization voltage of the two microphones K pol - Angular deviation of the two microphones from the main axis K θ - Acoustical disturbances K echo - Electrical disturbances K elec - unknown deviation K unk Electrical transfert impedance measurement The elementary measurement is a voltage ratio measurement : U U R1 = ω E C U1g I g R1 E And thus Z e1 U = I 1 U R1g E = CωU g E R1 Page 36 of 44
37 Where : - g R1 corresponds to the gain of the receiver microphone amplifier (insert voltage with the microphone n 1) and G R1 = 0.lg(g R1 ) - g E corresponds to the gain of the emmiter microphone amplifier and G E = 0.lg(g E ) - Z e1 corresponds to the electrical transfert impedance with the microphone microphone n 1 and n ) and L 1 = 0.lg(Z e1 ) - C corresponds to the electrical capacitance used for the current measurement and CC is the corresponding correction (db) = 0lg( Cω) C C The electrical transfert impedance expressed may be written in db : L ( Ze 1 ) = G1 + GE GR Att CC 1 = 0 lg 1 Where Att corresponds to the attenuation (db) of the attenuator used for the insert voltage method. For the following microphone configurations 13 and 3 : L 13 = G13 + GE GR 1 Att CC L3 = G3 + GE GR Att CC and thus, the electrical transfert impedance combination : L + L L G = + G G G + G GR + Att C E C R1 Individual microphone sensitivity The sensitivity of the microphone n 1 can be written as : L + L L C + C C + C + αd' + K R1 R13 R3 D f sys L 1 = + + C C proc where C proc is the equivalent correction to process the results. ( G1 + G13 G3 ) + GE GR 1 + GR Att CC ( CR1 + CR 13 CR ) + CD + C f + D' + C proc K sys 1 3 α L = + Uncertainty budget : 4u ( L1 ) = 7u ( G) + 3u noise + u ( Att) + u ( CC ) + 3u ( CR ) + u ( CD ) + u ( C f ) + u ( αd') + u ( K sys ) + 4u proc Uncertainties evaluation Page 37 of 44
38 Basic parameters measurement Quantity Mean value Unit U k u Distance : D (between diaphragms) 0,3 m , Temperature : T 3 C 1 3 0,58 Pressure : P 1013 hpa 1 3 0,58 Relative humidity : HR 60 % 5 3,89 Voltage ratio measurement : G - db 0,01 3 0,0058 Noise component The effect of the acoustic noise depends on the frequency and on the distance between the microphones. For LS microphones, the standard uncertainty u noise is estimated as : u D ( db) = 0,133 0,3 noise F khz where F khz = f / 1000 Attenuator component The maximum uncertainty due to the attenuator is estimated as 0,01 db. u att ( db) = 0,01 3 = 0,0058 Capacitor component The calibration of the capacitor gives C = 4744,0 pf ± 0,01 % ± 0,1 pf (k=) It results : u C = 0,001 / = 0,00061 db Air density component Using the formulation of the air density given in IEC Annex F and the usual air conditions, we obtain : u( C Rmn ) 3 4 ( 8,57.10 ). u ( P ) + (,93.10 ). u ( T ) + ( 9,15.10 ). u ( Hr) = db hpa Page 38 of 44
39 and using the uncertainties given in 1 : u ( ) = 0,018 db C Rmn Distance between microphones component Using equation D' = D δ and D >> δ we find, u( D') D' u( D) D u( δ ) + D Using the approximation 0lg(1 + x) 8. 7x u D D' + u( D') u( D') u( D) u( δ ) = 0lg D' D' D D db Assuming that the maximum uncertainty of the acoustic center position is 1 mm, we have 0, 011 u D D = db Air absorbtion component u ( αd') = [ D' u( α )] + [ αu( D')] u( α ) D Assuming that the air absorption coefficient α(f) is defined with a maximum relative uncertainty of 10 %, while α 4 0, ,63.10 FkHz 0,1 D u + 3 0,3 [ 7 1,5 F ] 5 ( ) D = αd = 10 khz α db Result processing component 0,001 Rounding the results component : u = 0, 0056 db proc1 = 3 Repeatability is estimated as : u 001 proc = 0, , F khz db Transposition to the reference conditions. The correction is C Cond = CPΔ P + CT ΔT with Δ P = P Pref ΔT = T Tref u Cond = C P u ( P) + u ( C ) u ( ΔP) + C u ( T ) + u ( C ) u ( ΔT ) P T T Page 39 of 44
40 where u(δp), u(δt) are the standard deviations corresponding to the ranges of static pressure or temperature allowed for the calibration. Using the raw approximations : C P = 0, ,00001 F khz db/hpa and C T = 0, ,00067 F khz db/k And assuming that u(c P )/C P = u(c T )/C T = 10 % Using the uncertainties listed in 1, we obtain : u u 5 ( P) = 0, ,5. FkHz proc3 = CPu 10 db 4 ( T ) = 0, ,7. FkHz proc4 = CTu 10 db And considering the extreme variations allowed : 00 3 u( ΔP) = = 115 hpa ( ΔT ) = = 1, u C we obtain : u u 5 ( ΔP) = 0, FkHz proc5 = u( CP ). u 10 db 5 ( ΔT ) = 0,001+ 6,7. FkHz proc6 = u( CT ). u 10 db Polarization component Assuming that u( V 0, Pol ) = 3 V u VPol + u( VPol ) 0, = 0 lg 8,7 = 0, V Pol 00 3 Pol 005 db Angular deviation component Using a directivity law based on the cylindrical piston in a plane baffle, transposed on the size of the LS microphones, we obtain the approximation : u u( ϑ) F khz db ϑ with ϑ expressed in degree Using 6 u ( ϑ) = deg, we obtain uϑ 4.10 FkHz db 3 Acoustical disturbances component Page 40 of 44
41 Acoustical disturbances are not completely removed by the treatment and the treatment will cause a systematic error in the measured sensitivity product. Simulation with LS microphones give u echo = 0,01 db Electrical disturbances component The estimation for the total harmonic distortion is u = 0,01 3 = 0, 0058 db THD Crosstalk is partially removed by the acoustical treatment. The estimation for the residual component is : u 0, , 005 = db cross F khz Unknown component Free field calibration comparisons carried out in the past showed systematic deviations in the high frequency range (f 10 khz). Causes are not well known but may be one of the following : Air composition in anechoic rooms Temperature increase near to the receiver microphone Crosstalk in the emitter microphone circuit In the absence of further explanations, deviations observed are take into account. The deviation follow approximately : ( F /8) u unk = 0,3. Lg khz db for frequencies > 8 khz Page 41 of 44
42 Uncertainties calculation Frequency Microphone sensitivity uncertainties (db) [k=] khz D = 5 cm D = 30 cm D = 35 cm 1,00 0,17 0,4 0,3 1,5 0,14 0,19 0,5 1,6 0,1 0,16 0,0,0 0,11 0,13 0,17,5 0,09 0,11 0,14 3,15 0,09 0,10 0,11 4,0 0,08 0,09 0,10 5,0 0,08 0,08 0,09 6,3 0,08 0,08 0,08 8,0 0,09 0,08 0, ,10 0,10 0,10 1,5 0,13 0,13 0, ,17 0,16 0,16 0 0,1 0,1 0,1 5 0,6 0,6 0,6 31,5 0,31 0,31 0, ,38 0,38 0,38 Page 4 of 44
43 PTB
FINAL REPORT ON KEY COMPARISON APMP.AUV.A-K3
 FINAL REPORT ON KEY COMPARISON APMP.AUV.A-K3 29 November, 2011 Dr. Hyu-Sang Kwon, Dr. Sang-Joon Suh and Jae-Gap Suh Korea Research Institute of Standards and Science (KRISS) Metrologia Tech. Suppl. 49
Report on Key Comparison COOMET.AUV.A-K5: Pressure calibration of laboratory standard microphones in the frequency range 2 Hz to 10 khz
 Report on Key Comparison COOMET.AUV.A-K5: Pressure calibration of laboratory standard microphones in the frequency range to 10 k June 016 Author: Co-author: Danuta Dobrowolska (GUM, pilot) Alexander Kosterov
SIM AUV.A-K1.prev Microphone Intercomparison
 Participants: Report on SIM AUV.A-K1.prev Microphone Intercomparison by Knud Rasmussen, DPLA CENAM, División de Vibraciones y Acústica km 4,5 Carretera a los Cués C.P. 76241 Querétaro, México DPLA, Danish
Comparison of measurement uncertainty budgets for calibration of sound calibrators: Euromet project 576
 NPL REPORT CMAM 73 Comparison of measurement uncertainty budgets for calibration of sound calibrators: Euromet project 576 Peter Hanes October 2001 The National Physical Laboratory is operated on behalf
A practical implementation of microphone free-field comparison calibration according to the standard IEC
 Downloaded from orbit.dtu.dk on: Jun 08 2018 A practical implementation of microphone free-field comparison calibration according to the standard IEC 61094-8 Barrera Figueroa Salvador; Torras Rosell Antoni;
Uncertainties associated with the use of a sound level meter
 NPL REPORT DQL-AC 002 Uncertainties associated with the use of a sound level meter Richard Payne April 2004 April 2004 ABSTRACT Uncertainties associated with the use of a sound level meter Richard Payne
Technical Protocol of the CIPM Key Comparison CCAUV.V-K5
 Technical Protocol of the CIPM Key Comparison CCAUV.V-K5 2017-03-06 revised 2018-02-13 (changed schedule) Task and Purpose of the Comparison According to the rules set up by the CIPM MRA the consultative
FORCE STANDARDS COMPARISON BETWEEN PTB (GERMANY) AND CENAM (MEXICO).
 AND CENAM (MEXICO).") FORCE STANDARDS COMPARISON BETWEEN PTB (GERMANY) AND CENAM (MEXICO). Jorge C. Torres-Guzmán*, Amritlal Sawla**, Daniel Ramírez-Ahedo* * Centro Nacional de Metrología, México. **Physikalisch-Technische
FORCE STANDARDS COMPARISON BETWEEN PTB (GERMANY) AND CENAM (MEXICO). Jorge C. Torres-Guzmán*, Amritlal Sawla**, Daniel Ramírez-Ahedo* * Centro Nacional de Metrología, México. **Physikalisch-Technische
Static pressure and temperature coefficients of working standard microphones
 Static pressure and temperature coefficients of working standard microphones Salvador BARRERA-FIGUEROA 1 ; Vicente CUTANDA-HENRÍQUEZ ; Antoni TORRAS-ROSELL 3 1,3 Danish Fundamental Metrology (DFM) A/S,
On determination of microphone response and other parameters by a hybrid experimental and numerical method
 On determination of microphone response and other parameters by a hybrid experimental and numerical method S. Barrera-Figueroa a, F. Jacobsen b and K. Rasmussen a a Danish Fundamental Metrology, Matematiktorvet
Technical Protocol of the Bilateral Comparison in Primary Angular Vibration Calibration CCAUV.V-S1
 Technical Protocol of the Bilateral Comparison in Primary Angular Vibration Calibration CCAUV.V-S1 Updated at 12-December-2012 Task and Purpose of the Comparison According to the rules set up by the CIPM
COMPARISON OF THE METHODS TO CALIBRATE THE DIFFUSE FIELD SENSITIVITY OF LABORATORY STAND- ARD MICROPHONE
 COMPARISON OF THE METHODS TO CALIBRATE THE DIFFUSE FIELD SENSITIVITY OF LABORATORY STAND- ARD MICROPHONE Wan-Ho Cho, Hyu-Sang Kwon, and Ji-Ho Chang Korea Research Institute of Standards and Science, Center
J. Acoust. Soc. Am. 114 (3), September /2003/114(3)/1467/10/$ Acoustical Society of America
, September /2003/114(3)/1467/10/$ Acoustical Society of America") A time-selective technique for free-field reciprocity calibration of condenser microphones Salvador Barrera-Figueroa, a) Knud Rasmussen, b) and Finn Jacobsen c) Technical University of Denmark, Ørsted-DTU,
A time-selective technique for free-field reciprocity calibration of condenser microphones Salvador Barrera-Figueroa, a) Knud Rasmussen, b) and Finn Jacobsen c) Technical University of Denmark, Ørsted-DTU,
Final report on CCQM-K36.1 with erratum
 Final report on CCQM-K36.1 with erratum 5 October 2010 Ref 1107-03 HDJ Report no. DFM-2008-R07 Summary A follow-up comparison to CCQM-K36 has been carried out November 2007 to February 2008, designated
Final Report on the Torque Key Comparison CCM.T-K2 Measurand Torque: 0 kn m, 10 kn m, 20 kn m Dirk Röske 1), Koji Ogushi 2)
, Koji Ogushi 2)") Final Report on the Torque Key Comparison CCM.T-K Measurand Torque: kn m, 1 kn m, kn m Dirk Röske 1), Koji Ogushi ) 1) ) Dirk RÖSKE Physikalisch-Technische Bundesanstalt Department 1. Solid Mechanics orking
Final Report on the Torque Key Comparison CCM.T-K Measurand Torque: kn m, 1 kn m, kn m Dirk Röske 1), Koji Ogushi ) 1) ) Dirk RÖSKE Physikalisch-Technische Bundesanstalt Department 1. Solid Mechanics orking
CERTIFICATE OF CALIBRATION
 Page 1 of 10 CALIBRATION OF Sound Level Meter: Brüel & Kjær Type 3050-A-040 No: 3050-100751 Id: - Microphone: Brüel & Kjær Type 4189 No: 2621142 Preamplifier: Brüel & Kjær Type 2669 No: 2803547 Supplied
CERTIFICATE OF CALIBRATION
 Page 1 of 10 CALIBRATION OF Sound Level Meter: Brüel & Kjær Type 3050-A-040 No: 3050-100751 Id: - Microphone: Brüel & Kjær Type 4189 No: 2621142 Preamplifier: Brüel & Kjær Type 2669 No: 2679073 Supplied
Product Data. Brüel & Kjær B. Sound Intensity Calibrator Type 3541
 Product Data Sound Intensity Calibrator Type 3541 USES: Sound intensity and particle velocity calibrations Sound pressure calibration Measurement of pressure-residual intensity index FEATURES: Intensity
FINAL REPORT ON THE KEY COMPARISON EUROMET.AUV.A-K3
 FINAL REPORT ON THE KEY COMPARISON EUROMET.AUV.A-K3 June 26 CCAUV Approved September 26 ISTITUTO NAZIONALE DI RICERCA METROLOGICA & THE DANISH PRIMARY LABORATORY FOR ACOUSTICS Knud Rasmussen Danish Primary
A bilateral comparison of a 1 kg platinum standard
 DANSK FUNDAMENTAL METROLOGI DANISH FUNDAMENTAL METROLOGY Report on A bilateral comparison of a 1 kg platinum standard by Lars Nielsen Danish Fundamental Metrology B 307, Matematiktorvet, DK-800 Kgs. Lyngby
Final Report August 2010
 Bilateral Comparison of 100 pf Capacitance Standards (ongoing BIPM key comparison BIPM.EM-K14.b) between the CMI, Czech Republic and the BIPM, January-July 2009 J. Streit** and N. Fletcher* *Bureau International
Microphone and Sound Level Meter calibration in free field by a new method
 XVIII IMEKO WORLD CONGRESS Metrology for a Sustainable Development September, 17 22, 2006, Rio de Janeiro, Brazil Microphone and Sound Level Meter calibration in free field by a new method Zemar M. Defilippo
R & D AKUSTIKA * SIA. Test Report of laboratory Sound Insulation measurements Nr. 569 / 2011 AL 8.4. CUSTOMER: AEROC AS (Estonia)
") SIA * R & D AKUSTIKA * ============================================================================================= LATVIJAS REPUBLIKA, LV - 1067, R GA, KURZEMES PROSPEKTS 3, Re istr. Nr. : LV 010310045
SIA * R & D AKUSTIKA * ============================================================================================= LATVIJAS REPUBLIKA, LV - 1067, R GA, KURZEMES PROSPEKTS 3, Re istr. Nr. : LV 010310045
EURAMET Project 1056
 EURAMET Project 56 Inter-laboratory comparison on measurement of free-field response of a sound level meter. Final Report January 2 Claudio Guglielmone INRiM Divisione Termodinamica 2. Introduction EURAMET
Supplementary Comparison EURAMET.EM-S19 EURAMET Project No. 688
 Supplementary Comparison EURAMET.EMS19 EURAMET Project No. 688 Bilateral Comparison of Measurements of Current Transformers (CTs) Between and Final Report Hüseyin Çaycı (, Pilot Laboratory) January 211
FINAL REPORT OF THE BILATERAL COMPARISON OF THE CALIBRATIONS OF STANDARD WEIGHTS BETWEEN CENAM-MEXICO AND INEN-ECUADOR SIM.M.M-S4 (SIM.7.
 FINAL REPORT OF THE BILATERAL COMPARISON OF THE CALIBRATIONS OF STANDARD WEIGHTS BETWEEN CENAM-MEXICO AND INEN-ECUADOR (SIM.7.42) 1 Luis Omar Becerra, 2 René Chanchay 1 Centro Nacional de Metrología (CENAM),
Numerical modeling of the primary source in a hemi-anechoic room
 Numerical modeling of the primary source in a hemi-anechoic room R. Arina 1, K. Völkel 2 1 Politecnico di Torino, Torino, Italy 2 Physikalisch Technische Bundesanstalt, Braunschweig, Germany ABSTRACT An
MEASUREMENTS OF SOUND ABSORPTION TIMBERCRETE
 A.B.N. 73 107 291 494 C O N S U L T I N G A C O U S T I C A L E N G I N E E R S MEASUREMENTS OF SOUND ABSORPTION TIMBERCRETE 100 mm ANCIENT STONE BRICK REPORT NUMBER: 4546-2 PREPARED FOR: Timbercrete Pty
Part 2: Methods for special reverberation test rooms
 Provläsningsexemplar / Preview INTERNATIONAL STANDARD ISO 3743-2 Second edition 2018-02 Acoustics Determination of sound power levels of noise sources using sound pressure Engineering methods for small,
INTERNATIONAL COMPARISON OF PLATINUM RESISTANCE THERMOMETERS BETWEEN CHILE AND ECUADOR
 INTERNATIONAL COMPARISON OF PLATINUM RESISTANCE THERMOMETERS BETWEEN CHILE AND ECUADOR M. Araya 1, D. Almeida 2 1 National Laboratory of Temperature of Chile, LCPNT, Santiago, Chile 2 Ecuadorian Standardization
A comparison of primary platinum-iridium kilogram mass standards among eighteen European NMIs
 IMEKO 20 th TC3, 3 rd TC16 and 1 st TC22 International Conference Cultivating metrological knowledge 27 th to 30 th November, 2007. Merida, Mexico. A comparison of primary platinum-iridium kilogram mass
SIM FORCE STANDARDS COMPARISON UP TO 10 kn
 SIM FORCE STANDARDS COMPARISON UP TO 10 kn Jorge C. Torres-Guzmán, Daniel A. Ramírez-Ahedo Centro Nacional de Metrología, CENAM.. ABSTRACT A comparison in the quantity of force was carried out among the
Interamerican Metrology System (SIM) Regional Metrology Organization (RMO) Capacitance Comparison, Final Report
 Regional Metrology Organization (RMO) Capacitance Comparison, Final Report") Interamerican Metrology System (SIM) Regional Metrology Organization (RMO) Capacitance Comparison, Final Report SIM.EM-K4., 0 pf fused-silica standard capacitor at 000 Hz SIM.EM-S4., 00 pf fused-silica
Interamerican Metrology System (SIM) Regional Metrology Organization (RMO) Capacitance Comparison, Final Report SIM.EM-K4., 0 pf fused-silica standard capacitor at 000 Hz SIM.EM-S4., 00 pf fused-silica
Final Report EUROMET PROJECT 818 CALIBRATION FACTOR OF THERMISTOR MOUNTS. Jan P.M. de Vreede
 Final Report EUROMET PROJECT 818 CALIBRATION FACTOR OF THERMISTOR MOUNTS Jan P.M. de Vreede Department of Electricity, Radiation and Length NMi Van Swinden Laboratorium Thijsseweg 11, 2629 JA Delft, the
Comparison of V and 10 V DC Voltage References
 Comparison of 1.018 V and 10 V DC Voltage References Technical protocol for BIPM.EM-K11.a and.b comparisons 1. Introduction The Mutual Recognition Arrangement among National Metrology Institutes (NMIs)
RECENT ILC ACTIVITY IN ROMANIAN MASS MEASUREMENTS
 The Fifth International Proficiency Testing Conference Timisoara, Romania () th 8 th September, 0 RECENT ILC ACTIVITY IN ROMANIAN MASS MEASUREMENTS Adriana Vâlcu, Sterică Baicu National Institute of Metrology,
PRODUCT DATA. Sound Intensity Calibrator Type 3541-A. Uses and Features
 PRODUCT DATA Sound Intensity Calibrator Type 3541-A Type 3541-A enables calibration of sound intensity measuring instruments by using a coupler designed especially for sound intensity calibrations. Intensity-probe
Tel: Fax: PRODUCT INFORMATION
 PRODUCT INFORMATION Part Numbers CEM-OB6027E-354G-PAHC01-00-0 Revision 1-2016 Type Compliance Condenser Microphone RoHS, Lead Free ISO 9001:2000 REACH: SUBSTANCE OF VERY HIGH CONCERN (SVHC) This product
Page 1 of 10 pages Appendix, 5 pages Report no.: P Glostrup, October 12th 2012 Project: Claimant:
 TEST REPORT This Test Report may only be reproduced in full. The test results are valid for the tested object only. Fibertex Nonwovens A/S Laboratory measurements of sound absorption coefficient Page 1
< Final report > Report on the APMP.M.F-S1 supplementary comparison for 2 MN Force
 < Final report > Report on the APMP.M.F-S1 supplementary comparison for 2 MN Force Kazunaga Ueda*, Toshiyuki Hayashi*, Hiroshi Maejima*, Rolf Kumme**, Dirk Röske**, Mark Seidel** * National Metrology of
The information included in the following report presents the results of sound pressure and sound power testing.
 ISO 7779:2010 Acoustics -- Measurement of airborne noise emitted by information technology and telecommunications equipment 1 of 14 DEVICES - solid panel case - window panel case Report Date: 06/25/2015
Final Report on APMP.M.M-K4.1 - Bilateral Comparison of 1 kg Stainless Steel Mass Standards between KRISS and A*STAR
 Final Report on APMP.M.M-K4.1 - Bilateral Comparison of 1 kg Stainless Steel Mass Standards between KRISS and A*STAR Jin Wan Chung 1, Shih Mean Lee, Sungjun Lee 1 1 Korea Research Institute of Standards
Ajchara Charoensook, Chaiwat Jassadajin. National Institute of Metrology Thailand. Henry Chen, Brian Ricketts and Leigh Johnson
 1 Revised Report on APMP.EM-S6 APMP Bilateral Supplementary Comparison of Resistance between the National Institute of Metrology Thailand and the National Measurement Institute, Australia December 2003
JAB NOTE4. ESTIMATION OF MEASUREMENT UNCERTAINTY (Electrical Testing / High Power Testing) Japan Accreditation Board (JAB)
 Japan Accreditation Board (JAB)") JAB NOTE4 ESTIMATION OF MEASUREMENT UNCERTAINTY (Electrical Testing / High Power Testing) nd edition: January 5 01 1 st edition: March 5 00 Japan Accreditation Board (JAB) Initial edition: 00-0-5 1/ nd
JAB NOTE4 ESTIMATION OF MEASUREMENT UNCERTAINTY (Electrical Testing / High Power Testing) nd edition: January 5 01 1 st edition: March 5 00 Japan Accreditation Board (JAB) Initial edition: 00-0-5 1/ nd
PROTOCOL OF MASS AND VOLUME COMPARISONS BETWEEN SIM NMIs
 PROTOCOL OF MASS AND VOLUME COMPARISONS BETWEEN SIM NMIs 1. General Information This comparison is being carried out in order to compare the degree of equivalence in mass, conventional mass, volume and
Automated volume measurement for weihts using acoustic volumeter
 IMEKO 20th TC3, 3rd TC16 and 1st TC22 International Conference Cultivating metrological knowledge 27th to 30th November, 2007. Merida, Mexico. Automated volume measurement for weihts using acoustic volumeter
Final Report 06 July 2006 Frank Wilkinson, Gan Xu, and Yuanjie Liu
 Bilateral Comparison of between NMIA (Australia) and SPRING (Singapore) (KCDB reference No. CCPR-K1.a.1) Final Report 06 July 2006 Frank Wilkinson, Gan Xu, and Yuanjie Liu Contents 1. Introduction..2 2.
Measurement of Acoustic Properties of light weight concrete SL-Deck
 DELTA Test Report TEST Reg. no. 100 Measurement of Acoustic Properties of light weight concrete SL-Deck Performed for Abeo A/S Project no.: I100486 Page 1 of 25 30 June 2014 DELTA Venlighedsvej 4 2970
An international key comparison of free-field hydrophone calibrations in the frequency range 1 to 500 khz
 An international key comparison of free-field hydrophone calibrations in the frequency range 1 to 500 khz Stephen P. Robinson, Peter M. Harris, Justin Ablitt, Gary Hayman, and Alex Thompson National Physical
Consultancy Report Ref: 9383-R01
 Consultancy Report Ref: 9383-R01 Submitted to: Prepared by: Mr Tim Simmons The Woolley Shepherd Secret Meadow Weekmoor Milverton Taunton TA4 1QE John Fithyan Laboratory Manager Approved for issue by: Andy
POWER QUALITY MEASUREMENT PROCEDURE. Version 4 October Power-Quality-Oct-2009-Version-4.doc Page 1 / 12
 POWER QUALITY MEASUREMENT PROCEDURE Version 4 October 2009 Power-Quality-Oct-2009-Version-4.doc Page 1 / 12 MEASNET 2009 Copyright all rights reserved This publication may not be reproduced or utilized
Final Report on CIPM key comparison of multiples and submultiples of the kilogram (CCM.M-K2)
") 1 Final Report on CIPM key comparison of multiples and submultiples of the kilogram (CCM.M-K) 1. Introduction L.O. Becerra 1, W. Bich, N. Bignell 3, G.D. Chapman 4, J.W. Chung 5 S. Davidson 6, M. Gläser
1 Final Report on CIPM key comparison of multiples and submultiples of the kilogram (CCM.M-K) 1. Introduction L.O. Becerra 1, W. Bich, N. Bignell 3, G.D. Chapman 4, J.W. Chung 5 S. Davidson 6, M. Gläser
Output intensity measurement on a diagnostic ultrasound machine using a calibrated thermoacoustic sensor
 Institute of Physics Publishing Journal of Physics: Conference Series 1 (2004) 140 145 doi:10.1088/1742-6596/1/1/032 Advanced Metrology for Ultrasound in Medicine Output intensity measurement on a diagnostic
Force Key Comparison CCM.F-K1.a and CCM.F-K1.b 5 kn and 10 kn. Aimo Pusa MIKES Finland
 Force Key Comparison CCM.F-K1.a and CCM.F-K1.b 5 kn and 10 kn Aimo Pusa 09.02.2009 MIKES Finland 2 Content Page Content 3 Foreword 4 Chapter 1 1.1 General 6 1.2 Characteristics of the transducers 8 1.3
INVESTIGATION OF IMPACT HAMMER CALIBRATIONS
 IMEKO 23 rd TC3, 13 th TC5 and 4 th TC22 International Conference 30 May to 1 June, 2017, Helsinki, Finland INVESTIGATION OF IMPACT HAMMER CALIBRATIONS M. Kobusch 1, L. Klaus 1, and L. Muñiz Mendoza 2
SIM Regional Comparison on. The Calibration of Internal and External Diameter Standards SIM.L-K FINAL REPORT July 2012
 SIM Regional Comparison on The Calibration of Internal and External Diameter Standards SIM.L-K4.2009 FINAL REPORT July 2012 Theodore Doiron (NIST), J. A. Pires Alves (INMETRO), Bruno R. Gastaldi (INTI),
Report on EURAMET.M.M-S9
 FINAL REPORT Report on EURAMET.M.M-S9 Supplementary comparison of 500 microgram, 200 microgram, 100 microgram and 50 microgram weights (EURAMET project number 1310) Stuart DAVIDSON 1, Adriana VALCU 2,
Primary Method for the Complex Calibration of a Hydrophone from 1 Hz to 2 khz
 CCAUV/17-14 11 th Meeting of the Consultative Committee for Acoustics, Ultrasound and Vibration (CCAUV) Primary Method for the Complex Calibration of a Hydrophone from 1 Hz to 2 khz Mr. William Slater,
Vocabulary of Metrology
 Vocabulary of Metrology For Understating Uncertainty and Traceability Prepared by: Kim, Sang Ho Engineering Team Leader Modal Shop, Inc A PCB Group Company SI National Metrology Institute Secondary Calibration
ISO INTERNATIONAL STANDARD
 INTERNATIONAL STANDARD ISO 140-6 Second edition 1998-08-15 Acoustics Measurement of sound insulation in buildings and of building elements Part 6: Laboratory measurements of impact sound insulation of
ANNEXE 8. Technical protocols for the interlaboratory comparisons
 ANNEXE 8 Technical protocols for the interlaboratory comparisons TECHNICAL PROTOCOL FOR BILATERAL COMPARISON (Magnitude of the complex charge sensitivity of accelerometers) EURAMET.AUV.V-S1 1. INTRODUCTION
INTERLABORATORY MASS COMPARISON BETWEEN LABORATORIES BELONGING TO SIM SUB-REGIONS COORDINATED BY CENAM (SIM.7.31a & SIM.7.31b)
") INTERLABORATORY MASS COMPARISON BETWEEN LABORATORIES BELONGING TO SIM SB-REGIONS COORDINATED BY CENAM (SIM.7.31a & SIM.7.31b) Jorge Nava 1, Luis O. Becerra 1, Tweedsmuir Mitchell, Mairy Sanz, Olman Ramos
INTERLABORATORY MASS COMPARISON BETWEEN LABORATORIES BELONGING TO SIM SB-REGIONS COORDINATED BY CENAM (SIM.7.31a & SIM.7.31b) Jorge Nava 1, Luis O. Becerra 1, Tweedsmuir Mitchell, Mairy Sanz, Olman Ramos
THE ACOUSTIC IMPEDANCE MEASUREMNET SYSTEM USING TWO MICROPHONES
 P-7 THE ACOUSTIC IMPEDANCE MEASUREMNET SYSTEM USING TWO MICROPHONES RYU, YUNSEON BRUEL & KJAER SOUND & VIBRATION MEASUREMENT A/S SKODSBORGVEJ 307 NAERUM 2850 DENMARK TEL : +45 77 41 23 87 FAX : +45 77
A L I O N Technical Center. Test Report
 FOR: Beachwood, OH Sound Absorption CONDUCTED: 2017-10-30 Page 1 of 7 ON: Absorption Sheets TEST METHOD Riverbank Acoustical Laboratories is accredited by the U.S. Department of Commerce, National Institute
ASIA PACIFIC METROLOGY PROGRAME
 APMP.M.M-K6 (SUB) multiples mass key comparison ASIA PACIFIC METROLOGY PROGRAME Final Report of APMP Comparison of Mass standards APMP.M.M-K6 (SUB) multiples mass key comparison Coordinated by: Vietnam
TRACEABILITY STRATEGIES FOR THE CALIBRATION OF GEAR AND SPLINE ARTEFACTS
 TRACEABILITY STRATEGIES FOR THE CALIBRATION OF GEAR AND SPLINE ARTEFACTS W. Beyer and W. Pahl Physikalisch-Technische Bundesanstalt (PTB) 38116 Braunschweig, Germany Abstract: In accordance with ISO 17025,
Standard Practices for Air Speed Calibration Testing
 Standard Practices for Air Speed Calibration Testing Rachael V. Coquilla Bryza Wind Lab, Fairfield, California Air speed calibration is a test process where the output from a wind measuring instrument
Method of Measuring Machinery Sound Within an Equipment Space
 ANSI/AHRI Standard 575 (Formerly ARI Standard 575) 2008 Standard for Method of Measuring Machinery Sound Within an Equipment Space Price $15.00 (M) $30.00 (NM) Printed in U.S.A. 8Copyright 1994, by Air-Conditioning
APMP supplementary comparison of absorbed dose rate in tissue for beta radiation
 APMP supplementary comparison of absorbed dose rate in tissue for beta radiation BIPM KCDB: APMP.R(I)-S2 Technical Protocol N. Saito and M. Kato National Metrology Institute of Japan (NMIJ), Tsukuba, Ibaraki
Bureau International des Poids et Mesures, Sèvres, France. *KEBS, Kenya Bureau of Standards P.O. Box , Nairobi, Kenya
 Bilateral Comparison of 1.018 V and 10 V Standards between the KEBS (Kenya) and the BIPM January to March 2018 (part of the ongoing BIPM key comparison BIPM.EM-K11.a and b) by S. Solve +, R. Chayramy +,
METHODS TO CONFIRM THE MEASUREMENT CAPABILITY OF THE FORCE STANDARD MACHINES AFTER REINSTALLATION
 IMEKO 22 nd TC3, 12 th TC5 and 3 rd TC22 International Conferences 3 to 5 February, 2014, Cape Town, Republic of South Africa METHODS TO CONFIRM THE MEASUREMENT CAPABILITY OF THE FORCE STANDARD MACHINES
ETS-LINDGREN ACOUSTIC RESEARCH LABORATORY OFFICIAL LABORATORY REPORT ARL-SA6986/ARL-SA6987 Revision 0 ARL
 ETS-LINDGREN ACOUSTIC RESEARCH LABORATORY OFFICIAL LABORATORY REPORT -SA6986/-SA6987 Revision 0 Subject: Sound Absorption Test Date: 01 February 2017 Contents: on Sound Absorption Data, One-third Octave
R SANAS Page 1 of 7
 ESTIMATION OF THE UNCERTAINTY OF MEASUREMENT BY CALIBRATION LABORATORIES AND SPECIFICATION OF CALIBRATION AND MEASUREMENT CAPABILITY ON SCHEDULES OF ACCREDITATION Approved By: Chief Executive Officer:
ISO 354 INTERNATIONAL STANDARD. Acoustics Measurement of sound absorption in a reverberation room
 INTERNATIONAL STANDARD ISO 354 Second edition 2003-05-15 Acoustics Measurement of sound absorption in a reverberation room Acoustique Mesurage de l'absorption acoustique en salle réverbérante Reference
Measurement of airflow resistance by the alternating flow method
 Measurement of airflow resistance by the alternating flow method Wittstock, Volker Physikalisch-Technische Bundesanstalt, Germany. Schmelzer, Martin Physikalisch-Technische Bundesanstalt, Germany. Summary
ISO 5136 INTERNATIONAL STANDARD. Acoustics Determination of sound power radiated into a duct by fans and other air-moving devices In-duct method
 INTERNATIONAL STANDARD ISO 5136 Second edition 2003-04-01 Acoustics Determination of sound power radiated into a duct by fans and other air-moving devices In-duct method Acoustique Détermination de la
Study for the requalification of Inmetro's Primary Hardness Standardization Machine for Vickers HV3 scale
 Journal of Physics: Conference Series PAPER OPEN ACCESS Study for the requalification of Inmetro's Primary Hardness Standardization Machine for Vickers HV3 scale To cite this article: J T Filho et al 2015
Revision of the Guide to the expression of uncertainty in measurement impact on national metrology institutes and industry
 Revision of the Guide to the expression of uncertainty in measurement impact on national metrology institutes and industry Maurice Cox/Peter Harris National Physical Laboratory, Teddington, UK CCRI BIPM,
OA03 UNCERTAINTY OF MEASUREMENT IN CHEMICAL TESTING IN ACCORDANCE WITH THE STANDARD SIST EN ISO/IEC Table of contents
 UNCERTAINTY OF MEASUREMENT IN CHEMICAL TESTING IN ACCORDANCE WITH THE STANDARD SIST EN ISO/IEC 17025 Table of contents 1 GENERAL... 2 2 THE STANDARD SIST EN ISO/IEC 17025... 2 3 SA'S POLICY IN IMPLEMENTING
Development of a small-scale reverberation room
 Proceedings of ACOUSTICS 2016 9-11 November 2016, Brisbane, Australia Development of a small-scale reverberation room Alexander Rasa Noise Control Research & Development, Pyrotek Pty Ltd, Sydney, Australia
Final Report. CCEM Comparison of 10 pf Capacitance Standards. Anne-Marie Jeffery Electricity Division NIST May 2000 Revised March 2002
 Final Report CCEM Comparison of 10 pf Capacitance Standards Anne-Marie Jeffery Electricity Division NIST May 2000 Revised March 2002 Abstract Comparison of electrical standards must be carried out periodically
Measurement and Calibration of a High-Sensitivity Microwave Power Sensor with an Attenuator
 RADIOENGINEERING, VOL. 3, NO. 4, DECEMBER 014 1055 Measurement and Calibration of a High-Sensitivity Microwave Power Sensor with an Attenuator Yu Song MENG, Yueyan SHAN National Metrology Centre, Agency
SIM SIM.M.D-K3. provide. SIM.M.M-K5 for. A set of. Institute LACOMET LATU INTI. Country Costa Rica Uruguay Argentina Chile México Canada Brazil
 FINAL REPORT SIM COMPARISON IN VOLUME OF WEIGHTS SIM.M.D-K3 Kornblit, F 1 ; Leiblich, J. 1 ; Becerra, L.O. ; Peña, L.M. ; Luján, L. ; Díaz,J.C. ; Centeno, L.M. ; Ramos, O 3 ; Rodríguez, S. 3 ; Santo, C.
The Determination of Uncertainties in Bend Tests on Metallic Materials
 Manual of Codes of Practice for the Determination of Uncertainties in Mechanical Tests on Metallic Materials Code of Practice No. 09 The Determination of Uncertainties in end Tests on Metallic Materials
Review of Anemometer Calibration Standards
 Review of Anemometer Calibration Standards Rachael V. Coquilla rvcoquilla@otechwind.com Otech Engineering, Inc., Davis, CA Anemometer calibration defines a relationship between the measured signals from
Appendix B1. Reports of SMU
 Appendix B1 Reports of SMU Euromet Project 600 Comparison of Surface Roughness Standards /13 EUROMET SUPPLEMENTARY COMPARISON SURFACE TEXTURE Project No. 600 Final Report Elaborated by: M. Szmicskova Bratislava,
In-situ measurements of the complex acoustic impedance of materials in vehicle interiors
 19 th INTERNATIONAL CONGRESS ON ACOUSTICS MADRID, 2-7 SEPTEMBER 2007 In-situ measurements of the complex acoustic impedance of materials in vehicle interiors Leonardo Miranda Group Research/Vehicle Concepts,
BUREAU INTERNATIONAL DES POIDS ET MESURES
 BUREAU INTERNATIONAL DES POIDS ET MESURES Bilateral comparison of 1 Ω and 10 kω standards (ongoing BIPM key comparisons BIPM.EM-K13.a and 13.b) between the SMD (Belgium) and the BIPM October 2017 Final
TYPICAL PRESSURE MEASUREMENT UNCERTAINTY DEFINED BY AN FPG8601 FORCE BALANCED PISTON GAUGE
 TYPICAL PRESSURE MEASUREMENT UNCERTAINTY DEFINED BY AN FPG8601 FORCE BALANCED PISTON GAUGE Michael Bair and Pierre Delajoud 2002 DEC 10 Revised 2004 MAR 26 FORWARD FPG8601 is a pressure standard designed
ETS-LINDGREN ACOUSTIC RESEARCH LABORATORY OFFICIAL LABORATORY REPORT ARL-SA6712/ARL-SA6713 Revision 0 ARL
 ETS-LINDGREN ACOUSTIC RESEARCH LABORATORY OFFICIAL LABORATORY REPORT -SA6712/-SA6713 Revision 0 Subject: Sound Absorption Test Date: 17 May 2016 Contents: on Sound Absorption Data, One-third Octave bands
Acoustic response in non-diffuse rooms
 Acoustic response in non-diffuse rooms Jack Harvie-Clark Apex Acoustics, Gateshead, United Kingdom. Nicholas Dobinson Apex Acoustics, Gateshead, United Kingdom. Richard Hinton Apex Acoustics, Gateshead,
EA Guidelines on the Calibration of Temperature Indicators and Simulators by Electrical Simulation and Measurement
 Publication Reference EA-10/11 EA Guidelines on the Calibration of Temperature Indicators and Simulators by Electrical PURPOSE This document has been produced by EA as a means of giving advice for calibrating
ISO 3741 INTERNATIONAL STANDARD
 INTERNATIONAL STANDARD ISO 3741 Fourth edition 2010-10-01 Acoustics Determination of sound power levels and sound energy levels of noise sources using sound pressure Precision methods for reverberation
Using an ambisonic microphone for measurement of the diffuse state in a reverberant room
 Proceedings of 20 th International Congress on Acoustics, ICA 2010 23-27 August 2010, Sydney, Australia Using an ambisonic microphone for measurement of the diffuse state in a reverberant room John Bassett
Document No: TR 12 Issue No: 1
 ESTIMATION OF THE UNCERTAINTY OF MEASUREMENT BY CALIBRATION LABORATORIES AND SPECIFICATION OF CALIBRATION AND MEASUREMENT CAPABILITY ON SCHEDULES OF ACCREDITATION Prepared by: SADCAS Technical Manage Approved
Technical Report. Project. The Laboratory Determination of The Random Incidence sound Absorption Coefficient of VertiQ Panels.
 Technical Report Ref Number C/21387/R01a Date 06 April 2011 Project The Laboratory Determination of The Random Incidence sound Absorption Coefficient of VertiQ Panels Prepared for Rockfon Rockwool A/S
UNCERTAINTY ANALYSIS FOR LABORATORY ACCREDITATION. Peter B. Crisp. Fluke Precision Measurement Ltd, 52 Hurricane Way, Norwich, UK
 UNCERTAINTY ANALYSIS FOR LABORATORY ACCREDITATION Peter B. Crisp Fluke Precision Measurement Ltd, 5 Hurricane Way, Norwich, UK Introduction NAMAS Accredited laboratories are required to follow recommended
Measuring HRTFs of Brüel & Kjær Type 4128-C, G.R.A.S. KEMAR Type 45BM, and Head Acoustics HMS II.3 Head and Torso Simulators
 Downloaded from orbit.dtu.dk on: Jan 11, 219 Measuring HRTFs of Brüel & Kjær Type 4128-C, G.R.A.S. KEMAR Type 4BM, and Head Acoustics HMS II.3 Head and Torso Simulators Snaidero, Thomas; Jacobsen, Finn;
ISO INTERNATIONAL STANDARD. Acoustics Acoustic insulation for pipes, valves and flanges
 INTERNATIONAL STANDARD ISO 15665 First edition 2003-08-15 Acoustics Acoustic insulation for pipes, valves and flanges Acoustique Isolation acoustique des tuyaux, clapets et brides Reference number ISO
ETS-LINDGREN ACOUSTIC RESEARCH LABORATORY OFFICIAL LABORATORY REPORT ARL-SA6266/ARL-SA6274 Revision 0 ARL
 ETS-LINDGREN ACOUSTIC RESEARCH LABORATORY OFFICIAL LABORATORY REPORT -SA6266/-SA6274 Revision 0 Subject: Sound Absorption Test Date: 17 February 2015 Contents: on Sound Absorption Data, One-third Octave