Georgia Standards of Excellence Frameworks Mathematics
|
|
|
- Camron Neal
- 5 years ago
- Views:
Transcription


1 Georgia Standards of Excellence Frameworks Mathematics GSE Analytic Geometry Unit 5: Quadratic Functions
2 Unit 5 Quadratic Functions Table of Contents OVERVIEW... 3 STANDARDS ADDRESSED IN THIS UNIT... 4 ENDURING UNDERSTANDINGS... 7 ESSENTIAL QUESTIONS... 7 CONCEPTS/SKILLS TO MAINTAIN... 8 SELECTED TERMS AND SYMBOLS... 8 EVIDENCE OF LEARNING... 9 FORMATIVE ASSESSMENT LESSONS (FAL) SPOTLIGHT TASKS TASKS What s the Pattern? (Spotlight Task) Formative Assessment Lesson: Generalizing Patterns: Table Tiles... 0 Sorting Functions (Short Cycle Task)... Graphing Transformations... 4 Paula s Peaches HENLEY S CHOCOLATES... 6 Completing the Square & Deriving the Quadratic Formula (Spotlight Task) Standard to Vertex Form (Spotlight Task) PROTEIN BAR TOSS PROTEIN BAR TOSS, (Part ) Just The Right Border Formative Assessment Lesson: Forming Quadratics Characteristics of Quadratic Functions Seeing Structure in Expressions (Short Cycle Task) Functions (Short Cycle Task) Formative Assessment Lesson: Sorting Equations & Identities PAULA S PEACHES: THE SEQUEL CULMINATING TASK: ACME FIREWORKS CULMINATING TASK: Quadratic Fanatic and the Case of the Foolish Function *Revised standards indicated in red bold font. Mathematics : Quadratic Functions July 015 Page of 19
3 OVERVIEW In this unit students will: focuses on quadratic functions, equations, and applications explore variable rate of change learn to factor general quadratic expressions completely over the integers and to solve general quadratic equations by factoring by working with quadratic functions that model the behavior of objects that are thrown in the air and allowed to fall subject to the force of gravity learn to find the vertex of the graph of any polynomial function and to convert the formula for a quadratic function from standard to vertex form explore quadratic inequalities graphically apply the vertex form of a quadratic function to find real solutions of quadratic equations that cannot be solved by factoring use exact solutions of quadratic equations to give exact values for the endpoints of the intervals in the solutions of quadratic inequalities introduce the concept of discriminant of a quadratic equation learn the quadratic formula explain why the graph of every quadratic function is a translation of the graph of the basic function f (x) = x justify the quadratic formula Although the units in this instructional framework emphasize key standards and big ideas at specific times of the year, routine topics such as estimation, mental computation, and basic computation facts should be addressed on an ongoing basis. Ideas related to the eight practice standards should be addressed constantly as well. This unit provides much needed content information and excellent learning activities. However, the intent of the framework is not to provide a comprehensive resource for the implementation of all standards in the unit. A variety of resources should be utilized to supplement this unit. The tasks in this unit framework illustrate the types of learning activities that should be utilized from a variety of sources. To assure that this unit is taught with the appropriate emphasis, depth, and rigor, it is important that the Strategies for Teaching and Learning in the Comprehensive Course Overview and the tasks listed under Evidence of Learning be reviewed early in the planning process. Mathematics : Quadratic Functions July 015 Page 3 of 19
4 STANDARDS ADDRESSED IN THIS UNIT KEY STANDARDS Interpret the structure of expressions MGSE9-1.A.SSE.1 Interpret expressions that represent a quantity in terms of its context. MGSE9-1.A.SSE.1a Interpret parts of an expression, such as terms, factors, and coefficients, in context. MGSE9-1.A.SSE.1b Given situations which utilize formulas or expressions with multiple terms and/or factors, interpret the meaning (in context) of individual terms or factors. MGSE9-1.A.SSE. Use the structure of an expression to rewrite it in different equivalent forms. For example, see x 4 y 4 as (x ) - (y ), thus recognizing it as a difference of squares that can be factored as (x y ) (x + y ). Write expressions in equivalent forms to solve problems MGSE9-1.A.SSE.3 Choose and produce an equivalent form of an expression to reveal and explain properties of the quantity represented by the expression. MGSE9-1.A.SSE.3a Factor any quadratic expression to reveal the zeros of the function defined by the expression. MGSE9-1.A.SSE.3b Complete the square in a quadratic expression to reveal the maximum and minimum value of the function defined by the expression. Create equations that describe numbers or relationships MGSE9-1.A.CED.1 Create equations and inequalities in one variable and use them to solve problems. Include equations arising from linear, quadratic, simple rational, and exponential functions (integer inputs only). MGSE9-1.A.CED. Create linear, quadratic, and exponential equations in two or more variables to represent relationships between quantities; graph equations on coordinate axes with labels and scales. (The phrase in two or more variables refers to formulas like the compound interest formula, in which A = P(1 + r/n) nt has multiple variables.) Mathematics : Quadratic Functions July 015 Page 4 of 19
5 MGSE9-1.A.CED.4 Rearrange formulas to highlight a quantity of interest using the same reasoning as in solving equations. Examples: Rearrange Ohm s law V = IR to highlight resistance R; Rearrange area of a circle formula A = π r to highlight the radius r. Solve equations and inequalities in one variable MGSE9-1.A.REI.4 Solve quadratic equations in one variable. MGSE9-1.A.REI.4a Use the method of completing the square to transform any quadratic equation in x into an equation of the form (x p) = q that has the same solutions. Derive the quadratic formula from ax + bx + c = 0. MGSE9-1.A.REI.4b Solve quadratic equations by inspection (e.g., for x = 49), taking square roots, factoring, completing the square, and the quadratic formula, as appropriate to the initial form of the equation (limit to real number solutions). Interpret functions that arise in applications in terms of the context MGSE9-1.F.IF.4 Using tables, graphs, and verbal descriptions, interpret the key characteristics of a function which models the relationship between two quantities. Sketch a graph showing key features including: intercepts; interval where the function is increasing, decreasing, positive, or negative; relative maximums and minimums; symmetries; end behavior; and periodicity. MGSE9-1.F.IF.5 Relate the domain of a function to its graph and, where applicable, to the quantitative relationship it describes. For example, if the function h(n) gives the number of personhours it takes to assemble n engines in a factory, then the positive integers would be an appropriate domain for the function. MGSE9-1.F.IF.6 Calculate and interpret the average rate of change of a function (presented symbolically or as a table) over a specified interval. Estimate the rate of change from a graph. Analyze functions using different representations MGSE9-1.F.IF.7 Graph functions expressed algebraically and show key features of the graph both by hand and by using technology. MGSE9-1.F.IF.7a Graph linear and quadratic functions and show intercepts, maxima, and minima (as determined by the function or by context). MGSE9-1.F.IF.8 Write a function defined by an expression in different but equivalent forms to reveal and explain different properties of the function. MGSE9-1.F.IF.8a Use the process of factoring and completing the square in a quadratic function to show zeros, extreme values, and symmetry of the graph, and interpret these in Mathematics : Quadratic Functions July 015 Page 5 of 19
6 terms of a context. For example, compare and contrast quadratic functions in standard, vertex, and intercept forms. MGSE9-1.F.IF.9 Compare properties of two functions each represented in a different way (algebraically, graphically, numerically in tables, or by verbal descriptions). For example, given a graph of one function and an algebraic expression for another, say which has the larger maximum. Build a function that models a relationship between two quantities MGSE9-1.F.BF.1 Write a function that describes a relationship between two quantities. MGSE9-1.F.BF.1a Determine an explicit expression and the recursive process (steps for calculation) from context. For example, if Jimmy starts out with $15 and earns $ a day, the explicit expression x+15 can be described recursively (either in writing or verbally) as to find out how much money Jimmy will have tomorrow, you add $ to his total today. J = J +, J = 15 n n 1 0 Build new functions from existing functions MGSE9-1.F.BF.3 Identify the effect on the graph of replacing f(x) by f(x) + k, k f(x), f(kx), and f(x + k) for specific values of k (both positive and negative); find the value of k given the graphs. Experiment with cases and illustrate an explanation of the effects on the graph using technology. Include recognizing even and odd functions from their graphs and algebraic expressions for them. Construct and compare linear, quadratic, and exponential models and solve problems MGSE9-1.F.LE.3 Observe using graphs and tables that a quantity increasing exponentially eventually exceeds a quantity increasing linearly, quadratically, or (more generally) as a polynomial function. MGSE9-1.S.ID.6 Represent data on two quantitative variables on a scatter plot, and describe how the variables are related. MGSE9-1.S.ID.6a Decide which type of function is most appropriate by observing graphed data, charted data, or by analysis of context to generate a viable (rough) function of best fit. Use this function to solve problems in context. Emphasize linear, quadratic and exponential models. Mathematics : Quadratic Functions July 015 Page 6 of 19
7 STANDARDS FOR MATHEMATICAL PRACTICE Refer to the Comprehensive Course Overview for more detailed information about the Standards for Mathematical Practice. 1. Make sense of problems and persevere in solving them.. Reason abstractly and quantitatively. 3. Construct viable arguments and critique the reasoning of others. 4. Model with mathematics. 5. Use appropriate tools strategically. 6. Attend to precision. 7. Look for and make use of structure. 8. Look for and express regularity in repeated reasoning. SMP = Standards for Mathematical Practice ENDURING UNDERSTANDINGS The graph of any quadratic function is a vertical and/or horizontal shift of a vertical stretch or shrink of the basic quadratic function f (x) = x. The vertex of a quadratic function provides the maximum or minimum output value of the function and the input at which it occurs. Every quadratic equation can be solved using the Quadratic Formula. ESSENTIAL QUESTIONS 1. How is a relation determined to be quadratic?. Are all quadratic expressions factorable? 3. How do the factors of a quadratic functions yield the zeros for that function? 4. Where is the maximum or minimum value of a quadratic equation located? 5. How is the quadratic formula developed by completing the square? 6. How can the quadratic formula be used to find the zeros of a quadratic function? 7. What information can be gleaned from the table of values and the graph of a relation? 8. Under what circumstances can one take the square root of both sides of the equation? 9. What is the difference between a quadratic equation and a quadratic inequality? 10. What does the domain of a function tell about the quantitative relationship of the given data? 11. How many solutions exist for the system of equations consisting of a linear and a quadratic equation? 1. How is the rate of change for a quadratic function different from the rate of change for a linear function? 13. How can the graph of f(x) = x move left, right, up, down, stretch, or compress? 14. What are the relative advantages and disadvantages of solving a quadratic function by factoring, completing the square, quadratic formula, or taking the square root of both sides? Mathematics : Quadratic Functions July 015 Page 7 of 19
8 CONCEPTS/SKILLS TO MAINTAIN It is expected that students will have prior knowledge/experience related to the concepts and skills identified below. It may be necessary to pre-assess in order to determine if time needs to be spent on conceptual activities that help students develop a deeper understanding of these ideas. 1. Use Function Notation. Put data into tables 3. Graph data from tables 4. Solve one variable linear equations 5. Determine domain of a problem situation 6. Solve for any variable in a multi-variable equation 7. Recognize slope of a linear function as a rate of change 8. Graph linear functions 9. Graph inequalities SELECTED TERMS AND SYMBOLS The following terms and symbols are often misunderstood. These concepts are not an inclusive list and should not be taught in isolation. However, due to evidence of frequent difficulty and misunderstanding associated with these concepts, instructors should pay particular attention to them and how their students are able to explain and apply them. The definitions below are for teacher reference only and are not to be memorized by the students. Students should explore these concepts using models and real life examples. Students should understand the concepts involved and be able to recognize and/or demonstrate them with words, models, pictures, or numbers. The website below is interactive and includes a math glossary. Definitions and activities for these and other terms can be found on the Intermath website. Links to external sites are particularly useful. Formulas and Definitions: Complete factorization over the integers: Writing a polynomial as a product of polynomials so that none of the factors is the number 1, there is at most one factor of degree zero, each polynomial factor has degree less than or equal to the degree of the product polynomial, each polynomial factor has all integer coefficients, and none of the factor polynomial can written as such a product. Completing the Square: Completing the Square is the process of converting a quadratic equation into a perfect square trinomial by adding or subtracting terms on both sides. Difference of Two Squares: a squared (multiplied by itself) number subtracted from another squared number. It refers to the identity a b = ( a+ b)( a b) in elementary algebra. Horizontal shift: A rigid transformation of a graph in a horizontal direction, either left or right. Mathematics : Quadratic Functions July 015 Page 8 of 19
9 Perfect Square Trinomial: A trinomial that factors into two identical binomial factors. Quadratic Equation: An equation of degree, which has at most two solutions. Quadratic Function: A function of degree which has a graph that turns around once, resembling an umbrella-like curve that faces either right-side up or upside down. This graph is called a parabola. Root: The x-values where the function has a value of zero. Standard Form of a Quadratic Function: ax + bx + c Vertex: The maximum or minimum value of a parabola, either in terms of y if the parabola is opening up or down, or in terms of x if the parabola is opening left or right. Vertex form of a quadratic function: A formula for a quadratic equation of the form o f (x) = a (x h) + k, where a is a nonzero constant and the vertex of the graph is the point (h, k). Theorems: For b h = and a b k = f a, f (x) = a (x h) + k is the same function as f (x) = ax + bx + c. The graph of any quadratic function can be obtained from transformations of the graph of the basic function f (x) = x. Quadratic formula: The solution(s) of the quadratic equation of the form and c are real numbers with a 0, is b ± b 4ac x =. a ax + bx + c = 0, where a, b, The discriminant of a quadratic equation is positive, zero, or negative if and only if the equation has two real solutions, one real solution, or two complex conjugate number solutions respectively. EVIDENCE OF LEARNING By the conclusion of this unit, students should be able to demonstrate the following competencies: 1. Given raw data, graph and interpret a quadratic function.. Given raw data, graph and interpret a quadratic inequality. 3. Translate the graph of f(x) = x as directed. 4. Determine and use the most advantageous method of finding the zeros of a quadratic equation or inequality. 5. Determine the variable rate of change of a quadratic function. 6. Model data by finding intercepts, relative maxima and minima, and other important information. Mathematics : Quadratic Functions July 015 Page 9 of 19
10 FORMATIVE ASSESSMENT LESSONS (FAL) Formative Assessment Lessons are intended to support teachers in formative assessment. They reveal and develop students understanding of key mathematical ideas and applications. These lessons enable teachers and students to monitor in more detail their progress towards the targets of the standards. They assess students understanding of important concepts and problem solving performance, and help teachers and their students to work effectively together to move each student s mathematical reasoning forward. More information on Formative Assessment Lessons may be found in the Comprehensive Course Overview. SPOTLIGHT TASKS A Spotlight Task has been added to each GSE mathematics unit in the Georgia resources for middle and high school. The Spotlight Tasks serve as exemplars for the use of the Standards for Mathematical Practice, appropriate unit-level Georgia Standards of Excellence, and research-based pedagogical strategies for instruction and engagement. Each task includes teacher commentary and support for classroom implementation. Some of the Spotlight Tasks are revisions of existing Georgia tasks and some are newly created. Additionally, some of the Spotlight Tasks are 3-Act Tasks based on 3-Act Problems from Dan Meyer and Problem-Based Learning from Robert Kaplinsky. TASKS The following tasks represent the level of depth, rigor, and complexity expected of all Analytic Geometry students. These tasks, or tasks of similar depth and rigor, should be used to demonstrate evidence of learning. It is important that all elements of a task be addressed throughout the learning process so that students understand what is expected of them. While some tasks are identified as a performance task, they may also be used for teaching and learning (learning/scaffolding task). In addition to the tasks, teachers will need to use other resources to address the standards that do not fit easily into any of the tasks. Teachers should develop a discussion of even/odd and increasing and decreasing intervals, as well as finding the x-intercepts and the vertex while working each problem. As the tasks progress, students should have a good grasp of the concept of even/odd and increasing and decreasing intervals as well as the more familiar work of using x-intercepts and the vertex. In addition, teachers should expect students to discuss domain and range of every equation and graph that the students create. Mathematics : Quadratic Functions July 015 Page 10 of 19
11 Task Name What s the Pattern (Spotlight Task) Georgia Department of Education Task Type Grouping Strategy Learning Task Partner/Small Group Task Content Addressed Mathematics : Quadratic Functions July 015 Page 11 of 19 SMPs Addressed Rate of change of 1-4, 7, 8 quadratic functions Writing expressions for quadratic functions Build a function 7-8 Generalizing Patterns: Table Tiles (FAL) Formative Assessment Lesson Sorting Functions Short Cycle Task Match each graph with an equation, a table and a rule Graphing Transformations Paula s Peaches Henley s Chocolates Completing the Square and Deriving the Quadratic Formula (Spotlight Task) Standard to Vertex Form (Spotlight Task) Protein Bar Toss Discovery Task Partner/Small Group Task Learning Task Partner/Small Group Task Learning Task Partner/Small Group Task Guided Learning Task Partner/Whole Class Task Guided Learning Task Partner/Whole Class Task Learning Task Partner/Small Group Task Graphing parabolas to investigate transformations Factoring; Solutions to Quadratic Equations Shifts to left and right, Solve Quadratic Functions by taking square Completing the square Deriving the quadratic formula Completing the square Converting from standard to vertex form; Identifying characteristics of quadratic functions Quadratic Functions- Max/Min 3, 7 4, 5, 7 1,, 4 8 1,, 4, 5, 7, 8 7, 8 1,, 3, 7, 4 8 Protein Bar, Part Learning Task Max/Min, Translations Partner/Small Group Task of f(x)=x Just the Right Border Learning Task Complete the Square, 1,, 4, 5, 7, 8 Partner/Small Group Task Quadratic Formula Forming Quadratics Formative Assessment Comparing different 1-3 (FAL) Lesson forms of quadratic function Characteristics of Assessment Task Assesses critical 8 Quadratic Functions Individual/Partner/Small Group Task concepts of graphs of Quadratic Functions Seeing Structure in Short Cycle Task Solve expressions using, 6 Expressions a variety of methods Functions Short Cycle Task/Warm- Create equations that 3, 7 8
12 Sorting Equations and Identities (FAL) Paula s Peaches: The Sequel Culminating Task: Acme Fireworks Culminating Task: Quadratic Fanatic and the Case of the Foolish Function up/starter Formative Assessment Lesson Structured Learning Task Individual/Partner/Small Group Task Assessment Task Individual/Partner/Small Group Task Assessment Task Individual/Partner/Small Group Task describe numbers and relationships from ordered pairs Recognize differences between equations and identities One variable equations/inequalities, Quadratic Inequalities Assesses students ability to apply concepts learned to given data, especially in choosing methods of solving Quadratic equations. Assesses students ability to apply concepts learned to given data, especially in choosing methods of solving Quadratic equations. 3, 7 1,, 4, 5, 7, Mathematics : Quadratic Functions July 015 Page 1 of 19
13 What s the Pattern? (Spotlight Task) Georgia Department of Education Standards Addressed in this Task MGSE9-1.A.SSE.1 Interpret expressions that represent a quantity in terms of its context. MGSE9-1.A.SSE.1a Interpret parts of an expression, such as terms, factors, and coefficients, in context. MGSE9-1.A.SSE.1b Given situations which utilize formulas or expressions with multiple terms and/or factors, interpret the meaning (in context) of individual terms or factors. MGSE9-1.A.CED.1 Create equations and inequalities in one variable and use them to solve problems. Include equations arising from linear, quadratic, simple rational, and exponential functions (integer inputs only). MGSE9-1.F.IF.6 Calculate and interpret the average rate of change of a function (presented symbolically or as a table) over a specified interval. Estimate the rate of change from a graph. MGSE9-1.F.IF.8 Write a function defined by an expression in different but equivalent forms to reveal and explain different properties of the function. MGSE9-1.F.IF.8a Use the process of factoring and completing the square in a quadratic function to show zeros, extreme values, and symmetry of the graph, and interpret these in terms of a context. For example, compare and contrast quadratic functions in standard, vertex, and intercept forms. MGSE9-1.F.BF.1 Write a function that describes a relationship between two quantities. MGSE9-1.F.BF.1a Determine an explicit expression and the recursive process (steps for calculation) from context. For example, if Jimmy starts out with $15 and earns $ a day, the explicit expression x+15 can be described recursively (either in writing or verbally) as to find out how much money Jimmy will have tomorrow, you add $ to his total today. J = J +, J = 15 n n 1 0 Standards for Mathematical Practice 1. Make sense of problems and persevere in solving them by requiring students to interpret and make meaning of a problem and find a logical starting point, and to monitor their progress and change their approach to solving the problem, if necessary.. Reason abstractly and quantitatively by requiring students to make sense of quantities and their relationships to one another in problem situations. Mathematics : Quadratic Functions July 015 Page 13 of 19

14 3. Construct viable arguments and critique the reasoning of others by engaging students on discussion of why they agree or disagree with responses, decide whether they make sense, and ask useful questions to clarify or improve the arguments. 6. Attend to precision by requiring students to calculate efficiently and accurately; and to communicate precisely with others by using clear mathematical language to discuss their reasoning. 7. Look for and make use of structure by expecting students to apply rules, look for patterns and analyze structure. 1. How many 1 x 1 squares are in each stage of this pattern? Stage Number of squares What might stage 5 of this pattern look like? How many 1 x 1 squares would be in stage 5? There will be 1 squares in stage 5 3. Write an expression that describes the number of 1 x 1 squares in stage n of the pattern. Justify your answer geometrically by referring to the pattern. See A, B, C, and D below. Mathematics : Quadratic Functions July 015 Page 14 of 19

15 Encourage students to write their expressions according to how they see the pattern, not to write any particular form of the expression. If students have trouble writing an expression symbolically, encourage them to verbally express how they found the number of squares in each stage and how would expect to find the next number of squares. 4. How much does the number of squares change from stage 1 to stage of the pattern? 5. How much does the number of squares change from stage to stage 3 of the pattern? 4 6. How much does the number of squares change from stage 3 to stage 4 of the pattern? 6 7. What do your answers to 4-6 tell you about the rate of change of the number of squares with respect to the stage number? Because the amount of change in the number of squares does not change by the same amount per each stage, the rate of change is not constant, but instead it is a variable rate of change. 8. You have previously worked with linear and exponential functions. Can this pattern be expressed as a linear or exponential function? Why or why not? No. A linear function would have a constant rate of change, and an exponential function would have a constant ratio between successive values. This has a changing rate of change that is different from what we have seen before. Note: This is the time to introduce the term quadratic and let students know that you will be studying a new type of function, quadratic functions, in this unit. It is not necessary to go into more depth at this point, as students will engage in more in-depth study in the next few tasks. As most groups finish, you should expect expressions of the following forms: A. n(n 1) +1 B. n n +1 Mathematics : Quadratic Functions July 015 Page 15 of 19


16 C. n (n 1) D. n + (n 1)(n 1) You should wrap up this task with a discussion in which different groups of students share their solutions, particularly to question 3. Invite students to share why these expressions are equivalent, and check to see if students know how to expand or simplify to demonstrate algebraically that the expressions are equivalent. If students do not yet know how to multiply binomials, this is a good opportunity to move to area models and discuss this skill. It is essential that students be able to multiply binomials prior to engaging in the rest of the activities of this unit. If students need additional instruction, a good resource is the use of Algebra Tiles. Many sites are available online with additional resources for this. Additionally, be sure to discuss question 8 and the differences between linear and exponential functions, which they studied in Coordinate Algebra, and quadratic functions. This task is adapted from one discussed on page 55 in the following book: Boaler, J. & Humphreys, C. (005). Connecting mathematical ideas: Middle school video cases to support teaching and learning. Portsmouth, NH: Heinemann. Mathematics : Quadratic Functions July 015 Page 16 of 19
17 What s the Pattern? (Spotlight Task) Georgia Department of Education Standards Addressed in this Task MGSE9-1.A.SSE.1 Interpret expressions that represent a quantity in terms of its context. MGSE9-1.A.SSE.1a Interpret parts of an expression, such as terms, factors, and coefficients, in context. MGSE9-1.A.SSE.1b Given situations which utilize formulas or expressions with multiple terms and/or factors, interpret the meaning (in context) of individual terms or factors. MGSE9-1.A.CED.1 Create equations and inequalities in one variable and use them to solve problems. Include equations arising from linear, quadratic, simple rational, and exponential functions (integer inputs only). MGSE9-1.F.IF.6 Calculate and interpret the average rate of change of a function (presented symbolically or as a table) over a specified interval. Estimate the rate of change from a graph. MGSE9-1.F.IF.8 Write a function defined by an expression in different but equivalent forms to reveal and explain different properties of the function. MGSE9-1.F.IF.8a Use the process of factoring and completing the square in a quadratic function to show zeros, extreme values, and symmetry of the graph, and interpret these in terms of a context. For example, compare and contrast quadratic functions in standard, vertex, and intercept forms. MGSE9-1.F.BF.1 Write a function that describes a relationship between two quantities. MGSE9-1.F.BF.1a Determine an explicit expression and the recursive process (steps for calculation) from context. For example, if Jimmy starts out with $15 and earns $ a day, the explicit expression x+15 can be described recursively (either in writing or verbally) as to find out how much money Jimmy will have tomorrow, you add $ to his total today. J = J +, J = 15 n n 1 0 Standards for Mathematical Practice 1. Make sense of problems and persevere in solving them by requiring students to interpret and make meaning of a problem and find a logical starting point, and to monitor their progress and change their approach to solving the problem, if necessary.. Reason abstractly and quantitatively by requiring students to make sense of quantities and their relationships to one another in problem situations. Mathematics : Quadratic Functions July 015 Page 17 of 19
18 3. Construct viable arguments and critique the reasoning of others by engaging students on discussion of why they agree or disagree with responses, decide whether they make sense, and ask useful questions to clarify or improve the arguments. 6. Attend to precision by requiring students to calculate efficiently and accurately; and to communicate precisely with others by using clear mathematical language to discuss their reasoning. 7. Look for and make use of structure by expecting students to apply rules, look for patterns and analyze structure. 1. How many 1 x 1 squares are in each stage of this pattern?. What might stage 5 of this pattern look like? How many 1 x 1 squares would be in stage 5? 3. Write an expression that describes the number of 1 x 1 squares in stage n of the pattern. Justify your answer geometrically by referring to the pattern. 4. How much does the number of squares change from stage 1 to stage of the pattern? 5. How much does the number of squares change from stage to stage 3 of the pattern? 6. How much does the number of squares change from stage 3 to stage 4 of the pattern? Mathematics : Quadratic Functions July 015 Page 18 of 19
19 7. What do your answers to 4-6 tell you about the rate of change of the number of squares with respect to the stage number? 8. You have previously worked with linear and exponential functions. Can this pattern be expressed as a linear or exponential function? Why or why not? Mathematics : Quadratic Functions July 015 Page 19 of 19
20 Formative Assessment Lesson: Generalizing Patterns: Table Tiles Source: Formative Assessment Lesson Materials from Mathematics Assessment Project ESSENTIAL QUESTIONS: How do you choose an appropriate, systematic way to collect and organize data? How do you examine the data and looking for patterns; finding invariance and covariance in the numbers of different types of tile? How do you generalize using numerical, geometrical or algebraic structure? How do you describe and explain findings clearly and effectively? TASK COMMENTS: Tasks and lessons from the Mathematics Assessment Project are specifically designed to help teachers effectively formatively assess their students. The way the tasks and lessons are designed gives the teacher a clear understanding of what the students are able to do and not do. Within the lesson, teachers will find suggestions and question prompts that will help guide students towards understanding. For more information access the MAP website: The task, Generalizing Patterns: Table Tiles, is a Formative Assessment Lesson (FAL) that can be found at the website: The FAL document provides a clear lesson design, from the opening of the lesson to the closing of the lesson. The PDF version of the task can be found at the link below: STANDARDS ADDRESSED IN THIS TASK: Build a function that models a relationship between two quantities MGSE9-1.F.BF.1 Write a function that describes a relationship between two quantities. MGSE9-1.F.BF.1a Determine an explicit expression and the recursive process (steps for calculation) from context. For example, if Jimmy starts out with $15 and earns $ a day, the explicit expression x+15 can be described recursively (either in writing or verbally) as to find out how much money Jimmy will have tomorrow, you add $ to his total today. J = J +, J = 15 n n 1 0 Mathematics : Quadratic Functions July 015 Page 0 of 19
21 Standards for Mathematical Practice This lesson uses all of the practices with emphasis on: 7. Look for and make use of structure by expecting students to apply rules, look for patterns and analyze structure. 8. Look for and express regularity in repeated reasoning by expecting students to understand broader applications and look for structure and general methods in similar situations. Mathematics : Quadratic Functions July 015 Page 1 of 19
22 Sorting Functions (Short Cycle Task) Source: Balanced Assessment Materials from Mathematics Assessment Project ESSENTIAL QUESTIONS: How do you analyze functions using different representations? TASK COMMENTS: Tasks and lessons from the Mathematics Assessment Project are specifically designed to help teachers effectively formatively assess their students. The way the tasks and lessons are designed gives the teacher a clear understanding of what the students are able to do and not do. Within the lesson, teachers will find suggestions and question prompts that will help guide students towards understanding. For more information access the MAP website: The task, Sorting Functions, is a Mathematics Assessment Project Assessment Task that can be found at the website: The PDF version of the task can be found at the link below: The scoring rubric can be found at the following link: Note: This task offers an extension of the standards listed below by including equation A as xy = and equation B as y² = x. Students may use the table of values provided in the task to recognize these functions. STANDARDS ADDRESSED IN THIS TASK: Analyze functions using different representations MGSE9-1.F.IF.7 Graph functions expressed algebraically and show key features of the graph both by hand and by using technology. MGSE9-1.F.IF.7a Graph linear and quadratic functions and show intercepts, maxima, and minima (as determined by the function or by context). MGSE9-1.F.IF.8 Write a function defined by an expression in different but equivalent forms to reveal and explain different properties of the function. Mathematics : Quadratic Functions July 015 Page of 19
23 MGSE9-1.F.IF.9 Compare properties of two functions each represented in a different way (algebraically, graphically, numerically in tables, or by verbal descriptions). For example, given a graph of one function and an algebraic expression for another, say which has the larger maximum. Standards for Mathematical Practice This task uses all of the practices with emphasis on: 3. Construct viable arguments and critique the reasoning of others by engaging students on discussion of why they agree or disagree with responses, decide whether they make sense, and ask useful questions to clarify or improve the arguments. 7. Look for and make use of structure by expecting students to apply rules, look for patterns and analyze structure. Mathematics : Quadratic Functions July 015 Page 3 of 19
24 Graphing Transformations Adapted from Marilyn Munford, Fayette County School System Standards Addressed in this Task MGSE9-1.F.BF.3 Identify the effect on the graph of replacing f(x) by f(x) + k, k f(x), f(kx), and f(x + k) for specific values of k (both positive and negative); find the value of k given the graphs. Experiment with cases and illustrate an explanation of the effects on the graph using technology. Include recognizing even and odd functions from their graphs and algebraic expressions for them. Standards of Mathematical Practice 4. Model with mathematics by expecting students to apply the mathematics concepts they know in order to solve problems arising in everyday situations, and reflect on whether the results are sensible for the given scenario. 5. Use appropriate tools strategically by expecting students to consider available tools when solving a mathematical problem. These tools might include pencil and paper, concrete models, a ruler, a protractor, a compass, a calculator, software, etc. 7. Look for and make use of structure by expecting students to apply rules, look for patterns and analyze structure. Common Student Misconceptions 1. Students may believe that the graph of y=(x-4) 3 is the graph of y=x 3 shifted 4 units to the left (due to the subtraction symbol). Examples should be explored by hand and on a graphing calculator to overcome this misconception.. Students often confuse the shift of a function with the stretch of a function. 3. Students may also believe that even and odd functions refer to the exponent of the variable, rather than the sketch of the graph and the behavior of the function. 4. Additionally, students may believe that all functions have inverses and need to see counter examples, as well as examples in which a non-invertible function can be made into an invertible function by restricting the domain. For example, f(x)=x has an inverse (f -1 (x)= xprovided that the domain is restricted to x 0. Teacher Notes: This problem set is provided for students to explore the transformations of the graph of f(x)=x. Depending on their comfort level with technology, some students may struggle using the graphing Mathematics : Quadratic Functions July 015 Page 4 of 19
25 calculator. The teacher should plan on circulating throughout the room to help students use the correct functions on the graphing calculator. For this problem set, students will learn more about the graphs of parabolas if they struggle a bit. Teachers should make sure that students actually make the graphs, because many students will be able to immediately write the equations with the given information. Materials Needed: Graphing Calculators, or, if available, computers with Geometer's Sketchpad or Geogebra. Working on computers rather than graphing calculators will allow students to see more clearly, and some functions are more user-friendly on the computer. You will graph various functions and make conjectures based on the patterns you observe from the original function y=x Follow the directions below and answer the questions that follow. Fill in the t-chart and sketch the parent graph y = x below. x y = x Now, for each set of problems below, describe what happened to the parent graph (y 1 = x ) to get the new functions. Equation Changes to parent graph. y 1 = x Students should observe the graph shifting up y = x +3 y 3 = x Conjecture: The graph of y = x + a will cause the parent graph to shift up. Equation Changes to parent graph. y 1 = x Students should observe the graph shifting down y = x -3 y 3 = x -7. Conjecture: The graph of y = x - a will cause the parent graph to shift down. Mathematics : Quadratic Functions July 015 Page 5 of 19
 about why there is a positive sign in the parenthesis, but the graph is shifting left. y 3 = (x+7) 3.")
26 Equation Changes to parent graph. y 1 = x Students should observe the graph shifting left. There will be much discussion y = (x+3) about why there is a positive sign in the parenthesis, but the graph is shifting left. y 3 = (x+7) 3. Conjecture: The graph of y = (x + a) will cause the parent graph to shift left Equation y 1 = x y = (x-3) y 3 = (x-3) Changes to parent graph. Students should observe the graph shifting right. There will be much discussion about why there is a negative sign in the parenthesis, but the graph is shifting right. 4. Conjecture: The graph of y = (x - a) will cause the parent graph to shift right. Equation y 1 = x y = -x y 3 = -3x Changes to parent graph. Students will say flip or turn upside down. Make sure they use the appropriate word, reflection. For later courses, it is important to make sure they know this is a reflection about the x-axis. 5. Conjecture: Multiplying the parent graph by a negative causes the parent graph to reflect across the x-axis For the following graphs, please use the descriptions vertical stretch (skinny) or vertical shrink (fat). Equation Changes to parent graph. y 1 = x vertical stretch. y = 3x y 3 = 7x 6. Conjecture: Multiplying the parent graph by a number whose absolute value is greater than one causes the parent graph to vertical stretch. Equation Changes to parent graph. y 1 = x vertical shrink y = ½ x y 3 = ¼ x 7. Conjecture: Multiplying the parent graph by a number whose absolute value is between zero and one causes the parent graph to vertical shrink. Based on your conjectures above, sketch the graphs without using your graphing calculator. 8. y = (x+3) y = -x + 5 y y x x Now, go back and graph these on your graphing calculator and see if you were correct. Were you? Mathematics : Quadratic Functions July 015 Page 6 of 19
27 Based on your conjectures, write the equations for the following transformations to y=x. 10. Translated 6 units up 11. Translated units right y = x + 6 y = (x-) 1. Stretched vertically by a factor of Reflected over the x-axis, units left and down 5 units y = 3x y = -(x+) -5 More problems can be added as an extension. Mathematics : Quadratic Functions July 015 Page 7 of 19
28 Graphing Transformations Adapted from Marilyn Munford, Fayette County School System You will graph various functions and make conjectures based on the patterns you observe from the original function y=x Follow the directions below and answer the questions that follow. Fill in the t-chart and sketch the parent graph y = x below. x y = x Now, for each set of problems below, describe what happened to the graph (y 1 = x ) to get the new functions. Equation Changes to parent graph. y 1 = x y = x +3 y 3 = x Conjecture: The graph of y = x + a will cause the parent graph to. Equation Changes to parent graph. y 1 = x y = x -3 y 3 = x -7. Conjecture: The graph of y = x - a will cause the parent graph to. Equation Changes to parent graph. y 1 = x y = (x+3) y 3 = (x+7) 3. Conjecture: The graph of y = (x + a) will cause the parent graph to. Equation Changes to parent graph. y 1 = x y = (x-3) y 3 = (x-3) 4. Conjecture: The graph of y = (x - a) will cause the parent graph to. Mathematics : Quadratic Functions July 015 Page 8 of 19
 or vertical shrink (fat). Equation Changes to parent graph. y 1 = x y = 3x y 3 = 7x 6.")
29 Equation Changes to parent graph. y 1 = x y = -x y 3 = -3x 5. Conjecture: Multiplying the parent graph by a negative causes the parent graph to. For the following graphs, please use the descriptions vertical stretch (skinny) or vertical shrink (fat). Equation Changes to parent graph. y 1 = x y = 3x y 3 = 7x 6. Conjecture: Multiplying the parent graph by a number whose absolute value is greater than one causes the parent graph to. y 1 = x y = ½ x y 3 = ¼ x 7. Equation Changes to parent graph. Conjecture: Multiplying the parent graph by a number whose absolute value is between zero and one causes the parent graph to. Based on your conjectures above, sketch the graphs without using your graphing calculator. 8. y = (x+3) y = -x + 5 y y x x Now, go back and graph these on your graphing calculator and see if you were correct. Were you? Based on your conjectures, write the equations for the following transformations to y=x. 10. Translated 6 units up 11. Translated units right 1. Stretched vertically by a factor of Reflected over the x-axis, units left and down 5 units Mathematics : Quadratic Functions July 015 Page 9 of 19
30 Paula s Peaches Standards Addressed in this Task MGSE9-1.A.SSE.3 Choose and produce an equivalent form of an expression to reveal and explain properties of the quantity represented by the expression. MGSE9-1.A.SSE.3a Factor any quadratic expression to reveal the zeros of the function defined by the expression. MGSE9-1.A.CED. Create linear, quadratic, and exponential equations in two or more variables to represent relationships between quantities; graph equations on coordinate axes with labels and scales. (The phrase in two or more variables refers to formulas like the compound interest formula, in which A = P(1 + r/n) nt has multiple variables.) MGSE9-1.F.IF.4 Using tables, graphs, and verbal descriptions, interpret the key characteristics of a function which models the relationship between two quantities. Sketch a graph showing key features including: intercepts; interval where the function is increasing, decreasing, positive, or negative; relative maximums and minimums; symmetries; end behavior; and periodicity. MGSE9-1.F.IF.5 Relate the domain of a function to its graph and, where applicable, to the quantitative relationship it describes. For example, if the function h(n) gives the number of personhours it takes to assemble n engines in a factory, then the positive integers would be an appropriate domain for the function. MGSE9-1.F.IF.6 Calculate and interpret the average rate of change of a function (presented symbolically or as a table) over a specified interval. Estimate the rate of change from a graph. MGSE9-1.F.IF.7 Graph functions expressed algebraically and show key features of the graph both by hand and by using technology. MGSE9-1.F.IF.7a Graph linear and quadratic functions and show intercepts, maxima, and minima (as determined by the function or by context). MGSE9-1.F.IF.8 Write a function defined by an expression in different but equivalent forms to reveal and explain different properties of the function. MGSE9-1.F.IF.8a Use the process of factoring and completing the square in a quadratic function to show zeros, extreme values, and symmetry of the graph, and interpret these in terms of a context. For example, compare and contrast quadratic functions in standard, vertex, and intercept forms. Mathematics : Quadratic Functions July 015 Page 30 of 19
31 MGSE9-1.F.IF.9 Compare properties of two functions each represented in a different way (algebraically, graphically, numerically in tables, or by verbal descriptions). For example, given a graph of one function and an algebraic expression for another, say which has the larger maximum. Standards for Mathematical Practice 1. Make sense of problems and persevere in solving them by requiring students to interpret and make meaning of a problem and find a logical starting point, and to monitor their progress and change their approach to solving the problem, if necessary.. Reason abstractly and quantitatively by requiring students to make sense of quantities and their relationships to one another in problem situations. 4. Model with mathematics by expecting students to apply the mathematics concepts they know in order to solve problems arising in everyday situations, and reflect on whether the results are sensible for the given scenario. 5. Use appropriate tools strategically by expecting students to consider available tools when solving a mathematical problem. These tools might include pencil and paper, concrete models, a ruler, a protractor, a compass, a calculator, software, etc. 6. Attend to precision by requiring students to calculate efficiently and accurately; and to communicate precisely with others by using clear mathematical language to discuss their reasoning. 7. Look for and make use of structure by expecting students to apply rules, look for patterns and analyze structure. 8. Look for and express regularity in repeated reasoning by expecting students to understand broader applications and look for structure and general methods in similar situations. Common Student Misconceptions 1. Some students may believe that factoring and completing the square are isolated techniques within a unit of quadratic equations. Teachers should help students to see the value of these skills in the context of solving higher degree equations and examining different families of functions.. Students may think that the minimum (the vertex) of the graph of y=(x+5) is shifted to the right of the minimum (the vertex) of the graph y=x due to the addition sign. Students should explore expels both analytically and graphically to overcome this misconception. 3. Some students may believe that the minimum of the graph of a quadratic function always occur at the y-intercept. Mathematics : Quadratic Functions July 015 Page 31 of 19
32 4. Students may believe that equations of linear, quadratic and other functions are abstract and exist on in a math book, without seeing the usefulness of these functions as modeling real-world phenomena. 5. Additionally, they believe that the labels and scales on a graph are not important and can be assumed by a reader and that it is always necessary to use the entire graph of a function when solving a problem that uses that function as its model. 6. Students may interchange slope and y-intercept when creating equation. For example, a taxi cab cost $4 for a dropped flag and charges $ per mile. Students may fail to see that $ is a rate of change and is slope while the $4 is the starting cost and incorrectly write the equation as y=4x+ instead of y=x Given a graph of a line, students use the x-intercept for b instead of the y-intercept. 8. Given a graph, students incorrectly compute slope as run over rise rather than rise over run. For example, they will compute slope with the change in x over the change in y. 9. Students do not know when to include the or equal to bar when translating the graph of an inequality. 10. Students do not correctly identify whether a situation should be represented by a linear, quadratic, or exponential function. 11. Students often do not understand what the variables represent. For example, if the height h in feel of a piece of lava t seconds after it is ejected from a volcano is given by h(t) = -16t +64t+936 and the student is asked to find the time it takes for the piece of lava to hit the ground, the student will have difficulties understanding that h=0 at the ground and that they need to solve for t. 1. Students may believe that it is reasonable to input any x-value into a function, so they will need to examine multiple situations in which there are various limitations to the domains. 13. Students may also believe that the slope of a linear function is merely a number used to sketch the graph of the line. In reality, slopes have real-world meaning, and the idea of a rate of change is fundamental to understanding major concepts from geometry to calculus. 14. Students may believe that each family of functions (e.g., quadratic, square root, etc.) is independent of the others, so they may not recognize commonalities among all functions and their graphs. Mathematics : Quadratic Functions July 015 Page 3 of 19
33 15. Students may also believe that skills such as factoring a trinomial or completing the square are isolated within a unit on polynomials, and that they will come to understand the usefulness of these skills in the context of examining characteristics of functions. 16. Additionally, student may believe that the process of rewriting equations into various forms is simply an algebra symbol manipulation exercise, rather than serving a purpose of allowing different features of the function to be exhibited. Teacher Notes This task introduces students to solving a new type of equation, a quadratic equation of the form x + bx + c = 0. The method uses factorization of the quadratic; hence, the task introduces the x + bx + c = factoring formula ( x + m)( x + n) where b= m+ n and c= mn. The context involves peach production at orchards in central Georgia. Questions about peach production lead to solving quadratic equations, and the need to solve quadratic equations motivates the need to study factoring. While the context is realistic, unlike most of the contexts in other tasks, there is no claim that the numbers are realistic. The numbers where chosen to provide quadratic equations that (i) are equivalent to a quadratic in the form x + bx + c = 0, (ii) can be solved by factoring, and (iii) involve values of c for which finding factors m and n such that m+ n= b is not so difficult as to distract students from learning the process of solving these equations. In this unit, students will revisit and extend many topics from previous units. This task opens with a simple linear relationship. Understanding this relationship is necessary for writing the formula for the function that provides the continuing context of the task. However, this opening serves two other important purposes. First, since the task opens with a familiar subject, students should find it easy to get started on the task. Second, analyzing this linear relationship requires students to recall important topics from previous units that they will need to apply as they progress through the task. Paula is a peach grower in central Georgia and wants to expand her peach orchard. In her current orchard, there are 30 trees per acre and the average yield per tree is 600 peaches. Data from the local agricultural experiment station indicates that if Paula plants more than 30 trees per acre, once the trees are in production, the average yield of 600 peaches per tree will decrease by 1 peaches for each tree over 30. She needs to decide how many trees to plant in the new section of the orchard. Throughout this task assume that, for all peach growers in this area, the average yield is 600 peaches per tree when 30 trees per acre are planted and that this yield will decrease by 1 peaches per tree for each additional tree per acre. 1. Paula believes that algebra can help her determine the best plan for the new section of orchard and begins by developing a mathematical model of the relationship between the number of trees per acre and the average yield in peaches per tree. Mathematics : Quadratic Functions July 015 Page 33 of 19
34 a. Is this relationship linear or nonlinear? Explain your reasoning. linear The average rate of change of the function is constant; average yield decreases by 1 peaches per tree each time there is one additional tree per acre. b. If Paula plants 6 more trees per acre, what will be the average yield in peaches per tree? What is the average yield in peaches per tree if she plants 4 trees per acre? There is a decrease in average yield per tree of 1(6) = 7 peaches. average yield: = 58 peaches per tree 4 trees per acre is an increase of 1 trees per acre over the current 30 trees per acre, so the average yield decreases by 1(1) = 144 peaches per tree average yield: = 456 peaches per tree c. Let T be the function for which the input x is the number of trees planted on each acre and T(x) is the average yield in peaches per tree. Write a formula for T(x) in terms of x and express it in simplest form. Explain how you know that your formula is correct. Comments: Some students will realize that x 30 is the number of additional trees per acre, the number in excess of 30, see that 1(x 30) is the total decrease in peaches per tree, and write the formula for T(x) as 600 1(x 30) = 960 1x. Other students will likely take a more geometric approach. They may use one of the points (30, 600), (36, 58), or (4, 456) on the graph of the function T and the slope of 1 to obtain the formula for T(x) using the pointslope formula: y 600 = 1(x 30) y = 960 1x T(x) = 960 1x. Others may use the slope to count backward to a y-intercept. In the table below we decrease x by 5 and increase y by 1(5) = 60 until we get to x = 0. Other students may simply say that a decrease of 30 for x would result in an increase of 1(30) = 360 for y so y = = 960 when x = = 0. Of course, the given information applies only to 30 or more trees per acre. However, from the extensive work in previous tasks, students should know that formula will be the same as the formula for the whole line through the point (30, 600) with slope 1, so any tools they have for writing that equation can be applied here. x y Solution: x 30 = additional trees per acre; 1(x 30) = decrease in average yield T(x) = 600 1(x 30) = 600 1x = 960 1x Sample reason for why the expression is correct: T is a linear function; thus, the graph is a straight line. Since two points are sufficient to determine a line, if the formula agrees with two known points, it must be correct. The expression gives 600 peaches per tree when there are 30 trees per acre, 58 peaches per tree when there are 36 trees per acre, and 456 peaches per tree when there are 4 trees per acre. Mathematics : Quadratic Functions July 015 Page 34 of 19

.")
35 d. Draw a graph of the function T. Given that the information from the agricultural experiment station applies only to increasing the number of trees per acre, what is an appropriate domain for the function T? Comments: Students should realize that the graph of the function consists of points on the graph of the line y = 1x whose first coordinates are integers greater than or equal to 30. They should also realize that the output of the function cannot be negative and stop the graph at the x-intercept point, (80, 0). The first graph shown below uses the technique of showing the graph of T as a collection of discrete points on the graph of the function with same formula but domain all real numbers. The second (smaller) graph is typical of what students may draw. On a smaller scale, the space between the discrete points is not visible. Solution: Domain of T: The set of all positive integers from 30 through 80, 30, 31, 3, 33,, 79, 80. that is, { } Comments: Students should realize that the domain is restricted to integer values. As indicated above, if they use a small scale, the discrete nature of the domain may not show up on the graph. Thus, it is important that they answer the question about domain and show that they know the domain contains only positive integers.. Since her income from peaches depends on the total number of peaches she produces, Paula realized that she needed to take a next step and consider the total number of peaches that she can produce per acre. a. With the current 30 trees per acre, what is the yield in total peaches per acre? If Paula plants 36 trees per acre, what will be the yield in total peaches per acre? 4 trees per acre? Mathematics : Quadratic Functions July 015 Page 35 of 19
36 (600 peaches per tree) (30 trees per acre) = peaches per acre With 36 trees per acre, there will be 58 peaches per tree. (58 peaches per tree) (36 trees per acre) = peaches per acre With 4 trees per acre, there will be 456 peaches per tree. (456 peaches per tree) (4 trees per acre) = 1915 peaches per acre Comments: These questions are designed to help students shift their thinking to the issue of total yield of peaches per acre. Students see that for these values, while the number of peaches per tree goes down, the total yield increases. b. Find the average rate of change of peaches per acre with respect to number of trees per acre when the number of trees per acre increases from 30 to 36. Write a sentence to explain what this number means. Comments: The unit of measure for this rate of change is peaches per acre per trees per acre not an easy unit with which to work. Hence, the question asks for a sentence explanation of the number 168. This question and the next one are intentional review questions but also make sure that students are prepared to answer the question in part g. Solution: Change in peaches per acre: = 1008 Change in trees per acre: = 6 Average rate of change: 1008 = On the average, while increasing from 30 to 36 trees per acre, each additional tree per acre produces a total yield of 168 more peaches per acre. c. Find the average rate of change of peaches per acre with respect to the number of trees per acre when the number of trees per acre increases from 36 to 4. Write a sentence to explain the meaning of this number. Change in peaches per acre: = 144 Change in trees per acre: 4 36 = 6 Average rate of change: = On the average, while increasing from 36 to 4 trees per acre, each additional tree per acre produces a total yield of 4 more peaches per acre. Mathematics : Quadratic Functions July 015 Page 36 of 19
37 d. Is the relationship between number of trees per acre and yield in peaches per acre linear? Explain your reasoning. No, the relationship is not linear. We know the relationship is not linear because the average rate of change is not constant. Linear relationships have a constant average rate of change. e. Let Y be the function that expresses this relationship, that is, the function for which the input x is the number of trees planted on each acre and the output Y(x) is the total yield in peaches per acre. Write a formula for Y(x) in terms of x and express your answer in expanded form. Y(x) = x (960 1x) or Y(x) = 960x 1x The number of trees per acre must be multiplied by the number of peaches per tree to get the total number of peaches per acre. f. Calculate Y(30), Y(36), and Y(4). What is the meaning of these values? How are they related to your answers to parts a through c? Comments: This question is designed to let students verify that they have written a correct formula; however, the prompt is not stated as such because students will not learn until a higher mathematics course that three points determine a parabola. So, a more accurate description of this item is that it allows students to verify that they do not have a wrong formula. Solution: Y(30) = 30( ) = 30(600) = or Y ( 30) = 960( 30) 1( 30) = ( 900) = = Y(36) = 36(960 43) = 36(58) = or Y ( 36) = 960( 36) 1( 36) = ( 196) = = Y(4) = 4( ) = 4(456) = 1915 or Y ( 4) = 960( 4) 1( 4) = ( 1764) = = 1915 Y(30) = means that there are peaches per acre when there are 30 trees per acre. Y(36) = means that there are peaches per acre when there are 36 trees per acre. Y(4) = 1915 means that there are 1915 peaches per acre when there are 4 trees per acre. The three values are the answers to parts a through c, respectively, because they express the same idea in function notation. g. What is the relationship between the domain for the function T and the domain for the function Y? Explain. The domains are the same. The formula for the function Y applies only to possible numbers of peach trees per acre. These are the values listed in the domain of T. Mathematics : Quadratic Functions July 015 Page 37 of 19
38 3. Paula wants to know whether there is a different number of trees per acre that will give the same yield per acre as the yield when she plants 30 trees per acre. a. Write an equation that expresses the requirement that x trees per acre yields the same total number of peaches per acre as planting 30 trees per acre. Equation: x x x( x) = or = b. Use the algebraic rules for creating equivalent equations to obtain an equivalent equation with an expression in x on one side of the equation and 0 on the other. ( x) x = x 1x = x 960x = c. Multiply this equation by an appropriate rational number so that the new equation is of the form x + bx + c = 0. Explain why this new equation has the same solution set as the equations from parts a and b. 1 1 ( 1x + 960x 18000) = ( 0) 1 1 x 80x = 0 Each of the equations shown in parts b and c is obtained from the previous equation by application of the Addition Property of Equality or the Multiplication Property of Equality. Equations obtained by the use of the properties have the same solution set as the original equation. d. When the equation is in the form x + bx + c = 0, what are the values of b and c b = 80 and c = 1500 e. Find integers m and n such that m n = c and m + n = b. ( 30)( 50) = 1500 and ( 30) + ( 50) = 80, so m = 30 and n = 50. f. Using the values of m and n found in part e, form the algebraic expression ( x + m)( x + n) and simplify it. (x 30)(x 50) = x 80x g. Combining parts d through f, rewrite the equation from part c in the form ( x + m)( x + n) = 0. x 80x = 0 From part c is equivalent to the equation (x 30)(x 50) = 0. Mathematics : Quadratic Functions July 015 Page 38 of 19
39 h. This equation expresses the idea that the product of two numbers, x + m and x + n, is equal to 0. We know from the discussion in Unit that, when the product of two numbers is 0, one of the numbers has to be 0. This property is called the Zero Product Property. For these particular values of m and n, what value of x makes x + m= 0 and what value of x makes x + n= 0? If x 30 = 0, then x = 30. If x 50 = 0, then x = 50. i. Verify that the answers to part h are solutions to the equation written in part a. It is appropriate to use a calculator for the arithmetic. We substitute 30 for x in the left-hand side of the equation 960x 1x = to obtain 960( 30) 1( 30) = ( 900) = = to show that 30 satisfies the equation. We substitute 50 for x in the left-hand side of the equation 960x 1x = to obtain 960( 50) 1( 50) = ( 500) = = to show that 50 satisfies the equation. j. Write a sentence to explain the meaning of your solutions to the equation in relation to planting peach trees. If Paula plants 30 trees per acre or 50 trees per acre, the yield in total peaches per acre is Paula saw another peach grower, Sam, from a neighboring county at a farm equipment auction and began talking to him about the possibilities for the new section of her orchard. Sam was surprised to learn about the agricultural research and said that it probably explained the drop in yield for an orchard near him. This peach farm has more than 30 trees per acre and is getting an average total yield of 14,400 peaches per acre. (Remember: Throughout this task assume that, for all peach growers in this area, the average yield is 600 peaches per tree when 30 trees per acre are planted and that this yield will decrease by 1 peaches per tree for each additional tree per acre.) a. Write an equation that expresses the situation that x trees per acre results in a total yield per acre of 14,400 peaches per acre. Equation: x x x( x) = or = Mathematics : Quadratic Functions July 015 Page 39 of 19
40 b. Use the algebraic rules for creating equivalent equations to obtain an equivalent equation with an expression in x on one side of the equation and 0 on the other. ( x) x = x 1x = x + x = c. Multiply this equation by an appropriate rational number so that the new equation is of the form x + bx + c = 0. Explain why this new equation has the same solution set as the equations from parts a and b = 1 1 x 80x = 0 ( 1x 960x 14400) ( 0) d. When the equation is in the form x + bx + c = 0, what is value of b and what is the value of c? b = 80 and c = 100 e. Find integers m and n such that m n = c and m + n = b. ( 0)( 60) = 100 and ( 0) + ( 60) = 80, so m = 0 and n = 60. f. Using the values of m and n found in part e, form the algebraic expression ( x + m)( x + n) and simplify ( x + m)( x + n). (x 0)(x 60) = x 80x g. Combining parts d through f, rewrite the equation from part d in the form ( x m)( x n) =. x 80x+ 100 = 0 from part c is equivalent to the equation (x 0)(x 60) = 0. h. This equation expresses the idea that the product of two numbers, x + m and x + n, is equal to 0. We know from the discussion in Unit that, when the product of two numbers is 0, one of the numbers has to be 0. What value of x makes x + m= 0? What value of x makes x + n= 0? If x 0 = 0, then x = 0. If x 60 = 0, then x = 60. i. Verify that the answers to part h are solutions to the equation written in part a. It is appropriate to use a calculator for the arithmetic. Mathematics : Quadratic Functions July 015 Page 40 of 19
41 We substitute 0 for x in the left-hand side of the equation 960x 1x = to obtain 960( 0) 1( 0) = ( 400) = = to show that 0 satisfies the equation. We substitute 60 for x in the left-hand side of the equation 960x 1x = to obtain 960( 60) 1( 60) = ( 3600) = = to show that 60 satisfies the equation. j. Which of the solutions verified in part i is (are) in the domain of the function Y? How many peach trees per acre are planted at the peach orchard getting peaches per acre? Comments: This question provides the opportunity for discussing the distinction between solving an equation and solving a problem in context. This distinction is often critical in using a quadratic equation to solve an applied problem. Solving an equation in one variable requires that we find all the real numbers which satisfy the given equation. However, the context may put additional restrictions on the solution that are not implied by the equation. In this context the number of trees per acre must be between 30 and 80, inclusive. In other situations, the desired quantity is a measurement that must be positive. In other situations, the problem situation requires solutions that are whole numbers. Thus, the problem solver must eliminate those solutions to the equation that do not satisfy conditions of the context. Since this issue often arises in working with quadratic equations, the task introduces the idea early in the discussion of solving such equations. Solution: The solution x = 60 is in the domain of the function Y. The solution x = 0 is not. Thus, there must be 60 trees per acre at the orchard getting a yield peaches per acre. The steps in items 3 and 4 outline a method of solving equations of the form x + bx + c = 0. These equations are called quadratic equations and an expression of the form x + bx + c is called a quadratic expression. In general, quadratic expressions may have any nonzero coefficient on the term. An important part of this method for solving quadratic equations is the process of rewriting an expression of the form x + bx + c in the form ( x + m)( x + n). The identity tells us that the product of the numbers m and n must equal c and that the sum of m and n must equal b. x Mathematics : Quadratic Functions July 015 Page 41 of 19
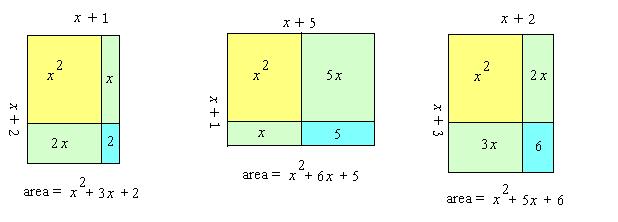
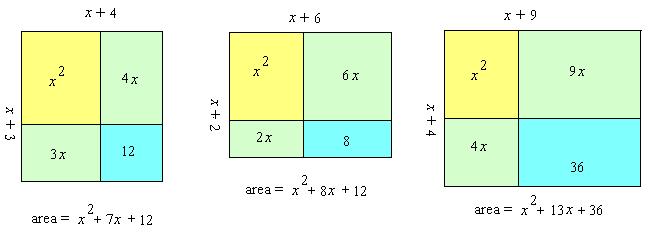
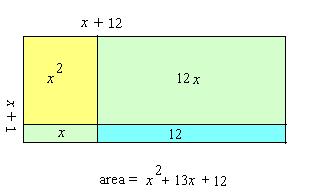
42 5. Since the whole expression ( x + m)( x + n) is a product, we call the expressions x + m and x + n the factors of this product. For the following expressions in the form x + bx + c, rewrite the expression as a product of factors of the form x + m and x + n. Verify each answer by drawing a rectangle with sides of length x + m and x + n, respectively, and showing geometrically that the area of the rectangle is x + bx + c. a. x + 3x + ( x + 1)( x + ) b. x + 6x + 5 ( x + 1)( x + 5) c. x + 5x + 6 ( x + )( x + 3) d. x + 7x + 1 ( x + 3)( x + 4) e. x + 8x + 1 ( x + )( x + 6) f. x + 13x + 36 ( x + 4)( x + 9) g. x + 13x + 1 ( x + 1)( x + 1) The rectangles are drawn below. Comments: The verification asks students to revisit the area model of multiplication and see the factors x + m and x + n as the lengths of sides of a rectangle whose area is the given quadratic expression. It is important to revisit geometric models so that students have concrete meaning for the factoring process. Students need to see the pattern in factoring, but they need to do more than manipulate patterns. Mathematics : Quadratic Functions July 015 Page 4 of 19
43 Mathematics : Quadratic Functions July 015 Page 43 of 19
44 6. In item 5, the values of b and c were positive. Now use Identity 1 in reverse to factor each of the following quadratic expressions of the form x + bx + c where c is positive but b is negative. Verify each answer by multiplying the factored form to obtain the original expression. a. x 8x + 7 f. x 11x + 18 ( x 1)( x 7) ( x )( x 9) b. x 9x + 18 ( x 3)( x 6) g. x 1x + 7 ( x 3)( x 9) c. x 4x + 4 ( x )( x ) d. x 8x + 15 ( x 3)( x 5) e. x 11x + 4 ( x 3)( x 8) The verifications by multiplication are shown below. ( )( ) ( ) ( )( ) x 1 x 7 = x x x 7 = x 7x x + 7= x 8x + 7 ( )( ) ( ) ( )( ) x 3 x 6 = x x x 6 = x 6x 3x + 18 = x 9x + 18 ( )( ) ( ) ( )( ) x x = x x + x = x x x + 4= x 4x + 4 ( )( ) ( ) ( )( ) x 3 x 5 = x x x 5 = x 5x 3x + 15 = x 8x + 15 ( )( ) ( ) ( )( ) x 3 x 8 = x x x 8 = x 8x 3x + 4 = x 11x + 4 ( )( ) ( ) ( )( ) x x 9 = x x 9 + x 9 = x 9x x + 18 = x 11x + 18 ( )( ) ( ) ( )( ) x 3 x 9 = x x x 9 = x 9x 3x + 7 = x 1x + 7 Mathematics : Quadratic Functions July 015 Page 44 of 19
45 Paula s Peaches Continued! Georgia Department of Education 7. Now we return to the peach growers in central Georgia. How many peach trees per acre would result in only 8400 peaches per acre? Which answer makes sense in this particular context? ( ) Y x = x x We want to find x such that Y(x) = 8400, so we need to solve the equation 960x 1x = We put the equation in the standard form x + bx + c = 0 and solve. 960x 1x = x + 960x 8400 = ( 1x + 960x 8400) = ( 0) 1 1 x 80x = 0 ( x 10)( x 70) = 0 x 10 = 0 or x 70 = 0 x = 10 or x = 70 Both 10 and 70 solve the equation, but the expression for total peaches does not apply to values of x less than 30, so 70 is the only solution that meets the requirements of the context. Thus, we can conclude that it would take 70 trees per acre to have a yield of only 8400 peaches per acre. 8. If there are no peach trees on a property, then the yield is zero peaches per acre. Write an equation to express the idea that the yield is zero peaches per acre with x trees planted per acre, where x is number greater than 30. Is there a solution to this equation? Explain why only one of the solutions makes sense in this context. Comments: The situation with the solution x = 0 is a little bit complicated. The number 0 solves the equation. It is true that 0 trees per acre will result in a total yield of 0 peaches per acre, but this is just common sense. We cannot interpret the solution x = 0 as telling us that 0 trees per acre will result in a total yield of 0 peaches per acre because the equation is meaningful only for integer values of x from 30 through 80. Solution: We want to find x such that Y(x) = 0, so the equation is: 960x 1x = 0. We put the equation in the standard form x + bx + c = 0 and solve. Mathematics : Quadratic Functions July 015 Page 45 of 19
46 x + x = Georgia Department of Education 1 1 ( 1x x) = ( 0) 1 1 x 80x = 0 ( x)( x 80) = 0 x = 0 or x 80 = 0 x = 0 or x = 80 The equation expressing the idea that the yield is 0 peaches per acre has a solution for more than 30 trees per acre; the answer is 80 trees per acre. This is consistent with the original information. In item 1, we saw that 80 trees per acre would reduce the yield to 0 peaches per tree. Thus, the total yield per acre is 0 peaches. 9. At the same auction where Paula heard about the peach grower who was getting a low yield, she talked to the owner of a major farm supply store in the area. Paula began telling the store owner about her plans to expand her orchard, and the store owner responded by telling her about a local grower that gets 19,00 peaches per acre. Is this number of peaches per acre possible? If so, how many trees were planted? To answer this question we need to solve the equation 960x 1x = x + 960x 1900 = ( 1x + 960x 1900) = ( 0) 1 1 x 80x = 0 ( x 40)( x 40) = 0 x 40 = 0 x = 40 Yes, with 40 trees per acre, the total yield in 1900 peaches per acre. 10. Using graph paper, explore the graph of Y as a function of x. a. What points on the graph correspond to the answers for part j from questions 3 and 4? (30, 18000), (50, 18000), (60, 14400) b. What points on the graph correspond to the answers to items 7, 8, and 9? (70, 8400), (80, 0), (40, 1900) Mathematics : Quadratic Functions July 015 Page 46 of 19

47 c. What is the relationship of the graph of the function Y to the graph of the function f, where the formula for f(x) is the same as the formula for Y(x) but the domain for f is all real numbers? The graph of the function Y consists of those points on the graph of the function f such that x is in the domain for Y = {30, 31, 3,, 79, 80}. d. Items 4, 7, and 8 give information about points that are on the graph of f but not on the graph of Y. What points are these? (0, 14400), (10, 8400), (0, 0) e. Graph the functions f and Y on the same axes. How does your graph show that the domain of f is all real numbers? How is the domain of Y shown on your graph? Solution: The graphs of f and Y are shown at the right. The graph of f shows that the domain is all real numbers by indicating that the graph continues beyond the grid area shown. The graph of Y shows that domain is the set of integers from 30 through 80 by showing distinct points on the graph of f at integer values. Note that, for part of the domain, the discrete points are close enough together that drawing them with dots fills in the line. Comments: The graph at the right was drawn using technology to plot all 51 points on the graph of Y accurately. It is provided to show that even on a small scale; the points on the graph of Y show up as discrete points. It is unreasonable to expect students to calculate and graph all 51 points accurately. However, they can draw the graph of f and then indicate integer spaced points on this graph. Mathematics : Quadratic Functions July 015 Page 47 of 19

 and (50, 18000).")
48 f. Draw the line y = on the graph drawn for item 10, part e. This line is the graph of the function with constant value Where does this line intersect the graph of the function Y? Based on the graph, how many trees per acre give a yield of more than peaches per acre? Comments: This question shows this part of the solution to the equation as the intersection of the line and the graph of Y gives more information than the algebraic solution of the equation. Solution: The line is shown on the graph at the right. The line intersects the graph of the function Y at the points ( ) and (50, 18000). Based on the graph, when the number of trees is 31, 3,, 49, that is, when the number of trees is strictly between 30 and 50, the yield is more than peaches per acre. g. Draw the line y = 8400 on your graph. Where does this line intersect the graph of the function Y? Based on the graph, how many trees per acre give a yield of fewer than 8400 peaches per acre? The line is shown on the graph at the right. The line intersects the graph of the function Y at the point (70, 8400). Based on the graph, when the number of trees is 71, 7,, 80, that is, when the number of trees is more than 70, the yield is fewer than 8400 peaches per acre. h. Use a graphing utility and this intersection method to find the number of trees per acre that give a total yield closest to the following numbers of peaches per acre: (i) (ii) (iii) 0000 Using the trace feature on the graph at the right we find that (i) 68 trees per acre gives the yield closest to peaches per acre, (ii) 59 trees per acre gives the yield closest to peaches per acre, and (iii) 40 trees per acre gives the yield closest to 0000 peaches per acre. Mathematics : Quadratic Functions July 015 Page 48 of 19
49 i. Find the value of the function Y for the number of trees given in answering (i) (iii) in part c above. Y(68) = 68( ) = 68(144) = 979 Y(59) = 59( ) = 59(5) = Y(40) = 40( ) = 40(480) = In items 5 and 6, we used factoring as part of a process to solve equations that are equivalent to equations of the form x + bx + c = 0 where b and c are integers. Look back at the steps you did in items 3 and 4, and describe the process for solving an equation of the form x + bx + c = 0. Use this process to solve each of the following equations, that is, to find all of the numbers that satisfy the original equation. Verify your work by checking each solution in the original equation. Step 1: Factor the expression x + bx + c and write an equivalent equation containing the factored form. Step : By the Zero Product Property, since the product is zero, one of the factors must equal zero. Set each factor equal to zero. Step 3: Solve each equation from Step. Each of the solutions is a solution for the quadratic equation. a. x 6x + 8= 0 ( x )( x 4) = 0 x = 0 or x 4= 0 x = or x = 4 Solutions:, 4 Checks: = = 0 ( ) ( ) ( ) ( ) = = 0 b. x 15x + 36 = 0 ( x 3)( x 1) = 0 x 3 = 0 or x 1 = 0 x = 3 or x = 1 Solutions: 3, 1 Mathematics : Quadratic Functions July 015 Page 49 of 19
50 Checks: ( ) ( ) = = 0 ( ) ( ) = = 0 c. x + 8x + 7 = 0 ( x )( x ) = 0 x + 1 = 0 or x + 7 = 0 x = 1 or x = 7 Solutions: 1, 7 Checks: = = 0 ( ) ( ) ( ) ( ) Georgia Department of Education = = 0 d. x 3x 10 = 0 ( x )( x ) + 5 = 0 x + = 0 or x 5 = 0 x = or x = 5 Solutions:, 5 Checks: ( ) ( ) 3 10 = = 0 ( ) ( ) = = 0 e. x + x 15 = 0 ( x )( x ) = 0 x 3 = 0 or x + 5 = 0 x = 3 or x = 5 Solutions: 3, 5 Checks: ( ) ( ) = = 0 ( ) ( ) = = 0 Mathematics : Quadratic Functions July 015 Page 50 of 19
51 f. x 4x 1 = 0 ( x )( x ) = 0 x + 3 = 0 or x 7 = 0 x = 3 or x = 7 Solutions: 3, 7 Checks: = = 0 ( ) ( ) ( ) ( ) = = 0 Georgia Department of Education g. x 7x = 0 ( x)( x ) 7 = 0 x = 0 or x 7 = 0 x = 7 Solutions: 0, 7 Checks: ( ) ( ) 0 70 = 0 0= 0 ( ) ( ) = = 0 h. x + 13x = 0 ( x)( x ) + 13 = 0 x = 0 or x + 13 = 0 x = 13 Solutions: 0, 13 Checks: ( ) ( ) = = 0 ( ) ( ) = = 0 Mathematics : Quadratic Functions July 015 Page 51 of 19
52 1. For each of the equations solved in question 11, do the following: a. Use technology to graph a function whose formula is given by the left-hand side of the equation. b. Find the points on the graph which correspond to the solutions found in item 8. c. How is each of these results an example of the intersection method explored above? a. The graph of y = x 6x + 8 is shown at the right. b. The numbers and 4 are solutions to the quadratic equation x 6x + 8= 0. The corresponding points are (, 0) and (4, 0). a. The graph of y = x 15x + 36 is shown at the right. b. The numbers 3 and 1 are solutions to the quadratic equation x 15x + 36 = 0. The corresponding points are (3, 0) and (1, 0). a. The graph of y = x + 8x + 7 is shown at the right. b. The numbers 1 and 7 are solutions to the quadratic equation x + 8x + 7 = 0. The corresponding points are ( 1, 0) and ( 7, 0). Mathematics : Quadratic Functions July 015 Page 5 of 19
53 a. The graph of y = x 3x 10 is shown at the right. b. The numbers 5 and are solutions to the quadratic equation x 3x 10 = 0. The corresponding points are (5, 0) and (, 0). a. The graph of y = x + x 15 is shown at the right. b. The numbers 3 and 5 are solutions to the quadratic equation x + x 15 = 0. The corresponding points are (3, 0) and ( 5, 0). a. The graph of y = x 4x 1 is shown at the right. b. The numbers 7 and 3 are solutions to the quadratic equation x 4x 1 = 0. The corresponding points are (7, 0) and ( 3, 0). Mathematics : Quadratic Functions July 015 Page 53 of 19
54 a. The graph of y = x 7x is shown at the right. b. The numbers 0 and 7 are solutions to the quadratic equation x 7x = 0. The corresponding points are (0, 0) and (7, 0). a. The graph of y = x + 13x is shown at the right. b. The numbers 0 and 13 are solutions to the quadratic equation x + 13x = 0. The corresponding points are (0, 0) and ( 13, 0). c. For each graph, the points that correspond to the solutions of the equation are the x-intercepts of the graph. The x-axis is the line y = 0. So the solutions of the original equation are the x- coordinates of the intersection points of two functions, one given by an equation of the form y = x + bx + c and the other given by the equation y = 0. Mathematics : Quadratic Functions July 015 Page 54 of 19
55 Paula s Peaches Paula is a peach grower in central Georgia and wants to expand her peach orchard. In her current orchard, there are 30 trees per acre and the average yield per tree is 600 peaches. Data from the local agricultural experiment station indicates that if Paula plants more than 30 trees per acre, once the trees are in production, the average yield of 600 peaches per tree will decrease by 1 peaches for each tree over 30. She needs to decide how many trees to plant in the new section of the orchard. 1. Paula believes that algebra can help her determine the best plan for the new section of orchard and begins by developing a mathematical model of the relationship between the number of trees per acre and the average yield in peaches per tree. a. Is this relationship linear or nonlinear? Explain your reasoning. b. If Paula plants 6 more trees per acre, what will be the average yield in peaches per tree? What is the average yield in peaches per tree if she plants 4 trees per acre? c. Let T be the function for which the input x is the number of trees planted on each acre and T(x) is the average yield in peaches per tree. Write a formula for T(x) in terms of x and express it in simplest form. Explain how you know that your formula is correct. d. Draw a graph of the function T. Given that the information from the agricultural experiment station applies only to increasing the number of trees per acre, what is an appropriate domain for the function T?. Since her income from peaches depends on the total number of peaches she produces, Paula realized that she needed to take a next step and consider the total number of peaches that she can produce per acre. a. With the current 30 trees per acre, what is the yield in total peaches per acre? If Paula plants 36 trees per acre, what will be the yield in total peaches per acre? 4 trees per acre? b. Find the average rate of change of peaches per acre with respect to number of trees per acre when the number of trees per acre increases from 30 to 36. Write a sentence to explain what this number means. c. Find the average rate of change of peaches per acre with respect to the number of trees per acre when the number of trees per acre increases from 36 to 4. Write a sentence to explain the meaning of this number. d. Is the relationship between number of trees per acre and yield in peaches per acre linear? Explain your reasoning. Mathematics : Quadratic Functions July 015 Page 55 of 19
56 e. Let Y be the function that expresses this relationship; that is, the function for which the input x is the number of trees planted on each acre and the output Y(x) is the total yield in peaches per acre. Write a formula for Y(x) in terms of x and express your answer in expanded form. f. Calculate Y(30), Y(36), and Y(4). What is the meaning of these values? How are they related to your answers to parts a through c? g. What is the relationship between the domain for the function T and the domain for the function Y? Explain. 3. Paula wants to know whether there is a different number of trees per acre that will give the same yield per acre as the yield when she plants 30 trees per acre. a. Write an equation that expresses the requirement that x trees per acre yields the same total number of peaches per acre as planting 30 trees per acre. b. Use the algebraic rules for creating equivalent equations to obtain an equivalent equation with an expression in x on one side of the equation and 0 on the other. c. Multiply this equation by an appropriate rational number so that the new equation is of the form x + bx + c = 0. Explain why this new equation has the same solution set as the equations from parts a and b. d. When the equation is in the form x + bx + c = 0, what are the values of b and c e. Find integers m and n such that m n = c and m + n = b. f. Using the values of m and n found in part e, form the algebraic expression ( x + m)( x + n) and simplify it. g. Combining parts d through f, rewrite the equation from part c in the form ( x + m)( x + n) = 0. h. This equation expresses the idea that the product of two numbers, x + m and x + n, is equal to 0. We know from the discussion in Unit that, when the product of two numbers is 0, one of the numbers has to be 0. This property is called the Zero Product Property. For these particular values of m and n, what value of x makes x + m= 0 and what value of x makes x + n= 0? i. Verify that the answers to part h are solutions to the equation written in part a. It is appropriate to use a calculator for the arithmetic. Mathematics : Quadratic Functions July 015 Page 56 of 19
57 j. Write a sentence to explain the meaning of your solutions to the equation in relation to planting peach trees. 4. Paula saw another peach grower, Sam, from a neighboring county at a farm equipment auction and began talking to him about the possibilities for the new section of her orchard. Sam was surprised to learn about the agricultural research and said that it probably explained the drop in yield for a orchard near him. This peach farm has more than 30 trees per acre and is getting an average total yield of 14,400 peaches per acre. (Remember: Throughout this task assume that, for all peach growers in this area, the average yield is 600 peaches per tree when 30 trees per acre are planted and that this yield will decrease by 1 peaches per tree for each additional tree per acre.) a. Write an equation that expresses the situation that x trees per acre results in a total yield per acre of 14,400 peaches per acre. b. Use the algebraic rules for creating equivalent equations to obtain an equivalent equation with an expression in x on one side of the equation and 0 on the other. c. Multiply this equation by an appropriate rational number so that the new equation is of the form x + bx + c = 0. Explain why this new equation has the same solution set as the equations from parts and b. d. When the equation is in the form x + bx + c = 0, what is value of b and what is the value of c? e. Find integers m and n such that m n = c and m + n = b. f. Using the values of m and n found in part e, form the algebraic expression ( x + m)( x + n) and simplify it. g. Combining parts d through f, rewrite the equation from part d in the form( x + m)( x + n) = 0. h. This equation expresses the idea that the product of two numbers, x + m and x + n, is equal to 0. We know from the discussion in Unit that, when the product of two numbers is 0, one of the numbers has to be 0. What value of x makes x + m= 0? What value of x makes x + n= 0? i. Verify that the answers to part h are solutions to the equation written in part a. It is appropriate to use a calculator for the arithmetic. j. Which of the solutions verified in part i is (are) in the domain of the function Y? How many peach trees per acre are planted at the peach orchard getting peaches per acre? Mathematics : Quadratic Functions July 015 Page 57 of 19

58 The steps in items 3 and 4 outline a method of solving equations of the form x + bx + c = 0. These equations are called quadratic equations and an expression of the form x + bx + c is called a quadratic expression. In general, quadratic expressions may have any nonzero coefficient on the term. An important part of this method for solving quadratic equations is the process of rewriting an expression of the form x + bx + c in the form ( x + m)( x + n). The identity tells us that the product of the numbers m and n must equal c and that the sum of m and n must equal b. 5. Since the whole expression ( x + m)( x + n) is a product, we call the expressions x + m and x + n the factors of this product. For the following expressions in the form x + bx + c, rewrite the expression as a product of factors of the form x + m and x + n. Verify each answer by drawing a rectangle with sides of length x + m and x + n, respectively, and showing geometrically that the area of the rectangle is x + bx + c. On a separate sheet of paper: Example: x + 3x + Solution: (x + 1)*(x + ) f. x + 13x + 1 x a. x + 6x + 5 b. x + 5x + 6 c. x + 7x + 1 d. x + 8x + 1 e. x + 13x + 36 Mathematics : Quadratic Functions July 015 Page 58 of 19
59 6. In item 5, the values of b and c were positive. Now use Identity 1 in reverse to factor each of the following quadratic expressions of the form x + bx + c where c is positive but b is negative. Verify each answer by multiplying the factored form to obtain the original expression. On a separate sheet of paper: a. x 8x + 7 e. x 11x + 4 b. x 9x + 18 f. x 11x + 18 c. x 4x + 4 g. x 1x + 7 d. x 8x + 15 Paula s Peaches Continued! 7. Now we return to the peach growers in central Georgia. How many peach trees per acre would result in only 8400 peaches per acre? Which answer makes sense in this particular context? 8. If there are no peach trees on a property, then the yield is zero peaches per acre. Write an equation to express the idea that the yield is zero peaches per acre with x trees planted per acre, where x is number greater than 30. Is there a solution to this equation? Explain why only one of the solutions makes sense in this context. 9. At the same auction where Paula heard about the peach grower who was getting a low yield, she talked to the owner of a major farm supply store in the area. Paula began telling the store owner about her plans to expand her orchard, and the store owner responded by telling her about a local grower that gets 19,00 peaches per acre. Is this number of peaches per acre possible? If so, how many trees were planted? 10. Using graph paper, explore the graph of Y as a function of x. a. What points on the graph correspond to the answers for part j from questions 3 and 4? b. What points on the graph correspond to the answers to questions 7, 8, and 9? c. What is the relationship of the graph of the function Y to the graph of the function f, where the formula for f(x) is the same as the formula for Y(x) but the domain for f is all real numbers? d. Questions 4, 7, and 8 give information about points that are on the graph of f but not on the graph of Y. What points are these? July 015 Page 59 of 19
60 e. Graph the functions f and Y on the same axes. How does your graph show that the domain of f is all real numbers? How is the domain of Y shown on your graph? f. Draw the line y = on the graph drawn for item 10, part e. This line is the graph of the function with constant value Where does this line intersect the graph of the function Y? Based on the graph, how many trees per acre give a yield of more than peaches per acre? g. Draw the line y = 8400 on your graph. Where does this line intersect the graph of the function Y? Based on the graph, how many trees per acre give a yield of fewer than 8400 peaches per acre? h. Use a graphing utility and this intersection method to find the number of trees per acre that give a total yield closest to the following numbers of peaches per acre: (i) (ii) (iii) 0000 i. Find the value of the function Y for the number of trees given in answering (i) (iii) in part c above. 13. In items 5 and 6, we used factoring as part of a process to solve equations that are equivalent to equations of the form x + bx + c = 0 where b and c are integers. Look back at the steps you did in items 3 and 4, and describe the process for solving an equation of the form x + bx + c = 0. Use this process to solve each of the following equations, that is, to find all of the numbers that satisfy the original equation. Verify your work by checking each solution in the original equation. a. x 6x + 8= 0 b. x 15x + 36 = 0 c. x + 8x + 7 = 0 d. x 3x 10 = 0 e. x + x 15 = 0 f. x 4x 1 = 0 g. x 7x = 0 h. x + 13x = 0 July 015 Page 60 of 19
61 11. For each of the equations solved in question 11, do the following. a. Use technology to graph a function whose formula is given by the left-hand side of the equation. b. Find the points on the graph which correspond to the solutions found in question 8. c. How is each of these results an example of the intersection method explored above? July 015 Page 61 of 19
62 HENLEY S CHOCOLATES Georgia Department of Education Standards Addressed in this Task MGSE9-1.A.REI.4b Solve quadratic equations by inspection (e.g., for x = 49), taking square roots, factoring, completing the square, and the quadratic formula, as appropriate to the initial form of the equation (limit to real number solutions). MGSE9-1.F.BF.3 Identify the effect on the graph of replacing f(x) by f(x) + k, k f(x), f(kx), and f(x + k) for specific values of k (both positive and negative); find the value of k given the graphs. Experiment with cases and illustrate an explanation of the effects on the graph using technology. Include recognizing even and odd functions from their graphs and algebraic expressions for them. Standards for Mathematical Practice 1. Make sense of problems and persevere in solving them by requiring students to interpret and make meaning of a problem and find a logical starting point, and to monitor their progress and change their approach to solving the problem, if necessary.. Reason abstractly and quantitatively by requiring students to make sense of quantities and their relationships to one another in problem situations. 4. Model with mathematics by expecting students to apply the mathematics concepts they know in order to solve problems arising in everyday situations, and reflect on whether the results are sensible for the given scenario. 5. Use appropriate tools strategically by expecting students to consider available tools when solving a mathematical problem. These tools might include pencil and paper, concrete models, a ruler, a protractor, a compass, a calculator, software, etc. 7. Look for and make use of structure by expecting students to apply rules, look for patterns and analyze structure. 8. Look for and express regularity in repeated reasoning by expecting students to understand broader applications and look for structure and general methods in similar situations. Common Student Misconceptions 1. In the cases of quadratic equations, when the use of quadratic formula is not critical, students sometime ignore the negative solutions. For example, for the equation x = 9, students may mention 3 and forget about ( 3). If this misconception persists, advise students to solve this type of quadratic equation either by factoring or by the quadratic formula.. Some students may think that rewriting equations into various forms (taking square roots, completing the square, using quadratic formula and factoring) are isolated techniques within a unit of quadratic July 015 Page 6 of 19
63 equations. Teachers should help students see the value of these skills in the context of solving higher degree equations and examining different families of functions. 3. Students may believe that the graph of y=(x-4) 3 is the graph of y=x 3 shifted 4 units to the left (due to the subtraction symbol). Examples should be explored by hand and on a graphing calculator to overcome this misconception. 4. Students often confuse the shift of a function with the stretch of a function. 5. Students may also believe that even and odd functions refer to the exponent of the variable, rather than the sketch of the graph and the behavior of the function. 6. Additionally, students may believe that all functions have inverses and need to see counter examples, as well as examples in which a non-invertible function can be made into an invertible function by restricting the domain. For example, f(x)=x has an inverse (f -1 (x)= xprovided that the domain is restricted to x 0. Teacher Notes: Introduction: Students express the area of the base of an open box made by cutting squares from the corners of a piece of cardboard as a function of the length of the cardboard. This function is a horizontal shift of a vertical shrink of y = x. The focus of the task is applying what students know about horizontal shifts of quadratic graphs to this contextual problem. In addition students review previously studied graph transformations and the method of solving quadratic equations by finding square roots. Solving equations by finding square roots leads into the next task in the sequence. Supplies Needed: Graphing utility calculators or computer software Graph paper Optional: paper, scissors, rulers, and tape for constructing models of the open boxes July 015 Page 63 of 19
64 Henley Chocolates is famous for its mini chocolate truffles, which are packaged in foil covered boxes. The base of each box is created by cutting squares that are 4 centimeters on an edge from each corner of a rectangular piece of cardboard and folding the cardboard edges up to create a rectangular prism 4 centimeters deep. A matching lid is constructed in a similar manner, but, for this task, we focus on the base, which is illustrated in the diagrams below. For the base of the truffle box, paper tape is used to join the cut edges at each corner. Then the inside and outside of the truffle box base are covered in foil. Henley Chocolates sells to a variety retailers and creates specific box sizes in response to requests from particular clients. However, Henley Chocolates requires that their truffle boxes always be 4 cm deep and that, in order to preserve the distinctive shape associated with Henley Chocolates, the bottom of each truffle box be a rectangle that is two and one-half times as long as it is wide. 1. Henley Chocolates restricts box sizes to those which will hold plastic trays for a whole number of mini truffles. A box needs to be at least centimeters wide to hold one row of mini truffles. Let L denote the length of a piece of cardboard from which a truffle box is made. What value of L corresponds to a finished box base for which the bottom is a rectangle that is centimeters wide? Comment(s): Students will likely sketch the bottom of a finished box that is cm wide and work backwards from there. When students add the correct squares at each corner and determine the dimensions of the piece of cardboard which must be used to make the box, they may think that they have done something wrong because the cardboard piece will not be.5 times as long as it is wide. If so, this should lead to appropriate discussion of the fact that adding the same amount (8 cm) to each dimension of the box bottom will not produce a similar rectangle. If students do not raise the issue, teachers should question students about why the cardboard length is not.5 times the cardboard width. In the resulting discussion, whether prompted by student concerns or teacher questions, students need to review that similar rectangles would have a constant proportion for the sides so that a similar rectangle would July 015 Page 64 of 19

65 require adding.5 times as much to the length as added to the width. As students work through item below, they will focus on the constant difference of 8 centimeters between each dimension of the cardboard and box bottom. Solution(s): For a finished box of width cm, the length must be.5() = 5 cm. Starting with a cm by 5 cm box bottom, we add 4 cm squares to each corner and determine that the piece of cardboard should be = 10 centimeters wide and = 13 centimeters long. Thus, L = 13.. Henley Chocolates has a maximum size box of mini truffles that it will produce for retail sale. For this box, the bottom of the truffle box base is a rectangle that is 50 centimeters long. What are the dimensions of the piece of cardboard from which this size truffle box base is made? Comment(s): Some students will realize that 50 centimeters is 10 times the 5 cm length in the previous item and find the width without computation. Others will need to solve an appropriate equation, as shown in the solution below. Students need to realize that they must divide the length by.5 to get the width so that the width is 1 =, or 0.4, times the length of the rectangular bottom..5 5 July 015 Page 65 of 19

66 Solution(s): If the bottom of the box is 50 centimeters long, then we can find the width, W, of the bottom by solving the simple linear equation.5w = 50 to obtain W = (0.4)(50) = 0 centimeters. We add squares that are 4 centimeters on a side at each corner and conclude that the piece of cardboard from which this truffle box base is made is 8 centimeters by 58 centimeters. See the figure below. 3. Since all of the mini truffle boxes are 4 centimeters deep, each box holds two layers of mini truffles. Thus, the number of truffles that can be packaged in a box depends the number of truffles that can be in one layer, and, hence, on the area of the bottom of the box. Let A(x) denote the area, in square centimeters, of the rectangular bottom of a truffle box base. Write a formula for A(x) in terms of the length L, in centimeters, of the piece of cardboard from which the truffle box base is constructed. Comment(s): Students need to realize that this formula asks them to start with the length of the cardboard and then find expressions for the length and width of the bottom of the truffle box base. The relationships that they discovered in items 1 and should lead them to find the correct formula. If students expand (L 8), teachers should guide them to work with the factored form, since the goal of this part of the activity is the introduction of horizontal shifts of graphs, and this situation shows a situation where this type formula arises naturally. Solution(s): L = the length in centimeters of the cardboard for the box base L 8 = length of the bottom of the truffle box in centimeters, (L 5 8), or.4 (L 8) = width of the bottom of the truffle box in centimeters Thus, A = (L 5 8), or, A = 0.4 (L 8) July 015 Page 66 of 19

67 4. Although Henley Chocolates restricts truffle box sizes to those that fit the plastic trays for a whole number of mini truffles, the engineers responsible for box design find it simpler to study the function A on the domain of all real number values of L in the interval from the minimum value of L found in item 1 to the maximum value of L found in item. State this interval of L values as studied by the engineers at Henley Chocolates. Comment(s): The interval may be stated as an inequality or in interval notation. This simple question guides students to realize that items 1 and have defined a domain of possible lengths for the cardboard from which a truffle box base can be made. Students should be encouraged to see that the bottom of the box can be from 5 to 50 centimeters, and the values of L are 8 centimeters more in each case. Solution(s): 13 L Let g be the function with the same formula as the formula for function A but with domain all real numbers. Describe the transformations of the function f, the square function, that will produce the graph of the function g. Use technology to graph f and g on the same axes to check that the graphs match your description of the described transformations. Comment(s): This item returns students to consideration of the original problem of the box of Henley Chocolates. Solution(s): g (x) = 0.4 (x 8) To obtain the graph of g, the graph of the function f should have a shift to the right of 4 units and then a vertical shrink by a factor of Describe the graph of the function A in words and make a hand drawn sketch. Remember that you found the domain of the function in item 4. What is the range of the function A? Comment(s): Students are asked to make a hand-drawn sketch of the graph of the function A to insure that they understand the graph of the function A as a restricted part of July 015 Page 67 of 19
68 the graph of the function g. In doing so, they will realize that they need to find the range to make the accurate sketch. Solution(s): The graph of the function A is the same as the portion of the graph of the function g with domain 13 x 58. The graph has it lowest point at (13, 10) and increases to the point (58, 1000). It is shown at the right. g (13) = 0.4 (13 8) = 0.4 (5) = 10, and g (58) = 0.4 (58 8) = 0.4 (500) = 1000 So, the range of the function is the set of all real numbers greater than or equal to 10 and less than or equal to The engineers at Henley Chocolates responsible for box design have decided on two new box sizes that they will introduce for the next winter holiday season. a. The area of the bottom of the larger of the new boxes will be 640 square centimeters. Use the function A to write and solve an equation to find the length L of the cardboard need to make this new box. Comment(s): This item is designed to foreshadow the concept of finding the inverse of a function and to review solving quadratic equations by extraction of roots. Solution(s): A (L) = (L 8) = 640 (L 8) = (L 8) = 1600 L 8 = ± 40 L = 8 ± 40 L = 48, -3 The negative solution to the equation is not applicable, so L = 48 centimeters. b. The area of the bottom of the smaller of the new boxes will be 40 square centimeters. Use the function A to write and solve an equation to find the length L of the cardboard need to make this new box. Comment(s): Students should be reminded about the concept of solving an equation versus finding the solution to a problem in context that gave rise to an equation. Students should not be allowed to leave out the negative solution to this equation or the one in part a because they will soon apply this technique to finding all solutions of a variety of quadratic equations. July 015 Page 68 of 19
69 Solution(s): A (L) = (L 8) = 40 (L 8) = (L 8) = 100 L 8 = ± 10 L = 8 ± 10 L = 18, - The negative solution to the equation is not applicable, so L = 18 centimeters. 8. How many mini-truffles do you think the engineers plan to put in each of the new boxes? Comment(s): This item allows students some closure and a reminder of the initial real-world context of the problem. They will need to remember that a row of mini truffles needs cm and assume that the truffles have essentially circular bases so that each mini truffle probably fits into a cm by cm square. Solution(s): There are two layers of mini truffles, so we need to determine how many are in one layer by determining how many rows are in each layer and how many mini truffles are in a row. Each row of mini truffles needs cm. It is reasonable to assume that the base of the truffles are circular so that each mini truffles takes cm of length along the row. The box with area 640 cm is made from cardboard that is 48 cm long, so the box is 40 cm long and 0.4 (40) = 16 cm wide. The box will hold 8 rows of mini truffles in one layer and each 40 cm long row would hold 0 mini truffles. So, there would be 8 (0) = 160 mini truffles in a layer, or 30 mini truffles in the larger new box. The box with area 40 cm is made from cardboard that is 18 cm long, so the box is 10 cm long and 0.4(10) = 4 cm wide. The box will hold rows of mini truffles in one layer and each 10 cm long row would hold 5 mini truffles. So, there would be (5) = 10 mini truffles in a layer, or 0 mini truffles in the smaller new box. July 015 Page 69 of 19

70 Henley s Chocolates Henley Chocolates is famous for its mini chocolate truffles, which are packaged in foil covered boxes. The base of each box is created by cutting squares that are 4 centimeters on an edge from each corner of a rectangular piece of cardboard and folding the cardboard edges up to create a rectangular prism 4 centimeters deep. A matching lid is constructed in a similar manner, but, for this task, we focus on the base, which is illustrated in the diagrams below. For the base of the truffle box, paper tape is used to join the cut edges at each corner. Then the inside and outside of the truffle box base are covered in foil. Henley Chocolates sells to a variety retailers and creates specific box sizes in response to requests from particular clients. However, Henley Chocolates requires that their truffle boxes always be 4 cm deep and that, in order to preserve the distinctive shape associated with Henley July 015 Page 70 of 19

71 Chocolates, the bottom of each truffle box be a rectangle that is two and one-half times as long as it is wide. 1. Henley Chocolates restricts box sizes to those which will hold plastic trays for a whole number of mini truffles. A box needs to be at least centimeters wide to hold one row of mini truffles. Let L denote the length of a piece of cardboard from which a truffle box is made. What value of L corresponds to a finished box base for which the bottom is a rectangle that is centimeters wide?. Henley Chocolates has a maximum size box of mini truffles that it will produce for retail sale. For this box, the bottom of the truffle box base is a rectangle that is 50 centimeters long. What are the dimensions of the piece of cardboard from which this size truffle box base is made? 3. Since all the mini truffle boxes are 4 centimeters deep, each box holds two layers of mini truffles. Thus, the number of truffles that can be packaged in a box depends the number of truffles that can be in one layer, and, hence, on the area of the bottom of the box. Let A(x) denote the area, in square centimeters, of the rectangular bottom of a truffle box base. Write a formula for A(x) in terms of the length L, in centimeters, of the piece of cardboard from which the truffle box base is constructed. 4. Although Henley Chocolates restricts truffle box sizes to those that fit the plastic trays for a whole number of mini truffles, the engineers responsible for box design find it simpler to study the function A on the domain of all real number values of L in the interval from the minimum value of L found in item 1 to the maximum value of L found in item. State this interval of L values as studied by the engineers at Henley Chocolates. 5. Let g be the function with the same formula as the formula for function A but with domain all real numbers. Describe the transformations of the function f, the square function, that will July 015 Page 71 of 19
72 produce the graph of the function g. Use technology to graph f and g on the same axes to check that the graphs match your description of the described transformations. 6. Describe the graph of the function A in words and make a hand drawn sketch. Remember that you found the domain of the function in item 4. What is the range of the function A? 7. The engineers at Henley Chocolates responsible for box design have decided on two new box sizes that they will introduce for the next winter holiday season. a. The area of the bottom of the larger of the new boxes will be 640 square centimeters. Use the function A to write and solve an equation to find the length L of the cardboard need to make this new box. b. The area of the bottom of the smaller of the new boxes will be 40 square centimeters. Use the function A to write and solve an equation to find the length L of the cardboard need to make this new box. 8. How many mini-truffles do you think the engineers plan to put in each of the new boxes? July 015 Page 7 of 19
 = q that has the same solutions.")
73 Completing the Square & Deriving the Quadratic Formula (Spotlight Task) Standards Addressed in this Task MGSE9-1.A.REI.4a Use the method of completing the square to transform any quadratic equation in x into an equation of the form (x p) = q that has the same solutions. Derive the quadratic formula from ax + bx + c = 0. MGSE9-1.A.SSE.3b Complete the square in a quadratic expression to reveal the maximum and minimum value of the function defined by the expression. MGSE9-1.F.IF.7 Graph functions expressed algebraically and show key features of the graph both by hand and by using technology. Standards for Mathematical Practice 7. Look for and make use of structure by expecting students to apply rules, look for patterns and analyze structure. 8. Look for and express regularity in repeated reasoning by expecting students to understand broader applications and look for structure and general methods in similar situations. The following set of tasks and activities is best done one section at a time, with students having time to work on each set and then the teacher facilitating a class discussion about the general ideas in each section before moving to the next. If multiplying binomials and factoring trinomials has been previously introduced with area models and/or algebra tiles, then the first two sections can be skipped or very briefly reviewed. Not all parts of all problems need to be completed. Instead, the students should work enough parts to understand the patterns. In Section, it is important for students to do numbers 8 and 9. Section 1: Area models for multiplication 1. If the sides of a rectangle have lengths x + 3 and x + 5, what is an expression for the area of the rectangle? Draw the rectangle, label its sides, and indicate each part of the area. x + 5 x + 3 x 5x 3x 15 The area of the rectangle is x +8x +15. July 015 Page 73 of 19
74 . For each of the following, draw a rectangle with side lengths corresponding to the factors given. Label the sides and the area of the rectangle: a. (x + 3)(x + 4) x + 4 x + 3 x 4x 3x 1 The area of the rectangle is x +7x +1. b. (x + 1)(x + 7) x + 7 x + 1 x 7x x 7 The area of the rectangle is x +8x +7. c. (x )(x + 5) x + 5 x x 5x -x -10 The area of the rectangle is x +3x 10. d. (x + 1)(x + 3) x + 5 x + 3 x 5x 6x 15 The area of the rectangle is x +11x July 015 Page 74 of 19
75 Section : Factoring by thinking about area and linear quantities (It would be best to have algebra tiles available for use in this section.) For each of the following, draw a rectangle with the indicated area. Find appropriate factors to label the sides of the rectangle. 1. x + 3x + = (x + 1)(x + ) x + x + 3x + x + 1 x x x. x + 5x + 4 = (x + 1)(x + 4) x + 5x + 4 x + 1 x x + 4 4x x 4 3. x + 7x + 6 = (x + 1)(x + 6) x + 7x + 6 x + 1 x x + 6 6x x 6 4. x + 5x + 6 = (x + 3)(x + ) x + 5x + 6 x + x x + 3 3x x 6 July 015 Page 75 of 19
76 5. x + 6x + 8 = (x + 4)(x + ) x + 6x + 8 x + x x + 4 4x x 8 6. x + 8x + 1 = (x + 6)(x + ) x + 8x + 1 x + x x + 6 6x x 1 7. x + 7x + 1 = (x + 3)(x + 4) x + 7x + 1 x + 3 x x + 4 4x 3x 1 8. x + 6x + 9 = (x + 3)(x + 3) = (x + 3) Note: It is important for students to notice that this forms a square geometrically, and it is the square of a binomial. x + 3 x + 6x + 9 x + 3 x 3x 3x 9 July 015 Page 76 of 19

77 9. x + 4x + 4 = (x + )(x + ) = (x + ) Note: It is important for students to notice that this forms a square geometrically, and it is the square of a binomial. x + x + 4x + 4 x + x x x 4 Section 3: Completing the square 1. What number can you fill in the following blank so that x + 6x + will have two equal factors? What are the factors? Draw the area and label the sides. What shape do you have? 9; (x + 3)(x + 3) = (x + 3) It is a square. x + 3 x + 3 x 3x 3x 9. What number can you fill in the following blank so that x + 8x + will have two equal factors? What are the factors? Draw the area and label the sides. What shape do you have? 16; (x + 4)(x + 4) = (x + 4) It is a square. x + 4 x + 4 x 4x 4x 16 July 015 Page 77 of 19
78 3. What number can you fill in the following blank so that x + 10x + will have two equal factors? What are the factors? Draw the area and label the sides. What shape do you have? 5; (x + 5)(x + 5) = (x + 5) It is a square. x + 5 x + 5 x 5x 5x 5 4. What would you have to add to x + 1x in order to make a square? 36 What could you add to x + 0x to make a square? 100 What about x + 50x? 65 What if you had x + bx? Add b Section 4: Solving equations by completing the square 1. Solve x = 9 without factoring. How many solutions do you have? What are your solutions? There are two solutions. x = ±3. Use the same method as in question 5 to solve (x + 1) = 9. How many solutions do you have? What are your solutions? There are two solutions. (x + 1) = ±3, so x = -4 or 3. In general, we can solve any equation of this form (x + h) = k by taking the square root of both sides and then solving the two equations that we get. Solve each of the following: a. (x + 3) = 16 (x + 3) = ±4, so x = -7 or 1 b. (x + ) = 5 (x + ) = ± 5, so x = ± 5 c. (x 3) = 4 (x 3) = ±, so x = 1 or 5 d. (x 4) = 3 (x 4) = ± 3, so x = 4 ± 3 4. Now, if we notice that we have the right combination of numbers, we can actually solve other equations by first putting them into this, using what we noticed in questions 1 4. Notice that if we have x + 6x + 9 = 5, the left side is a square, that is, x + 6x + 9 = (x + 3). So, we can rewrite x + 6x + 9 = 5 as (x + 3) = 5, and then solve it just like we did the problems in question 7. (What do you get?) (x + 3) = ±5, so x = -8 or July 015 Page 78 of 19
79 5. Sometimes, though, the problem is not written quite in the right form. That s okay. We can apply what we already know about solving equations to write it in the right form, and then we can solve it. This is called completing the square. Let s say we have x + 6x = 7. The left side of this equation is not a square, but we know what to add to it. If we add 9 to both sides of the equation, we get x + 6x + 9 = 16. Now we can solve it just like the ones above. What is the solution? (x + 3) = 11, so (x + 3) = ±4, and x = -7 or 1 6. Try these: a. x + 10x = -9 b. x + 8x = 0 c. x + x = 5 d. x + 6x 7 = 0 e. x + 8x = -6 x = 9 + (x + 5) = 11 (x + 5) = ±4 x = -1 or -9 x = + 11 (x + 4) = 33 (x + 4) = ±6 x = -10 or x = (x + 1) = 6 (x + 1) = ± 6 x = 1 ± 6 x + 66 = 7 x = (x + 3) = 11 (x + 3) = ±4 x = -7 or 1 x x = x + 44 = 3 x = (x + ) = 1 (x + ) = ±1 x = -3 or -1 July 015 Page 79 of 19
80 Section 5: Deriving the quadratic formula by completing the square If you can complete the square for a general quadratic equation, you will derive a formula you can use to solve any quadratic equation. Start with ax + bx + c = 0, and follow the steps you used in Section 4. ax + bb + c = 0 ax + bb = c x + b c x = a a x + b b x + a = c b + a x + b = b 444 4a 4a x + b = b 444 4a x + b = ± b 444 4a x = b ± b 444 x = b ± b 444 Thus, the quadratic formula is: if ax + bx + c = 0, then x = b± b 444. July 015 Page 80 of 19
81 Completing the Square & Deriving the Quadratic Formula (Spotlight Task) Standards Addressed in this Task MGSE9-1.A.REI.4a Use the method of completing the square to transform any quadratic equation in x into an equation of the form (x p) = q that has the same solutions. Derive the quadratic formula from ax + bx + c = 0. MGSE9-1.A.SSE.3b Complete the square in a quadratic expression to reveal the maximum and minimum value of the function defined by the expression. MGSE9-1.F.IF.7 Graph functions expressed algebraically and show key features of the graph both by hand and by using technology. Standards for Mathematical Practice 7. Look for and make use of structure by expecting students to apply rules, look for patterns and analyze structure. 8. Look for and express regularity in repeated reasoning by expecting students to understand broader applications and look for structure and general methods in similar situations. Section 1: Area models for multiplication 1. If the sides of a rectangle have lengths x + 3 and x + 5, what is an expression for the area of the rectangle? Draw the rectangle, label its sides, and indicate each part of the area.. For each of the following, draw a rectangle with side lengths corresponding to the factors given. Label the sides and the area of the rectangle: a. (x + 3)(x + 4) b. (x + 1)(x + 7) c. (x )(x + 5) July 015 Page 81 of 19
82 d. (x + 1)(x + 3) Georgia Department of Education Section : Factoring by thinking about area and linear quantities For each of the following, draw a rectangle with the indicated area. Find appropriate factors to label the sides of the rectangle. 1. x + 3x +. x + 5x x + 7x x + 5x x + 6x + 8 July 015 Page 8 of 19
83 6. x + 8x x + 7x x + 6x x + 4x + 4 Section 3: Completing the square 1. What number can you fill in the following blank so that x + 6x + will have two equal factors? What are the factors? Draw the area and label the sides. What shape do you have?. What number can you fill in the following blank so that x + 8x + will have two equal factors? What are the factors? Draw the area and label the sides. What shape do you have? July 015 Page 83 of 19
84 3. What number can you fill in the following blank so that x + 4x + will have two equal factors? What are the factors? Draw the area and label the sides. What shape do you have? 4. What would you have to add to x + 10x in order to make a square? What could you add to x + 0x to make a square? What about x + 50x? What if you had x + bx? Section 4: Solving equations by completing the square 1. Solve x = 9 without factoring. How many solutions do you have? What are your solutions?. Use the same method as in question 5 to solve (x + 1) = 9. How many solutions do you have? What are your solutions? 3. In general, we can solve any equation of this form (x + h) = k by taking the square root of both sides and then solving the two equations that we get. Solve each of the following: a. (x + 3) = 16 b. (x + ) = 5 c. (x 3) = 4 d. (x 4) = 3 July 015 Page 84 of 19
85 4. Now, if we notice that we have the right combination of numbers, we can actually solve other equations by first putting them into this, using what we noticed in questions 1 4. Notice that if we have x + 6x + 9 = 5, the left side is a square, that is, x + 6x + 9 = (x + 3). So, we can rewrite x + 6x + 9 = 5 as (x + 3) = 5, and then solve it just like we did the problems in question 7. (What do you get?) 5. Sometimes, though, the problem is not written quite in the right form. That s okay. We can apply what we already know about solving equations to write it in the right form, and then we can solve it. This is called completing the square. Let s say we have x + 6x = 7. The left side of this equation is not a square, but we know what to add to it. If we add 9 to both sides of the equation, we get x + 6x + 9 = 16. Now we can solve it just like the ones above. What is the solution? 6. Try these: a. x + 10x = -9 b. x + 8x = 0 c. x + x = 5 d. x + 6x 7 = 0 e. x + 8x = -6 July 015 Page 85 of 19
86 Section 5: Deriving the quadratic formula by completing the square If you can complete the square for a general quadratic equation, you will derive a formula you can use to solve any quadratic equation. Start with ax + bx + c = 0, and follow the steps you used in Section 4. July 015 Page 86 of 19
87 Standard to Vertex Form (Spotlight Task) Standards Addressed in Task MGSE9-1.A.SSE. Use the structure of an expression to rewrite it in different equivalent forms. For example, see x 4 y 4 as (x ) - (y ), thus recognizing it as a difference of squares that can be factored as (x y ) (x + y ). Write expressions in equivalent forms to solve problems MGSE9-1.A.SSE.3 Choose and produce an equivalent form of an expression to reveal and explain properties of the quantity represented by the expression. MGSE9-1.A.SSE.3a Factor any quadratic expression to reveal the zeros of the function defined by the expression. MGSE9-1.A.SSE.3b Complete the square in a quadratic expression to reveal the maximum and minimum value of the function defined by the expression. MGSE9-1.F.IF.7 Graph functions expressed algebraically and show key features of the graph both by hand and by using technology. MGSE9-1.F.IF.7a Graph linear and quadratic functions and show intercepts, maxima, and minima (as determined by the function or by context). MGSE9-1.F.IF.8 Write a function defined by an expression in different but equivalent forms to reveal and explain different properties of the function. MGSE9-1.F.IF.8a Use the process of factoring and completing the square in a quadratic function to show zeros, extreme values, and symmetry of the graph, and interpret these in terms of a context. For example, compare and contrast quadratic functions in standard, vertex, and intercept forms. Standards for Mathematical Practice 1. Make sense of problems and persevere in solving them by requiring students to interpret and make meaning of a problem and find a logical starting point, and to monitor their progress and change their approach to solving the problem, if necessary.. Reason abstractly and quantitatively by requiring students to make sense of quantities and their relationships to one another in problem situations. 3. Construct viable arguments and critique the reasoning of others by engaging students on discussion of why they agree or disagree with responses, decide whether they make sense, and ask useful questions to clarify or improve the arguments. July 015 Page 87 of 19
88 7. Look for and make use of structure by expecting students to apply rules, look for patterns and analyze structure. This task can be used on its own, or it can be used within another task, for instance, within the Protein Bar task, to replace some of the work with transformations. July 015 Page 88 of 19
89 Standard to Vertex Form Georgia Department of Education In this task you will learn to identify key features of quadratic functions by completing the square In addition to solving equations, completing the square can be helpful in identifying horizontal and vertical shifts in the graph of a function. For instance, suppose you want to graph f(x) = x + 6x + 5. We can complete the square to write it in vertex form, so we want it to look like f(x) = a(x h) + k. We complete the square to find the (x h) part, and in doing so, we also find k. Look at x + 6x. We know from our work earlier that we can add 9 to make a perfect square trinomial. But we can t just add 9 to an equation. We can add 9 and subtract 9 (because then we re just adding zero). So, we have f(x) = (x + 6x +9) When we simplify, we get f(x) = (x + 3) 4. So the graph of this function will be shifted three to the left and four down. Find the horizontal and vertical shifts by completing the square and graph each of these: 1. f(x) = x + 10x + 7 f(x) = (x + 10x + 5) f(x) = (x + 5) + Graph is shifted 5 to the left and up.. f(x) = x 6x + 1 f(x) = (x 6x + 9) f(x) = (x 3) 8 Graph is shifted 3 to the right and down 8. July 015 Page 89 of 19
90 When the leading coefficient is not 1, we have to be even more careful when changing from standard to vertex form. However, the ideas are the same. We want to create a perfect square trinomial and write the equation in vertex form. For example, say we have f(x) = 3x + 6x + 5. This time, we need to factor the leading coefficient out of the first two terms and then complete the square. So, we have f(x) = 3(x + x ) + 5. Completing the square on x + x means we need to add 1. But if we add 1 inside the parentheses, we are actually adding three (3 1), so we have to add 3 and subtract 3: f(x) = 3(x + x + 1) Simplifying, we have f(x) = 3(x + 1) +. Find the horizontal and vertical shifts as well as any stretches or shrinks by completing the square and graph each of these: 3. f(x) = x + 8x + 3 f(x) = (x + 4x) + 3 f(x) = (x + 4x + 4) f(x) = (x + ) 5 Graph is shifted to the left and down 5 and has a vertical stretch of. 4. f(x) = -3x + 1x 5 f(x) = -3(x 4x) 5 f(x) = -3(x 4x + 4) f(x) = -3(x ) + 7 Graph is shifted to the right and down 5 and has a vertical stretch of. July 015 Page 90 of 19
91 Standard to Vertex Form (Spotlight Task) Standards Addressed in Task MGSE9-1.A.SSE. Use the structure of an expression to rewrite it in different equivalent forms. For example, see x 4 y 4 as (x ) - (y ), thus recognizing it as a difference of squares that can be factored as (x y ) (x + y ). Write expressions in equivalent forms to solve problems MGSE9-1.A.SSE.3 Choose and produce an equivalent form of an expression to reveal and explain properties of the quantity represented by the expression. MGSE9-1.A.SSE.3a Factor any quadratic expression to reveal the zeros of the function defined by the expression. MGSE9-1.A.SSE.3b Complete the square in a quadratic expression to reveal the maximum and minimum value of the function defined by the expression. MGSE9-1.F.IF.7 Graph functions expressed algebraically and show key features of the graph both by hand and by using technology. MGSE9-1.F.IF.7a Graph linear and quadratic functions and show intercepts, maxima, and minima (as determined by the function or by context). MGSE9-1.F.IF.8 Write a function defined by an expression in different but equivalent forms to reveal and explain different properties of the function. MGSE9-1.F.IF.8a Use the process of factoring and completing the square in a quadratic function to show zeros, extreme values, and symmetry of the graph, and interpret these in terms of a context. For example, compare and contrast quadratic functions in standard, vertex, and intercept forms. Standards for Mathematical Practice 1. Make sense of problems and persevere in solving them by requiring students to interpret and make meaning of a problem and find a logical starting point, and to monitor their progress and change their approach to solving the problem, if necessary.. Reason abstractly and quantitatively by requiring students to make sense of quantities and their relationships to one another in problem situations. 3. Construct viable arguments and critique the reasoning of others by engaging students on discussion of why they agree or disagree with responses, decide whether they make sense, and ask useful questions to clarify or improve the arguments. 7. Look for and make use of structure by expecting students to apply rules, look for patterns and analyze structure. July 015 Page 91 of 19
92 In this task you will learn to identify key features of quadratic functions by completing the square In addition to solving equations, completing the square can be helpful in identifying horizontal and vertical shifts in the graph of a function. For instance, suppose you want to graph f(x) = x + 6x + 5. We can complete the square to write it in vertex form, so we want it to look like f(x) = a(x h) + k. We complete the square to find the (x h) part, and in doing so, we also find k. Look at x + 6x. We know from our work earlier that we can add 9 to make a perfect square trinomial. But we can t just add 9 to an equation. We can add 9 and subtract 9 (because then we re just adding zero). So, we have f(x) = (x + 6x +9) When we simplify, we get f(x) = (x + 3) 4. So the graph of this function will be shifted three to the left and four down. Find the horizontal and vertical shifts by completing the square and graph each of these: 5. f(x) = x + 10x f(x) = x 6x + 1 July 015 Page 9 of 19
93 When the leading coefficient is not 1, we have to be even more careful when changing from standard to vertex form. However, the ideas are the same. We want to create a perfect square trinomial and write the equation in vertex form. For example, say we have f(x) = 3x + 6x + 5. This time, we need to factor the leading coefficient out of the first two terms and then complete the square. So, we have f(x) = 3(x + x ) + 5. Completing the square on x + x means we need to add 1. But if we add 1 inside the parentheses, we are actually adding three (3 1), so we have to add 3 and subtract 3: f(x) = 3(x + x + 1) Simplifying, we have f(x) = 3(x + 1) +. Find the horizontal and vertical shifts by completing the square and graph each of these: 7. f(x) = x 8x f(x) = -3x + 1x 5 July 015 Page 93 of 19
94 PROTEIN BAR TOSS Georgia Department of Education Standards Addressed in this Task MGSE9-1.F.IF.4 Using tables, graphs, and verbal descriptions, interpret the key characteristics of a function which models the relationship between two quantities. Sketch a graph showing key features including: intercepts; interval where the function is increasing, decreasing, positive, or negative; relative maximums and minimums; symmetries; end behavior; and periodicity. MGSE9-1.F.IF.5 Relate the domain of a function to its graph and, where applicable, to the quantitative relationship it describes. For example, if the function h(n) gives the number of person-hours it takes to assemble n engines in a factory, then the positive integers would be an appropriate domain for the function. MGSE9-1.F.IF.7 Graph functions expressed algebraically and show key features of the graph both by hand and by using technology. MGSE9-1.F.IF.7a Graph linear and quadratic functions and show intercepts, maxima, and minima (as determined by the function or by context). MGSE9-1.F.IF.8 Write a function defined by an expression in different but equivalent forms to reveal and explain different properties of the function. MGSE9-1.F.IF.8a Use the process of factoring and completing the square in a quadratic function to show zeros, extreme values, and symmetry of the graph, and interpret these in terms of a context. For example, compare and contrast quadratic functions in standard, vertex, and intercept forms. MGSE9-1.F.IF.9 Compare properties of two functions each represented in a different way (algebraically, graphically, numerically in tables, or by verbal descriptions). For example, given a graph of one function and an algebraic expression for another, say which has the larger maximum. Standards for Mathematical Practice. Reason abstractly and quantitatively by requiring students to make sense of quantities and their relationships to one another in problem situations. 3. Construct viable arguments and critique the reasoning of others by engaging students on discussion of why they agree or disagree with responses, decide whether they make sense, and ask useful questions to clarify or improve the arguments. July 015 Page 94 of 19
95 4. Model with mathematics by expecting students to apply the mathematics concepts they know in order to solve problems arising in everyday situations, and reflect on whether the results are sensible for the given scenario. 5. Use appropriate tools strategically by expecting students to consider available tools when solving a mathematical problem. These tools might include pencil and paper, concrete models, a ruler, a protractor, a compass, a calculator, software, etc. 6. Attend to precision by requiring students to calculate efficiently and accurately; and to communicate precisely with others by using clear mathematical language to discuss their reasoning. 7. Look for and make use of structure by expecting students to apply rules, look for patterns and analyze structure. 8. Look for and express regularity in repeated reasoning by expecting students to understand broader applications and look for structure and general methods in similar situations. Common Student Misconceptions 1. Students may believe that it is reasonable to input any x-value into a function, so they will need to examine multiple situations in which there are various limitations to the domains.. Students may also believe that the slope of a linear function is merely a number used to sketch the graph of the line. In reality, slopes have real-world meaning, and the idea of a rate of change is fundamental to understanding major concepts from geometry to calculus. 3. Students may believe that each family of functions (e.g., quadratic, square root, etc.) is independent of the others, so they may not recognize commonalities among all functions and their graphs. 4. Students may also believe that skills such as factoring a trinomial or completing the square are isolated within a unit on polynomials, and that they will come to understand the usefulness of these skills in the context of examining characteristics of functions. 5. Additionally, student may believe that the process of rewriting equations into various forms is simply an algebra symbol manipulation exercise, rather than serving a purpose of allowing different features of the function to be exhibited. 6. Students may believe that a 45 degree line in the scatterplot of two numerical variables always indicates a slope of 1 which is the case only when the two variables have the same scaling. July 015 Page 95 of 19
96 Teacher Notes: Introduction: In the previous task, students learned to solve quadratic equations of the form ax + bx + c = 0, with a = 1, by factoring. In this task students dispense with the restriction that a = 1 and learn to factor more general quadratics and then apply that ability to solving more general quadratic equations. The method of factoring used is factoring by grouping. This method allows student effort to focus on finding the correct factorization and can be used successfully by students whose algebraic skill level makes it very difficult for them to be successful with factoring by trial and error. Factoring by trial and error is not discussed. The context is analysis of a situation where an object is tossed up and allowed to fall subject to gravity. In working with this context, students learn to interpret the intercepts of such functions and reinforce the concept that solving an equation of the form f(x) = 0 yields the x-intercepts of the graph of the function. This task provides a guided discovery for the following: Factoring general quadratic polynomials of the form ax + bx + c, a 0, by grouping Solving quadratic equations by factoring Factoring completely results in answers that are unique except for order of factors Interpretation of x-intercepts and y-intercept for quadratic functions that model the motion of an object tossed straight up Supplies Needed: Graphing utility Solutions for The Protein Bar Toss Learning Task Blake and Zoe were hiking in a wilderness area. They came up to a scenic view at the edge of a cliff. As they stood enjoying the view, Zoe asked Blake if he still had some protein bars left, and, if so, could she have one. Blake said, Here s one; catch! As he said this, he pulled a protein bar out of his backpack and threw it up to toss it to Zoe. But the bar slipped out of his hand sooner than he intended, and the bar went straight up in the air with his arm out over the edge of the cliff. The protein bar left Blake s hand moving straight up at a speed of 4 feet per second. If we let t represent the number of seconds since the protein bar left the Blake s hand and let h(t) denote the height of the bar, in feet above the ground at the base of the cliff, then, assuming that we can ignore the air resistance, we have the following formula expressing h(t) as a function of t, ht ( ) = 16t + 4t July 015 Page 96 of 19
97 In this formula, the coefficient on the t -term is due to the effect of gravity and the coefficient on the t-term is due to the initial speed of the protein bar caused by Blake s throw. In this task, you will explore, among many things, the source of the constant term. 1. Use technology to graph the equation y = 16t + 4t Remember that t represents time and y represents height. Find a viewing window that includes the part of this graph that corresponds to the situation with Blake and his toss of the protein bar. What viewing window did you select? Sketch the graph below. Comment(s): Students are not expected to seek the smallest viewing window since that requires finding the x- intercepts and the vertex of the graph. Students are expected to choose a window that allows them to see all of the nonnegative output values of the function. Any viewing window that includes the nonnegative function values is acceptable. Solution(s): A reasonable viewing window is: X-min: -10 X-max: 10 Y-min: -10 Y-max: 00 Here only the Y-max setting and the Y-scale have been changed from the standard viewing window. The viewing window can be smaller, but it must include the inputs for which the outputs are nonnegative. Thus, the domain must include the interval 0 t 4. The viewing window must include range values for all the possible heights of the protein 0 h t 169 must be included in the range. bar. Thus, the interval ( ). What was the height of the protein bar, measured from the ground at the base of the cliff, at the instant that it left Blake s hand? What special point on the graph is associated with this information? Comment(s): This question requires students to interpret the constant term of the quadratic as the y-intercept. Solution(s): 160 feet, above the ground at the base of the cliff The point is (0, 160), the y-intercept of the graph. July 015 Page 97 of 19
98 At what other time does the protein bar reach the height from question? Describe how you reached your answer. Comment(s): Students should see from the graph that they need to find the time, other than t = 0, when h(t) = 160. They should be able to give a reasonable estimate from reading the graph. They will need to realize that an algebraic justification requires that they solve an equation. This quadratic equation is different from those they have seen before the quadratic polynomial is not of the form x + bx + c, but they can easily factor it by factoring out the GCF. Once the quadratic polynomial is factored, students should realize that they can use the Zero Product Property as before. It is important that students work through this extension of their previous work with quadratic equations before they proceed to the further extensions introduced in this task. Solution(s): Graphical justification: The graph at the right shows that the protein bar will be at height 160 feet when t = 0 and again when t = 1.5. Algebraic justification: Solve h(t) = 160. Then, 16t + 4t = t + 4t = 0 8t( t 3) = 0 t 3 = 0 or 8t = 0 3 t = = 1.5 or t = 0 3. If Blake does not catch the falling protein bar, how long will it take for the protein bar to hit the ground below the cliff? Justify your answer graphically. Then write a quadratic equation that you would need to solve to justify the answer algebraically. Comment(s): Students must first realize that they are looking for the time when the height is 0. They can read the graph to find the answer once they have this realization. It is important that they figure this out for themselves. Writing the equation that needs to be solved starts students into the exploration of factoring more general quadratics. Solution(s): It takes 4 seconds from the time Blake tosses the protein bar for it to hit the ground, or.5 seconds after he misses it on the way down. Graphical justification: When the protein bar hits the ground, the height is 0. Thus, the answer comes from the positive t-intercept. The graph, reproduced at the right, shows that the positive t-intercept occurs when t = 4. July 015 Page 98 of 19
99 Equation for algebraic justification: ( ) h t = 0 or 16t + 4t = 0 The equation from question 4 can be solved by factoring, but it requires factoring a quadratic polynomial where the coefficient of the x -term is not 1. Our next goal is to learn about factoring this type of polynomial. We start by examining products that lead to such quadratic polynomials. 4. For each of the following, perform the indicated multiplication and use a rectangular model to show a geometric interpretation of the product as area for positive values of x. a. (x + 3)(3x + 4) b. (x + )(4x + 11) c. (x + 1)(5x + 4) Comment(s): Students need to be reminded that the product of two like binomials gives a trinomial before they start factoring, or un-multiplying, trinomials. Solution(s): x+ 3 3x+ 4 a. ( )( ) = 6x + 17x+ 1 b. ( x+ )( 4x+ 11) = 4x + 19x+ c. ( x+ 1)( 5x+ 4) = 10x + 13x+ 4 July 015 Page 99 of 19
100 5. For each of the following, perform the indicated multiplication. x 3 9x+ a. ( )( ) b. ( 3x 1)( x 4) c. ( 4x 7)( x+ 9) Comment(s): Accurate area models are complicated to draw when there are negative coefficients, but a rectangular diagram that is similar to the area models above can be used a calculation aid. This sets the stage for using a similar diagram as an aid to factoring by grouping in the factoring problems that follow. Such diagrams are shown in the factoring by grouping solutions given in later items. Solution(s): x 3 9x+ = 18x 3x 6 a. ( )( ) b. ( )( ) 3x 1 x 4 = 3x 13x+ 4 c. ( )( ) 4x 7 x+ 9 = 8x + x 63 July 015 Page 100 of 19
101 Factoring Polynomials Georgia Department of Education The method for factoring general quadratic polynomial of the form ax + bx + c, with a, b, and c all non-zero integers, is similar to the method for factoring quadratics of this form but with the value of a restricted to a = 1. The next item guides you through an example of this method. 6. Factor the quadratic polynomial 6x + 7x 0 using the following steps. b. Think of the polynomial as fitting the form ax + bx + c. What is a? What is c? What is the product ac? Comment(s): Students could learn this method of factoring without using the standard a, b, c notation for the coefficients of the quadratic polynomial, but introducing this notation here has two advantages: (1) it simplifies the statement of the steps of the factoring method and () it allows students to become accustomed to this representation of quadratic polynomials prior to working with the quadratic formula and thereby makes the formula easier to understand. Solution(s): a = 6, c = 0, and ac = 10 c. List all possible pairs of integers such that their product is equal to the number ac. It may be helpful to organize your list in a table. Make sure that your integers are chosen so that their product has the same sign, positive or negative, as the number ac from above, and make sure that you list all of the possibilities. Comment(s): As students progress through this task, they will be encouraged to use analysis of the sign of the coefficient b to limit the pairs that need to be considered. However, it is important for students to work through the first example in full detail and actually find all pairs of integers whose product is the desired value of 10. Be careful not to refer to the pair of integers as factors since the term factor is used only in conjunction with positive integers. After students work with this method for a while, they will learn to look for factors of ac whose sum is the absolute value of b when ac is positive and factors of ac whose difference is the absolute value of b when ac is negative, but this shortcut will come to each student in his or her own timeframe. In the beginning, it is best to use this explanation where there is only one process to follow find all integer pairs that give the desired product and then find the one pair with the correct sum. Solution(s): ac = 10 July 015 Page 101 of 19
102 Integer pair Integer pair Integer pair Integer pair d. What is b in the quadratic polynomial given? Add the integers from each pair listed in part b. Which pair adds to the value of b from your quadratic polynomial? We ll refer to the integers from this pair as m and n. Comment(s): Calculating all of the sums should help students begin to see some relationships among the signs on the factor pairs and sign on the sum as well as allow them to find the correct pair of integers for this factorization problem. Solution(s): b = 7 As shown below, 8 and 15 have product 10 and sum equal to 7. Integer pair, sum Integer pair, sum Integer pair, sum Integer pair, sum 1 + ( 10) ( 40) ( 4) ( 15) ( 60) ) ( 0) ( 1) e. Rewrite the polynomial replacing bx with mx + nx. [Note either m or n could be negative; the expression indicates to add the terms mx and nx including the correct sign.] Comment(s): The pair of integers found in part c is 8 and 15 so this instruction tells students to replace 7x with 8x + 15x. Letting students struggle, if necessary, to come to this understanding on their own will benefit them in the long run as they need lots of practice in interpreting general algebraic to include both positive and negative values of parameters. Solution(s): 6x + 7x 0 = 6x 8x+ 15x 0 f. Factor the polynomial from part d by grouping. Comment(s): A rectangular diagram that can help students be successful at factoring by grouping is shown to the right of the solution. The GCF of each row is given to the left of the row, July 015 Page 10 of 19
103 and the GCF of each column is given above the column. The diagram should be used to help students understand the algebraic steps on the left. It is challenging for many students to see (3x 4) as a GCF that is factored out of the expression on the second line, but such understanding is a building block of the algebraic maturity that student need to acquire as they progress in their study of algebra. Solution(s): 6x 8x+ 15x 0 = x 3x x 4 ( ) ( ) ( 3x 4)( x 5) = + g. Check your answer by performing the indicated multiplication in your factored polynomial. Did you get the original polynomial back? Comment(s): It is important to remind students to check factoring by multiplication. They need to be reminded of the meaning of their factored form answers so that they have a framework of conceptual understanding to connect the factoring procedures that they learn. Solution(s): ( 3x 4)( x+ 5) = 6x + 15x 8x 0 = 6x + 7x 0 Yes, the expanded form is the original polynomial. 7. Use the method outlined in the steps of item 8 to factor each of the following quadratic polynomials. Is it necessary to always list all of the integer pairs whose product is ac? Explain your answer. a. x + 3x 54 b. 4w 11w+ 6 c. 3t 13t 10 d. 8x + 5x 3 e. 18z + 17z+ 4 f. 6 p 49 p+ 8 Comment(s): As students work through these examples, they should come to realize that the sign of the coefficient b gives them information that allows them to eliminate half of the possible cases on the basis of the required positive or negative sign for b, as noted in the solutions below. July 015 Page 103 of 19
104 Students will also realize that they can stop listing cases as soon as they have found the one that works. Students often see the case that will work right away. This is great. However, students need to be guided to a systemic strategy for listing cases so that they have a procedure that they can use when they do not see the answer immediately. If students practice using a systematic strategy for listing possible factor pairs, they can routinely be successful with factoring trinomials. Solution(s): a. a =, c = 54, and ac = 108 since ac is negative, the integers have opposite signs. Need sum of b = 3 Integer pair Sum Integer pair Sum Integer pair Sum Since b = 3 is positive, we need consider only those cases where the integer with larger absolute value is positive. Note that when the integer with larger absolute value is negative, the sum is negative. The cases that can be eliminated are shaded in gray. ( ) ( ) ( )( ) x + x = x x+ x = x x + x = x x+ b. a = 4, c = 6, and ac = 4 since ac is positive, both integers have same sign. Need sum of b = 11. Integer pair Sum Integer pair Sum Since we need a negative sum, we do not need to consider any case of both integers positive because that gives a positive sum.. 4w 11w+ 6= 4w 3w 8w+ 6= w 4w 3 + 4w+ 3 ( ) ( ) = w 4w 3 4w 3 = 4w 3 w ( ) ( ) ( )( ) July 015 Page 104 of 19
105 c. a = 3, c = 10, and ac = 30 since ac is negative, the integers have opposite signs. Need sum of b = 13. Since the sum is negative, we need consider only those cases where the integer with larger absolute value is negative. Integer pair Sum Integer pair Sum ( ) ( ) ( )( ) t t = t t + t = t t + t = t t+ d. a = 8, c = 3, and ac = 4 Since ac is negative, the integers have opposite signs. Need sum of b = 5. Since the sum is positive, we need consider only those cases where the integer with larger absolute value is positive. Integer pair Sum Integer pair Sum ( ) ( ) = 8x x x+ 1 = x+ 1 8x 3 8x + 5x 3= 8x + 8x 3x 3= 8x x x 1 ( ) ( )( ) ( )( ) e. a = 18, c = 4, and ac = 7 Since ac is positive, both integers have same sign. Need sum of b = 17. Since the sum is positive, we need consider only those cases where both integers are positive. Integer pair Sum Integer pair Sum Integer pair Sum ( ) ( ) = z 9z z+ 4 = 9z+ 4 z+ 1 18z + 17z+ 4= 18z + 8z+ 9z+ 4= z 9z z+ 4 ( ) ( )( ) ( )( ) July 015 Page 105 of 19
106 f. a = 6, c = 8, and ac = 48 since ac is positive, both integers have same sign. Need sum of b = 49. Since the sum is negative, we need consider only those cases where both integers are negative. Integer pair Sum Integer pair Sum ( ) ( ) 6 p 49 p+ 8 = 6 p 48 p p+ 8 = 6 p p 8 + p+ 8 ( ) ( )( ) ( )( ) = 6p p p 8 = p 8 6p 1 Additional comment(s): All of the above examples show that analysis of the signs of ac and b reduces the number of cases to consider to those corresponding to different factorizations of the absolute value of ac. Once students have done a few problems and understand the process, they will know that they do not need to examine the sum of every possible pair of integers that multiply to give the integer ac and are ready for a more efficient procedure. However, there are steps that they need to think through, and without a specific format to follow, students are often reluctant to write down anything and try to do the steps for deciding how to rewrite the bx term of the polynomial mentally. The diagrams shown below provide a tool that encourages students to think through the steps in the correct order. The accompanying text boxes and arrows are used to illustrate language and location emphasis that teachers should use in demonstrating the diagram. The color versions of all diagrams have a color coding. The first step of identifying the product of the integers, ac, and the sum of the integers, b, is done in black. The second step of deciding on the signs of the two integers is done in bright blue. The last step of finding the correct factors of ac is done in red. Diagrams are shown to illustrate parts a, b, c, and e from above since these illustrate the four possible cases: ac positive, b positive (part e) ac positive, b negative (part b) ac negative, b positive (part a) July 015 Page 106 of 19

107 a. ac negative, b negative (part ) The diagram result tells us that 3x in the polynomial should be rewritten as either 9x + 1x or 1x 9x. Note that the first example includes much of the verbal explanation that should go with demonstration of how to use the diagram. Later examples give less detail. The last example illustrates reducing the diagram box to two intersecting line segments in order to simplify its use as a factoring aid. July 015 Page 107 of 19
108 b. We stopped listing factors of 4 when we found a pair that adds to 11. The diagram result tells us that 11x in the polynomial should be rewritten either as 3x 8x or as 8x 3x. July 015 Page 108 of 19

109 c. We stopped listing factors of 30 when we found a pair that differ by 13. Thinking about the sign first and deciding whether the factors add to or differ by the absolute value of b avoids the error of using 10 and 3 which add to 13. The diagram result tells us that 13x in the polynomial should be rewritten as either 15x + x or x 15x. d. The first factors of 7 that come to mind are 8 and 9, and these add to 17. The diagram result tells us that 17x in the polynomial should be rewritten as either 8x + 9x or as 9x + 8x. July 015 Page 109 of 19
( ) a.")
110 8. If a quadratic polynomial can be factored in the form ( Ax+ B)( Cx+ D), where the A, B, C, and D are all integers, the method you have been using will lead to the answer, specifically called the correct factorization. Show that each of the quadratic polynomial cannot be Ax+ B Cx+ D, where the A, B, C, and D are all integers. factored in the form ( )( ) a. 4z + z 6 Comment(s): The process that students have used in previous cases will suffice to show that they cannot find any way to assign A, B, C, and D. This is a good point for students to analyze why the procedure they have been using works by (i) multiplying to see that ( Ax + B)( Cx + D) = ACx + ( AD + BC) x + BD, (ii) observing that, in this case, the product of first and last coefficients, which we have previously denoted by ac, is equal to ABCD, (iii) observing that the middle coefficient, which we have previously denoted by b, is equal to AD + BC, and (iv) noting that (AD)(BC) = ABCD. Thus, our procedure finds the value of the product ABCD, then finds AD and BC, and then uses this information to rewrite the given trinomial as ACx + ADx + BCx + BD. This polynomial is easily factored by grouping as shown below. ACx + ADx + BCx + BD = Ax Cx + D + B Cx + D ( ) ( ) ( Cx D)( Ax B) ( Ax B)( Cx D) = + + = + + Solution(s): a. For the quadratic polynomial 4z + z 6, we need to find integers whose product is 4 and which differ by 1. All possibilities are listed in the table below. No pair of factors Ax + B Cx + D. differ by 1, so this polynomial cannot be factored in the form ( )( ) Factors Product Difference July 015 Page 110 of 19
111 9. The method required to solve the factored quadratic polynomial is the Zero Product Property. Use your factorizations from item 8 as you solve the quadratic equations below. (Note: You factored these already, just make sure each equation is set equal to zero before you begin. a. b. c. x + 3x 54 = 0 4w + 6 = 11w 3t 13t = 10 x 4x+ 3 = 3+ x d. ( ) e. 18z + 1z = 4( z 1) f. 8 13p = 6 p( 6 p) Comment(s): Students may need a quick review of solving simple quadratic equations of the form x + bx + c = 0. When presented with simple easy review examples, students should be able to recall the needed steps through class discussion. Solution(s): a. 9 x =, 6 x + 3x 54 = 0 ( x )( x ) = 0 x 9= 0 or x+ 6= 0 9 x = or x = 6 b. 3 w =, 4 4w + 6 = 11w 4w 11w+ 6 = 0 ( w )( w ) 4 3 = 0 4w 3= 0 or w = 0 3 w = or w = 4 July 015 Page 111 of 19
112 c. t =,5 3 3t 13t = 10 3t 13t 10 = 0 ( t )( t ) = 0 3t + = 0 or t 5= 0 t = 3 or t = 5 d. x = 3, 1 8 ( ) x 4x+ 3 = 3+ x 8x + 6x x 3= 0 8x + 5x 3= 0 ( x )( x ) = 0 8x 3 = 0 or x+ 1 = 0 3 x = or x = 1 8 e. 4 1 z =, 9 ( z )( z ) ( ) 18z + 1z = 4 z 1 18z + 1z = 4z 4 18z + 17z+ 4 = = 0 9z+ 4 = 0 or z+ 1 = 0 9z = 4 or z = z = or z = 9 July 015 Page 11 of 19
113 f. 1 p =,8 6 ( ) 8 13 p= 6 p 6 p 8 13 p= 36 p 6 p 6 p 49 p+ 8 = 0 ( p )( p ) = 0 6 p 1 = 0 or p 8 = 0 1 p= 6 or p= Now we return to our goal of solving the equation from item 4. Solve the quadratic equation using factorization and the Zero Product Property. Explain how the solution relates to the real-world situation of throwing a protein bar. Do both of your solutions make sense? Solution(s): Equation from item 4: h( t) = 0 or 16t + 4t = 0 Dividing both sides of the equation by the GCF of 8, we have the equivalent equation t 3t 0 = 0, thus, we need to factor the trinomial on the left side of the equation. The analysis for factoring by grouping is shown at the right with the factorization given below. t 3t 0= t 8t + 5t 0 = t t t 4 = t 4 t + 5 ( ) ( ) ( )( ) Returning to the equation, we have: t 3t 0 = 0 ( t 4)( t + 5) = 0 t 4= 0 or t + 5= 0 5 t = 4 or t = The solution shows that t = 4 is the time after the protein bar is tossed at time t = 0 when the height of the bar is 0 feet. Thus, it is 4 seconds after the bar is tossed when it hit the ground. July 015 Page 113 of 19
114 11. Suppose the cliff had been 56 feet higher. Answer the following questions for this higher cliff. a. What was the height of the protein bar, measured from the ground at the base of the cliff, at the instant that it left Blake s hand? What special point on the graph is associated with this information? Comment(s): Students will need to refer back to item 3 and remember that the protein bar was 160 feet above the base of the cliff when it left Blake s hand, this information corresponds to the y-intercept of the graph. Solution(s): The protein bar was 16 feet above the ground at the base of the cliff, 56 feet higher than for the lower cliff. This information is associated with the y-intercept of the graph. b. What is the formula for the height function in this situation? Comment(s): This question requires that students recall the initial information about the coefficients and conclude that the coefficients on the t and t terms would be the same if the only change in the situation is the height of the cliff. Solution(s): ht ( ) = 16t + 4t + 16 c. If Blake wants to reach out and catch the protein bar on its way down, how many seconds does he have to process what has happened and position himself to catch it? Justify your answer algebraically. Comment(s): This part, and the corresponding part of item 15, emphasize that shifting the graph up or down does not change the value of t that gives the same value of h(t) the y-intercept value. Solution(s): Blake has one and a half seconds to get ready to catch the protein bar on the way down. Algebraic justification: Solve h(t) = 16. Then, 16t + 4t + 16 = 16 16t + 4t = 0 July 015 Page 114 of 19

115 ( t ) 8t 3 = 0 t 3 = 0 or 8t = 0 3 t = = 1.5 or t = 0 d. If Blake does not catch the falling protein bar, how long it take for the protein bar to hit the ground below the cliff? Justify your answer algebraically. Comment(s): This question and the corresponding one in part d of item 15 parallel the question first asked in item 5 when students did not yet know how to solve the equation algebraically. These allow the students to go directly to working the problem algebraically. Solution(s): h( t) = 0 or 16t + 4t + 16 = 0 Dividing both sides of the equation by the GCF of 8, we have the equivalent equation t 3t 7 = 0, thus, we need to factor the trinomial on the left side of the equation. The analysis for factoring by grouping is shown at the right with the factorization given below. t 3t 7= t 9t + 6t 7 = + = + t( t 9) 3( t 9) ( t 9)( t 3) Returning to the equation, we have: t 3t 7 = 0 ( t )( t ) = 0 t 9= 0 or t + 3= 0 9 t = or t = 3 July 015 Page 115 of 19

116 9 The solution shows that t = = 4.5 is the time after the protein bar is tossed at time t = 0 when the height of the bar is 0 feet. Thus, it is 4.5 seconds after the bar is tossed when it hit the ground. 1. Suppose the cliff had been 88 feet lower. Answer the following questions for this lower cliff. a. What was the height of the protein bar, measured from the ground at the base of the cliff, at the instant that it left Blake s hand? What special point on the graph is associated with this information? Solution(s): The protein bar was 7 feet above the ground at the base of the cliff, 88 feet lower than for the original cliff. This information is associated with the y-intercept of the graph. b. What is the formula for the height function in this situation? Solution(s): ht ( ) = 16t + 4t + 7 c. If Blake does not catch the falling protein bar, how long it take for the protein bar to hit the ground below the cliff? Justify your answer algebraically. Solution(s): h( t) = 0 or 16t + 4t + 7 = 0 Dividing both sides of the equation by the GCF of 8, we have the equivalent equation t 3t 9= 0, thus, we need to factor the trinomial on the left side of the equation. The analysis for factoring by grouping is shown at the right with the factorization given below. t 3t 9= t 6t + 3t 9 = + t( t 3) 3( t 3) ( t 3)( t 3) = + Returning to the equation, we have: t 3t 9= 0 ( t 3)( t + 3) = 0 t 3= 0 or t + 3= 0 3 t = 3 or t = The solution shows that t = 3 is the time after the protein bar is tossed at July 015 Page 116 of 19
117 time t = 0 when the height of the bar is 0 feet. Thus, it is 3 seconds after the bar is tossed when it hit the ground. July 015 Page 117 of 19
118 PROTEIN BAR TOSS Blake and Zoe were hiking in a wilderness area. They came up to a scenic view at the edge of a cliff. As they stood enjoying the view, Zoe asked Blake if he still had some protein bars left, and, if so, could she have one. Blake said, Here s one; catch! As he said this, he pulled a protein bar out of his backpack and threw it up to toss it to Zoe. But the bar slipped out of his hand sooner than he intended, and the bar went straight up in the air with his arm out over the edge of the cliff. The protein bar left Blake s hand moving straight up at a speed of 4 feet per second. If we let t represent the number of seconds since the protein bar left the Blake s hand and let h(t) denote the height of the bar, in feet above the ground at the base of the cliff, then, assuming that we can ignore the air resistance, we have the following formula expressing h(t) as a function of t, ht ( ) = 16t + 4t Use technology to graph the equation y = 16t + 4t Remember t represents time and y represents height. Find a viewing window that includes the part of this graph that corresponds to the situation with Blake and his toss of the protein bar. What viewing window did you select? Sketch the graph below.. What was the height of the protein bar, measured from the ground at the base of the cliff, at the instant that it left Blake s hand? What special point on the graph is associated with this information? 3. At what other time does the protein bar reach the height from question? Describe how you reached your answer. 4. If Blake does not catch the falling protein bar, how long will it take for the protein bar to hit the base of the cliff? Justify your answer graphically. Then write a quadratic equation that you would need July 015 Page 118 of 19
119 to solve to justify the answer algebraically (Note: you do not need to solve this equation at this point). The equation from item 5 can be solved by factoring, but it requires factoring a quadratic polynomial where the leading coefficient is not 1. Our next goal is to learn about factoring this type of polynomial. We start by examining products that lead to such quadratic polynomials. 5. For each of the following, perform the indicated multiplication and use a rectangular model to show a geometric interpretation of the product as area for positive values of x. x 3 3x 4 x+ 4x+ 11 x + 1 5x+ 4 a. ( + )( + ) b. ( )( ) c. ( )( ) 6. For each of the following, perform the indicated multiplication (Note: you do not need to use the rectangular model). x 3 9x 3x 1 x 4 4 x 7 x+ 9 a. ( )( + ) b. ( )( ) c. ( )( ) July 015 Page 119 of 19
120 Factoring Polynomials Georgia Department of Education The method for factoring general quadratic polynomial of the form ax + bx + c, with a, b, and c all non-zero integers, is similar to the method previously learned for factoring quadratics of this form but with the value of a restricted to a = 1. The next item guides you through an example of this method. 7. Factor the quadratic polynomial 6x + 7x 0 using the following steps. a. Think of the polynomial as fitting the form ax + bx + c. What is a? What is c? What is the product ac? b. List all possible pairs of integers such that their product is equal to the number ac. It may be helpful to organize your list in a table. Make sure that your integers are chosen so that their product has the same sign, positive or negative, as the number ac from above, and make sure that you list all of the possibilities. Integer pair Integer pair Integer pair Integer pair c. What is b in the quadratic polynomial given? Add the integers from each pair listed in part b. Which pair adds to the value of b from your quadratic polynomial? We ll refer to the integers from this pair as m and n. d. Rewrite the polynomial replacing bx with mx + nx. [Note either m or n could be negative; the expression indicates to add the terms mx and nx including the correct sign.] e. Factor the polynomial from part d by grouping. July 015 Page 10 of 19
121 f. Check your answer by performing the indicated multiplication in your factored polynomial. Did you get the original polynomial back? 8. Use the method outlined in the steps of item 8 to factor each of the following quadratic polynomials. Is it necessary to always list all of the integer pairs whose product is ac? Explain your answer. a. b. c. x + 3x 54 4w 11w+ 6 3t 13t 10 d. e. 8x + 5x 3 18z + 17z+ 4 f. 6 p 49 p+ 8 July 015 Page 11 of 19
( Cx+ D), where the A, B, C, and D are all integers. Factor the following: 4z + z 6 10.")
122 9. If a quadratic polynomial can be factored in the form ( Ax+ B)( Cx+ D), where the A, B, C, and D are all integers, the method you have been using will lead to the answer, specifically called the correct factorization. Show that the following quadratic polynomial cannot be factored in the form ( Ax+ B)( Cx+ D), where the A, B, C, and D are all integers. Factor the following: 4z + z The method required to solve the factored quadratic polynomial is the Zero Product Property. Use your factorizations from item 8 as you solve the quadratic equations below (Note: You factored these already, just make sure each equation is set equal to zero before you begin). a. x + 3x 54 = 0 b. c. 4w + 6 = 11w 3t 13t = 10 d. ( ) x 4x+ 3 = 3+ x e. 18z + 1z = 4( z 1) f. 8 13p = 6 p( 6 p) July 015 Page 1 of 19
123 11. Now we return to our goal of solving the equation from item 4. Solve the quadratic equation using factorization and the Zero Product Property. Explain how the solution relates to the real-world situation of throwing a protein bar. Do both of your solutions make sense? 1. Suppose the cliff had been 56 feet higher. Answer the following questions for this higher cliff. a. What was the height of the protein bar, measured from the ground at the base of the cliff, at the instant that it left Blake s hand? What special point on the graph is associated with this information? b. What is the formula for the height function in this situation? c. If Blake wants to catch the falling protein bar, how long does he have until it hits the ground below the cliff? Justify your answer algebraically. d. If Blake does not catch the falling protein bar, how long it take for the protein bar to hit the ground below the cliff? Justify your answer algebraically. 13. Suppose the cliff had been 88 feet lower. Answer the following questions for this lower cliff. a. What was the height of the protein bar, measured from the ground at the base of the cliff, at the instant that it left Blake s hand? What special point on the graph is associated with this information? b. What is the formula for the height function in this situation? c. If Blake does not catch the falling protein bar, how long it take for the protein bar to hit the ground below the cliff? Justify your answer algebraically. July 015 Page 13 of 19
124 PROTEIN BAR TOSS, (Part ) Standards Addressed in this Task MGSE9-1.A.CED.4 Rearrange formulas to highlight a quantity of interest using the same reasoning as in solving equations. Examples: Rearrange Ohm s law V = IR to highlight resistance R; Rearrange area of a circle formula A = π r to highlight the radius r. MGSE9-1.F.IF.4 Using tables, graphs, and verbal descriptions, interpret the key characteristics of a function which models the relationship between two quantities. Sketch a graph showing key features including: intercepts; interval where the function is increasing, decreasing, positive, or negative; relative maximums and minimums; symmetries; end behavior; and periodicity. MGSE9-1.F.IF.7 Graph functions expressed algebraically and show key features of the graph both by hand and by using technology. MGSE9-1.F.IF.7a Graph linear and quadratic functions and show intercepts, maxima, and minima (as determined by the function or by context). MGSE9-1.F.IF.8 Write a function defined by an expression in different but equivalent forms to reveal and explain different properties of the function. MGSE9-1.F.IF.8a Use the process of factoring and completing the square in a quadratic function to show zeros, extreme values, and symmetry of the graph, and interpret these in terms of a context. For example, compare and contrast quadratic functions in standard, vertex, and intercept forms. MGSE9-1.F.BF.1a Determine an explicit expression and the recursive process (steps for calculation) from context. For example, if Jimmy starts out with $15 and earns $ a day, the explicit expression x+15 can be described recursively (either in writing or verbally) as to find out how much money Jimmy will have tomorrow, you add $ to his total today. J = J 1+, J0 = 15 n n MGSE9-1.F.BF.3 Identify the effect on the graph of replacing f(x) by f(x) + k, k f(x), f(kx), and f(x + k) for specific values of k (both positive and negative); find the value of k given the graphs. Experiment with cases and illustrate an explanation of the effects on the graph using technology. Include recognizing even and odd functions from their graphs and algebraic expressions for them. Standards for Mathematical Practice. Reason abstractly and quantitatively by requiring students to make sense of quantities and their relationships to one another in problem situations. July 015 Page 14 of 19
125 4. Model with mathematics by expecting students to apply the mathematics concepts they know in order to solve problems arising in everyday situations, and reflect on whether the results are sensible for the given scenario. 5. Use appropriate tools strategically by expecting students to consider available tools when solving a mathematical problem. These tools might include pencil and paper, concrete models, a ruler, a protractor, a compass, a calculator, software, etc. 6. Attend to precision by requiring students to calculate efficiently and accurately; and to communicate precisely with others by using clear mathematical language to discuss their reasoning. 7. Look for and make use of structure by expecting students to apply rules, look for patterns and analyze structure. 8. Look for and express regularity in repeated reasoning by expecting students to understand broader applications and look for structure and general methods in similar situations. Common Student Misconceptions 1. Students may believe that equations of linear, quadratic and other functions are abstract and exist on in a math book, without seeing the usefulness of these functions as modeling realworld phenomena.. Additionally, they believe that the labels and scales on a graph are not important and can be assumed by a reader and that it is always necessary to use the entire graph of a function when solving a problem that uses that function as its model. 3. Students may interchange slope and y-intercept when creating equation. For example, a taxi cab cost $4 for a dropped flag and charges $ per mile. Students may fail to see that $ is a rate of change and is slope while the $4 is the starting cost and incorrectly write the equation as y=4x+ instead of y=x Given a graph of a line, students use the x-intercept for b instead of the y-intercept. 5. Given a graph, students incorrectly compute slope as run over rise rather than rise over run. For example, they will compute slope with the change in x over the change in y. 6. Students do not know when to include the or equal to bar when translating the graph of an inequality. July 015 Page 15 of 19
126 7. Students do not correctly identify whether a situation should be represented by a linear, quadratic, or exponential function. 8. Students often do not understand what the variables represent. For example, if the height h in feel of a piece of lava t seconds after it is ejected from a volcano is given by h(t) = -16t +64t+936 and the student is asked to find the time it takes for the piece of lava to hit the ground, the student will have difficulties understanding that h=0 at the ground and that they need to solve for t. 9. Students may believe that it is reasonable to input any x-value into a function, so they will need to examine multiple situations in which there are various limitations to the domains. 10. Students may also believe that the slope of a linear function is merely a number used to sketch the graph of the line. In reality, slopes have real-world meaning, and the idea of a rate of change is fundamental to understanding major concepts from geometry to calculus. 11. Students may believe that each family of functions (e.g., quadratic, square root, etc.) is independent of the others, so they may not recognize commonalities among all functions and their graphs. 1. Students may also believe that skills such as factoring a trinomial or completing the square are isolated within a unit on polynomials, and that they will come to understand the usefulness of these skills in the context of examining characteristics of functions. 13. Additionally, student may believe that the process of rewriting equations into various forms is simply an algebra symbol manipulation exercise, rather than serving a purpose of allowing different features of the function to be exhibited. 14. Students may believe that the best (or only) way to generalize a table of data is by using a recursive formula. 15. Students naturally tend to look down a table to find the pattern but need to realize that finding the 100 th term requires knowing the 99 th term unless an explicit formula is developed. 16. Students may also believe that arithmetic and geometric sequences are the same. Students need experiences with both types of sequences to be able to recognize the difference and more readily develop formulas to describe them. July 015 Page 16 of 19
127 17. Students may believe that the graph of y=(x-4) 3 is the graph of y=x 3 shifted 4 units to the left (due to the subtraction symbol). Examples should be explored by hand and on a graphing calculator to overcome this misconception. 18. Students often confuse the shift of a function with the stretch of a function. 19. Students may also believe that even and odd functions refer to the exponent of the variable, rather than the sketch of the graph and the behavior of the function. 0. Additionally, students may believe that all functions have inverses and need to see counter examples, as well as examples in which a non-invertible function can be made into an invertible function by restricting the domain. For example, f(x) =x has an inverse (f -1 (x) = xprovided that the domain is restricted tox 0. Teacher Notes This task provides a guided discovery for the following: The vertex of the graph of the quadratic function f ( x) = ax + bx + c is the point For b h = and a f ( x) = ax + bx + c. b b, f a a. b k = f a f x = a x h + kis the same function as, ( ) ( ) The graph of the function f ( x) = a( x h) + kis obtained by applying the following transformations to the graph of f ( x) = x : (i) shift horizontally by h units (to the right when h > 0, to the left when h <0) (ii) if a < 0, reflect through the x-axis, (iii) perform a vertical stretch ( a > 1) or shrink ( a < 1) of f ( x) = x by a factor of a, (iv) shift vertically by k units (up when k > 0, down when k <0) Supplies Needed: Graphing utility Graph paper In the first part of the learning task about Blake attempting to toss a protein bar to Zoe, you found how long it took for the bar to go up and come back down to the starting height. However, July 015 Page 17 of 19
128 there is a question we did not consider: How high above its starting point did the protein bar go before it started falling back down? We re going to explore that question now. 1. So far in Unit 5, you have examined the graphs of many different quadratic functions. Consider the functions you graphed in the first part of the Protein Bar Toss. Each of these functions has a formula that is, or can be put in, the form y = ax + bx + c with a 0. When we consider such formulas with domain all real numbers, there are some similarities in the shapes of the graphs. The shape of each graph is called a parabola. List at least three characteristics common to the parabolas seen in these graphs. Comment(s): In this task, students learn that every quadratic function has a graph that is obtained by a vertical and/or horizontal translation of a graph of a function of the form y= ax and, thus, has the parabolic shape common to these graphs. This question focuses them on commonalities in the shapes of the graphs of the quadratic functions they have seen and prepares them for the focus of the task. Teachers should encourage students to look back at a large variety of graphs. Solution(s): Students should list, in their own words, three commonalities similar to items listed below. The graphs all have a V shape but rounded at the base, or a vertical flip of this shape. Each graph has a highest (maximum) or lowest (minimum) point. Each graph has line symmetry with respect to a vertical line through the maximum, or minimum, point. Both ends of the graph go up forever, or both ends go down forever. Each graph has a variable rate of change. For x-values far from the maximum or minimum point, the shape of the graph looks almost linear.. The question of how high the protein bar goes before it starts to come back down is related to a special point on the graph of the function. This point is called the vertex of the parabola. What is special about this point? Comment(s): The question is somewhat vague, but students should have identified a maximum, or minimum, point as one of the important characteristics of the graph of a quadratic function and recognize the question is about this point. Solution(s): The point is the highest point on the graph. Alternate wording: The function has its greatest value at this point. July 015 Page 18 of 19
 = 16 t + 4 t + 160. a. Let h () t denote the height of the protein bar if it is thrown from a cliff that is 56 feet higher.")
129 3. In the first part of the protein bar task you considered three different functions, each one corresponding to a different cliff height. Let s rename the first of these functions as h 1, so that h 1 ( t ) = 16 t + 4 t a. Let h () t denote the height of the protein bar if it is thrown from a cliff that is 56 feet higher. Write the formula for the function h. Comment(s): This function is not provided for students so that they cannot look ahead and copy it when working on Part 1 of this task. Solution(s): h ( t ) = 16 t + 4 t + 16 b. Let h3 () t denote the height of the protein bar if it is thrown from a cliff that is 88 feet lower. Write the formula for the function h 3. Comment(s): This function is not provided for students so that they cannot look ahead and copy it when working on Part 1 of this task. Solution(s): h ( t ) = 16 t + 4 t c. Use technology to graph all three functions, h 1, h, and h 3, on the same axes. Comment(s): In working with the function h 1 in the earlier part of the task, students used a graphing utility to graph the function in a viewing window that includes the appropriate domain. That is all that is necessary here. Students will learn to graph functions so that the graph shows the restricted domain in a later unit when they study piecewise functions. Solution(s): The graphs are shown on the axes at the right. d. Estimate the coordinates of the vertex for each graph. Comment(s): The graph shown for part c uses a stretched scale on the t-axis and includes grid lines to assist in estimating the vertex. Students may use trace, zoom, or other methods to estimate each vertex. With gridlines, it appears that the vertex occurs halfway between July 015 Page 19 of 19
: vertex for h 1: (0.")
130 t = 0.5 and t = 1, yielding the exact correct answer of t = 3 4. Whether their answers are estimates or exact, students should see from the graph that the vertex for all three functions occurs at the same t-value. Solution(s): vertex for h 1: (0.75, 169) vertex for h (0.75, 5) vertex for h 3 (0.75, 81) e. What number do the coordinates have in common? What is the meaning of this number in relation to the toss of the protein bar? Comment(s): If students did not give the same t-coordinate in answer to part d, this question will tell them that they should have, since the y-coordinates are clearly different. Determining the meaning of the number will require a little more thought. Solution(s): The t-coordinate is the same for all three points. This value, 0.75, means that it took three-quarters of a second for the protein bar to reach its highest point before starting to fall back down. f. The other coordinate is different for each vertex. Explain the meaning of this number for each of the vertices. Comment(s): Once students determine that the t-coordinate of the vertex is the time when the protein bar is at its highest point, it should be straightforward to determine the answer for this part. Solution(s): For each vertex, the y-coordinate gives the height (in feet) of the protein bar when it is at its highest point above the ground. 4. Consider the formulas for h 1, h, and h 3. a. How are the formulas different? Comment(s): The questions in item 3 focused students on the vertex position and meaning of the vertices for the three functions. This part guides them to focus on the fact that the graphs of h and h 3 are vertical shifts of the graph of h 1. Solution(s): The formulas differ in the last term, or constant term. July 015 Page 130 of 19
131 b. Based on your answer to part a, how are the three graphs related? Do you see this relationship in your graphs of the three functions on the same axes? (If not, restrict the domain in the viewing window so that you see the part of each graph you see corresponds to the same set of t-values.) Comment(s): Based on their work with vertical shifts of lines and of the absolute value function, students often expect vertical shifts to look parallel. However, as shown in the graph above, seeing a larger part of one graph than another makes it hard for students to see that comparable sections are parallel. Seeing this is important for visual learners who need to see the graphs of h and h 3 as vertical shifts of the graph of h 1. Solution(s): The graph of h is a vertical shift of the graph of h1 by 56 units upward. The graph of h3 is a vertical shift of the graph of h1 by 88 units downward. This is shown clearly in the graphs at the right, which are restricted to 0 t 3. Estimating the vertex from the graph gives us an approximate answer to our original question, but an algebraic method for finding the vertex would give us an exact answer. 5. For each of the quadratic functions below, find the y-intercept of the graph and all other points with this value for the y-coordinate. a. f ( x) = x 4x+ 9 b. ( ) f x = 4x + 8x 5 c. ( ) f x = x 6x+ 7 d. ( ) f x = ax + bx + c, a 0 Comment(s): This and the next few items lead students to see that the x-value of the vertex is half-way between 0 and the x-value where the quadratic function has the same value as the y- intercept value. The first step is finding this x-value. See the solutions below to follow this development. Solution(s): a. For the function f ( x) = x 4x+ 9, ( 0) 0 40 ( ) 9 9 For points with y-coordinate equal to 9, f ( x ) = 9. f = + = Thus, the y-intercept is 9. July 015 Page 131 of 19
132 Equivalently, x Georgia Department of Education 4x+ 9= 9 x 4x = 0 ( ) x x 4 = 0 x = 0 or x = 4 Thus, there are two points: the y-intercept, (0, 9), and the point (4, 9) f x = 4x + 8x 5, b. For the function ( ) ( ) ( ) f 0 = = 5 Thus, the y-intercept is 5. For points with y-coordinate equal to 5, f ( x ) = 5. Equivalently, 4x + 8x 5= 5 4x + 8x = 0 ( ) 4x x+ = 0 x = 0 or x = Thus, there are two points: the y-intercept, (0, 5), and the point (, 5). c. For the function ( ) ( ) ( ) f x = x 6x+ 7, f 0 = = 7 Thus, the y-intercept is 7. For points with y-coordinate equal to 7, f ( x ) = 7. Equivalently, x 6x+ 7= 7 x 6x = 0 ( ) x x+ 6 = 0 x = 0 or x = 6 Thus, there are two points: the y-intercept, (0, 7), and the point ( 6, 7). d. For the function ( ) f x = ax + bx + c, a 0, f ( 0) a 0 b( 0) c c For points with y-coordinate equal to c, f ( x) = c. = + + = Thus, the y-intercept is c. July 015 Page 13 of 19
133 Equivalently, Georgia Department of Education ax + bx + c = c ax + bx = 0 ( b) x ax + = 0 x = 0 or ax + b = 0 ax = b b x = a b Thus, there are two points: the y-intercept, (0, c), and the point, c a. 6. One of the characteristics of a parabola graph is that the graph has a line symmetry. a. For each of the parabolas considered in item 5, use what you know about the graphs of quadratic functions in general with the specific information you have about these particular functions to find an equation for the line of symmetry. Comment(s): Examination of the graphs will show that the line of symmetry is vertical and half-way between the two x-values from item 6. Solution(s): a. x = b. x = 1 c. x = 3 d. x = b a b. The line of symmetry for a parabola is called the axis of symmetry. Explain the relationship between the axis of symmetry and the vertex of a parabola. Comment(s): This question guides students to realize that the axis of symmetry gives them the x- coordinate of the axis of symmetry. Solution(s): The vertex lies on the axis of symmetry. Since the axis of symmetry is a vertical line, the equation for the axis of symmetry gives us the x-coordinate for the vertex. So, the b x-coordinates of the vertices are: a. b. 1 c. 3 d. a c. Find the y-coordinate of the vertex for the quadratic functions in item 6, parts a, b, and c, and then state the vertex as a point. Comment(s): Students must realize that they can find the y-coordinate of a point on the graph of the function by using the x-coordinate as an input value to the function. July 015 Page 133 of 19
134 Solution(s): a. y-coordinate is 5 since f ( ) = 4 + 9= = 5 vertex: (, 5) b. y-coordinate is 9 since f ( 1) = 4( 1) + 8 ( 1) 5= 4 8 5= 9 vertex: ( 1, 9) c. y-coordinate is 16 since ( ) ( ) ( ) vertex: ( 3, 16) f 3 = = = 16 d. Describe a method for finding the vertex of the graph of any quadratic function given in the form f ( x) = ax + bx + c, a 0. Comment(s): Students have found a general formula for the x-coordinate of the vertex in part b and developed a procedure for using the x-coordinate to find the y-coordinate. They need to combine these ideas into general statements as given in the solutions below. Solution(s): Simplify the formula for the function, if necessary, to put it in the form f ( x) = ax + bx+ c. b Find the x-coordinate of the vertex using the formula, x =. a Find the y-coordinate of the vertex by substituting the x-coordinate in the function, b f a. b b The vertex is, f a a. 7. Return to height functions h 1, h, and h 3. a. Use the method you described in item 6, part d, to find the exact coordinates of the vertex of each graph. Comment(s): This part gives students an opportunity to practice the method described in item 7, part d, but also strongly reinforces the algebraic result, previously seen geometrically, that the vertex depends only on the a and b coefficients from the formula for the function. Solution(s): For all three functions, a = 16, b = + 4, thus, x = = = ( ) July 015 Page 134 of 19
135 h = + + = + + = + = The vertex for h1 is, h = + + = + + = + = The vertex for h is, 5 4. a = 16, b = + 4, thus, x = = = ( ) h = + + = + + = + = The vertex for h 3 is, 7 4. b. Find the exact answer to the question: How high above its starting point did the protein bar go before it started falling back down? Comment(s): Many students may have given the same answers here in estimating the vertex from the graph. This questions emphasizes that they were estimating when they read from the graph and now have a method for getting the exact value. The question is phrased to remind students that the answer is the same no matter the height of the cliff. Solution(s): For the original situation, the maximum height is 169 feet and the bar starts at height 160 feet, so the bar goes 9 feet above its starting point. The answer is the same for the other cliff heights. 8. Each part below gives a list of functions. Describe the geometric transformation of the graph of first function that results in the graph of the second, and then describe the transformation of the graph of the second that gives the graph of the third, and, where applicable, describe the transformation of the graph of the third that yields the graph of the last function in the list. a. f ( x) = x, f ( x) = x + 5, f ( x) = ( x ) + 5 July 015 Page 135 of 19
136 b. ( ) ( ) ( ) ( ) ( ) f x = x, f x = 4 x, f x = 4x 9, f x = 4 x+ 1 9, c. ( ) ( ) ( ) ( ) ( ) f x = x, f x = x, f x = x + 16, f x = x Comment(s): This part is the first in a series of steps that guide students to an understanding of the vertex form of a quadratic function. It is very important for building student understanding and requires that students expand the last formulas correctly. When they expand the formula, it is not necessary that they remember the special product for the square of a binomial as long as they remember that the square of a binomial requires multiplying the binomial by itself. The solution to part a demonstrates this approach; the solutions for parts b and c use the square of a binomial formula. Solution(s): a. Shift the first graph up 5 units to get the second graph; shift the second graph to the right units to get the last graph. f ( x) = ( x ) + 5= ( x )( x ) + 5= x x x+ 4+ 5= x 4x+ 9 This is the same function as the one in item 6, part a. This function has vertex (,5) because the point (0, 0) from the graph of f ( x) = x has been shifted to this point. In 6a, we found that the vertex is (,5). b. Transform the first graph using a vertical stretch by a factor of 4 to get the second graph; shift the second graph down 9 units to get the third graph; shift the third graph to the left 1 unit to get the last graph. f x = 4 x+ 1 9= 4 x + x+ 1 9= 4x + 8x+ 4 9= 4x + 8x 5 ( ) ( ) ( ) This is the same function as the one in item 6, part b. This function has vertex ( 1, 9) because the point (0, 0) from the graph of f ( x) = x has been shifted to this point. In 7c, we found that the vertex is ( 1, 9). c. Reflect the first graph through the x-axis to get the second graph; shift the second graph up 16 units to get the third graph; shift the third graph to the left 3 unit to get the last graph. f x = x + 5= x x + 5= x x x+ 4+ 5= x 4x+ 9 ( ) ( ) ( )( ) This is the same function as the one in item 6, part c. This function has vertex because the point (0, 0) from the graph of f ( x) = x has been shifted to this ( 3, 16) point. In 7c, we found that the vertex is ( 3, 16). July 015 Page 136 of 19
137 9. Expand each of the following formulas from the vertex form f ( x) = a( x h) + kto the standard form ( ) f x ax bx c = + +. a. f(x)=(x - ) +5 b. f(x)=4(x + 1) 9 c. f(x)= - (x + 3) + 16 d. Compare these expanded formulas to #5. How are they related? e. Compare the vertices in the original and expanded form. What special property do you notice? 10. For any quadratic function of the form f ( x) = a( x h) + k. a. What do the h and k in the formula represent relative to the function? Solution(s): h is the x-coordinate of the vertex of the graph, and k is y-coordinate of the vertex. b. Is there an alternative way to find (h,k) without finding tow symmetrical points, finding the midpoint, and then finding the corresponding y value to the midpoint? 11. Use the vertex form of the equations for the functions h 1, h, and h 3 you found in #7 to verify algebraically the equivalence with the original formulas for the functions. Comment(s): Students should figure out that the form of the equation from item 10 is the vertex form. Solution(s): vertex forms: ( ) 3 h1 x = 16 x h ( x) = 16 x h3 ( x) = 16 x July 015 Page 137 of 19
138 verification: ( ) Georgia Department of Education h1 x = 16 x = x x = 16x + 3 x = 16x + 4x h ( x) = 16 x = x x = 16x + 3 x = 16x + 4x h3 ( x) = 16 x = x x = 16x + 3 x = 16x + 4x For the functions given below, put the formula in the vertex form f ( x) = a( x h) + k, give the equation of the axis of symmetry, and describe how to transform the graph of y = x to create the graph of the given function. a. ( ) f x = 3x + 1x+ 13 b. ( ) f x = x 7x+ 10 c. ( ) f x = x + 1x 4 Comment(s): This item gives students additional practice in finding the vertex of a parabola and using the vertex to write the vertex form of the equation. In addition, it starts a series of questions guiding students to use the information from the standard and vertex forms of the formula for the function to draw accurate sketches of the function by plotting very few points. Solution(s): 1 a. x = =, f ( ) = 3( ) + 1( ) + 13 = = 1 3 ( ) vertex form: ( ) ( ) f x = 3 x+ + 1 axis of symmetry: x = July 015 Page 138 of 19
139 graph transformation: left units, then vertical stretch of y = x by a factor of 3, and shift up 1 unit b. ( ) ( ) x = =, f( ) = ( ) 7( ) + 10, f 10 1 = + = = vertex form: ( ) 7 9 f x = x 4 axis of symmetry: x = 7 graph transformation: shift y = x right = unit sand down by 9 =.5 4 units c. 1 = = 3, 3 = = = 6 x f ( ) ( ) ( ) ( ) vertex form: ( ) ( ) f x = x 3 6 axis of symmetry: x = 3 graph transformation: right 3 units, vertical stretch of y = x by a factor of and reflection through the x-axis, then shift down 6 units. 13. Make a hand-drawn sketch of the graphs of the functions in item 1. Make a dashed line for the axis of symmetry, and plot the vertex, y-intercept and the point symmetric with the y- intercept. Comment(s): Students will need to plot the y-intercept and draw in the line of symmetry to find the point symmetric to the y-axis. July 015 Page 139 of 19


140 Solution(s): a. b. Georgia Department of Education c. July 015 Page 140 of 19

141 14. Which of the graphs that you drew in item 14 have x-intercepts? Comment(s): This item makes sure that students realize that some quadratic graphs do not have x-intercepts. Once they have learned the quadratic formula, students will learn that no x-intercepts correspond to no real roots for the function. However, the focus is having students realize that the sign of the coefficient a indicates whether the graph opens up or down and that this information in conjunction with the location of the vertex indicates whether the graph has x-intercepts or not. Solution(s): The graph in part b is the only one that has x- intercepts. a. Find the x-intercepts that do exist by solving an appropriate equation and then add the corresponding points to your sketch(es) from item 14. Solution(s): x 7x+ 10 = 0 ( x )( x 5) = 0 x = or x = 5 b. Explain geometrically why some of the graphs have x-intercepts and some do not. Solution(s): If the vertex is on or below the x-axis and the parabola opens up, or the vertex is on or above the x-axis and the parabola opens up, then the graph intersects the x-axis. If the vertex is above the x-axis and the parabola opens up, or the vertex is below the x- axis and the parabola opens down, the graph does not cross the x-axis and there are no x-intercepts. c. Explain how to use the vertex form of a quadratic function to decide whether the graph of the function will or will not have x-intercepts. Explain your reasoning. Solution(s): The coefficient a tells how the parabola opens. If a > 0, then the parabola opens up. If a < 0, then the parabola opens down. The vertex of a quadratic function is the point (h, k). So, with this information, we decide whether the graph does or does not cross the x-axis and whether or not the function has x-intercepts. When a > 0, the graph is a vertical stretch or shrink of the graph of y = x and so the graph opens the same way as the graph of y = x. July 015 Page 141 of 19
142 When a < 0, the graph is a vertical stretch or shrink of the graph of y = x followed by a reflection through the x-axis and so the graph opens in the opposite direction as the graph of y = x. The graph of the function with formula f ( x) = a( x h) + k is obtained by shifting the graph of y = x by h units in the horizontal direction and k units in the vertical direction so the point (0, 0), the vertex of the graph of y = x, is shifted to the point (h, k), and this is the location of the vertex of the graph of f ( x) = a( x h) + k. July 015 Page 14 of 19
143 The Protein Bar Toss, Part In the first part of the learning task about Blake attempting to toss a protein bar to Zoe, you found how long it took for the bar to go up and come back down to the starting height. However, there is a question we did not consider: How high above its starting point did the protein bar go before it started falling back down? We re going to explore that question now. 1. So far in Unit 5, you have examined the graphs of many different quadratic functions. Consider the functions you graphed in the first part of the Protein Bar Toss. Each of these functions has a formula that is, or can be put in, the form y = ax + bx + c with a 0. When we consider such formulas with domain all real numbers, there are some similarities in the shapes of the graphs. The shape of each graph is called a parabola. List at least three characteristics common to the parabolas seen in these graphs.. The question of how high the protein bar goes before it starts to come back down is related to a special point on the graph of the function. This point is called the vertex of the parabola. What is special about this point? 3. In the first part of the protein bar task you considered three different functions, each one corresponding to a different cliff height. Let s rename the first of these functions as h 1, so that h 1 ( t ) = 16 t + 4 t a. Let h () t denote the height of the protein bar if it is thrown from a cliff that is 56 feet higher. Write the formula for the function h. b. Let h 3 () t denote the height of the protein bar if it is thrown from a cliff that is 88 feet lower. Write the formula for the function h 3. c. Use technology to graph all three functions, h 1, h, and h 3, on the same axes. d. Estimate the coordinates of the vertex for each graph. July 015 Page 143 of 19
144 e. What number do the coordinates have in common? What is the meaning of this number in relation to the toss of the protein bar? f. The other coordinate is different for each vertex. Explain the meaning of this number for each of the vertices. 4. Consider the formulas for h 1, h, and h 3. a. How are the formulas different? b. Based on your answer to part a, how are the three graphs related? Do you see this relationship in your graphs of the three functions on the same axes? Estimating the vertex from the graph gives us an approximate answer to our original question, but an algebraic method for finding the vertex would give us an exact answer. 5. For each of the quadratic functions below, find the y-intercept of the graph and all other points with this value for the y-coordinate. a. ( ) f x = x 4x+ 9 c. ( ) f x = x 6x+ 7 b. ( ) f x = 4x + 8x 5 f x = ax + bx + c, a 0 d. ( ) 6. One of the characteristics of a parabola graph is that the graph has a line of symmetry. a. For each of the parabolas considered in item 5, use what you know about the graphs of quadratic functions in general with the specific information you have about these particular functions to find an equation for the line of symmetry. b. The line of symmetry for a parabola is called the axis of symmetry. Explain the relationship between the axis of symmetry and the vertex of a parabola. c. Find the y-coordinate of the vertex for the quadratic functions in item 5, parts a, b, and c, and then state the vertex as a point. d. Describe a method for finding the vertex of the graph of any quadratic function given in the form f ( x) = ax + bx + c, a Return to height functions h 1 (t)=-16t +4t+160, h (t)=-16t +4t+16, and July 015 Page 144 of 19
145 h 3 (t)=-16t +4t+7. a. Use the method you described in item 6, part d, to find the exact coordinates of the vertex of each b. Find the exact answer to the question: How high above its starting point did the protein bar go before it started falling back down? 8. Each part below gives a list of functions. Describe the geometric transformation of the graph of first function that results in the graph of the second, and then describe the transformation of the graph of the second that gives the graph of the third, and, where applicable, describe the transformation of the graph of the third that yields the graph of the last function in the list. f x = x, f x = x + 5, f x = x + 5 a. ( ) ( ) ( ) ( ) f b. ( x) x f ( x) x f ( x) x f ( x) ( x ) =, = 4, = 4 9, = , f c. ( x) x f ( x) x f ( x) x f ( x) ( x ) =, =, = + 16, = Expand each of the following formulas from the vertex form f ( x) = a( x h) + kto the standard form f ( x) = ax + bx + c. a. f(x)=(x - ) +5 b. f(x)=4(x + 1) - 9 c. f(x)= - (x + 3) + 16 d. Compare these expanded formulas to #5. How are they related? e. Compare the vertices in the original and expanded form. What special property do you notice? 10. For any quadratic function of the form f ( x) = a( x h) + k: a. What do the h and k in the formula represent relative to the function? b. Is there an alternative way to find (h, k) without finding two symmetrical points, finding the midpoint, and then finding the corresponding y value to the midpoint? 11. Use the vertex form of the equations for the functions h 1, h, and h 3 you found in #7 to verify algebraically the equivalence with the original formulas for the functions. 1. For the functions given below, put the formula in the vertex form f ( x) = a( x h) + k, give the equation of the axis of symmetry, and describe how to transform the graph of y = x to create the graph of the given function. July 015 Page 145 of 19
146 a. ( ) = + + b. ( ) f x 3x 1x 13 f x = x 7x+ 10 f x = x + 1x 4 c. ( ) 13. Make a hand-drawn sketch of the graphs of the functions in item 1. Make a dashed line for the axis of symmetry, and plot the vertex, y-intercept and the point symmetric with the y- intercept. July 015 Page 146 of 19
147 14. Which of the graphs that you drew in item 13 have x-intercepts? a. Find the x-intercepts that do exist by solving an appropriate equation and then add the corresponding points to your sketch(es) from item 13. b. Explain geometrically why some of the graphs have x-intercepts and some do not. c. Explain how to use the vertex form of a quadratic function to decide whether the graph of the function will or will not have x-intercepts. Explain your reasoning. July 015 Page 147 of 19
148 Just the Right Border Georgia Department of Education Standards Addressed in this Task MGSE9-1.A.SSE.3 Choose and produce an equivalent form of an expression to reveal and explain properties of the quantity represented by the expression. MGSE9-1.A.SSE.3b Complete the square in a quadratic expression to reveal the maximum and minimum value of the function defined by the expression. MGSE9-1.A.REI.4a Use the method of completing the square to transform any quadratic equation in x into an equation of the form (x p) = q that has the same solutions. Derive the quadratic formula from ax + bx + c = 0. MGSE9-1.A.REI.4b Solve quadratic equations by inspection (e.g., for x = 49), taking square roots, factoring, completing the square, and the quadratic formula, as appropriate to the initial form of the equation (limit to real number solutions). MGSE9-1.F.IF.4 Using tables, graphs, and verbal descriptions, interpret the key characteristics of a function which models the relationship between two quantities. Sketch a graph showing key features including: intercepts; interval where the function is increasing, decreasing, positive, or negative; relative maximums and minimums; symmetries; end behavior; and periodicity. MGSE9-1.F.IF.8 Write a function defined by an expression in different but equivalent forms to reveal and explain different properties of the function. Standards for Mathematical Practice 1. Make sense of problems and persevere in solving them by requiring students to interpret and make meaning of a problem and find a logical starting point, and to monitor their progress and change their approach to solving the problem, if necessary.. Reason abstractly and quantitatively by requiring students to make sense of quantities and their relationships to one another in problem situations. 4. Model with mathematics by expecting students to apply the mathematics concepts they know in order to solve problems arising in everyday situations, and reflect on whether the results are sensible for the given scenario. 5. Use appropriate tools strategically by expecting students to consider available tools when solving a mathematical problem. These tools might include pencil and paper, concrete models, a ruler, a protractor, a compass, a calculator, software, etc. July 015 Page 148 of 19
149 7. Look for and make use of structure by expecting students to apply rules, look for patterns and analyze structure. 8. Look for and express regularity in repeated reasoning by expecting students to understand broader applications and look for structure and general methods in similar situations. Common Student Misconceptions 1. Some students may believe that factoring and completing the square are isolated techniques within a unit of quadratic equations. Teachers should help students to see the value of these skills in the context of solving higher degree equations and examining different families of functions.. Students may think that the minimum (the vertex) of the graph of y=(x+5) is shifted to the right of the minimum (the vertex) of the graph y=x due to the addition sign. Students should explore expels both analytically and graphically to overcome this misconception. 3. Some students may believe that the minimum of the graph of a quadratic function always occur at the y-intercept. 4. Some students may think that rewriting equations into various forms (taking square roots, completing the square, using quadratic formula and factoring) are isolated techniques within a unit of quadratic equations. Teachers should help students see the value of these skills in the context of solving higher degree equations and examining different families of functions. 5. Students may believe that it is reasonable to input any x-value into a function, so they will need to examine multiple situations in which there are various limitations to the domains. 6. Students may also believe that the slope of a linear function is merely a number used to sketch the graph of the line. In reality, slopes have real-world meaning, and the idea of a rate of change is fundamental to understanding major concepts from geometry to calculus. 7. Students may believe that each family of functions (e.g., quadratic, square root, etc.) is independent of the others, so they may not recognize commonalities among all functions and their graphs. 8. Students may also believe that skills such as factoring a trinomial or completing the square are isolated within a unit on polynomials, and that they will come to understand the usefulness of these skills in the context of examining characteristics of functions. July 015 Page 149 of 19
150 9. Additionally, student may believe that the process of rewriting equations into various forms is simply an algebra symbol manipulation exercise, rather than serving a purpose of allowing different features of the function to be exhibited. Teacher Notes: Introduction: This task guides students in learning to apply the quadratic formula to solve quadratic equations. The teacher should teach the skill of Complete the Square before the task is introduced (may use the preceding task to do so). The Quadratic Formula should be developed by using Complete the Square. It opens with an applied problem that leads to a quadratic equation with irrational solutions. Students are guided through the application of the quadratic formula to this particular equation and then practice using the quadratic formula with a variety of equations including some that could be solved by factoring or extraction of square roots. Students are introduced to the discriminant, analyzing the information it provides when coefficients are rational numbers and when coefficients are real numbers. Students are asked to use the quadratic formula to solve a few quadratic equations with some irrational coefficients. The task ends with two applied problems that students should solve on their own. In this task, students are expected to classify quadratic equations with a negative discriminant as equations having no real solution. Students will also find complex solutions to quadratic equations. Students also review the connection between real solutions of a quadratic equation in standard form and x-intercepts of the corresponding quadratic function. This task provides a guided discovery for the following: Quadratic formula: The solution(s) of the quadratic equation of the form where a, b, and c are real numbers with a 0, is b ± b 4ac x =. a ax + bx + c = 0, Given an quadratic equation of the form with a 0, b b b ax + bx + c = 0, where a, b, and c are real numbers 4ac > 0 if and only if the equation has two real solutions, 4ac = 0 if and only if the equation has one real solution, and 4ac < 0 if and only if the equation has no real number solution. When a, b, and c are rational numbers, if the solution(s) are rational, and if b solutions are irrational. b 4ac is the square of a rational number, then 4ac is not the square of a rational number, then both July 015 Page 150 of 19
151 NOTE: The focus of this course is not to formally address the discriminant of a quadratic function but this task serves an introduction via its connection to the quadratic formula. Supplies Needed: Calculator Graphing utility July 015 Page 151 of 19
152 1. Hannah is an aspiring artist who enjoys taking nature photographs with her digital camera. Her mother, Cheryl, frequently attends estate sales in search of unique decorative items. Last month Cheryl purchased an antique picture frame that she thinks would be perfect for framing one of Hannah s recent photographs. The frame is rather large, so the photo needs to be enlarged. Cheryl wants to mat the picture. One of Hannah s art books suggest that mats should be designed so that the picture takes up 50% of the area inside the frame and the mat covers the other 50%. The inside of the picture frame is 0 inches by 3 inches. Cheryl wants Hannah to enlarge, and crop if necessary, her photograph so that it can be matted with a mat of uniform width and, as recommended, take up 50% of the area inside the mat. See the image at the right. a. Let x denote the width of the mat for the picture. Model this situation with a diagram. Write an equation in x that models this situation. Comment(s): The equation is based on recognition that the information provides two different ways to express the area covered by the picture: (i) 50% of the area inside the frame, and (ii) length of the picture area times the width of the picture area. Teachers may need to remind students that mathematical models often depend on expressing the same quantity in two different ways. Solution(s): x = width of mat in inches 0 x = width of the picture area 3 x = length of the picture area Equation: (0 x)( 3 x) =.50(0)(3), or (0 x)( 3 x) = 30 b. Put the equation from part a in the standard form solved by factoring (using integers)? ax + bx + c = 0. Can this equation be July 015 Page 15 of 19
153 Comment(s): Based on the instructions, it is expected that students will probably stop working as soon as they get a quadratic equation in standard form. It will be simpler to apply the quadratic formula if they simplify the equation by dividing through by the GCF, but there is no expectation that they will do so at this step. Solution(s): 0 x 3 x = 30 ( )( ) x 40x+ 4x = 30 4x 10⁴x+ 30 = 0 Comment(s): Students need to show that there are no integer pairs that the required conditions for factoring the expression over the integers. meet Solution(s): 4x 10⁴x+ 30 = 0 ( x x ) = 0 x 6x+ 80 = 0 In order to solve the equation by factoring, we would need to factor the expression x 6x+ 80. In order to factor this expression we need two factors of 80 that add to 6. The ways of factoring 80 as a product of two integers are: 1 80, 40, 4 0, 5 16, None of these pairs of integers adds to 6, so the expression does not factor over the integers. c. The quadratic formula can be used to solve quadratic equations that cannot be solved by factoring over the integers. Using the simplest equivalent equation in standard form, identify a, b, and c from the equation in part b and find b 4ac ; then substitute these values in the quadratic formula to find the solutions for x. Give exact answers for x and approximate the solutions to two decimal places. Comment(s): The exercise asks students to use the simplest equivalent equation so that students can focus on the basics of using the quadratic formula. Students are not required to simplify the answers, but some students will simplify so the simplification is shown to include the range of possible correct answers. At this point, teachers should focus July 015 Page 153 of 19
154 students on using the formula correctly and understanding how to find the two correct decimal approximations. Taking the steps to find the decimal approximations helps students to learn the quadratic formula with understanding that expressions like 6 ± 356 correspond to two specific and different real numbers. Solution(s): x 6x+ 80 = 0 is the simplest equivalent equation. b 4ac = = = 356 a = 1, b = 6. c = 80; ( ) ( ) 6 ± 356 x =.43, 3.57 Simplifying the exact answer, 6 ± ± x = = = ± = 13 ± ± 9.43 d. To the nearest tenth of an inch, what should be the width of the mat and the dimensions for the photo enlargement? Comment(s): This part requires students to realize that only one of the solutions to the equation is meaningful in this physical situation. Such a realization requires a higher level of comprehension than is needed to reject a negative solution when the answer for a physical situation must be a positive number. Note that the rounded answer leads to a photo area that is smaller than the required 30 inches because rounding to the nearest tenth requires rounding down. If any students are concerned about the results of a check similar to the one below, suggest that they give answers to the nearest thousandth of an inch and check these to get an area of square inches.. The item does not ask for answers to the nearest thousandth of an inch because it is unrealistic for the situation to assume that Cheryl and Hannah would have the tools to measure more accurately than the nearest tenth of an inch. Note to teachers: The solution below includes a check of the answer by using the stated answer in the words of the problem to see if it is consistent with the original information. This is not listed as a separate step because students need to internalize that, whenever time permits, they need to do such checking when giving the final answer to an applied problem. Solution(s): Decimal approximations of the values of x are.43 and The measure of the width inside the frame is only 0 inches, so the mat cannot be.43 inches wide. July 015 Page 154 of 19
155 Thus, to the nearest tenth of inch, the mat is 3.6 inches wide and the photo enlargement is 0 7. = 1.8 inches by 3 7. = 4.8 inches. Check of the solution: (1.8 in.)(4.8 in.) = sq. in. 30 sq. in., which is the required 50% of the area inside the frame.. The quadratic formula can be very useful in solving problems. Thus, it should be practiced enough to develop accuracy in using it and to allow you to commit the formula to memory. Use the quadratic formula to solve each of the following quadratic equations, even if you could solve the equation by other means. Begin by identifying a, b, and c and finding b 4ac ; then substitute these values into the formula. a. b. c. d. e. f. 4z + z 6= 0 t + t + 8= 0 3x + 15x = 1 5w + 9 = 30w 7x = 10x t 7 + = t 3 p + 5 = 3p g. ( ) h. 1z = 90 Comment(s): Students are told to identify a, b, and c, and find b 4ac before substituting values into the quadratic formula. Textbooks often demonstrate the use of the quadratic formula with substitution of a, b, and c into the formula. This set up usually requires lots of parentheses and several steps before the expression under the square root is simplified. Some teachers have found that having students calculate b 4ac before starting to substitute into the formula promotes better understanding and accuracy, perhaps because it leads to less rote behavior. The solutions below show calculation of b 4ac using calculation of ac first. This approach seems to help student accuracy because, at each stage of the calculation, students are making a decision about the sign of the product of two signed numbers. When teachers model using the formula, they are encouraged to use the steps as shown in the solutions below and to verbalize the substitution in the quadratic formula in a manner similar to the following. The opposite of b plus or minus the square root of the quantity b 4ac all divided by twice a. In preparation for complex number solutions in the form a + bi which will be addressed in future courses, and because students seem to understand better, when simplifying answers July 015 Page 155 of 19
156 requires reducing to lowest terms, the solutions below show separating the solutions into two separate rational expressions and reducing each individually. Solution(s): a. a = 4, b = 1, c = 6; b ac ( ) ( ) 1 ± x = or ± = = = 97 b. a = 1, b =, c = 8; b ac ( ) ( ) 4 = 4 8 = 4 3 = 8 ± 8 x = Since 8 is not a real number, there is no real number solution. c. We put the equation in standard form:: 3x + 15x 1 = 0 b 4ac = = = 369 a = 3, b = 15, c = 1; ( ) ( ) 15 ± 369 x = 6 Simplifying the solution, 15 ± ± x = = = ± = ± Alternately, if we divide the standard form of the equation by the GCF of 3 to obtain x + 5x 4= 0 : b 4ac = = = 41 a = 1, b = 5, c = 4; ( ) ( ) 5 ± x = or ± d. We put the equation in standard form: 5w 30w+ 9 = 0 b 4ac = = = 0 a = 5, b = 30, c = 9; ( ) ( ) 30 ± w = = = e. We put the equation in standard form: 7x 10x = 0 b 4ac = = 100 a = 7, b = 10, c = 0; ( ) ( ) 10 ± ± x = = =, =, =, July 015 Page 156 of 19
157 t 7 f. Starting with the equation + =, we multiply both sides of the equation by the least t common denominator, t, to obtain: t 7 t ( ) + t t t = t + 14 = 4t t 4t + 14 = 0 b 4ac = = = 40 a = 1, b = 4, c = 14; ( ) ( ) 4 ± 40 t = Since 40 is not a real number, there is no real number solution. g. We put the equation in standard form: 6 p + 15 = 3 p 6 p 3 p+ 15 = 0 a = 6, b = 3, c = 15; b 4ac = ( 3) 4( 90) = = ± ± p = = =, = 3, h. We put the equation in standard form: 1z 90 = 0 a = 1, b = 0, c = 90; b 4ac = ( 0) 4( 1)( 90) = ± z = = ± = ± = ± Alternately, if we divide the standard form of the equation by the GCF of 3 to obtain 4z 30 = 0 : b 4ac = = 480 a = 4, b = 0, c = 30; ( ) ( )( ) 0 ± z = = ± = ± = ± Extension Question: The expression b 4ac in the quadratic formula is called the discriminant of the quadratic equation in standard form. All of the equations in item had values of a, b, and c that are rational numbers. Answer the following questions for quadratic equations in standard form when a, b, and c are rational numbers. Make sure that your answers are consistent with the solutions from item. July 015 Page 157 of 19
158 a. What kind of number is the discriminant when there are two real number solutions to a quadratic equation? b. What kind of number is the discriminant when the two real number solutions to a quadratic equation are rational numbers? c. What kind of number is the discriminant when the two real number solutions to a quadratic equation are irrational numbers? d. Could a quadratic equation with rational coefficients have one rational solution and one irrational solution? Explain your reasoning. e. What kind of number is the discriminant when there is only one real number solution? f. What kind of number is the discriminant when there is no real number solution to the equation? Comment(s): This item emphasizes that students are stating results in the case that a, b, and c are rational numbers. When coefficients are rational, students usually find an equivalent equation with integer coefficients before applying the quadratic formula, but, in stating general results, it is simpler to assume rational coefficients. In fact, it would be good to lead the class through at least one example of direct application of the quadratic formula to rational coefficients; one such example is provided immediately below. Solve 1 1 q + q = using the quadratic formula Solution(s): Method 1 Using LCD to find an equivalent equation with integer coefficients q 1 q = 4 6 8q + 3q = 8q + 3q = 0 ( ) a = 8, b = 3, c =, b 4ac = = = 73 3 ± 73 q = 16 Method Using the rational coefficients in the quadratic formula July 015 Page 158 of 19
159 1 1 q + q = a =, b=, c =, b 4ac = = + = + = ± ± q = = = 4 4 ± q = ± In working with quadratic equations with rational coefficients, whether or not they use an equivalent equation with integer coefficients, students should realize that, when all coefficients are rational, irrational solutions arise with the discriminant is not the square of any rational number. This idea reduces to a perfect square discriminant when integer coefficients are used. Students should also realize that, since any irrational solutions arise when the square root of the determinant is not rational, irrational solutions come in pairs. Students should see that, when all the coefficients are rational numbers, a perfect square determinant (or a rational number determinant whose numerator and denominator are both perfect squares) implies that the solutions will be rational. An important consequence of this result is that a perfect square determinant indicates that the equation can be solved by factoring. Students will not be able to deduce this result until they learn the Factor Theorem but may make such a conjecture based on their experience with factoring. Most of the quadratic equations students solve involve rational coefficients. Students often see the properties they will list in answering the parts of this item but do not comprehend that they apply only in the case of rational coefficients. This item is designed to avoid such misconceptions. Students are allowed to build their understanding of the determinant in stages. In item 7, after they have solved a few quadratic equations that have some irrational number coefficients, they will revisit statements about the discriminant when the coefficients are known to be real numbers but not necessarily rational. Note that consideration of quadratic equations with complex number coefficients is beyond the scope of Analytic Geometry since finding square roots of complex numbers requires trigonometric functions and DeMoirve s Theorem. July 015 Page 159 of 19
160 Note that the questions are asked in such a way that students have to see that the important concept is whether the discriminant is positive, zero, or negative. This phrasing reverses the direction of the implication usually stated for the discriminant and brings the observation that the statements of cases of the discriminant are biconditional statements although they are rarely actually stated as such. Solution(s): a. When there are two real number solutions, the discriminant is positive. b. When there are two rational number solutions, the discriminant is the square of a nonzero rational number, that is, numerator and denominator are perfect squares. c. When there are two irrational number solutions, the discriminant is not a perfect square of a rational number. d. No. If a quadratic equation has one rational and one irrational solution, it has two real number solutions so the discriminant is positive. In this case, it is either the square of a rational number or it is not. If it is the square of a rational number, there are two rational number solutions. If it is not the square of a rational number, there are two irrational solutions. Neither possible case leads to one rational and one irrational solution. e. When there is only one real number solution, the discriminant is 0. In this case, b the solution to the quadratic equation is, which is a rational number when a a and b are rational numbers. f. When there is no real number solution, the discriminant is a negative number. 4. There are many ways to show why the quadratic formula always gives the solution(s) to any quadratic equation with real number coefficients. You can work through one of these by responding to the parts below. Start by assuming that each of a, b, and c is a real number, that a 0, and then consider the quadratic equation ax + bx + c = 0. a. Why do we assume that a 0? b. Form the corresponding quadratic function, f ( x) = ax + bx + c, and put the formula for f(x) in vertex form, expressing k in the vertex form as a single rational expression. c. Use the vertex form to solve for x-intercepts of the graph and simplify the solution. Hint: Consider two cases, a > 0 and a < 0, in simplifying a. July 015 Page 160 of 19
161 Comment(s): All classes need to see a derivation of the quadratic formula. This alternate item 4 provides a brief guide for students to verify the quadratic formula for themselves. Based on the characteristics of each class, teachers should make the decision whether to use alternative item 4 at this point, at a later point after students have worked with the quadratic formula further, or to conduct a teacher-led discussion of the derivation. Solution(s): a. If a = 0, the equation is of the form bx+ c = 0, which is a linear equation and not quadratic. A quadratic equation must have a term with the square of the variable. b. In the Protein Bar Toss Part, we found that the x-coordinate of the vertex of the b function f ( x) = ax + bx + c is given by x =. Then, a b b b f a b c a = + + a a b b = a + b + c 4a a b b = + + c 4a a b b 4ac = + + 4a 4a 4a b + 4ac = 4a 4 Thus, the vertex is b, b + ac and the vertex form is a 4a b b + 4ac f ( x) = a x+ a +. 4a c. To find the x-intercepts, we solve f ( x ) = 0. Substituting the vertex form of the formula for f ( x ) yields July 015 Page 161 of 19
162 b b + 4ac a x+ 0 a + = 4a ( b 4ac) b + a x+ a = 4a b b 4ac x + a = 4a b b 4ac x + = ± a 4a b 4ac ±, for a > 0 a = b 4ac ±, for a < 0 ( a) Thus, b 4ac ±, for a > 0 a = = ± b b 4ac b ± b 4ac x = ± = a a a b 4ac, for a < 0 a July 015 Page 16 of 19 b 4ac a 5. Use the quadratic formula to solve the following equations with real number coefficients. Approximate each real, but irrational, solution correct to hundredths. a. x + 5x+ 1= 0 b. 3q 5q+ π = 0 c. 3t + 11 = 33t d. 9w = 13w Comment(s): These examples remind students that irrational numbers are also real numbers and give them some specific examples on which to test whether all the statements that are true of
163 the discriminant when the coefficients of the quadratic equation are rational numbers continue to be true for arbitrary real number coefficients. The exercises have been limited to avoid multiple levels of square root. The goal is to extend student understanding beyond rational coefficients. However, once students have done these examples, they should see that they can use any real number coefficients with limited simplification of the exact answer, as happens part b involving π. Solution(s): a. a = 1, b = 5, c = 1; thus, b ac ( ) ( ) 4 = 5 41 = 5 4= 1 5 ± x = = 0.6 or 1.6 b. a = 3, b = 5, c = π; thus, ( ) ( ) b 4ac = 5 4 6π = 5 4π ± 5 4π 5 ± q =, not real numbers 6 6 There is no real number solution. c. Putting the equation in standard form yields 3t 33t + 11 = 0. Then, a = 3, b = 33, c = 11; b ac ( ) ( ) ( ) ( ) 33 ± t = = = = = = 0 d. Putting the equation in standard form yields 9w 13w = 0. Then, a = 9, b = 13, c = 0; b ac ( ) ( ) 4 = = 13 0 = ± w = = or = or w = 0 or Verify each answer for item 5 by using a graphing utility to find the x-intercept(s) of an appropriate quadratic function. Comment(s): Students need to put equations in standard form before creating the corresponding function. Students are to verify the solutions by checking that the x-intercepts are consistent with the solutions. Students should be encouraged to trace their graphs to verify that the x-intercept values agree with their solutions. July 015 Page 163 of 19

164 This item gives an excellent opportunity to point out the connection between the formula for the x-coordinate of the vertex of a quadratic function and the solution for x-intercepts using the quadratic formula. When we solve for x-intercepts, if there are any, they are of b b 4ac b the form ±. If there are two intercepts, then is the midpoint between a a a these two symmetrically placed points of the graph. But then the vertex must be at this x- b value because it is on the line of symmetry, so the x-coordinate of the vertex is. If a there is only one x-intercept, then the parabolic shape of the graph forces that one the x- b intercept to be the vertex and, again, the x-coordinate of the vertex is. a Solution(s): Equation: x + 5x+ 1= 0 Equation: 3q 5q+ π = 0 Function: f ( x) = x + x+ Function: ( ) 5 1 f q = 3q 5q+ π Equation: 3t + 11 = 33t Equation: 9w = 13w Function: f ( t) = 3t 33t + 11 Function: ( ) f w = 9w 13w July 015 Page 164 of 19
165 a. Put the function for item 5, part c, in vertex form. Use the vertex form to find the t- intercept. Comment(s): This part guides students to see that the quadratic polynomial in the equation is a multiple of a perfect square trinomial with real coefficients. From this form, students can solve the equation by extraction of roots, as demonstrated in the solution for the t- intercept below. Solution(s): f t = 3t 33t + 11 ( ) vertex: t = = ; 6 3 So the vertex form of the function is ( ) the t-intercept is found by solving f ( t ) = t 0 Thus, t 0. 3 = 3 = = 3 33 t = t = 3 b. Solve the equation from item 5, part d, by factoring f = = 3 ( 33) = = = f t = 3 t 3, and, thus, Comment(s): This part makes sure that students notice that solving this equation did not require use of the quadratic formula. July 015 Page 165 of 19
166 Solution(s) Georgia Department of Education 9w 13w = 0 w ( w ) 9 13 = 0 9w 13 = 0 or w = 0 9w = 13 w = Extension Question: Answer the following questions for quadratic equations in standard from where a, b, and c are real numbers. a. What kind of number is the discriminant when there are two real number solutions to a quadratic equation? b. Could a quadratic equation with real coefficients have one rational solution and one irrational solution? Explain your reasoning. c. What kind of number is the discriminant when there is only one real number solution? d. What kind of number is the discriminant when there is no real number solution to the equation? e. Summarize what you know about the relationship between the determinant and the solutions of a quadratic of the form ax + bx + c = 0 where a, b, and c are real numbers with a 0 into a formal statement using biconditionals. Comment(s): As indicated for item 3, this item asks students to explore the information provided by the discriminant when the coefficients are real numbers but not necessarily rational numbers. Solution(s): a. When there are two real number solutions, the discriminant is positive. b. Yes, item 5, part d, provided just such an example. In this case the b is equal to b 4ac. Thus, one solution is 0, a rational number, and the other solution is irrational. c. When there is only one real number solution, the discriminant is zero. d. When there is no real number solution, the discriminant is a negative number. July 015 Page 166 of 19
167 e. Given an equation of the form with a 0, b b b Georgia Department of Education ax + bx + c = 0, where a, b, and c are real numbers 4ac > 0 if and only if the equation has two real solutions, 4ac = 0 if and only if the equation has one real solution, and 4ac < 0 if and only if the equation has no real number solution. When a, b, and c are rational numbers, if b 4ac is the square of a rational number, then the solution(s) are rational, and if b 4ac is not the square of a rational number, then both solutions are irrational. 8. A landscape designer included a cloister (a rectangular garden surrounded by a covered walkway on all four sides) in his plans for a new public park. The garden is to be 35 feet by 3 feet and the total area enclosed by the garden and walkway together is 100 square feet. To the nearest inch, how wide does the walkway need to be? Comment(s): This problem is similar to the opening problem, but this time the inner dimensions are given and twice the width of the walk must be added (instead of subtracted) to form the dimensions for the whole area. There is an issue of units here. Numbers are smaller if the unknown width of the walk is assumed to be measured in feet and then converted to inches at the end. Solution(s): Let x = the width of the walkway, in feet then 35 + x = length of the whole area, and 3 + x = width of the whole area. July 015 Page 167 of 19
 = 36.")
168 ( x)( x) = x+ 70x+ 4x = 100 4x + 116x 395 = 0 b Georgia Department of Education a = 4, b= 116, c = 395 ( )( ) 4ac = = = ± x = ± x x or 8 8 The negative solution to the equation does not apply to the physical situation. Thus, x feet ( 1) = Hence, to the nearest inch the walk should be 37 inches. Checking the answer: ( ) ( ) ( )( ) 9. In another area of the park, there will be an open rectangular area of grass surrounded by a flagstone path. If a person cuts across the grass to get from the southeast corner of the area to the northwest corner, the person will walk a distance of 15 yards. If the length of the area is 5 yards more than the width, to the nearest foot, how much distance is saved by cutting across rather than walking along the flagstone path? Comment(s): In working this problem, students should neglect the extra length caused by walking on the path slightly outside the edge of the rectangular area. Solution(s): Let x = width of the rectangular area, then x + 5 = length of the rectangular area We use the Pythagorean Theorem to find x, July 015 Page 168 of 19
Mathematics. Accelerated GSE Algebra I/Geometry A. Unit 3: Modeling and Analyzing Quadratic Functions
 Georgia Standards of Excellence Curriculum Frameworks Mathematics Accelerated GSE Algebra I/Geometry A Unit 3: Modeling and Analyzing Quadratic Functions These materials are for nonprofit educational purposes
Mathematics. Accelerated GSE Algebra I/Geometry A. Unit 3: Modeling and Analyzing Quadratic Functions
 Georgia Standards of Excellence Frameworks Mathematics Accelerated GSE Algebra I/Geometry A Unit 3: Modeling and Analyzing Quadratic Functions Mathematics GSE Algebra I Unit 5: Comparing and Contrasting
CCGPS Frameworks Student Edition. Mathematics. Accelerated CCGPS Analytic Geometry B / Advanced Algebra Unit 2: Quadratic Functions
 CCGPS Frameworks Student Edition Mathematics Accelerated CCGPS Analytic Geometry B / Advanced Algebra Unit : Quadratic Functions These materials are for nonprofit educational purposes only. Any other use
Georgia Standards of Excellence Algebra I
 A Correlation of 2018 To the Table of Contents Mathematical Practices... 1 Content Standards... 5 Copyright 2017 Pearson Education, Inc. or its affiliate(s). All rights reserved. Mathematical Practices
Georgia Standards of Excellence Curriculum Map. Mathematics. GSE Algebra I
 Georgia Standards of Excellence Curriculum Map Mathematics GSE Algebra I These materials are for nonprofit educational purposes only. Any other use may constitute copyright infringement. Georgia Standards
Georgia Standards of Excellence Curriculum Map. Mathematics. GSE Algebra I
 Georgia Standards of Excellence Curriculum Map Mathematics GSE Algebra I These materials are for nonprofit educational purposes only. Any other use may constitute copyright infringement. Georgia Department
Topic: Quadratic Functions (Unit 5)
") Name: Math Department Subject: Analytic Geometry Topic: Quadratic Functions (Unit 5) CCGPS Key Standards Use complex numbers in polynomial identities and equations MCC9 12.N.CN.7 Solve quadratic equations
Name: Math Department Subject: Analytic Geometry Topic: Quadratic Functions (Unit 5) CCGPS Key Standards Use complex numbers in polynomial identities and equations MCC9 12.N.CN.7 Solve quadratic equations
GSE Algebra I Curriculum Map 1 st Semester 2 nd Semester
 GSE Algebra I Curriculum Map 1 st Semester 2 nd Semester Unit 1 (3 4 weeks) Unit 2 (5 6 weeks) Unit 3 (7 8 weeks) Unit 4 (6 7 weeks) Unit 5 (3 4 weeks) Unit 6 (3 4 weeks) Relationships Between Quantities
CCGPS Frameworks Student Edition. Mathematics. CCGPS Analytic Geometry Unit 6: Modeling Geometry
 CCGPS Frameworks Student Edition Mathematics CCGPS Analytic Geometry Unit 6: Modeling Geometry These materials are for nonprofit educational purposes only. Any other use may constitute copyright infringement.
Mathematics. Accelerated GSE Algebra I/Geometry A. Unit 4: Modeling and Analyzing Exponential Functions
 Georgia Standards of Excellence Frameworks Mathematics Accelerated GSE Algebra I/Geometry A Unit 4: Modeling and Analyzing Exponential Functions. These materials are for nonprofit educational purposes
Georgia Standards of Excellence Frameworks Mathematics
 Georgia Standards of Excellence Frameworks Mathematics GSE Coordinate Algebra Unit 2: Reasoning with Equations and Inequalities Unit 2 Reasoning with Equations and Inequalities Table of Contents OVERVIEW...
Mathematics. Algebra Course Syllabus
 Prerequisites: Successful completion of Math 8 or Foundations for Algebra Credits: 1.0 Math, Merit Mathematics Algebra 1 2018 2019 Course Syllabus Algebra I formalizes and extends the mathematics students
Georgia Standards of Excellence Curriculum Frameworks. Mathematics
 Georgia Standards of Excellence Curriculum Frameworks Mathematics Accelerated GSE Analytic Geometry B/Advanced Algebra Unit 7: Rational and Radical Relationships These materials are for nonprofit educational
Mathematics. Unit 4: Modeling and Analyzing Exponential Functions
 Georgia Standards of Excellence Curriculum Frameworks Mathematics GSE Algebra I Unit 4: Modeling and Analyzing Exponential Functions. These materials are for nonprofit educational purposes only. Any other
Georgia Standards of Excellence Curriculum Frameworks. Mathematics. GSE Algebra I. Unit 5: Comparing and Contrasting Functions
 Georgia Standards of Excellence Curriculum Frameworks Mathematics GSE Algebra I Unit 5: Comparing and Contrasting Functions GSE Algebra I Unit 5 Unit 5 Comparing and Contrasting Functions Table of Contents
UNIT 3: MODELING AND ANALYZING QUADRATIC FUNCTIONS
 UNIT 3: MODELING AND ANALYZING QUADRATIC FUNCTIONS This unit investigates quadratic functions. Students study the structure of quadratic expressions and write quadratic expressions in equivalent forms.
Georgia Standards of Excellence Curriculum Frameworks Mathematics
 Georgia Standards of Excellence Curriculum Frameworks Mathematics GSE Analytic Geometry Unit 6: Geometric and Algebraic Connections Unit 6 Geometric and Algebraic Connections Table of Contents OVERVIEW...
Mathematics. Accelerated GSE Algebra I/Geometry A. Unit 5: Comparing and Contrasting Functions
 Georgia Standards of Excellence Frameworks Mathematics Accelerated GSE Algebra I/Geometry A Unit 5: Comparing and Contrasting Functions These materials are for nonprofit educational purposes only. Any
Continuing Quadratic/Polynomial Real-World Problems
 Algebra 1, Quarter 3, Unit 3.1 Continuing Quadratic/Polynomial Real-World Problems Overview Number of instructional days: 15 (1 day = 45 60 minutes) Content to be learned Understand closed operations.
Solving Quadratic Equations Using Multiple Methods and Solving Systems of Linear and Quadratic Equations
 Algebra 1, Quarter 4, Unit 4.1 Solving Quadratic Equations Using Multiple Methods and Solving Systems of Linear and Quadratic Equations Overview Number of instructional days: 13 (1 day = 45 minutes) Content
Sequenced Units for Arizona s College and Career Ready Standards MA27 Algebra I
 Sequenced Units for Arizona s College and Career Ready Standards MA27 Algebra I Year at a Glance Semester 1 Semester 2 Unit 1: Solving Linear Equations (12 days) Unit 2: Solving Linear Inequalities (12
Georgia Standards of Excellence Algebra II/Advanced Algebra
 A Correlation of 2018 To the Table of Contents Mathematical Practices... 1 Content Standards... 5 Copyright 2017 Pearson Education, Inc. or its affiliate(s). All rights reserved. Mathematical Practices
UNIT 4 ALGEBRA I TEMPLATE CREATED BY REGION 1 ESA UNIT 4
 UNIT 4 ALGEBRA I TEMPLATE CREATED BY REGION 1 ESA UNIT 4 Algebra 1 Unit 4 Overview: Expressions and Equations In this unit, students build on their knowledge from unit 2, where they extended the laws of
Algebra 1. Mathematics Course Syllabus
 Mathematics Algebra 1 2017 2018 Course Syllabus Prerequisites: Successful completion of Math 8 or Foundations for Algebra Credits: 1.0 Math, Merit The fundamental purpose of this course is to formalize
Big Ideas Math Algebra 1. Correlations to the Common Core State Standards
 Big Ideas Math Algebra 1 Correlations to the Common Core State s 2 Big Ideas Math: A Common Core Curriculum Algebra 1 2015 Conceptual Category: Number and Quantity Domain: TThe Real Number System Explain
California Common Core State Standards for Mathematics Standards Map Algebra I
 A Correlation of Pearson CME Project Algebra 1 Common Core 2013 to the California Common Core State s for Mathematics s Map Algebra I California Common Core State s for Mathematics s Map Algebra I Indicates
Algebra 1 Standards Curriculum Map Bourbon County Schools. Days Unit/Topic Standards Activities Learning Targets ( I Can Statements) 1-19 Unit 1
 1-19 Unit 1") Algebra 1 Standards Curriculum Map Bourbon County Schools Level: Grade and/or Course: Updated: e.g. = Example only Days Unit/Topic Standards Activities Learning Targets ( I 1-19 Unit 1 A.SSE.1 Interpret
Algebra 1 Standards Curriculum Map Bourbon County Schools Level: Grade and/or Course: Updated: e.g. = Example only Days Unit/Topic Standards Activities Learning Targets ( I 1-19 Unit 1 A.SSE.1 Interpret
Unit A - Cracking Codes Patterns and Repetition in our World
 Unit A - Cracking Codes Patterns and Repetition in our World Overview Student will be engaged in learning mathematical skills within the context of interesting problems that connect to real world issues.
Georgia Standards of Excellence Curriculum Map. Mathematics. GSE Algebra II/Advanced Algebra
 Georgia Standards of Excellence Curriculum Map Mathematics GSE Algebra II/Advanced Algebra These materials are for nonprofit educational purposes only. Any other use may constitute copyright infringement.
PARCC MODEL CONTENT FRAMEWORKS MATHEMATICS MATHEMATICS I. Version 3.0 November 2012
 PARCC MODEL CONTENT FRAMEWORKS MATHEMATICS MATHEMATICS I Version 3.0 November 2012 PARCC MODEL CONTENT FRAMEWORK FOR MATHEMATICS FOR MATHEMATICS I Mathematics I Overview Numerals in parentheses designate
MATHEMATICS Math I. Number and Quantity The Real Number System
 MATHEMATICS Math I The high school mathematics curriculum is designed to develop deep understanding of foundational math ideas. In order to allow time for such understanding, each level focuses on concepts
Big Ideas Chapter 6: Exponential Functions and Sequences
 Big Ideas Chapter 6: Exponential Functions and Sequences We are in the middle of the year, having finished work with linear equations. The work that follows this chapter involves polynomials and work with
Standards for Mathematical Objectives Major & Minor
 Standards for Mathematical Objectives Major & Minor Practice Assessments 1) Make sense of problems and determine if a situation should be modeled by a one or two Mini Quiz 1.1 persevere in solving them.
Milford Public Schools Curriculum. Department: Mathematics Course Name: Algebra 1 Level 2
 Milford Public Schools Curriculum Department: Mathematics Course Name: Algebra 1 Level 2 UNIT 1 Unit Title: Intro to Functions and Exponential Expressions Unit Description: Students explore the main functions
Algebra 1 3 rd Trimester Expectations Chapter (McGraw-Hill Algebra 1) Chapter 9: Quadratic Functions and Equations. Key Vocabulary Suggested Pacing
 Chapter 9: Quadratic Functions and Equations. Key Vocabulary Suggested Pacing") Algebra 1 3 rd Trimester Expectations Chapter (McGraw-Hill Algebra 1) Chapter 9: Quadratic Functions and Equations Lesson 9-1: Graphing Quadratic Functions Lesson 9-2: Solving Quadratic Equations by Graphing
Algebra 1 3 rd Trimester Expectations Chapter (McGraw-Hill Algebra 1) Chapter 9: Quadratic Functions and Equations Lesson 9-1: Graphing Quadratic Functions Lesson 9-2: Solving Quadratic Equations by Graphing
Algebra 1 Yearlong Curriculum Plan. Last modified: June 2014
 Algebra 1 Yearlong Curriculum Plan Last modified: June 2014 SUMMARY This curriculum plan is divided into four academic quarters. In Quarter 1, students first dive deeper into the real number system before
Georgia Standards of Excellence Mathematics
 Georgia Standards of Excellence Mathematics Standards GSE Coordinate Algebra K-12 Mathematics Introduction Georgia Mathematics focuses on actively engaging the student in the development of mathematical
Cumberland County Schools
 Cumberland County Schools MATHEMATICS Algebra II The high school mathematics curriculum is designed to develop deep understanding of foundational math ideas. In order to allow time for such understanding,
Mathematics Standards for High School Algebra I
 Mathematics Standards for High School Algebra I Algebra I is a course required for graduation and course is aligned with the College and Career Ready Standards for Mathematics in High School. Throughout
Algebra I. 60 Higher Mathematics Courses Algebra I
 The fundamental purpose of the course is to formalize and extend the mathematics that students learned in the middle grades. This course includes standards from the conceptual categories of Number and
PARCC MODEL CONTENT FRAMEWORKS MATHEMATICS MATHEMATICS II. Version 3.0 November 2012
 PARCC MODEL CONTENT FRAMEWORKS MATHEMATICS MATHEMATICS II Version 3.0 November 2012 PARCC MODEL CONTENT FRAMEWORK FOR MATHEMATICS FOR MATHEMATICS II Mathematics II Overview Numerals in parentheses designate
GSE Algebra 1. Unit Two Information. Curriculum Map: Reasoning with Linear Equations & Inequalities
 GSE Algebra 1 Unit Two Information EOCT Domain & Weight: Equations 30% Curriculum Map: Reasoning with Linear Equations & Inequalities Content Descriptors: Concept 1: Create equations that describe numbers
Subject Area Algebra I Grade Level 9_
 MVNTA COMMON CORE TEMPLATE Subject Area Algebra I Grade Level 9_ BUCKET ONE BIG ROCKS Reason quantitatively and use units to solve problems. Understand the concept of a function and use function notation.
Mathematics. Accelerated GSE Geometry B/Algebra II Unit 5: Operations with Polynomials
 Georgia Standards of Excellence Curriculum Frameworks Mathematics Accelerated GSE Geometry B/Algebra II Unit 5: Operations with Polynomials These materials are for nonprofit educational purposes only.
The Common Core Georgia Performance Standards (CCGPS) for Grades K-12 Mathematics may be accessed on-line at:
 for Grades K-12 Mathematics may be accessed on-line at:") FORMAT FOR CORRELATION TO THE COMMON CORE GEORGIA PERFORMANCE STANDARDS (CCGPS) Subject Area: Mathematics Textbook Title: State-Funded Course: 27.09720 Analytic Geometry,, I Publisher: Agile Mind Standard
FORMAT FOR CORRELATION TO THE COMMON CORE GEORGIA PERFORMANCE STANDARDS (CCGPS) Subject Area: Mathematics Textbook Title: State-Funded Course: 27.09720 Analytic Geometry,, I Publisher: Agile Mind Standard
Common Core State Standards with California Additions 1 Standards Map. Algebra I
 Common Core State s with California Additions 1 s Map Algebra I *Indicates a modeling standard linking mathematics to everyday life, work, and decision-making N-RN 1. N-RN 2. Publisher Language 2 Primary
Georgia Standards of Excellence Curriculum Frameworks. Mathematics
 Georgia Standards of Ecellence Curriculum Frameworks Mathematics Accelerated GSE Analytic Geometry B/Advanced Algebra Unit 2: Geometric and Algebraic Connections These materials are for nonprofit educational
High School Programs. Math 2 II UNIT 2 OVERVIEW: Modeling with Quadratic Functions Parent Guide
 Unit Outcomes At the end of this unit, your student should be able to: Determine whether an expression is a polynomial. Add and subtracting polynomials. Multiply up to three linear expressions. Create
Quadratics and Other Polynomials
 Algebra 2, Quarter 2, Unit 2.1 Quadratics and Other Polynomials Overview Number of instructional days: 15 (1 day = 45 60 minutes) Content to be learned Know and apply the Fundamental Theorem of Algebra
Standard Description Agile Mind Lesson / Activity Page / Link to Resource
 Publisher: Agile Mind, Inc Date: 19-May-14 Course and/or Algebra I Grade Level: TN Core Standard Standard Description Agile Mind Lesson / Activity Page / Link to Resource Create equations that describe
Dublin City Schools Mathematics Graded Course of Study Algebra I Philosophy
 Philosophy The Dublin City Schools Mathematics Program is designed to set clear and consistent expectations in order to help support children with the development of mathematical understanding. We believe
COLLEGE-PREP ALGEBRA I Course #042
 COLLEGE-PREP ALGEBRA I Course #042 Course of Study Findlay City Schools 2013 TABLE OF CONTENTS 1. Findlay City Schools Mission Statement and Beliefs 2. College-Prep Algebra I Course of Study 3. College-Prep
ALGEBRA I CCR MATH STANDARDS
 RELATIONSHIPS BETWEEN QUANTITIES AND REASONING WITH EQUATIONS M.A1HS.1 M.A1HS.2 M.A1HS.3 M.A1HS.4 M.A1HS.5 M.A1HS.6 M.A1HS.7 M.A1HS.8 M.A1HS.9 M.A1HS.10 Reason quantitatively and use units to solve problems.
Algebra I. 60 Higher Mathematics Courses Algebra I
 The fundamental purpose of the course is to formalize and extend the mathematics that students learned in the middle grades. This course includes standards from the conceptual categories of Number and
Mathematics. GSE Algebra II/Advanced Algebra Unit 3: Polynomial Functions
 Georgia Standards of Excellence Curriculum Frameworks Mathematics GSE Algebra II/Advanced Algebra Unit 3: Polynomial Functions These materials are for nonprofit educational purposes only. Any other use
River Dell Regional School District. Algebra I Curriculum
 Algebra I Curriculum 2015 Mr. Patrick Fletcher Superintendent River Dell Regional Schools Ms. Lorraine Brooks Principal River Dell High School Mr. Richard Freedman Principal River Dell Middle School Mr.
Curriculum Scope and Sequence
 Curriculum Scope and Sequence Subject/Grade Level: 9th Grade Course: Algebra I Unit Duration Transfer Goal(s) Enduring Understandings Essential Questions 1 - Solving Equations & Inequalities 32-35 days
Algebra B. Curriculum Framework
 Curriculum Framework Compiled using the Common Core State Standards for Mathematics and the PARCC Model Content Frameworks for Mathematics Version 3.0 (November 2012 revision) Course Title: Course/Unit
, Algebra I, Quarter 1
 2017.18, Algebra I, Quarter 1 The following Practice Standards and Literacy Skills will be used throughout the course: Standards for Mathematical Practice Literacy Skills for Mathematical Proficiency 1.
Common Core Georgia Performance Standards: Curriculum Map 1 st Semester 2 nd Semester
 Common Core Georgia Performance Standards High School Mathematics CCGPS Coordinate Algebra At a Glance Common Core Georgia Performance Standards: Curriculum Map 1 st Semester 2 nd Semester Unit 1 Unit
Mathematics. Accelerated GSE Analytic Geometry B/Advanced Algebra Unit 6: Polynomial Functions
 Georgia Standards of Excellence Frameworks Mathematics Accelerated GSE Analytic Geometry B/Advanced Algebra Unit 6: Polynomial Functions These materials are for nonprofit educational purposes only. Any
A Correlation of Pearson Mathematics Algebra 2 Common Core, 2015 To the Georgia Standards of Excellence Algebra II
 A Correlation of Pearson Mathematics Common Core, 2015 To the Algebra II A Correlation of Common Core 2015 Introduction This document demonstrates how Pearson, Common Core Edition 2015 meets the standards
Algebra 2 (#9260) AASD Mathematics Goals for K-12 Students
 AASD Mathematics Goals for K-12 Students") AASD MATHEMATICS CURRICULUM Algebra 2 (#9260) Description In this course, students will revisit key concepts from Algebra 1, Geometry, and other mathematics courses, building upon students prior knowledge
AASD MATHEMATICS CURRICULUM Algebra 2 (#9260) Description In this course, students will revisit key concepts from Algebra 1, Geometry, and other mathematics courses, building upon students prior knowledge
PARCC MODEL CONTENT FRAMEWORKS MATHEMATICS MATHEMATICS III. Version 3.0 November 2012
 PARCC MODEL CONTENT FRAMEWORKS MATHEMATICS MATHEMATICS III Version 3.0 November 2012 PARCC MODEL CONTENT FRAMEWORK FOR MATHEMATICS FOR MATHEMATICS III Mathematics III Overview Numerals in parentheses designate
ALGEBRA II GSE ADVANCED ALGEBRA/ALGEBRA II
 Unit Name 1 Quadratics Revisited GSE ADVANCED ALGEBRA/ALGEBRA II ALGEBRA II SCOPE AND SEQUENCE CHART Unit Description Georgia Standards of Excellence Unit Duration Unit1: Students will revisit solving
ALGEBRA I INSTRUCTIONAL PACING GUIDE (DAYS BASED ON 90 MINUTES DAILY) FIRST NINE WEEKS
 FIRST NINE WEEKS") FIRST NINE WEEKS Unit 1: Relationships Between Quantities and Reasoning with Equations Quantities and Relationships F.LE.1.b. Recognize situations in which one quantity changes at a constant rate per unit
FIRST NINE WEEKS Unit 1: Relationships Between Quantities and Reasoning with Equations Quantities and Relationships F.LE.1.b. Recognize situations in which one quantity changes at a constant rate per unit
A Story of Functions Curriculum Overview
 Rationale for Module Sequence in Algebra I Module 1: By the end of eighth grade, students have learned to solve linear equations in one variable and have applied graphical and algebraic methods to analyze
CCGPS Curriculum Map. Mathematics. CCGPS Analytic Geometry
 CCGPS Curriculum Map Mathematics CCGPS Analytic Geometry These materials are for nonprofit educational purposes only. Any other use may constitute copyright infringement. Similarity, Congruence, and Proofs
SECONDARY MATHEMATICS I
 SECONDARY MATHEMATICS I The fundamental purpose of SECONDARY Mathematics I is to formalize and extend the mathematics that students learned in the middle grades. The critical areas, organized into units,
Alignment This course is aligned to the California Common Core State Standards for Algebra 1. Suggested Video/DVDs//Films 3. TBD Web Sites 4.
 High School Course Description for Algebra 1 Course Title: Algebra 1 Course Number: MTH 101, 102, 131, 132, 181, 182, 1011, 1012, 1013, 1014 Grade Level: 9-12 Meets a UC a-g Requirement: Yes C Curricular
Algebra 2 for Pre-Calculus (#9300)
") AASD MATHEMATICS CURRICULUM Algebra 2 for Pre-Calculus (#9300) Description This course is a rigorous extension of earlier mathematics courses in preparation for Pre-Calculus. Students will build upon prior
AASD MATHEMATICS CURRICULUM Algebra 2 for Pre-Calculus (#9300) Description This course is a rigorous extension of earlier mathematics courses in preparation for Pre-Calculus. Students will build upon prior
Tri-District Mathematics Curriculum 2010 Algebra I
 Tri-District Mathematics Curriculum 2010 Algebra I Mr. Patrick Fletcher Superintendent River Dell Regional Schools Ms. Lorraine Brooks Principal River Dell High School Mr. Richard Freedman Principal River
School District of Marshfield Course Syllabus
 School District of Marshfield Course Syllabus Course Name: Algebra I Length of Course: 1 Year Credit: 1 Program Goal(s): The School District of Marshfield Mathematics Program will prepare students for
Algebra I Curriculum Crosswalk
 Algebra I Curriculum Crosswalk The following document is to be used to compare the 2003 North Carolina Mathematics Course of Study for Algebra I and the State s for Mathematics Algebra I course. As noted
Subject Algebra 1 Unit 1 Relationships between Quantities and Reasoning with Equations
 Subject Algebra 1 Unit 1 Relationships between Quantities and Reasoning with Equations Time Frame: Description: Work with expressions and equations through understanding quantities and the relationships
NRSD Curriculum - Algebra 1
 NUMBER AND QUANTITY The Real Number System NRSD Curriculum - Algebra 1 Extend the properties of exponents to rational exponents. 9-12.N-RN.1 Explain how the definition of the meaning of rational exponents
Sequence of Algebra 1 Units Aligned with the California Standards
 Sequence of Algebra 1 Units Aligned with the California Standards Year at a Glance Unit Big Ideas Math Algebra 1 Textbook Chapters Dates 1. Equations and Inequalities Ch. 1 Solving Linear Equations MS
Eighth Grade Algebra I Mathematics
 Description The Appleton Area School District middle school mathematics program provides students opportunities to develop mathematical skills in thinking and applying problem-solving strategies. The framework
CCGPS Frameworks Student Edition. Mathematics. 8 th Grade Unit 4: Functions
 CCGPS Frameworks Student Edition Mathematics 8 th Grade Unit 4: Functions These materials are for nonprofit educational purposes only. Any other use may constitute copyright infringement. The contents
Algebra II/Advanced Algebra Content Standards
 Algebra II/Advanced Algebra Content Standards The Real Number System N.RN Extend the properties of exponents to rational exponents. MGSE9-12.N.RN.1. Explain how the meaning of rational exponents follows
Algebra 1 Syllabus
 Algebra 1 Syllabus 2017-18 dennis_jenkins@crpusd.org Welcome to algebra, a course designed to prepare students for geometry and any other courses taken after it. Students are required by the state of California
Algebra , Martin-Gay
 A Correlation of Algebra 1 2016, to the Common Core State Standards for Mathematics - Algebra I Introduction This document demonstrates how Pearson s High School Series by Elayn, 2016, meets the standards
Relations and Functions
 Algebra 1, Quarter 2, Unit 2.1 Relations and Functions Overview Number of instructional days: 10 (2 assessments) (1 day = 45 60 minutes) Content to be learned Demonstrate conceptual understanding of linear
Standards for Mathematical Practice
 Algebra I A1 Algebra I emphasizes linear and quadratic expressions, equations, and functions. This course also introduces students to polynomial and exponential functions with domains in the integers.
Algebra I, 1st 4.5 weeks
 The following practice standards will be used throughout the 4.5 weeks:. Make sense of problems and persevere in solving them. 2. Reason abstractly and quantitatively. 3. Construct viable arguments and
Overview of Structure and Content
 Introduction The Math Test Specifications provide an overview of the structure and content of Ohio s State Test. This overview includes a description of the test design as well as information on the types
Mathematics. Unit 2: Reasoning with Equations and Inequalities
 CCGPS Frameworks Student Edition Mathematics CCGPS Coordinate Algebra Unit 2: Reasoning with Equations and Inequalities These materials are for nonprofit educational purposes only. Any other use may constitute
Curriculum Map Algebra I Quarter 1
 Quarter 1 How can algebra describe the relationship between sets of numbers? Algebra Creating Equations AI.A.CED.1 * Create equations and inequalities in one variable and use them to solve problems. Include
Algebra 1 Unit & Lesson Overviews Mathematics
 Unit:1.1 Equations Days : 11 How do you interpret, evaluate and write algebraic expressions that model real-world situations? What are some of the different methods for solving linear equations? How can
California Common Core State Standards for Mathematics Standards Map Mathematics I
 A Correlation of Pearson Integrated High School Mathematics Mathematics I Common Core, 2014 to the California Common Core State s for Mathematics s Map Mathematics I Copyright 2017 Pearson Education, Inc.
Mathematics. Number and Quantity The Real Number System
 Number and Quantity The Real Number System Extend the properties of exponents to rational exponents. 1. Explain how the definition of the meaning of rational exponents follows from extending the properties
Honours GSE & GSE Algebra II / Advanced Algebra Unit 2: Operations with Polynomials
 Honours GSE & GSE Algebra II / Advanced Algebra Unit 2: Operations with Polynomials STANDARDS ADDRESSED IN THIS UNIT Perform arithmetic operations on polynomials MGSE9-12.A.APR.1 Add, subtract, and multiply
Math 2 Unit 5: Comparing Functions and Modeling
 Approximate Time Frame: 2-3 Weeks Connections to Previous Learning: In Math 1, students studied linear and exponential functions and compared them in a modeling context. Students looked at multiple representations
Algebra I, Common Core Correlation Document
 Resource Title: Publisher: 1 st Year Algebra (MTHH031060 and MTHH032060) University of Nebraska High School Algebra I, Common Core Correlation Document Indicates a modeling standard linking mathematics
Mathematics High School Algebra I
 Mathematics High School Algebra I All West Virginia teachers are responsible for classroom instruction that integrates content standards and mathematical habits of mind. Students in this course will focus
Curriculum Scope & Sequence. Subject/Grade Level: MATHEMATICS/HIGH SCHOOL (GRADE 7, GRADE 8, COLLEGE PREP)
") BOE APPROVED 9/27/11 Curriculum Scope & Sequence Subject/Grade Level: MATHEMATICS/HIGH SCHOOL Course: ALGEBRA I (GRADE 7, GRADE 8, COLLEGE PREP) Unit Duration Common Core Standards / Unit Goals Transfer
BOE APPROVED 9/27/11 Curriculum Scope & Sequence Subject/Grade Level: MATHEMATICS/HIGH SCHOOL Course: ALGEBRA I (GRADE 7, GRADE 8, COLLEGE PREP) Unit Duration Common Core Standards / Unit Goals Transfer
Unit 3 Radical and Rational Functions Algebra 2
 Number of Days: 29 11/27/17 1/19/18 Unit Goals Stage 1 Unit Description: A theme of Unit 3 is that the arithmetic of rational expressions is governed by the same rules as the arithmetic of rational numbers.
Math 3 Unit 5: Polynomial and Rational Representations and Modeling
 Approximate Time Frame: 5-6 weeks Connections to Previous Learning: In Math 1 and 2, students worked with one-variable equations. They studied linear, exponential and quadratic functions and compared them
Integrated CME Project Mathematics I-III 2013
 A Correlation of -III To the North Carolina High School Mathematics Math I A Correlation of, -III, Introduction This document demonstrates how, -III meets the standards of the Math I. Correlation references
Sequenced Units for the Common Core State Standards in Mathematics High School Algebra I
 In the three years prior to Algebra I, students have already begun their study of algebraic concepts. They have investigated variables and expressions, solved equations, constructed and analyzed tables,