EERA. A Computer Program for Equivalent-linear Earthquake site Response Analyses of Layered Soil Deposits. J. P. BARDET, K. ICHII, and C. H.
|
|
|
- April Nicholson
- 5 years ago
- Views:
Transcription

1 t Department of Civil Engineering EERA A Computer Program for Equivalent-linear Earthquake site Response Analyses of Layered Soil Deposits by J. P. BARDET, K. ICHII, and C. H. LIN August 000
2 t Table of Contents 1. INTRODUCTION...1. EQUIVALENT LINEAR MODEL FOR SOIL RESPONSE One-dimensional Stress-Strain Relationship...1. Equivalent Linear Approximation of Nonlinear Stress-strain Response Model Model ONE-DIMENSIONAL GROUND RESPONSE ANALYSIS Free surface, bedrock outcropping and rock outcropping motions Transient Motions Iterative Approximation of Equivalent Linear Response DESCRIPTION OF EERA System requirement, distribution files and download EERA Installing and removing EERA EERA commands EERA worksheets Earthquake data Soil Profile Material stress-strain damping-strain curves Calculation Output (Acceleration) Output (Strain) Output (Ampli) Output (Fourier) Output (Spectra) Running EERA Main features of EERA and comparison with SHAKE Comparison of results from EERA and SHAKE CONCLUSION REFERENCES APPENDIX A: SAMPLE PROBLEM Definition of problem Results APPENDIX B: COMPARISON OF EERA AND SHAKE91 RESULTS...37
3 1. INTRODUCTION During past earthquakes, the ground motions on soft soil sites were found to be generally larger than those of nearby rock outcrops, depending on local soil conditions (e.g., Seed and Idriss, 1968). These amplifications of soil site responses were simulated using several computer programs that assume simplified soil deposit conditions such as horizontal soil layers of infinite extent. One of the first computer programs developed for this purpose was SHAKE (Schnabel et al., 197). More than 5 years after its release, SHAKE is still commonly used and referenced computer programs in geotechnical earthquake engineering. SHAKE computes the response in a horizontally layered soil-rock system subjected to transient and vertical travelling shear waves. SHAKE is based on the wave propagation solutions of Kanai (1951), Roesset and Whitman (1969), and Tsai and Housner (1970). SHAKE assumes that the cyclic soil behavior can be simulated using an equivalent linear model, which is extensively described in the geotechnical earthquake engineering literature (e.g., Idriss and Seed, 1968; Seed and Idriss, 1970; and Kramer, 1996). SHAKE was modified many times (e.g., frequency-dependent equivalent strain; Sugito, 1995). SHAKE91 is one of the most recent versions of SHAKE (Idriss and Sun, 199). In 1998, the computer program EERA was developed in FORTRAN 90 starting from the same basic concepts as SHAKE. EERA stands for Equivalent-linear Earthquake Response Analysis. EERA is a modern implementation of the well-known concepts of equivalent linear earthquake site response analysis. EERA's implementation takes full advantages of the dynamic array dimensioning and matrix operations in FORTRAN 90. EERA's input and output are fully integrated with the spreadsheet program Excel. Following the introduction, the second section of this report reviews the theory of equivalent linear soil model, and one-dimensional ground response analysis. The two appendices contain a sample problem and comparison between EERA and SKAKE91 results.. EQUIVALENT LINEAR MODEL FOR SOIL RESPONSE.1 One-dimensional Stress-Strain Relationship The equivalent linear model represents the soil stress-strain response based on a Kelvin-Voigt model as illustrated in Fig. 1. The shear stress τ depends on the shear strain γ and its rate γ& as follows: τ = G γ + ηγ& (1) where G is shear modulus and η the viscosity. In a one-dimensional shear beam column, the shear strain and its rate are defined from the horizontal displacement u(z,t) at depth z and time t as follows: γ u ( z, t) z = and γ ( z, t) u( z, t) γ = = t z t & () γ γ τ G G γ η η γ Figure 1. Schematic representation of stress-strain model used in equivalent-linear model. 1
4 In the case of harmonic motion, the displacement, strain and strain rate are: u( z, t) = U ( z) e i t ω, du γ ( z, t) Γ ) dz iωt iωt = e = ( z e and γ ( z, t) = iωγ( z, t) & (3) where U(z) and Γ(z) are the amplitude of displacement and shear strain, respectively. Using Eq. 3, the stress-strain relation (i.e., Eq. 1) becomes in the case of harmonic loadings: iωt du iωt * du iω t * τ( z, t) = Σ( z) e = ( G + iωη) e = G e = G γ( z, t) (4) dz dz where G * is the complex shear modulus and Σ(z) is the amplitude of shear stress. After introducing the critical damping ratio ξ so that ξ = ωη/g, the complex shear modulus G * becomes: * G = G + iωη = G( 1+ iξ) (5) The energy dissipated W d during a complete loading cycle is equal to the area generated by the stress-strain loop, i.e.: W d = τ c τ dγ (6) In the case of strain-controlled harmonic loading of amplitude γ c (i.e., becomes: γ t ) = γ ( ), Eq. 6 e iωt c t + π ω [ ] dγ W = τ d Re ( t) Re t dt (7) dt where only the real parts of the stress and strain rate are considered (Meirovitch, 1967). Using Eq. 4, the real parts of stress and strain rate are: Re Finally, Eq. 7 becomes: W d dγ = and Re = γ cωsin ωt dt [ τ( t) ] γc ( G cosωt ωηsin ωt ) 1 t π ω = ωγ c [ G sin ωt + ωη(1 cosωt )] dt = πωηγ c + (9) t The maximum strain energy stored in the system is: W s 1 1 τ cγc = Gγ = (10) c The critical damping ratio ξ can be expressed in terms of W d and W s as follows: W ξ 4π W d = (11) s. Equivalent Linear Approximation of Nonlinear Stress-strain Response The equivalent linear approach consists of modifying the Kelvin-Voigt model to account for some types of soil nonlinearities. The nonlinear and hysteretic stress-strain behavior of soils is approximated during cyclic loadings as shown in Fig.. The equivalent linear shear modulus, G, (8)
5 is taken as the secant shear modulus G s, which depends on the shear strain amplitude γ. As shown in Fig. a, G s at the ends of symmetric strain-controlled cycles is: τ γ c G s = (1) c where τ c and γ c are the shear stress and strain amplitudes, respectively. The equivalent linear damping ratio, ξ, is the damping ratio that produces the same energy loss in a single cycle as the hysteresis stress-strain loop of the irreversible soil behavior. Examples of data for equivalent linear model can be found in Hardin and Drnevitch (1970), Kramer (1996), Seed and Idriss (1970), Seed et al. (1986), Sun et al. (1988), and Vucetic and Dobry (1991). Stress (τ) G max τ c 1 Gsec G sec γ c Strain (γ) Gsec, ξ ξ Shear strain (log scale) (a) (b) Figure. Equivalent-linear model: (a) Hysteresis stress-strain curve; and (b) Variation of secant shear modulus and damping ratio with shear strain amplitude. In site response analysis, the material behavior is generally specified as shown in Fig. b. The G s -γ curves cannot have arbitrary shapes as they derive from τ γ stress-strain curves. For instance, the exclusion of strain-softening from the τ γ curves imposes some restrictions on the corresponding G s -γ curves. Strain softening is a real physical phenomen which corresponds to a decrease in stress with strain. Its inclusion requires complicated numerical techniques that are beyond the scope of most enginering site responses. Without these special techniques, strainsoftening has been shown to create ill-posed boundary value problems, and undesirable numerical effects such as numerical solutions that dependent strongly on spatial discretization (i.e., mesh geometry). The exclusion of strain-softening implies that: dτ dγ dgs = G ( γ) + γ 0 dγ s (13) In the case of G s -γ curves specified with discrete points (G i, γ i ), Eq. 13 becomes: G G s max Gs ( γ) γ G γ max (14) where G s is the decrease in G s corresponding to the increase γ in γ, and G max is the maximum value of G s. Eq. 14 is equivalent to: G i+ 1 G i γ i+ 1 γ (15) i 3
6 Figure 3 illustrates a particular case of strain-softening, which is clearly visible on a stress-strain response but difficult to detect from a G s -γ curve. Shear stress τ/τ max and G/G max Stress-strain G/Gmax Shear strain γ Shear stress τ/τ max and G/G max Stressstrain G/Gmax Shear strain γ Softening Figure 3. An example of strain softening in τ/τ max and G/G max curves plotted in linear and semilogarithmic scales. As shown in Fig. b, the equivalent linear model specifies the variation of shear modulus and damping ratio with shear strain amplitude. Additional assumptions are required to specify the effects of frequency on stress-strain relations. For this purpose, two basic models have been proposed...1 Model 1 Model 1 is used in the original version of SHAKE (Schnabel et al., 197). It assumes that ξ is constant and independent of ω, which implies that the complex modulus G * is also independent of ω. The dissipated energy during a loading cycle is: W πw ξ = πξ Gγ = πηγ ω d = (16) 4 s c c The dissipated energy increases linearly with ξ, and is independent of ω, which implies that the area of stress-strain loops is frequency independent. The amplitudes of complex and real shear modulus are related through: * G = G 1+ 4ξ (17) which implies that G * increases with ξ. Figure 4 shows the variation of G * /G with ξ. The amplitude of the complex shear modulus can vary as much as 1 % when ξ reaches 5%. 4
7 .5 G* /G Critical Damping Ratio ξ Figure 4. Normalized variation of complex shear modulus amplitude with critical damping ratio (Model 1)... Model Model is used in SHAKE 91 (Idriss and Sun, 199). It assumes that the complex shear modulus is a function of ξ: {( 1 ξ ) } + ξ ξ G * = G i 1 (18) The assumption above is a constitutive assumption that pertains to the description of material behavior. It implies that the complex and real modulus have the same amplitude, i.e.: G{ (1 ) + 4ξ (1 ξ } G * G = ) = The energy dissipated during a loading cycle is: W 1 ξ (19) t π ω d = ωγ c + Gξ 1 ξ dt = π Gξ 1 ξ γc (0) t Figure 5 shows the variation of dissipated energy with ξ. The dissipated energy of model tends toward zero as tends toward 1. For practical purposes, ξ is usually less than 5%. Under these conditions, the energies dissipated by Models 1 and are similar. 5
8 1 Dissipated Energy W d/( G c ) Model 1 Model Critical Damping Ratio ξ Figure 5. Normalized variation of energy dissipated per loading cycle as a function of critical damping ratio for models 1 and. 3. ONE-DIMENSIONAL GROUND RESPONSE ANALYSIS Figure 6 schematizes the assumptions of one-dimensional equivalent linear site response analysis. As shown in Fig. 6, a vertical harmonic shear wave propagates in a one-dimensional layered system. The one-dimensional equation of motion for vertically propagating shear waves is: ρ u t τ z = (1) where ρ is the unit mass in any layer. Assuming that the soil in all layers behaves as a Kelvin- Voigt solid (i.e., Eq. 1), Eq. becomes: ρ η 3 u t = G u z + u z t () 6
9 Layer Coordinate Properties Thickness u1 1 z1 u G1 ξ 1 ρ 1 h1 z um m zm um+1 Gm ξ m ρ m hm m+1 zm+1 u m+ Gm+1 ξ m+1 ρ m+1 hm+1 m+ zm+ un N zn GN ξ N ρ N hn= Figure 6. One-dimensional layered soil deposit system (after Schnabel et al., 197). For harmonic waves, the displacement can be written as: u z t U z e i ω (, ) = ( ) t (3) Using Eq. 3, Eq. becomes: d U ( G + iωη) = ρω U dz and admits the following general solution: ik z U ( x) = Ee + Fe * ik* z (4) (5) where k * ρω ρω = = * G + iωη G is the complex wave number. After introducing the critical damping ratio ξ so that ξ = ωη/g, the complex shear modulus G * becomes: * G = G + iωη = G( 1+ iξ) (6) The solution of Eq. 4 is: u( z, t) and the corresponding stress is: ik* z ik* z iωt = ( Ee + Fe ) e (7) * * * * τ( z, t) = ik G ( Ee Fe ) e ik z ik z iωt (8) The displacements at the top (z = 0) and bottom ( z = h m ) of layer m of thickness h m are: u m ( 0, t) + iωt = um = ( Em Fm ) e and u m ( h m, t) * * ikmhm ik mhm iωt = ( Eme + Fm e ) e (9) 7
10 The shear stresses at the top and bottom of layer m are: τ (0, t) ) m * * iωt = ikmgm ( Em Fm e and m m * * * ikmhm ik mhm iωt = ik * mgm ( Eme Fm e e (30) τ ( h, t) ) At the interface between layers m and m+1, displacements and shear stress must be continuous, which implies that: u ( h, t) = u 1(0, t) and ( h, t) =τ 1(0, t) m m m+ τ (31) m m m+ Using Eqs. 9 to 31 the coefficients E m and F m are related through: ikmhm E + F = E e + F e E m+ 1 m+ 1 m * * k mhm m * * k G * * m m ik mhm ik mhm Fm = ( Eme Fm e ) * * k G m m+ 1 m + 1 (3) (33) Eqs. 3 and 33 give the following recursion formulas for amplitudes E m+1 and F m+1 in terms of E m and F m : where 1 ik h 1 m m ikmhm Em+ 1 = Em ( 1+ * * m ) e + Fm ( 1 * * α α m ) e (34) 1 ik h 1 m m ikmhm Fm + 1 = Em ( 1 * * m ) e + Fm ( 1+ * * α α m ) e (35) * α m is the complex impedance ratio at the interface between layers m and m+1: α * m k G = = k ρ G ρ * * * m m m m * * * m+ 1G m+ 1 m+ 1G m+ 1 (36) The recursive algorithm is started at the top free surface, for which there is no shear stress: which implies: * * iωt τ 0, t) = ik G ( E F ) e 0 (37) 1 ( = E = F (38) 1 1 Eqs. 34 and 35 are then applied successively to layers to m. The transfer function A mn relating the displacements at the top of layers m and n is defined by A The velocity ( z, t) u E + F m m m mn(ω ) = = (39) un En + Fn u& and acceleration u& ( z, t) & are related to displacement through: u u u & ( z, t) = = iω u( z, t) and (, ) u& z t = = ω u ( z, t ) t t & (40) Therefore A mn is also the transfer function relating the velocities and diplacements at the top of layers m and n: A u u& u&& E + F m m m m m mn(ω ) = = = = (41) un u& n u&& n En + Fn 8
11 The shear strain at depth z and time t can be derived from Eq. 5: u * * * γ( z, t) = = ik ( Ee Fe ) e z ik z ik z iωt The corresponding shear stress at depth z and time t is: * τ ( z, t) = G γ( z, t) (43) 3.1 Free surface, bedrock outcropping and rock outcropping motions Figure 7 defines four terms used in site response analysis. The free surface motion is the motion at the surface of a soil deposit. The bedrock motion is the motion at the base of the soil deposit. The rock outcropping motion is the motion at a location where bedrock is exposed at the ground surface. (4) Free surface motion E1 Rock outcroppi ng motion E N E N +F N Bedrock motion Incoming motion E N Figure 7. Terminology used in site response analysis. As shown in Fig. 7, the incoming shear wave that propagates vertically upward has for amplitude E N through the bedrock. The bedrock motion has for amplitude E N +F N at the top of the bedrock under the soil layers. The bedrock outcropping motion is E N, because there is no shear stress (i.e., E N = F N ) on free surfaces. Therefore the transfer function relating the bedrock motion and bedrock outcropping motion is: A E N NN (ω) = (44) E + F N N When it is assumed that E 1 = F 1 = 1 on free surface, then the transfer function relating the free surface motion and rock outcropping motion is: 1 A 1 N ( ω ) = (45) E 3. Transient Motions N The theory above for the one-dimensional soil column response was presented for steady state harmonic motions, i.e., in the frequency domain. It can be extended to the time histories of transient motions using Fourier series (e.g., Bendat and Piersol, 1986). A real-valued or complexvalued function x (t) can be approximated by a discrete series of N values as follows: x n = N 1 k= 0 X k e iω ktn = N 1 k = 0 X k e iω kn t = N 1 k = 0 X k e πikn/ N n = 0,, N-1 (46) 9
12 The values x n correspond to times t n = n t where t is the constant time interval (i.e., x(n t) = x n for n = 0,, N-1). The discrete frequencies ω k are: k ωk = π k = 0,, N-1 (47) N t The Fourier components are: X m = 1 1 N N k= 0 x e n πikm/ N m = 0,, N-1 (48) The coefficients X m are calculated by the Fast Fourier Transform algorithm, which was originally developed by Cooley and Tukey (1965). The number of operations scales as N logn, which justifies the name of Fast Fourier Transform (i.e., FFT). 3.3 Iterative Approximation of Equivalent Linear Response As previously described in Fig. 3, the equivalent linear model assumes that the shear modulus and damping ratio are functions of shear strain amplitude. In SHAKE, the values of shear modulus and damping ratio are determined by iterations so that they become consistent with the level of strain induced in each layer. As shown in Fig. 8, the values of G 0 and ξ 0 are initialized at their small strain values, and the maximum shear strain γ max and effective shear strain γ eff1 are calculated. Then the compatible values G 1 and ξ 1 corresponding to γ 1 eff are found for the next iteration. The equivalent linear analysis is repeated with new values of G and ξ until the values of G and ξ are compatible with the strain induced in all layers. The iteration procedure for equivalent linear approach in each layer is as follows: 1. Initialize the values of G i and ξ i at their small strain values.. Compute the ground response, and get the amplitudes of maximum shear strain γ max from the time histories of shear strain in each layer. 3. Determine the effective shear strain γ eff from γ max : γ i eff i = R γ max (49) γ where R γ is the ratio of the effective shear strain to maximum shear strain, which depends on the earthquake magnitude. R γ is specified in input; it accounts for the number of cycles during earthquakes. R γ is the same for all layers. 4. Calculate the new equivalent linear values G i+1 and ξ i+1 corresponding to the effective shear strain γ eff. 5. Repeat steps to 4 until the differences between the computed values of shear modulus and damping ratio in two successive iterations fall below some predetermined value in all layers. Generally 8 iterations are sufficient to achieve convergence. 10
13 G 0 Shear modulus G 1 G Damping ratio ξ ξ 1 ξ 0 γ 1 eff γ eff Shear strain amplitude (logarithmic scale) Figure 8. Iteration of shear modulus and damping ratio with shear strain in equivalent linear analysis. 4. DESCRIPTION OF EERA EERA (Equivalent-linear Earthquake site Response Analysis) is a modern implementation of the equivalent-linear concept of earthquake site response analysis, which was previously implemented in the original and subsequent versions of SHAKE (Schnabel et al., 197; and Idriss and Sun, 1991). 4.1 System requirement, distribution files and download EERA EERA requires Windows 95/98/NT and EXCEL 97 or later. EERA does not work for other operating systems and spreadsheet program. All the files required for EERA can be downloaded from in one zip file named EERA.zip, which contains the following files: EERA.xla (389 kb), Microsoft Excel Add-in EERAM.xls (467 kb), Example Startup file (metric units) EERA.xls (3988kB), Example Startup file (British units) EERA.dll (97kB), EERA Dynamic Link Library Diam.acc (1kB), Example earthquake input acceleration file 4. Installing and removing EERA It is recommended to install EERA on your computer system as follows: 1. Copy the distribution files in a new directory on your hard drive. Move EERA.dll and EERA.xla in the same directory of your choice. This is a critical step as these files cannot be moved easily later. 3. In EXCEL, install the Add-in EERA.xla using Tools and Add-ins... As shown in Fig. 9, use Browse to locate EERA.xla. Do not move EERA.xla after installing it. 11

 3.")
14 4. When EERA is properly installed, the EERA menu will appear to the right of the EXCEL pull-down menus (Fig. 10). EERA can be de-installed by using Remove EERA in the EERA pull-down menu. Figure 9. The EXCEL Add-ins menu. Location of EERA pull down menu Figure 10. After a successful installation of EERA, the pull-down menu EERA should appear to the right of EXCEL pull down menus. 4.3 EERA commands As shown in Fig. 11, there are seven commands in the EERA pull-down menu 1. Process Earthquake Data - Read and process earthquake input motion (input/output in worksheet Earthquake). Calculate Compatible Strain - Read profile, material curves, and execute the main iterative calculation (input/output in worksheet Iteration) 3. Calculate Output Acceleration/Velocity/Displacement - Calculate time history of acceleration, relative velocity and displacement at the top of selected sub-layers (input/output in worksheet Acceleration...) Stress/Strain - Calculate stress and strain at the middle of selected sublayers (input/output in worksheets Strain...) 1
 Fourier Spectrum - Calculate Fourier amplitude spectrum of acceleration at the top of selected sub-layer. (input/output in worksheet Fourier.")
15 Amplification - Calculate amplification factors between two sub-layers (input/output in worksheets Ampli...) Fourier Spectrum - Calculate Fourier amplitude spectrum of acceleration at the top of selected sub-layer. (input/output in worksheet Fourier...) Response Spectrum - Calculate all response spectra at the top of selected sub-layers (input/output in worksheet Spectra...) All of the above - Calculate all the output 4. Duplicate Worksheet - Duplicate selected worksheet for defining new material curves, and adding new output (e.g., response spectra for several sub-layers) 5. Delete Worksheet - Delete unnecessary worksheet (some worksheet cannot be deleted) 6. Remove EERA - De-install EERA from EXCEL 7. About EERA - Number of EERA version Figure 11. The EERA pull-down menu. EERA commands are to be used in the following order: 1. Process Earthquake Data. Calculate Compatible Strain 3. Calculate Output 4.4 EERA worksheets As shown in Table 1 and Figs. 1 to 19, an EERA workbook is made of nine types of worksheets, which have predefined names that should not be changed. As indicated in Table 1, six of nine types of worksheet can be duplicated and modified using Duplicate Worksheet in the EERA pulldown menu. This feature is useful for obtaining output at several sub-layers and defining additional material curves. Table 1 also indicates the number of input required in each worksheet. 13
16 Table 1. Types of worksheets in EERA and their contents Worksheet Contents Duplication Number of input Earthquake Earthquake input time history No 7 Mat I Material curves (G/G max and Damping Yes Dependent on number of versus strain for material type i soil layers No Dependent on number of Profile Vertical profile of layers data points per material curve Iteration Results of main calculation No 3 Acceleration Time history of Yes acceleration/velocity/displacement Strain Time history of stress and strain Yes 1 Ampli Amplification between two sub-layers Yes 4 Fourier Fourier amplitude spectrum of Yes acceleration 3 Spectra Response spectra Yes Earthquake data As shown in Fig. 1, Worksheet Earthquake is used to define the earthquake input motion. There are six required entries and one optional entry. All entries are in blue characters. Cell A1: the earthquake name is optional. Cell B: the time step T is the time interval between the evenly spaced data points of the time history of input ground motion. Cell B3: the desired maximum frequency is used to scale the peak amplitude of the input acceleration. Cell B4: the maximum frequency cut-off f max is used to filter the high frequencies from the input acceleration. Cell B5: the frequency cut-off f max can be used to eliminate high frequencies from the input acceleration records. All the calculations will be performed for frequencies between 0 and f max. This option is useful to overcome the overflow calculation errors in Eq. 34 that are usually caused for very high frequencies. Cell B6: the number m of data points in the FFT calculation can be defined. m is generally selected to be larger than the number n of data points in the input acceleration time history. In this case the input record is padded with zero in order to produce a record of length n. Cell B7: The input acceleration can be read from an external data file. EERA is capable of reading many earthquake data formats from external data files. In this case, select Yes in Cell B5, then follow EERA instructions for selecting data format. As shown in Fig. 13, you can open earthquake files of different types, eliminate headers, and select various formats. Header lines are skipped by selecting a starting row number in Fig. 13. If you do not wish to import earthquake data for an external file, you may select No in Cell B5. This option is useful when (1) you have already imported earthquake data, or () you have pasted your own earthquake acceleration time history in column B


17 Figure 1. Worksheet Earthquake. Figure 13. Importing earthquake input data Soil Profile As shown in Fig. 14, Worksheet Profile is used to define the geometry and properties of the soil profile. All input data are in blue cells. Input data can be graphically checked as shown in Fig. 15. Cell A1: the soil profile is optionally named. 15
18 Column C6- : the number of material type is specified for each layer. Each material type i is defined in a separate worksheet called Mat i. Column D6- : each layer may be subdivided in several sub-layers. This feature improves the accuracy of calculations. Column E6- : the thickness of each layer is specified. Column F6- : The small strain values of shear modulus is entered in the unit specified in Cell F5. If this column is left blank then the shear wave velocity must be input in column I6- Column G6- : The initial value of critical damping is only required when the material number on this row is equal to zero, (i.e., no material curve is defined). Column H6- : The total unit weight is entered in the physical unit specified in Cell H5 Column I6- : The shear wave velocity is enter in the physical unit specified in Cell I5. If this column is left blank then the maximum shear modulus must be input in column F6- Column J6- : The location and type of earthquake motion is defined by specifying only once in this column either Outcrop for an outcropping rock motion, or Inside for a non outcropping motion. Column K6- : The depth of the water table can be specified in order to calculate vertical effective stresses. This input is optional as it is only used in the calculation of initial stresses, and not in other calculations. Cell E3: The average shear wave velocity V of the soil profile is calculated as follows: V = 1 N N i = 1 hi i= 1 h v i i where h i is the height of layer i, v i is the shear wave velocity in layer i, and N is the total number of layers. Cell E: The fundamental period T of the soil profile is calculated as T = 4 H/V where H is the total thickness of soil profile and V is the average shear wave velocity of soil profile as calculated in Cell E. Note: The average shear wave velocity V and fundamental period T can also be computed as follows V N i= 1 = N i= 1 h i hi v i and T = 4 N i= 1 hi v i 16

19 Figure 14. Worksheet Profile. 17
20 18

21 Figure 15. Worksheet Profile Material stress-strain damping-strain curves As shown in Fig. 16, several material stress-strain and damping-strain curves can be defined. You may generate additional worksheets for material properties by using Duplicate worksheet from the main EERA menu. Input data can be graphically checked as shown in Fig. 16. Cell A1: the material type is optionally named. Column A3- : the values of shear strain corresponding to ratio G/G max data in column B3- are entered as increasing numbers. Column B3- : Enter the values of ratio G/G max corresponding to strain data in column A3-. Column C3- : the values of shear strain corresponding to critical damping ratio data in column D3- are entered as increasing numbers. Column D3- : Enter the values of critical damping ratio corresponding to strain data in column C3-. Figure 16. Worksheet Mat Calculation As shown in Fig. 17, the worksheet iteration has three entries (shown in blue characters): Cell E1: the number of iterations is specified. Eight iterations are usually enough to achieve a satisfactory convergence. Column E: The ratio of equivalent uniform strain is entered. The ratio of equivalent uniform strain accounts for the effects of earthquake duration. Typically this ratio ranges from 0.4 to 0.75 depending on the input motion and which magnitude earthquake it is intended to represent. The following equation may be used to estimate this ratio (Idriss and Sun, 199): ratio = (M - I)/10 in which M is the magnitude of the earthquake. For example, for M = 5, the ratio would be 0.4. Column E3: the type of linear equivalent model is selected. There are two options: (1) model of the original SHAKE, and () model of SHAKE91. 19


22 Figure 17. Worksheet Iteration Output (Acceleration) As shown in Fig. 18, the worksheet Acceleration defines the time history of acceleration/ relative velocity and relative displacement at a selected sublayer. The worksheet can be duplicated by using Duplicate Worksheet in the EERA menu. Cell D1: The number of selected sublayer is specified. Cell D: The type of selected sublayer is specified. The type can be either outcropping or not outcropping. Figure 18. Worksheet Acceleration. 0
 As shown in Fig.")
23 4.4.6 Output (Strain) As shown in Fig. 19, the worksheet Strain defines the time history of stress, strain and dissipated energy, and stress-strain loops. The worksheet can be duplicated by using Duplicate Worksheet in the EERA menu. Cell D1: The number of selected sublayer is specified. Figure 19. Worksheet Strain Output (Ampli) As shown in Fig. 0, the worksheet Ampli defines the amplification factor between two sublayers. The worksheet can be duplicated by using Duplicate Worksheet in the EERA menu. Cell D1: The number of the first sublayer is specified. Cell D: The type of the first sublayer is specified. It can be either outcropping or not outcropping. Cell D3: The number of the second sublayer is specified. Cell D4: The type of the second sublayer is specified. It can be either outcropping or not outcropping. 1


24 Figure 0. Worksheet Ampli Output (Fourier) As shown in Fig. 1, the worksheet Fourier defines the Fourier spectrum for a selected sublayer. The worksheet can be duplicated by using Duplicate Worksheet in the EERA menu. Cell D1: The number of the selected sublayer is specified. Cell D: The type of the first sublayer is specified. It can be either outcropping or not outcropping. Cell D3: The number of moving averages is specified. This feature filtered noises in the Fourier spectrum. Figure 1. Worksheet Fourier.

25 4.4.9 Output (Spectra) As shown in Fig., the worksheet Spectra defines response spectra for a selected sublayer. The worksheet can be duplicated by using Duplicate Worksheet in the EERA menu. Cell D1: The number of the selected sublayer is specified. Cell D: The type of the first sublayer is specified. It can be either outcropping or not outcropping. Cell D3: The selected value of critical damping ratio for the response spectra. Figure 1. Worksheet Spectra. 4.5 Running EERA EERA is distributed with the example file EERAM.xls. Once you have opened this example file from within EXCEL, you can perform the following operations using the EERA pull-down menu: 1. Process Earthquake Data. Calculate Compatible Strain 3. Calculate Output and All of the Above As you perform these steps above, the output data will be first erased and then recalculated. No user-input in the worksheet is required in this example. Some of the output figures are displayed in Appendix A. You may attempt to define your own problem. EERA input data is in the cells with blue characters. A help message is displayed as you move the cursor to input cells. A suggested way to proceed is as follows: 1. Copy EERAM.xls (or an existing EERA file), and rename it as you like (e.g. Myrun.xls). In Myrun.xls, retype on existing blue cells to enter your data. You may use additional line in worksheets Mat..., Profile and Earthquake 3. If additional material curves or output is required, duplicate worksheets using Duplicate Worksheet 4. Run EERA by using successively 1. Process Earthquake Data. Calculate Compatible Strain 3. Calculate Output and All of the Above 3
26 In general, a EERA site response analysis is performed in three successive steps. Step 1 Define all earthquake data in worksheet Earthquake Use Process Earthquake Data Step Define the soil profile in worksheet Profile Define all the material stress-strain response curves in worksheets Mat... Define the main calculation parameters in worksheet Iteration Use Calculate Compatible Strain Step 3 Define the input parameters in worksheets Acceleration Use Calculate Output and Acceleration/... Define the input parameters in worksheets Strain Use Calculate Output and Stress-Strain Repeat the same process for Ampli, Fourier, and Spectra 4.6 Main features of EERA and comparison with SHAKE EERA and SHAKE91 are based on the same fundamental principles. However their implementations are substantially different. The main differences are: EERA dynamic library is implemented in FORTRAN 90. All matrix and vector calculations are performed without indices. One of the main advantages of FORTRAN 90 over its predecessors is the dynamic dimensioning of arrays. The size of the arrays adapt to the size of the problems, within the limit of the computer available memory. EERA dimensions internally its work arrays depending on the problem size. As a benefit of dynamic dimensioning, there is no limit on the total number of material properties and soil layers in EERA. The sublayers and soil properties are no longer limited to 50 and 13, respectively, as in SHAKE91. As another benefit of dynamic dimensioning, the users can prescribe the number of data points for FFT beyond Larger numbers of data points are useful to describe high frequencies in the calculations. However, longer computation times are likely to result from larger number of data points in the FFT calculations. The relative displacement and velocity can be calculated in sublayers, in the same way as acceleration. The users can select calculations for a filtered or unfiltered object motion. SHAKE91 uses an optional low-pass filter, which eliminates the high frequency response. The high frequency components may be useful for the users interested in dynamic response of structures with high frequency components (e.g., structural equipment). EERA uses an optimized version (IMSL, 1998) of the Cooley and Tukey algorithm for FFT. 4.7 Comparison of results from EERA and SHAKE The results of EERA and SHAKE91 were found to be identical in the example provided with SHAKE91. This comparison is detailed in Appendix B. 5. CONCLUSION EERA is a modern implementation of the equivalent linear concept for earthquake site response analysis, which was previously implemented in SHAKE. EERA is fully integrated with a spreadsheet program EXCEL and gives many new additional features to users, such as unlimited number of soil properties and soil layers, and user-defined number of data points for fast Fourier transform. 4
27 6. REFERENCES 1. Bendat, J. S., and A. G. Piersol, (1986) Random Data, Analysis and Measurement Procedures, John Wiley & Sons, New York, pp Cooley, J. W. and Tukey, J. W. (1965) "An Algorithm for the Machine Calculations of Complex Fourier Series," Mathematics of Computation, Vol. 19, No. 90, pp Hardin, B. O. and Drnevich, V. P. (197) "Shear Modulus and Damping in Soils: I. Measurement and Parameter Effects, " Journal of Soil Mechanics and Foundation Division, ASCE, Vol. 98, No. 6, pp Hardin, B. O. and Drnevich, V. P. (197) "Shear Modulus and Damping in Soils: II. Design Equations and Curves," Journal of Soil Mechanics and Foundation Division, ASCE, Vol. 98, No. 7, pp Idriss, I. M. (1990) "Response of Soft Soil Sites during Earthquakes", Proceedings, Memorial Symposium to honor Professor Harry Bolton Seed, Berkeley, California, Vol. II, May. 6. Idriss, I. M. and Seed, H. B. (1968) "Seismic Response of Horizontal Soil Layers," Journal of the Soil Mechanics and Foundations Division, ASCE, Vol. 94, No. 4, pp Idriss, I. M. and Sun, J. I. (199) User s Manual for SHAKE91, Center for Geotechnical Modeling, Department of Civil Engineering, University of California, Davis. 8. IMSL (1998). Math Library, Chapter 6: Transforms, documentation available from Visual Numerics, Houston, Texas, at pp Kanai, K. (1951) "Relation Between the Nature of Surface Layer and the Amplitude of Earthquake Motions," Bulletin, Tokyo Earthquake Research Institute. 10. Kramer, S. L. (1996). Geotechnical Earthquake Engineering, Prentice Hall, Upper Saddle River, New Jersey, pp Lysmer, J., Seed, H. B. and Schnabel, P. B. (1971) "Influence of Base Rock Characteristics on Ground Response," Bulletin of the Seismological Society of America, Vol. 61, No. 5, pp Matthiesen, R. B., Duke, C. M., Leeds, D. J. and Fraser, J. C. (1964) "Site Characteristics of Southern California Strong-Motion Earthquake Stations, Part Two," Report No Department of Engineering, University of California, Los Angeles. August. 13. Meirovitch, L., (1967) "Analytical Methods in Vibrations," The MacMillan Company, NY, pp Roesset, J. M. and Whitman, R. V. (1969) "Theoretical Background for Amplification Studies," Research Report No. R69-15, Soils Publications No. 31, Massachusetts Institute of Technology, Cambridge. 15. Schnabel, P. B., Lysmer, J., and Seed, H. B. (197) SHAKE: A Computer Program for Earthquake Response Analysis of Horizontally Layered Sites, Report No. UCB/EERC-7/1, Earthquake Engineering Research Center, University of California, Berkeley, December, 10p. 16. Seed, H. B. and Idriss, I. M. (1970) "Soil Moduli and Damping Factors for Dynamic Response Analysis", Report No. UCB/EERC-70/10, Earthquake Engineering Research Center, University of California, Berkeley, December, 48p. 17. Seed, H. B., Wong, R. T., Idriss, I. M. and Tokimatsu, K. (1986) "Moduli and Damping factors for Dynamic Analyses of Cohesionless Soils," Journal of the Geotechnical Engineering Division, ASCE, Vol. 11, No. GTI 1, November, pp Sugito, M. (1995) Frequency-dependent equivalent strain for equi-linearized technique, Proceedings of the First International Conference on Earthquake Geotechnical Engineering, Vol. 1, A. A. Balkena, Rotterdam, the Netherlands, pp Sun, J. I., Golesorkhi, R. and Seed, H. B. (1988) "Dynamic Moduli and Damping Ratios for Cohesive Soils," Report No. UCB/EERC-88/15, Earthquake Engineering Research Center, University of California, Berkeley, 4p. 0. Tsai, N. C., and G. W. Housner, 1970, Calculation of Surface Motions of a Layered Half Space, Bulletin of the Seismological Society of America, Vol. 60, No. 5, pp Vucetic, M. and Dobry, R. (1991) "Effect of Soil Plasticity on Cyclic Response," Journal of the Geotechnical Engineering Division, ASCE, Vol. 111, No. 1, January, pp
 and EERAM.xls (Metric units). 7.1 Definition of problem The sample problem is a 150-ft soil profile consisting of clay and sand overlying a half-space.")
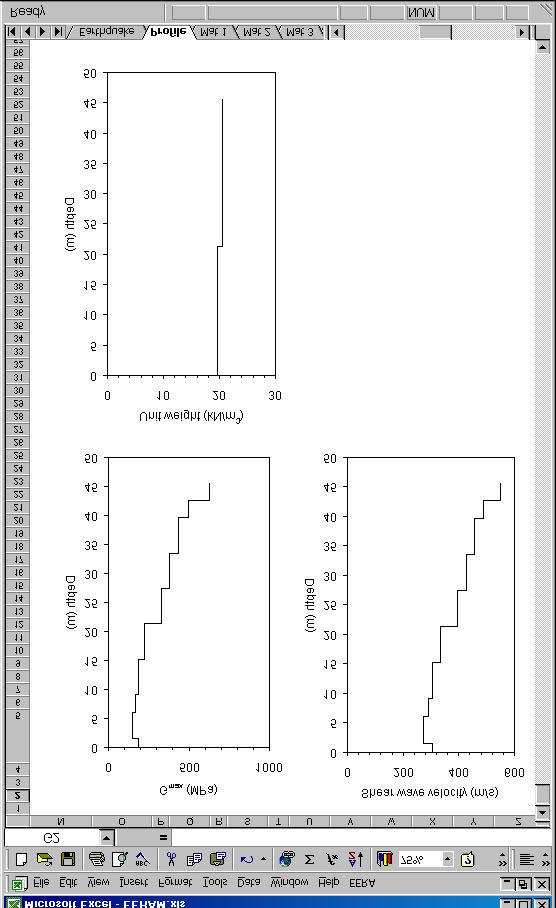
28 7. APPENDIX A: SAMPLE PROBLEM The sample problem is identical to the one used for SHAKE91 (Idriss and Sun, 199). Input data for this sample problem is given in the EXCEL spreadsheets EERA.xls (British units) and EERAM.xls (Metric units). 7.1 Definition of problem The sample problem is a 150-ft soil profile consisting of clay and sand overlying a half-space. The geometry of the soil layers is defined in Fig. A1. The profiles of shear wave velocity and unit weight are shown in Fig. A. The three different types of material properties are defined in Figs. A3 to A5. The input motion is specified as an outcrop motion from the acceleration time history recorded at Diamond Heights (EW component) during the 1989 Loma Prieta earthquake. The ground motion is normalized to a target peak acceleration of 0.1 g (Fig. A6). Figures A1 to A6 shows a snapshot of the actual computer screen. As shown in Figs. A7 and A8 and Table A1, the same results can be displayed and pasted as individual graphs or tables ready for inclusion in technical reports. Figure A1. Definition of soil profile in example problem (EXCEL file EERAM.xls). 6
.")
29 Figure A. Profiles of shear wave velocity and unit weight of sample problem (EXCEL file EERAM.xls). Figure A3. Material properties of material type No.1 (EXCEL file EERAM.xls). 7

. 8")
30 Figure A4. Material properties of material type No. (EXCEL file EERAM.xls). Figure A5. Material properties of material type No.3 (EXCEL file EERAM.xls). 8
 0. 5 0 0 0.0001 0.001 0.01 0.1 1 10 Shear Strain (%) Figure A7.")
31 Figure A6. Time history of input ground motion (EXCEL file EERAM.xls) G/Gmax Shear Modulus Damping Ratio Damping Ratio (%) Shear Strain (%) Figure A7. Modulus reduction and damping ratio curves used for sample problem (material No. 1). 9
32 Table A1. Values of modulus reduction and damping ratio curves used for sample problem. Modulus for clay (Seed and Sun, 1989) upper range and damping for clay (Idriss 1990) Strain (%) G/G max Strain (%) Damping (%) Acceleration (g) Time (sec) Figure A8. Acceleration time history for Diamond Heights during Loma Prieta earthquake. 30

33 7. Results The results of the site response analysis are contained in the EXCEL spreadsheets EERA.xls and EERAM.xls. Some of these results are shown in Figs. A9 to A15. Figure A9 shows the variation with depth of maximum shear strain, ratio G/G max and damping ratio at each of the calculation iteration step. At the first calculation step, the ratio G/G max is equal to 1, and the damping ratio is constant. After a few calculation steps, the distributions of ratio G/G max and damping ratio converge toward their final values. Figure A10 shows the corresponding variation with depth of maximum shear stress during calculations, and the converged maximum acceleration. Figure A11 shows the computed time histories of acceleration, relative velocity and relative displacement at the free surface. The relative displacement and velocity are evaluated relative to the bottom of the soil profile. Figure A1 shows the time histories of shear strain, shear stress and energy dissipated per unit volume, and the stress-strain loop computer at sublayer No. 4 Figure A13 shows the computed amplitude of amplification ratio between bottom and free surface. Figure A14 shows the computed amplitude of Fourier amplitude at free surface. Finally, Fig. A15 displays the acceleration response spectrum computed at free surface for a 5% critical damping ratio. Figure A9. Variation with depth of maximum shear strain, ratio G/G max and damping ratio. 31

34 Figure A10. Variation with depth of maximum shear stress during calculation, and converged maximum acceleration. 3

35 Figure A11. Computed time histories of acceleration, relative velocity and relative displacement at the free surface. 33

36 Figure A1. Computed time histories of shear strain, shear stress and energy dissipated per unit volume, and stress-strain loop at sublayer No


37 Figure A13. Computed amplitude of amplification ratio between bottom and free surface. Figure A14. Computed amplitude of Fourier amplitude at free surface. 35

38 Figure A15. Computed acceleration response spectrum at free surface (5% critical damping ratio). 36
39 8. APPENDIX B: COMPARISON OF EERA AND SHAKE91 RESULTS The results of EERA and SHAKE91 are compared for the particular example problem described in Appendix A. Figures B1 and B show the relative difference in EERA results with respect to those of SHAKE91, including maximum shear strain, maximum acceleration and spectral acceleration. As shown in Fig. B1, the increase in the relative difference of shear strain close to the free surface results from a decrease in absolute values of shear strain close to the free surface. As shown in Fig. B, the increase in the relative difference of spectral acceleration for large period results from the decrease in absolute values of spectral acceleration for large period. In this example, the relative difference was found to be Depth (ft) 75 Depth (ft) Relative difference of maximum shear strain (%) Relative difference of maximum acceleration (%) very negligible for all practical purposes. Figure B-1 Relative difference of maximum shear strain and maximum acceleration between SHAKE91 and EERA 37
40 Relative difference of spectral acceleration (%) Period (sec) Figure B- Relative difference of spectral acceleration calculated by EERA and SHAKE91. 38
A study on nonlinear dynamic properties of soils
 A study on nonlinear dynamic properties of soils * Chih-Hao Hsu ), Shuh-Gi Chern 2) and Howard Hwang 3) ), 2) Department of Harbor and River Engineering, NTOU, Taiwan ) willie2567@hotmail.com 3) Graduate
1D Analysis - Simplified Methods
 1D Equivalent Linear Method Page 1 1D Analysis - Simplified Methods Monday, February 13, 2017 2:32 PM Reading Assignment Lecture Notes Pp. 255-275 Kramer (EQL method) p. 562 Kramer (Trigonometric Notation
A Visco-Elastic Model with Loading History Dependent Modulus and Damping for Seismic Response Analyses of Soils. Zhiliang Wang 1 and Fenggang Ma 2.
 A Visco-Elastic Model with Loading History Dependent Modulus and Damping for Seismic Response Analyses of Soils Zhiliang Wang 1 and Fenggang Ma 2. 1 Senior Associate, AMEC Environment & Infrastructure,
1D Ground Response Analysis
 Lecture 8 - Ground Response Analyses Page 1 1D Ground Response Analysis 1. 2. 3. Dynamic behavior of soils is quite complex and requires models which characterize the important aspects of cyclic behavior,
Analytical and Numerical Investigations on the Vertical Seismic Site Response
 Analytical and Numerical Investigations on the Vertical Seismic Site Response Bo Han, Lidija Zdravković, Stavroula Kontoe Department of Civil and Environmental Engineering, Imperial College, London SW7
Dynamic Analysis Contents - 1
 Dynamic Analysis Contents - 1 TABLE OF CONTENTS 1 DYNAMIC ANALYSIS 1.1 Overview... 1-1 1.2 Relation to Equivalent-Linear Methods... 1-2 1.2.1 Characteristics of the Equivalent-Linear Method... 1-2 1.2.2
QUAKE/W ProShake Comparison
 1 Introduction QUAKE/W Comparison is a commercially available software product for doing one-dimensional ground response analyses. It was developed and is being maintained under the guidance of Professor
Role of hysteretic damping in the earthquake response of ground
 Earthquake Resistant Engineering Structures VIII 123 Role of hysteretic damping in the earthquake response of ground N. Yoshida Tohoku Gakuin University, Japan Abstract Parametric studies are carried out
Dynamic Soil Pressures on Embedded Retaining Walls: Predictive Capacity Under Varying Loading Frequencies
 6 th International Conference on Earthquake Geotechnical Engineering 1-4 November 2015 Christchurch, New Zealand Dynamic Soil Pressures on Embedded Retaining Walls: Predictive Capacity Under Varying Loading
EA (kn/m) EI (knm 2 /m) W (knm 3 /m) v Elastic Plate Sheet Pile
 EI (knm 2 /m) W (knm 3 /m) v Elastic Plate Sheet Pile") 1. Introduction Nowadays, the seismic verification of structures has dramatically evolved. Italy is surrounded many great earthquakes; hence it would be unwise to totally ignore the effects of earthquakes
1. Introduction Nowadays, the seismic verification of structures has dramatically evolved. Italy is surrounded many great earthquakes; hence it would be unwise to totally ignore the effects of earthquakes
ARTICLE IN PRESS. Soil Dynamics and Earthquake Engineering
 Soil Dynamics and Earthquake Engineering 9 (9) 7 7 Contents lists available at ScienceDirect Soil Dynamics and Earthquake Engineering journal homepage: www.elsevier.com/locate/soildyn Site response to
On the Estimation of Earthquake Induced Ground Strains from Velocity Recordings: Application to Centrifuge Dynamic Tests
 6 th International Conference on Earthquake Geotechnical Engineering 1-4 November 015 Christchurch, New Zealand On the Estimation of Earthquake Induced Ground Strains from Velocity Recordings: Application
FREQUENCY DOMAIN ANALYSIS OF SITE AMPLIFICATION IN LOW SEISMICITY REGIONS
 Paper No. SAISC 1 FREQUENCY DOMAIN ANALYSIS OF SITE AMPLIFICATION IN LOW SEISMICITY REGIONS Mattias SCHEVENELS 1, Geert DEGRANDE ABSTRACT The effect of site amplification can be modeled assuming linear,
SITE ANALYSIS USING RANDOM VIBRATION THEORY
 Transactions, SMiRT-23, Paper ID 050 SITE ANALYSIS USING RANDOM VIBRATION THEORY 1 President APA Consulting, USA Alejandro P. Asfura 1 ABSTRACT This paper compares two methods for the seismic analysis
Evaluation of 1-D Non-linear Site Response Analysis using a General Quadratic/Hyperbolic Strength-Controlled Constitutive Model
 6 th International Conference on Earthquake Geotechnical Engineering -4 November 25 Christchurch, New Zealand Evaluation of -D Non-linear Site Response Analysis using a General Quadratic/Hyperbolic Strength-Controlled
EFFECT OF VARIOUS PARAMETERS ON DYNAMIC PROPERTIES OF BABOLSAR SAND BY CYCLIC SIMPLE SHEAR DEVICE
 4 th International Conference on Earthquake Geotechnical Engineering June 25-28, 27 Paper No. 274 EFFECT OF VARIOUS PARAMETERS ON DYNAMIC PROPERTIES OF BABOLSAR SAND BY CYCLIC SIMPLE SHEAR DEVICE Fardin
RESPONSE SPECTRUM METHOD FOR EVALUATING NONLINEAR AMPLIFICATION OF SURFACE STRATA
 RESPONSE SPECTRUM METHOD FOR EVALUATING NONLINEAR AMPLIFICATION OF SURFACE STRATA Kenji MIURA, Kohji KOYAMADA 2 and Masanori IIBA 3 Structuring Engineering, Hiroshima University, Higashi-hiroshima, Japan
COMPARISON OF EQUIVALENT-LINEAR SITE RESPONSE ANALYSIS SOFTWARE
 10NCEE Tenth U.S. National Conference on Earthquake Engineering Frontiers of Earthquake Engineering July 21-25, 2014 Anchorage, Alaska COMPARISON OF EQUIVALENT-LINEAR SITE RESPONSE ANALYSIS SOFTWARE S.J.
GROUND RESPONSE ANALYSIS FOR SEISMIC DESIGN IN FRASER RIVER DELTA, BRITISH COLUMBIA
 13 th World Conference on Earthquake Engineering Vancouver, B.C., Canada August 1-6, 2004 Paper No. 2104 GROUND RESPONSE ANALYSIS FOR SEISMIC DESIGN IN FRASER RIVER DELTA, BRITISH COLUMBIA Uthaya M. UTHAYAKUMAR
Effect of Soil Amplification on the Response of Base-Isolated Buildings under Near-Fault Earthquakes
 Proceedings of the nd World Congress on Civil, Structural, and Environmental Engineering (CSEE 7) Barcelona, Spain April, 07 Paper No. ICSENM 08 ISSN: 7-9 DOI: 0.9/icsenm7.08 Effect of Soil Amplification
Frequency-Dependent Amplification of Unsaturated Surface Soil Layer
 Frequency-Dependent Amplification of Unsaturated Surface Soil Layer J. Yang, M.ASCE 1 Abstract: This paper presents a study of the amplification of SV waves obliquely incident on a surface soil layer overlying
COMBINED DETERMINISTIC-STOCHASTIC ANALYSIS OF LOCAL SITE RESPONSE
 13 th World Conference on Earthquake Engineering Vancouver, B.C., Canada August 1-6, 24 Paper No. 2533 COMBINED DETERMINISTIC-STOCHASTIC ANALYSIS OF LOCAL SITE RESPONSE Ronaldo I. BORJA, 1 José E. ANDRADE,
EVALUATION OF SEISMIC SITE EFFECTS FOR BANGKOK DEEP BASIN
 EVALUATION OF SEISMIC SITE EFFECTS FOR BANGKOK DEEP BASIN Nakhorn POOVARODOM 1 and Amorntep JIRASAKJAMROONSRI 2 ABSTRACT In this study, seismic site effects of Bangkok focusing on deep basin structures
COMPARISON OF FREQUENCY DEPENDENT EQUIVALENT LINEAR ANALYSIS METHODS
 October 2-7, 28, Beijing, China COMPARISON OF FREQUENCY DEPENDENT EQUIVALENT LINEAR ANALYSIS METHODS Dong-Yeo Kwak Chang-Gyun Jeong 2 Duhee Park 3 and Sisam Park 4 Graduate student, Det. of Civil Engineering,
2D Liquefaction Analysis for Bridge Abutment
 D Liquefaction Analysis for Bridge Abutment Tutorial by Angel Francisco Martinez Integrated Solver Optimized for the next generation 64-bit platform Finite Element Solutions for Geotechnical Engineering
Geotechnical Earthquake Engineering
 Geotechnical Earthquake Engineering by Dr. Deepankar Choudhury Professor Department of Civil Engineering IIT Bombay, Powai, Mumbai 400 076, India. Email: dc@civil.iitb.ac.in URL: http://www.civil.iitb.ac.in/~dc/
BEHAVIOR OF BUILDING FRAMES ON SOILS OF VARYING PLASTICITY INDEX
 International Journal of Civil Engineering and Technology (IJCIET) Volume 8, Issue 1, January 2017, pp. 623 627 Article ID: IJCIET_08_01_072 Available online at http://www.iaeme.com/ijciet/issues.asp?jtype=ijciet&vtype=8&itype=1
EFFECT OF SEISMIC WAVE INCLINATION ON STRUCTURAL RESPONSE
 EFFECT OF SEISMIC WAVE INCLINATION ON STRUCTURAL RESPONSE t I M. Tabatabaie,l A.M. ASCEj N. Abrahamson,2 and J. P. Singh, M. ASCE ABSTRACT A new procedure is developed using the computer program SASSI
ON THE PREDICTION OF EXPERIMENTAL RESULTS FROM TWO PILE TESTS UNDER FORCED VIBRATIONS
 Transactions, SMiRT-24 ON THE PREDICTION OF EXPERIMENTAL RESULTS FROM TWO PILE TESTS UNDER FORCED VIBRATIONS 1 Principal Engineer, MTR & Associates, USA INTRODUCTION Mansour Tabatabaie 1 Dynamic response
SURFACE WAVES AND SEISMIC RESPONSE OF LONG-PERIOD STRUCTURES
 4 th International Conference on Earthquake Geotechnical Engineering June 25-28, 2007 Paper No. 1772 SURFACE WAVES AND SEISMIC RESPONSE OF LONG-PERIOD STRUCTURES Erdal SAFAK 1 ABSTRACT During an earthquake,
Dynamic Analysis of Pile Foundations: Effects of Material Nonlinearity of Soil
 Dynamic Analysis of Pile Foundations: Effects of Material Nonlinearity of Soil Bal Krishna Maheshwari Asst. Professor, Department of Earthquake Engineering, IIT Roorkee, Roorkee, U.A. 247 667, India (Formerly
SEISMIC ANALYSIS OF AN EMBEDDED RETAINING STRUCTURE IN COARSE-GRAINED SOILS
 4 th International Conference on Earthquake Geotechnical Engineering June 25-28, 27 Paper No. 97 SEISMIC ANALYSIS OF AN EMBEDDED RETAINING STRUCTURE IN COARSE-GRAINED SOILS Luigi CALLISTO, Fabio M. SOCCODATO
ICONE20POWER
 Foreword The academic articles here proposed concern some examples of design where the dynamic response of important structures have been analyzed through a campaign of laboratory investigation where a
Liquefaction Assessment using Site-Specific CSR
 Liquefaction Assessment using Site-Specific CSR 1. Arup, Sydney 2. Arup Fellow, Adelaide M. M. L.SO 1, T. I. MOTE 1, & J. W. PAPPIN 2 E-Mail: minly.so@arup.com ABSTRACT: Liquefaction evaluation is often
CHARACTERISING THE NON LINEARITIES OF LACUSTRINE CLAYS IN THE GRENOBLE BASIN
 Third International Symposium on the Effects of Surface Geology on Seismic Motion Grenoble, France, 30 August - September 2006 Paper Number: 8 CHARACTERISING THE NON LINEARITIES OF LACUSTRINE CLAYS IN
Soil Damping Ratio: Theoretical Aspect and Measurement
 Ratio: Theoretical Aspect and Measurement Sri Atmaja P. Rosyidi, Ph.D. Assistant Professor, Universitas Muhammadiyah Yogyakarta A Two Day Workshop on SASW for Practicing Engineer 17-18 February 2011, Faculty
EVALUATION OF SITE CHARACTERISTICS IN LIQUEFIABLE SOILS
 4 th International Conference on Earthquake Geotechnical Engineering June 25-28, 27 Paper No. 1651 EVALUATION OF SITE CHARACTERISTICS IN LIQUEFIABLE SOILS Konstantinos TREVLOPOULOS 1, Nikolaos KLIMIS 2
A three-dimensional extension of the Ramberg-Osgood
 A three-dimensional extension of the Ramberg-Osgood model. Paper Comparison Title Line with 1 other formulations Chitas, P. Cenorgeo, Engenharia Geotécnica, Lda, Portugal J.A. Santos & I.F. Lopes Instituto
SURFACE WAVE MODELLING USING SEISMIC GROUND RESPONSE ANALYSIS
 43 SURFACE WAVE MODELLING USING SEISMIC GROUND RESPONSE ANALYSIS E John MARSH And Tam J LARKIN SUMMARY This paper presents a study of surface wave characteristics using a two dimensional nonlinear seismic
NON-LINEAR ATTENUATION IN SOILS AND ROCKS
 THE PUBLISHING HOUSE PROCEEDINGS OF THE ROMANIAN ACADEMY, Series A, OF THE ROMANIAN ACADEMY Volume 7, Number 3/6, pp. - NON-LINEAR ATTENUATION IN SOILS AND ROCKS Dinu BRATOSIN Institute of Solid Mechanics
Determination of Excess Pore Pressure in Earth Dam after Earthquake
 ABSTRACT: Determination of Excess Pore Pressure in Earth Dam after Earthquake S.M. Nasrollahi Faculty of Islamic Azad University Qaenat Branch, Qaen, Iran. Email: s.m.nasrollahi@gmail.com Pore pressure
Investigation of long period amplifications in the Greater Bangkok basin by microtremor observations
 Proceedings of the Tenth Pacific Conference on Earthquake Engineering Building an Earthquake-Resilient Pacific 6-8 November 2015, Sydney, Australia Investigation of long period amplifications in the Greater
Module 3. DYNAMIC SOIL PROPERTIES (Lectures 10 to 16)
") Module 3 DYNAMIC SOIL PROPERTIES (Lectures 10 to 16) Lecture 15 Topics 3.6 STRESS-STRAIN BEHAVIOR OF CYCLICALLY LOADED SOILS 3.7 SOME BASIC ASPECTS OF PARTICULATE MATTER BEHAVIOR 3.8 EQUIVALENT LINEAR
Module 3 DYNAMIC SOIL PROPERTIES (Lectures 10 to 16) Lecture 15 Topics 3.6 STRESS-STRAIN BEHAVIOR OF CYCLICALLY LOADED SOILS 3.7 SOME BASIC ASPECTS OF PARTICULATE MATTER BEHAVIOR 3.8 EQUIVALENT LINEAR
New Design Spectral Acceleration of Soft and Deep Deposits in Bangkok
 New Design Spectral Acceleration of Soft and Deep Deposits in Bangkok N. Poovarodom & A. Jirasakjamroonsri Department of Civil Engineering, Faculty of Engineering, Thammasat University, Thailand pnakhorn@engr.tu.ac.th
Amplification of Seismic Motion at Deep Soil Sites
 20th International Conference on Structural Mechanics in Reactor Technology (SMiRT 20) Espoo, Finland, August 9-14, 2009 SMiRT 20-Division 5, Paper 1740 Amplification of Seismic Motion at Deep Soil Sites
Dynamic Soil Structure Interaction
 Dynamic Soil Structure Interaction Kenji MIURA, Dr. Eng. Professor Graduate School of Engineering Hiroshima University Dynamic Soil Structure Interaction Chapter 1 : Introduction Kenji MIURA, Dr. Eng.
PACIFIC EARTHQUAKE ENGINEERING RESEARCH CENTER
 PACIFIC EARTHQUAKE ENGINEERING RESEARCH CENTER Identification of Site Parameters that Improve Predictions of Site Amplification Ellen M. Rathje Sara Navidi Department of Civil, Architectural, and Environmental
NONLINEAR SEISMIC SOIL-STRUCTURE (SSI) ANALYSIS USING AN EFFICIENT COMPLEX FREQUENCY APPROACH
 ANALYSIS USING AN EFFICIENT COMPLEX FREQUENCY APPROACH") NONLINEAR SEISMIC SOIL-STRUCTURE (SSI) ANALYSIS USING AN EFFICIENT COMPLEX FREQUENCY APPROACH Dan M. GHIOCEL 1 ABSTRACT The paper introduces a novel approach for modeling nonlinear hysteretic behavior
NONLINEAR SEISMIC SOIL-STRUCTURE (SSI) ANALYSIS USING AN EFFICIENT COMPLEX FREQUENCY APPROACH Dan M. GHIOCEL 1 ABSTRACT The paper introduces a novel approach for modeling nonlinear hysteretic behavior
Micro Seismic Hazard Analysis
 Micro Seismic Hazard Analysis Mark van der Meijde INTERNATIONAL INSTITUTE FOR GEO-INFORMATION SCIENCE AND EARTH OBSERVATION Overview Site effects Soft ground effect Topographic effect Liquefaction Methods
Effects of Multi-directional Shaking in Nonlinear Site Response Analysis: Case Study of 2007 Niigata-ken Chuetsu-oki Earthquake
 6 th International Conference on Earthquake Geotechnical Engineering -4 November 205 Christchurch, New Zealand Effects of Multi-directional Shaking in Nonlinear Site Response Analysis: Case Study of 2007
LIQUEFACTION ASSESSMENT BY THE ENERGY METHOD THROUGH CENTRIFUGE MODELING
 LIQUEFACTION ASSESSMENT BY THE ENERGY METHOD THROUGH CENTRIFUGE MODELING Hesham M. Dief, Associate Professor, Civil Engineering Department, Zagazig University, Zagazig, Egypt J. Ludwig Figueroa, Professor
DYNAMIC ANALYSIS OF PILES IN SAND BASED ON SOIL-PILE INTERACTION
 October 1-17,, Beijing, China DYNAMIC ANALYSIS OF PILES IN SAND BASED ON SOIL-PILE INTERACTION Mohammad M. Ahmadi 1 and Mahdi Ehsani 1 Assistant Professor, Dept. of Civil Engineering, Geotechnical Group,
A SIMPLIFIED METHOD FOR ESTIMATING SHEAR STRAINS FOR OVALING AND RACKING ANALYSIS OF TUNNELS
 4 th International Conference on Earthquake Geotechnical Engineering June 25-28, 27 Paper No. 1142 A SIMPLIFIED METHOD FOR ESTIMATING SHEAR STRAINS FOR OVALING AND RACKING ANALYSIS OF TUNNELS James R.
Seismic site response analysis in Perth Metropolitan area
 Seismic site response analysis in Perth Metropolitan area Jonathan Z. Liang, Hong Hao 2 PhD student, School of Civil and Resource Engineering, The University of Western Australia, Australia, email: lzy@civil.uwa.edu.au
Seismic Analysis of Soil-pile Interaction under Various Soil Conditions
 Seismic Analysis of Soil-pile Interaction under Various Soil Conditions Preeti Codoori Assistant Professor, Department of Civil Engineering, Gokaraju Rangaraju Institute of Engineering and Technology,
USER S MANUAL 1D Seismic Site Response Analysis Example University of California: San Diego August 30, 2017
 USER S MANUAL 1D Seismic Site Response Analysis Example http://www.soilquake.net/ucsdsoilmodels/ University of California: San Diego August 30, 2017 Table of Contents USER'S MANUAL TABLE OF CONTENTS Page
Shear Modulus Degradation of Liquefying Sand: Quantification and Modeling
 Brigham Young University BYU ScholarsArchive All Theses and Dissertations 27-11-13 Shear Modulus Degradation of Liquefying Sand: Quantification and Modeling Peter A. Olsen Brigham Young University - Provo
Soil Properties - II
 Soil Properties - II Amit Prashant Indian Institute of Technology andhinagar Short Course on eotechnical Aspects of Earthquake Engineering 04 08 March, 2013 Seismic Waves Earthquake Rock Near the ground
Dynamic modelling in slopes using finite difference program
 Bulletin of the Department of Geology Bulletin of the Department of Geology, Tribhuvan University, Kathmandu, Nepal, Vol. 12, 2009, pp. 89 94 Dynamic modelling in slopes using finite difference program
SEISMIC RESPONSE OF SINGLE DEGREE OF FREEDOM STRUCTURAL FUSE SYSTEMS
 3 th World Conference on Earthquake Engineering Vancouver, B.C., Canada August -6, 4 Paper No. 377 SEISMIC RESPONSE OF SINGLE DEGREE OF FREEDOM STRUCTURAL FUSE SYSTEMS Ramiro VARGAS and Michel BRUNEAU
Seismic Response of Sedimentary Basin Subjected to Obliquely Incident SH Waves
 6 th International Conference on Earthquake Geotechnical Engineering 1-4 November 215 Christchurch, New Zealand Seismic Response of Sedimentary Basin Subjected to Obliquely Incident SH Waves C. B. Zhu
Some Recent Advances in (understanding) the Cyclic Behavior of Soils
 the Cyclic Behavior of Soils") 39 th SPRING SEMINAR and 19 th LA GEO EXPO American Society of Civil Engineers Geo-Institute, Los Angeles Section Wednesday April 13, 216 Queen Mary, Long Beach, CA 982 Invited lecture: Some Recent Advances
39 th SPRING SEMINAR and 19 th LA GEO EXPO American Society of Civil Engineers Geo-Institute, Los Angeles Section Wednesday April 13, 216 Queen Mary, Long Beach, CA 982 Invited lecture: Some Recent Advances
Dynamic Analysis to Study Soil-Pile Interaction Effects
 by Pallavi Ravishankar, Neelima Satyam in Indexed in Scopus Compendex and Geobase Elsevier, Chemical Abstract Services-USA, Geo-Ref Information Services- USA, List B of Scientific Journals, Poland, Directory
Two-Dimensional Site Effects for Dry Granular Soils
 6 th International Conference on Earthquake Geotechnical Engineering 1-4 November 2015 Christchurch, New Zealand Two-Dimensional Site Effects for Dry Granular Soils D. Asimaki 1 and S. Jeong 2 ABSTRACT
SEISMIC HAZARD AND DESIGN BY USING ENERGY FLUX
 SEISMIC HAZARD AND DESIGN BY USING ENERGY FLUX Erdal SAFAK 1 And Steve HARMSEN SUMMARY Energy flux provides a dynamic measure of seismic energy, and can be used to characterize the intensity of ground
APPENDIX J. Dynamic Response Analysis
 APPENDIX J Dynamic Response Analysis August 25, 216 Appendix J Dynamic Response Analysis TABLE OF CONTENTS J1 INTRODUCTION... 1 J2 EARTHQUAKE TIME HISTORIES... 1 J3 MODEL AND INPUT DATA FOR SITE RESPONSE
ESTIMATION OF THE SMALL-STRAIN STIFFNESS OF GRANULAR SOILS TAKING INTO ACCOUNT THE GRAIN SIZE DISTRIBUTION CURVE
 5th International Conference on Earthquake Geotechnical Engineering, January 211, 1-13, Santiago, Chile. ESTIMATION OF THE SMALL-STRAIN STIFFNESS OF GRANULAR SOILS TAKING INTO ACCOUNT THE GRAIN SIZE DISTRIBUTION
Centrifuge Evaluation of the Impact of Partial Saturation on the Amplification of Peak Ground Acceleration in Soil Layers
 Centrifuge Evaluation of the Impact of Partial Saturation on the Amplification of Peak Ground Acceleration in Soil Layers M. Ghayoomi, Ph.D. A.M.ASCE 1, and J.S. McCartney, Ph.D., P.E., M.ASCE 2 1 Research
In-Structure Response Spectra Development Using Complex Frequency Analysis Method
 Transactions, SMiRT-22 In-Structure Response Spectra Development Using Complex Frequency Analysis Method Hadi Razavi 1,2, Ram Srinivasan 1 1 AREVA, Inc., Civil and Layout Department, Mountain View, CA
K. Tokimatsu 1 and H. Arai 2. Professor, Dept. of Architecture and Building Engineering, Tokyo Institute of Technology, Japan 2
 NONLINEAR SOIL PROPERTIES ESTIMATED FROM DOWNHOLE ARRAY RECORDINGS AT KASHIWAZAKI-KARIWA NUCLEAR POWER PLANT IN THE NIIGATA-KEN CHUETSU-OKI EARTHQUAKES K. Tokimatsu 1 and H. Arai 2 1 Professor, Dept. of
Unloading-Reloading Rule for Nonlinear Site Response Analysis
 6 th International Conference on Earthquake Geotechnical Engineering 1-4 November 015 Christchurch, New Zealand Unloading-Reloading Rule for Nonlinear Site Response Analysis S. Yniesta 1, S. J. Brandenberg
VIBRATION AMPLIFICATION IN OSCILLATING SYSTEMS WITH DEGRADING CHARACTERISTICS *
 VIBRATION AMPIFICATION IN OSCIATING SYSTEMS WITH DEGRADING CHARACTERISTICS * Tudor SIRETEANU 1, Nicolae STOIA 1 The paper is an analysis of the dynamic response of an oscillating system, considering the
2-D Liquefaction Evaluation with Q4Mesh
 2005 Tri-Service Infrastructure Systems Conference and Exhibition 2-D Liquefaction Evaluation with Q4Mesh -David C. Serafini, M.S., P.E. US Army Corps, Sacramento, CA 3 August 2005 2005 Tri-Service ISC
DUCTILITY BEHAVIOR OF A STEEL PLATE SHEAR WALL BY EXPLICIT DYNAMIC ANALYZING
 The 4 th World Conference on arthquake ngineering October -7, 008, Beijing, China ABSTRACT : DCTILITY BHAVIOR OF A STL PLAT SHAR WALL BY XPLICIT DYNAMIC ANALYZING P. Memarzadeh Faculty of Civil ngineering,
Dynamics: Domain Reduction Method. Case study
 Dynamics: Domain Reduction Method. Case study Andrzej Truty c ZACE Services Ltd August 2016 1 / 87 Scope of the lecture Example of a building subject to the earthquake (using Domain Reduction Method (DRM))
CVEEN 7330 Modeling Exercise 2c
 CVEEN 7330 Modeling Exercise 2c Table of Contents Table of Contents... 1 Objectives:... 2 FLAC Input:... 2 DEEPSOIL INPUTS:... 5 Required Outputs from FLAC:... 6 Required Output from DEEPSOIL:... 6 Additional
QUASI-3D DYNAMIC FINITE ELEMENT ANALYSIS OF SINGLE PILES AND PILE GROUPS
 VERSAT P3D Version 006 QUASI-3D DYNAMIC FINITE ELEMENT ANALYSIS OF SINGLE PILES AND PILE GROUPS 000-006 Dr. G. WU 000-006 Wutec Geotechnical International, B.C., Canada Website: www.wutecgeo.com LIMITATION
USER S MANUAL 1D Seismic Site Response Analysis Example University of California: San Diego August 30, 2017
 USER S MANUAL 1D Seismic Site Response Analysis Example http://www.soilquake.net/ucsdsoilmodels/ University of California: San Diego August 30, 2017 Table of Contents USER'S MANUAL TABLE OF CONTENTS Page
EVALUATING RADIATION DAMPING OF SHALLOW FOUNDATIONS ON NONLINEAR SOIL MEDIUM FOR SOIL-STRUCTURE INTERACTION ANALYSIS OF BRIDGES
 EVALUATING RADIATION DAMPING OF SHALLOW FOUNDATIONS ON NONLINEAR SOIL MEDIUM FOR SOIL-STRUCTURE INTERACTION ANALYSIS OF BRIDGES Abstract Jian Zhang 1 and Yuchuan Tang 2 The paper evaluates the radiation
Strong Ground Motion in the 2011 Tohoku Earthquake: a 1Directional - 3Component Modeling
 1 2 Strong Ground Motion in the 2011 Tohoku Earthquake: a 1Directional - 3Component Modeling 3 4 by Maria Paola Santisi d Avila, Jean-François Semblat and Luca Lenti 5 6 7 8 9 10 11 12 13 Corresponding
NON-LINEAR ATTENUATION EFFECTS ON SOILS DYNAMIC RESPONSE EVALUATION *
 1 NON-LINEAR ATTENUATION EFFECTS ON SOILS DYNAMIC RESPONSE EVALUATION * Dinu BRATOSIN 1 The object of this paper is to estimate the structural attenuation in geological site materials with the aid of the
SHAKE TABLE STUDY OF SOIL STRUCTURE INTERACTION EFFECTS ON SEISMIC RESPONSE OF SINGLE AND ADJACENT BUILDINGS
 13 th World Conference on Earthquake Engineering Vancouver, B.C., Canada August 1-6, 2004 Paper No. 1918 SHAKE TABLE STUDY OF SOIL STRUCTURE INTERACTION EFFECTS ON SEISMIC RESPONSE OF SINGLE AND ADJACENT
Session 2: Triggering of Liquefaction
 Session 2: Triggering of Liquefaction Plenary Speaker: Geoff Martin Professor Emeritus University of Southern California What are the primary deficiencies in the simplified method for evaluation of liquefaction
Seismic Site Effects of Soil Amplifications in Bangkok
 Research Article Seismic Site Effects of Soil Amplifications in Bangkok Nakhorn Poovarodom* and Amorntep Jirasakjamroonsri Department of Civil Engineering, Faculty of Engineering, Thammasat University
Small strain behavior of Northern Izmir (Turkey) soils
 soils") 3 r d International Conference on New Developments in Soil Mechanics and Geotechnical Engineering, 28-3 June 212, Near East University, Nicosia, North Cyprus Small strain behavior of Northern Izmir (Turkey)
3 r d International Conference on New Developments in Soil Mechanics and Geotechnical Engineering, 28-3 June 212, Near East University, Nicosia, North Cyprus Small strain behavior of Northern Izmir (Turkey)
2D Embankment and Slope Analysis (Numerical)
") 2D Embankment and Slope Analysis (Numerical) Page 1 2D Embankment and Slope Analysis (Numerical) Sunday, August 14, 2011 Reading Assignment Lecture Notes Other Materials FLAC Manual 1. 2. Homework Assignment
2D Embankment and Slope Analysis (Numerical) Page 1 2D Embankment and Slope Analysis (Numerical) Sunday, August 14, 2011 Reading Assignment Lecture Notes Other Materials FLAC Manual 1. 2. Homework Assignment
Chapter 3 Commentary GROUND MOTION
 Chapter 3 Commentary GROUND MOTION 3.1 GENERAL 3.1.3 Definitions. The Provisions are intended to provide uniform levels of performance for structures, depending on their occupancy and use and the risk
FREQUENCY-DEPENDENT ATTENUATION OF SOILS IN SEISMIC SIMULATION ABSTRACT
 FREQUENCY-DEPENDENT ATTENUATION OF SOILS IN SEISMIC SIMULATION Jiewu Meng 1 and Dariush Motazedian ABSTRACT A seismic simulation is performed on a synthetic soil-rock model with frequencydependent attenuation
BOĞAZİÇİ UNIVERSITY KANDILLI OBSERVATORY AND EARTHQUAKE RESEARCH INSTITUTE CHANGING NEEDS OF ENGINEERS FOR SEISMIC DESIGN
 BOĞAZİÇİ UNIVERSITY KANDILLI OBSERVATORY AND EARTHQUAKE RESEARCH INSTITUTE CHANGING NEEDS OF ENGINEERS FOR SEISMIC DESIGN Erdal Şafak Department of Earthquake Engineering Kandilli Observatory and Earthquake
EQ Ground Motions. Strong Ground Motion and Concept of Response Spectrum. March Sudhir K Jain, IIT Gandhinagar. Low Amplitude Vibrations
 Amplitude Strong Ground Motion and Concept of Response Spectrum March 2013 Sudhir K Jain, IIT Gandhinagar Sudhir K. Jain March 2013 1 EQ Ground Motions Low Amplitude Vibrations Long distance events Usually
Numerical Modeling of Interface Between Soil and Pile to Account for Loss of Contact during Seismic Excitation
 Numerical Modeling of Interface Between Soil and Pile to Account for Loss of Contact during Seismic Excitation P. Sushma Ph D Scholar, Earthquake Engineering Research Center, IIIT Hyderabad, Gachbowli,
To initiate a dynamic analysis in FormWorks, the Analysis Mode in the JOB CONTROL tab of DEFINE JOB window has to be set to one of the two Dynamic
 Dynamic Analysis with VecTor2 This bulletin describes the dynamic analysis facilities within VecTor2. Details of VecTor2 and FormWorks can be found in the VecTor2 and FormWorks Manual (Vecchio and Wong,
Dynamic Analysis Using Response Spectrum Seismic Loading
 Dynamic Analysis Using Response Spectrum Seismic Loading Paleti Teja M.Tech (Structural Engineering) Department of Civil Engineering Jogaiah Institute of Technology & Sciences College of Engineering Kalagampudi,
FREQUENCY DEPENDENT EQUIVALENT-LINEARIZED TECHNIQUE FOR FEM RESPONSE ANALYSIS OF GROUND
 FREQUENCY DEPENDENT EQUIVALENT-LINEARIZED TECHNIQUE FOR FEM RESPONSE ANALYSIS OF GROUND Yoshinori FURUMOTO 1, Masata SUGITO 2 And Atsushi YASHIMA 3 SUMMARY A frequency-dependent equivalent linearized technique
USER S MANUAL. 1D Seismic Site Response Analysis Example. University of California: San Diego.
 USER S MANUAL 1D Seismic Site Response Analysis Example http://www.soilquake.net/ucsdsoilmodels/ University of California: San Diego August 2, 2017 Table of Contents USER'S MANUAL TABLE OF CONTENTS Page
A THEORETICAL MODEL FOR SITE COEFFICIENTS IN BUILDING CODE PROVISIONS
 13 th World Conference on Earthquake Engineering Vancouver, B.C., Canada August 1-6, 2004 Paper No. 3029 A THEORETICAL MODEL FOR SITE COEFFICIENTS IN BUILDING CODE PROVISIONS Roger D. Borcherdt 1 SUMMARY
ALASKA ENERGY AUTHORITY AEA ENGINEERING FEASIBILITY REPORT. Appendix B8. Finite Element Analysis
 ALASKA ENERGY AUTHORITY AEA11-022 ENGINEERING FEASIBILITY REPORT Appendix B8 Finite Element Analysis Susitna-Watana Hydroelectric Project Alaska Energy Authority FERC Project No. 14241 December 2014 Seismic
INFLUENCE OF A LOW RESISTANCE LAYER ON SEISMIC SOIL RESPONSE USING CYBERQUAKE
 INFLUENCE OF A LOW RESISTANCE LAYER ON SEISMIC SOIL RESPONSE USING CYBERQUAKE Myriam BOUR 1, Daniel CHASSAGNEUX And Pierre MOUROUX SUMMARY In this paper, numerical investigations are conducted to globally
Chapter 6: Determination of Seismologic Parameters for Proposed Liquefaction Evaluation Procedure
 Chapter 6: Determination of Seismologic Parameters for Proposed Liquefaction valuation Procedure 6.1 Introduction The motivation for developing the liquefaction evaluation procedure presented in Chapter