Oblique propagation of whistler mode waves in the chorus source region
|
|
|
- Buck Tate
- 6 years ago
- Views:
Transcription
1 Click Here for Full Article JOURNAL OF GEOPHYSICAL RESEARCH, VOL. 114,, doi: /2009ja014586, 2009 Oblique propagation of whistler mode waves in the chorus source region O. Santolík, 1,2 D. A. Gurnett, 3 J. S. Pickett, 3 J. Chum, 4 and N. Cornilleau-Wehrlin 5,6 Received 19 June 2009; revised 31 July 2009; accepted 28 August 2009; published 15 December [1] Whistler mode chorus has been shown to play a role in the process of local acceleration of electrons in the outer Van Allen radiation belt. Most of the quasi-linear and nonlinear theoretical studies assume that the waves propagate parallel to the terrestrial magnetic field. We show a case where this assumption is invalid. We use data from the Cluster spacecraft to characterize propagation and spectral properties of chorus. The recorded high-resolution waveforms show that chorus in the source region can be formed by a succession of discrete wave packets with decreasing frequency that sometimes change into shapeless hiss. These changes occur at the same time in the entire source region. Multicomponent measurements show that waves in both these regimes can be found at large angles to the terrestrial magnetic field. The hiss intervals contain waves propagating less than one tenth of a degree from the resonance cone. In the regime of discrete wave packets the peak of the wave energy density is found at a few degrees from the resonance cone in a broad interval of azimuth angles. The wave intensity increases with the distance from the magnetic field minimum along a given field line, indicating a gradual amplification of chorus in the source region. Citation: Santolík, O., D. A. Gurnett, J. S. Pickett, J. Chum, and N. Cornilleau-Wehrlin (2009), Oblique propagation of whistler mode waves in the chorus source region, J. Geophys. Res., 114,, doi: /2009ja Introduction [2] Whistler mode chorus is an intense and highly structured magnetospheric wave emission composed of discrete wave packets with variable frequencies. It is considered as a local source for acceleration of electrons to relativistic energies in the outer Van Allen radiation belt [e.g., Horne, 2007]. Numerous theoretical studies have been recently published concerning generation of whistler mode chorus and its effects on the outer Van Allen radiation belt, using both quasi-linear [e.g., Shprits et al., 2007; Summers et al., 2007] and nonlinear [e.g., Trakhtengerts et al., 2007; Omura et al., 2007, 2008] approaches to the description of wave interactions with energetic electrons. With some exceptions [e.g., Bell, 1984, 1986; Albert, 2008], the majority of these theoretical studies assume that the waves are generated with wave vectors quasi-parallel to the terrestrial magnetic field. 1 Department of Space Physics, Institute of Atmospheric Physics, Prague, Czech Republic. 2 Faculty of Mathematics and Physics, Charles University, Prague, Czech Republic. 3 Department of Physics and Astronomy, University of Iowa, Iowa City, Iowa, USA. 4 Department of Upper Atmosphere, Institute of Atmospheric Physics, Prague, Czech Republic. 5 Laboratoire de Physique des Plasmas, Centre National de la Recherche Scientifique, Vélizy, France. 6 Station de Radioastronomie de Nancay, Observatoire de Paris, Centre National de la Recherche Scientifique, Nancay, France. Copyright 2009 by the American Geophysical Union /09/2009JA014586$09.00 [3] This is often a very good approximation for results of direct measurements of the wave vector directions in the source region of chorus close to the geomagnetic equatorial plane [Burton and Holzer, 1974; Hayakawa et al., 1984; Goldstein and Tsurutani, 1984; Hattori et al., 1991; Santolík et al., 2003a]. Direct or indirect observations of wave vector directions in other cases [e.g., Lefeuvre and Helliwell, 1985; Hayakawa et al., 1990; Lauben et al., 2002; Tsurutani et al., 2008] however suggest that large wave vector angles with respect to the terrestrial magnetic field can also be encountered. The wave vector directions are often close to the Gendrin angle for which the group velocity is also parallel to the local magnetic field line [Gendrin, 1961]. The chorus wave packets can thus travel in the direction close to the velocity of the guiding center of resonant energetic electrons. [4] There are also some theoretical indications that chorus should be, at least sometimes, emitted with high wave vector angles. A ray tracing study of Chum and Santolík [2005] has clearly shown that this is the only possibility for chorus to propagate to lower altitudes toward the Earth and into the plasmasphere. This has been confirmed by subsequent ray tracing simulations which included a model of wave damping by suprathermal electrons [Bortnik et al., 2007, 2008]. Backward ray tracing based on wave vector measurements on a low-altitude spacecraft [Santolík et al., 2006] also indicates that chorus needs to be emitted around the Gendrin angle from its source. [5] Dunckel and Helliwell [1969] and Burtis and Helliwell [1976] noted that chorus is often accompanied by a background of hiss that has a variable amount of 1of12
2 structure. Cornilleau-Wehrlin et al. [1978] found that the simultaneous occurrence of chorus and hiss is an almost permanent situation, even in the anticipated source region close to the geomagnetic equator. Similar observations have been analyzed by Koons [1981] who showed cases of chorus and simultaneously present hiss band at lower frequencies. He concluded that hiss can contribute to generation of discrete chorus wave packets by modifying the electron phase space density. This theory has been further supported by observational [Hattori et al., 1991] and theoretical [e.g., Trakhtengerts, 1995; Trakhtengerts et al., 1996] arguments. However, chorus can be also observed without the accompanying hiss bands [Santolík and Gurnett, 2003; Trakhtengerts et al., 2004], corresponding perhaps to the different regimes of the nonlinear generating mechanism, as noted by Titova et al. [2003]. Tsurutani et al. [2008] speculated that hiss intervals separating intervals of discrete chorus elements can be remnants of chorus or hiss. [6] In this paper we present observations of the Cluster spacefleet in the chorus source region. We show that the wave vector directions can be highly inclined from the geomagnetic field and that both discrete wave packets and shapeless hiss can be alternatively generated in the source. Section 2 presents the data and introduces a case that is analyzed in this paper. Section 3 shows a detailed analysis of high-resolution waveforms in both regimes and multispacecraft observations of their occurrence in the source region. Section 4 presents results of analysis of multicomponent measurements of wave vector directions under the assumption of the presence of a single plane wave, using an estimation of the wave distribution function, and using the ratio of amplitudes of the magnetic and electric field fluctuations. Finally, section 5 contains a brief discussion and conclusions. In Appendix A we describe the method of multipoint determination of the true magnetic equator. 2. A Case Study of Whistler Mode Chorus in Its Source Region [7] To analyze frequency-time power spectrograms, polarization properties and propagation directions of chorus we use complementary measurements of two sets of identical instruments onboard the four Cluster spacecraft: the wideband data (WBD) receivers and the spectrum analyzers for Spatio-Temporal Analysis of Field Fluctuations (STAFF-SA). The WBD instruments [Gurnett et al., 2001], in the operational mode that we use in the present paper, continuously record waveforms of one component of electric or magnetic field with a sampling frequency of khz. We use these data as input for standard spectral analysis based on the fast Fourier transform (FFT) algorithm which results in high-resolution power spectrograms. This procedure allows us to choose an appropriate ratio of time and frequency resolution according to the timescales that we investigate, the entire passage of Cluster spacecraft through the chorus source region is at timescales of the order of 10 3 s but the individual wave packets of chorus are observed at timescales of the order of 10 1 s. [8] The STAFF-SA instruments [Cornilleau-Wehrlin et al., 2003] perform a multidimensional spectral analysis onboard the spacecraft, based on the signals detected by three magnetic search coil antennas and two double-sphere electric antennas. The resulting data consist of power spectra of all the components, their relative phases and coherence. The logarithmic frequency resolution is approximately 30% and the time resolution is 1 second for the power spectra and 4 seconds for the phases and coherence in the normal mode. [9] Both these instruments recorded intense chorus on all four spacecraft on 20 January 2004, during the nightside perigee passage. There were no signs of a geomagnetic storm for several days before the measurement, the DST index being between 22 and 46 nt during the previous 24 hours, with the Kp index between 3 and 4 +. However, the AE index indicates substorm activity with a peak of 970 nt 4 hours before the observations, decreasing to 286 nt at the time of measurements. This is similar to events of High- Intensity Long-Duration Continuous AE Activity (HILD- CAA) which are not connected to the DST geomagnetic storms [Tsurutani et al., 2008]. [10] Figure 1 shows the data recorded on Cluster 2. Data from other spacecraft are similar. The electric field power spectrogram in Figure 1a represents the high-resolution WBD data that are available before 1938 UT. After that time we use the STAFF-SA data that have a limited frequency range below 4 khz. Chorus is seen as an intense wave emission, initially rising in frequency from 2 to 4 khz, as the spacecraft approaches the geomagnetic equator from the South. Eventually, in the vicinity of the magnetic equatorial plane, several spectral widenings of the chorus bandwidth toward lower frequencies are encountered. In the same region the upper band of chorus appears above one half of the electron cyclotron frequency ( 1 2 f ce). The magnetic field spectrogram from the STAFF-SA instrument is shown in Figure 1b, with no signs of spectral widenings. [11] Figure 1c shows the angle q BK, between the wave vector and the static magnetic field, calculated by the singular value decomposition (SVD) method [Santolík et al., 2003b, equation (22)] using the STAFF-SA measurements of both electric and magnetic field fluctuations. These results will be analyzed in detail later in section 4 but it is evident already from Figure 1c, that the wave vector angles are highly deviated from directions parallel or antiparallel to the magnetic field. Generally, the q BK values are larger than 90 at negative geomagnetic dipole latitudes (shown as MLT at on the bottom of Figure 1), and smaller than 90 when the spacecraft moves to positive latitudes on the Northern side of the geomagnetic dipole equator. [12] This propagation pattern is clearly confirmed in Figure 1d which shows the parallel component of the Poynting flux normalized by its standard deviation, as it is obtained from statistical uncertainties of the spectral analysis [Santolík et al., 2001, equation (8)]. Most of the values obtained for chorus are either below 3 or above 3 indicating propagation with a significant antiparallel or parallel component of the Poynting flux, on the Southern or Northern side of the geomagnetic dipole equator, respectively. [13] This means that the central position of the chorus source, where the Poynting flux diverges, is located close to the dipole equatorial plane, as it was previously found for other chorus cases [e.g., LeDocq et al., 1998; Parrot et al., 2003; Santolík et al., 2003a]. This plane contains the minimum of the magnetic field strength along any given field line, assuming the ideal case of the dipole magnetic 2of12
3 Figure 1. Measurements of Cluster 2 on 20 January (a) Power spectrogram of the electric field fluctuations from the WBD measurements (before 1938 UT) and STAFF-SA measurements (after 1938 UT). In the STAFF-SA data the frequency band is limited below 4 khz and the vertical white stripes correspond to regular data gaps. (b) Power spectrogram of the magnetic field fluctuations. (c) Angle between the wave vector and B 0. (d) Parallel component of the Poynting vector normalized by its standard deviation. (e) Spatial gradient of jb 0 j projected on the local field line. The solid black lines in Figures 1a 1d show one half of the electron cyclotron frequency from local measurements of the static magnetic field [Balogh et al., 2001]. Vertical arrows show times of events 1 and 2 which are analyzed in detail in Figures 2a and 2b, respectively. Position of Cluster 2 is given on the bottom. R, radial distance in Earth s radii; l m, magnetic dipole latitude in degrees; MLT, magnetic local time in hours. field. This assumption could be wrong for the geomagnetic field at a radial distance of 4 R E, especially on the night side [see, e.g., Santolík et al., 2005, Figure 8]. We have thus determined the position of the field strength minimum along its direction experimentally. Our multipoint method uses magnetic field measurements by fluxgate magnetometers [Balogh et al., 2001] onboard the four Cluster spacecraft, as it is described in Appendix A. Figure 1e shows the spatial derivative of the magnetic field strength along the magnetic field direction (@ s B from equation (A5)) calculated for the central position R c of the four spacecraft (equation (A2)) and shifted in time by Dt 2 (equation (A6)) for the position of Cluster 2. The field strength minimum along the magnetic field line is reached at 1934:26 UT; at this moment the spacecraft passes through the true magnetic equator. Taking into account the Poynting flux (Figure 1d) and wave vector (Figure 1c) measurements, this result is consistent with the anticipated central position of the chorus source at the true magnetic equator [Trakhtengerts, 1995; Kozelov et al., 2008; Omura et al., 2008]. The other three Cluster spacecraft give the same result as they successively pass through the experimentally determined magnetic equatorial surface between 1932:02 and 1935:49 UT (not shown). 3. Observations of Hiss and Discrete Chorus in the Source Region [14] Two vertical arrows in Figures 1a 1d show times of selected events 1 and 2. Both events are located close to the magnetic equator. Event 1 is inside the time interval where 3of12
4 chorus is observed in both the electric field spectrogram (Figure 1a) and the magnetic field spectrogram (Figure 1b) at frequencies between 3.5 and 6.5 khz. Event 2 corresponds to the time interval where the behavior of emissions changes and where spectral widening down to a frequency of 2 khz is observed in the electric field spectrogram, with no counterpart in the corresponding magnetic field data. [15] In the chorus source region high-resolution data of the WBD instruments have been recorded continuously on board Cluster 1, 2, and 4. Power spectrograms for each of the three spacecraft from short data intervals of 3 sec duration are shown in Figure 2. These intervals include both electric and magnetic field measurements. Figures 2a and 2b show data for Events 1 and 2, respectively. It is clearly seen that the two events are very different. [16] Event 1 in Figure 2a contains short discrete chorus elements (wave packets) that are observed in both the electric and magnetic field spectrograms. Each element decreases in frequency, typically by several hundreds of hertz at timescales of several tens of ms. Two chorus bands are separated by a gap around 1 2 f ce; the upper band extends up to khz and the lower band is observed at frequencies above khz. Corresponding chorus elements are sometimes observed by the three spacecraft, for example between 1932:41 and 1932:42 UT, in both the electric field and magnetic field spectrograms. These chorus wave packets are remarkably shifted in frequency and time on the three different spacecraft, similarly as it was previously observed in other cases [e.g., Gurnett et al., 2001; Inan et al., 2004; Platino et al., 2006; Chum et al., 2007; Breneman et al., 2009]. Correlation analysis of these corresponding elements and interpretation of their time and frequency shifts are subjects of a companion paper by Chum et al. [2009]. [17] In a nearly 600 ms interval after 1932:41.2 UT, one of the spacecraft (Cluster 4) measures the magnetic field fluctuations while the other spacecraft still record the electric field data. We can therefore approximately compare the ratio of the magnetic and electric components of the corresponding chorus wave packets. A rough estimate of the maximum electric field power spectral densities in this interval is 10 2 mv 2 m 2 Hz 1, while the magnetic field power spectral densities reach nt 2 Hz 1. These values give the dimensionless ratio of the magnetic to electric power, c 2 B 2 /E Very similar results can be also obtained from the comparison between the signals of neighboring wave packets on each of the spacecraft around the time where the instrument switches from the electric to the magnetic sensor. [18] Event 2 in Figure 2b is an example of a hiss emission with hardly detectable frequency-time structures on the spectrogram that possibly rise in frequency. The bandwidth extends down to lower frequencies of approximately 2 khz. The emissions are only observed on the electric field spectrograms, while no corresponding magnetic field fluctuations are detected. [19] Visual inspection of high-resolution spectrograms, as those shown in Figure 2, indicates that there are several time intervals where nearly shapeless hiss and structured discrete chorus alternate in the vicinity of the magnetic equator. These intervals are given on the top of Figure 3b. Moreover, we can notice in Figure 3b that all the discrete chorus emissions have significant magnetic field component, while inside the hiss intervals the power spectral density of the magnetic field is systematically found to be at the background level. This indicates a quasi-electrostatic nature of the hiss intervals. The changes from discrete emissions to quasi-electrostatic hiss and vice versa occur simultaneously at all the Cluster spacecraft. They thus do not reflect different spatial regions scanned by the spacecraft along their orbit, but rather a temporal effect, linked probably to a changing state of the chorus source region. [20] Position of the spacecraft in the source region is indicated by their dipole magnetic latitudes shown on the bottom of Figure 3. More precisely, the experimental determination of the passage through the true magnetic equatorial surface (see Appendix A) is shown by the vertical lines in Figure 3 for each of the Cluster spacecraft: Cluster 1 passes through this plane first, followed by Cluster 3, 2 and 4. After 1932 UT the equatorial surface is surrounded by the different spacecraft. Cluster 1 is on its Northern side and the other three spacecraft are to the South of it. Fortunately, this happens during the second interval of discrete chorus that lasts until 1934 UT (see on the top of Figure 3b). We can therefore verify if the chorus propagation characteristics correspond to the hypothesis that the central position of the chorus source region is at the true magnetic equatorial surface. Indeed, the prevailing Poynting flux on Cluster 1 does have a Northward component after 1933 UT while the other three spacecraft still see the Southward propagation (not shown, except for Cluster 2 in Figure 1d). The waves seen by Cluster 1 and 3 are, however, weak, with the magnetic field fluctuations close to the background level. [21] Interestingly enough, the sequence in which the spacecraft pass the true magnetic equatorial surface also corresponds to the ordering of power spectral density values seen by the different spacecraft in the discrete chorus intervals in Figures 3a and 3b: The further the given spacecraft from the true magnetic equator, the stronger the chorus. The same effect can be seen on the temporal evolution of chorus intensity on each of the spacecraft separately, comparing the two intervals of discrete chorus shown on the top of Figure 3b. The interval UT is further from the equator, with higher intensities, and the Figure 2. High-resolution spectrograms of the power spectral density calculated from the electric field (psd-e) and magnetic field (psd-b) data recorded by the WBD instruments on board the Cluster 1 (SC1), Cluster 2 (SC2), and Cluster 4 (SC4) spacecraft on 20 January Two 3 s time intervals correspond to two selected events shown by vertical arrows in Figures 1a 1d. (a) Event 1 containing discrete chorus elements starts at 1932:40 UT. (b) Event 2 as an example of hiss with a bandwidth extended toward lower frequencies starts at 1936:22 UT. The solid white lines show one half of the electron cyclotron frequency from local measurements of the static magnetic field. Magnetic dipole latitudes (l m ) of the three spacecraft are given on the bottom. 4of12

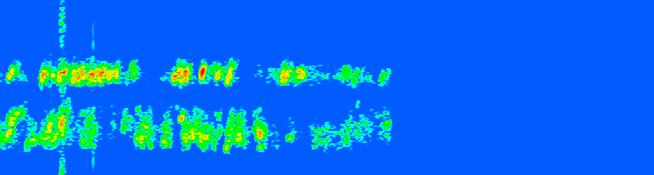


5 Figure 2 5of12
6 Figure 3. Parameters of waves detected in the frequency range khz in the chorus source region on 20 January (a) Power spectral density of the electric field fluctuations. (b) Power spectral density of the magnetic field fluctuations, hiss, and chorus intervals from visual inspection of highresolution spectrograms are shown on the top. (c) Angle between the wave vector and B 0. The data from the four Cluster spacecraft are color coded according to the legend on the left-hand side. The horizontal gray rectangles show approximate ranges of values of (from the bottom) the whistler mode resonance angle q R and of the Gendrin angle q G. The vertical solid lines spanning over Figures 3a 3c show the times when each spacecraft passes through the magnetic equator according to the method described in Appendix A. The vertical grey line shows this time for the central position inside the spacecraft constellation. Vertical arrows show times of events 1 and 2 which are analyzed in detail in Figures 2a and 2b, respectively. Dipole magnetic latitude (l m ) in degrees is given on the bottom for the four Cluster spacecraft. 6of12
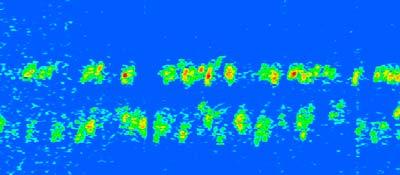
7 interval UT is closer to the equator, with lower intensities. 4. Wave Vector Directions of Chorus and Hiss in the Source Region [22] Figure 3c shows results of wave vector analysis with the same SVD method as in Figure 1c using the measurements of electric and magnetic field fluctuations in the highest frequency band of the STAFF-SA instrument, between 3.17 and 4 khz. The results are given for all the four Cluster spacecraft but only when the magnetic field power spectral density is higher than nt 2 Hz 1. This means that we have no results in the hiss regions where the magnetic field is at the background level. The results for stronger waves in the two discrete chorus intervals correspond to the Southward propagation at highly oblique wave normal angles, and it is helpful to know their relation to the characteristic whistler mode angles, the resonance angle and the Gendrin angle. [23] The whistler mode resonance angle is estimated using an approximation q R ¼ 180 arccosðf =f ce Þ; where we take into account the Southward propagation (q BK >90 ) and where f is the wave frequency. f ce can be approximately defined from the linearly interpolated magnetic field B c inside the Cluster spacecraft constellation using equation (A3) in Appendix A. From the measurements of the FGM instrument we obtain a value of f ce = khz at the moment when the central position R c of the spacefleet (equation (A2)) passes through the true magnetic equator at 1933:57 UT. For f between 3.2 and 4 khz we then obtain values of q R between and from equation (1) (shown by the lower grey rectangle in Figure 3c). These rough estimates do not change substantially during the analyzed time interval. [24] To estimate the Gendrin angle we use an approximation [e.g., Gendrin, 1961; Helliwell, 1995] q G ¼ 180 arccosð2f =f ce Þ: With the same f ce = khz as for the calculation of q R, and for f between 3.2 and 4 khz, we obtain values of q G between and (shown by the upper grey rectangle in Figure 3c). [25] The resulting q BK for the two discrete chorus intervals is found between the two grey rectangles in Figure 3c, i.e., between q R and q G, for most of the time. Some of the results are very close to the resonance cone, within the uncertainties given by the approximative calculation of q R. A possible source of experimental error also is the assumption of the presence of a single plane wave that is used for estimating q BK. [26] We can verify the validity of this assumption by estimating the distribution of the wave energy density with respect to the wave vector directions, which means the wave distribution function (WDF) defined by Storey and Lefeuvre [1979]. If the WDF has a pronounced peak in a single direction the assumption of a single plane wave is valid [see, e.g., Santolík and Parrot, 2000]. However, it can ð1þ ð2þ happen that the wave energy density is distributed over a wide range of wave vector directions. In this case the assumption of the presence of a single plane wave is disputable. [27] The first step in the estimation of the WDF is the direct problem, which means the theoretical calculation of autopower and cross-power spectral densities of the fluctuations of electric and/or magnetic field components (including their relative phases and coherence). We calculate the model spectral densities for each wave vector direction from the complete cold plasma theory [Stix, 1992]. We assume a magnetized hydrogen plasma with the parameters corresponding to Cluster 4 measurements during event 1 from Figure 2a. We use a central frequency f = 3587 Hz and the measured electron cyclotron frequency f ce = 9657 Hz. The electron plasma frequency is estimated as f p 25 khz, based on measurements of the WHISPER instrument onboard the Cluster spacecraft in this region (P. Décréau, private communication, 2007) since no reliable direct measurement is available for this event. For these parameters, the cold plasma theory gives the resonance angle pffiffiffiffiffiffiffiffiffiffiffiffi q r ¼ arctan P=S; ð3þ where P and S are the parameters of Stix [1992] calculated using f, f ce, and f p. We thus obtain q r = 66.8 and 113.2, respectively, in the opposite hemispheres of propagation (well corresponding to an approximate value of from equation (1)). [28] Selected results of the cold plasma theory for a whistler mode wave are plotted in Figures 4a 4d as a function of the angle q BK between 0 and q r. Figure 4a shows the refractive index increasing from a value of 5.4 at q BK =0 and sharply diverging at q BK = q r. The group velocity in Figure 4b is decreasing close to the resonance angle. The Gendrin angle can be found from Figure 4c as q BK = q g > 0 for which the angle q BS is zero. We obtain q g = 38.7 and 141.3, respectively, in the opposite hemispheres of propagation (again, well corresponding to an approximate value of from equation (2)). Figure 4d shows that the power of magnetic field fluctuations sharply decreases close to the resonance angle. Finally, we have used the cold plasma theory to calculate the model autopower and cross-power spectral densities of the three magnetic field components with steps in q BK. [29] The second step in the estimation of the WDF is the inverse problem that consists in fitting a multiparameter model to the measured autopower and cross-power spectral densities of the three magnetic field components. We have used an improved version of the Model of Discrete Regions [Santolík and Parrot, 2000]. The WDF estimation procedure works with regions of approximately Figure 4e shows the WDF estimated from Cluster 4 measurements during event (1). Since we know from the previous analysis that the waves propagate Southward, the results are represented in a q BK interval between 90 and 180. The estimated WDF shows that the wave energy density has a very broad peak in the azimuth angle f BK. This peak has a width of approximately 180 and it is centered near the plane of the local magnetic meridian, in 7of12
8 Figure 4. (a d) Results of the theoretical analysis of a whistler mode wave at a frequency of khz in a cold plasma as a function of the angle q BK between the wave vector and B 0. (a) The refractive index, (b) the group speed normalized by the speed of light, (c) angle q BS between the group velocity and B 0, and (d) ratio of the magnetic field power versus the electric field power. (e) Wave distribution function (WDF) estimated from observations on board Cluster 4 in the frequency range khz between 19:32: and 19:32: on 20 January 2004 (during event 1 which is analyzed in Figure 2a). WDF is plotted in a polar plot as a function of the polar angle q BK between the wave vector and B 0 and the angle azimuth f BK of the wave vector, with f BK = 0 in the plane of the local magnetic meridian, outward from the Earth. Resonance angle q r is shown by a dashed line. Results of the plane wave analysis from Figure 3c are indicated by a square symbol. the direction outward from the Earth. Note that similar WDFs have been previously obtained for the auroral hiss emissions [Santolík and Gurnett, 2002]. [30] On the other hand, the peak in the estimated WDF is relatively narrow as a function of the q BK angle. As in the previous plane wave analysis by the electromagnetic SVD method (square symbol), the majority of the wave energy is found between q g and q r. The maximum is found at q BK This is still more than 3 inward from the resonance cone but it is closer to the resonance cone compared to the previous result from the electromagnetic SVD method (128.9 ). Different plane wave methods [McPherron et al., 1972; Means, 1972; Samson, 1973; Samson and Olson, 1980] or the magnetic SVD method [Santolík et al. 2003b, paragraph 13] give slightly different results, between and (not shown). The reason for this spread is that, as it is shown in Figure 4e, the assumption of the presence of a single plane wave is not completely satisfied and each of the methods results in a different average direction. [31] Since the WDF has been obtained uniquely from the magnetic field measurements, an independent estimation of q BK can be obtained from the comparison of the magnetic and electric components of chorus. We have analyzed the same time and frequency interval as we have used for the WDF analysis in Figure 4e. The Cluster 4 STAFF-SA data give an average sum of power spectral densities from the two electric antennas of mv 2 m 2 Hz 1, while an average sum of power spectral densities from the three magnetic antennas is nt 2 Hz 1. These values give the dimensionless ratio of the magnetic to electric power, c 2 B 2 /E Comparing this value with calculations in Figure 4d, we obtain an angle q BK of 120 for which the theory gives the same c 2 B 2 /E 2 ratio. In reality, this ratio can be a few tens of percent lower, since we do not measure all three components of the electric field and thus we underestimate the denominator E 2. This is in good agreement with the estimate of c 2 B 2 /E obtained in section 3 from the WBD measurements of maxima of power for the discrete wave packets of chorus. The comparison of this value with the theoretical calculation in Figure 4d gives a somewhat larger q BK of 117, that is nearly identical with the above discussed peak value based on the WDF analysis of the magnetic field data. This value of q BK also agrees surprisingly well with the value for which the calculated transverse velocity of the chorus source introduced by Chum et al. [2009] matches the velocity deduced from the observed time shifts of individual chorus waves packets observed on the different spacecraft (for more details, see Chum et al. [2009]). [32] During the hiss events (for example during the event 2 in Figure 2b) the power of the magnetic field fluctuations is lower by at least 1 2 orders of magnitude. Often, the average level of electric field fluctuations is approximately the same as during the discrete chorus events. The ratio 8of12
9 c 2 B 2 /E 2 is therefore of the order of 0.1 or lower. According to the theoretical calculations in Figure 4d this is only possible if q BK is extremely close to the whistler mode resonance cone, jq r q BK j < 0.1. For these wave vectors, hiss should have a low group velocity, at a fraction of its value for discrete chorus (see Figure 4b). So close to the resonance cone, however, the cold plasma theory starts to be invalid, and a kinetic approach might be necessary. 5. Discussion and Conclusions [33] We have presented a case study of chorus emissions generated at highly oblique angles with respect to the terrestrial magnetic field. This result is important since it shows that the assumption of quasi-parallel propagation that is used by many theoretical studies can be invalid. In this case we need new theories for the chorus generation and possibly for local acceleration of electrons in the outer Van Allen radiation belt. Models of radiation belt dynamics that include the whistler mode waves then might also be affected. On the other hand, it cannot be excluded that this case is a rare exception with no importance for the overall average properties of chorus and thus with no importance for modeling of radiation belts. However, we have found a similar nightside event that was recorded by Cluster on 6 January 2004 and a comprehensive analysis of a large number of chorus events is underway to resolve this problem. [34] The estimation of the WDF showed that discrete chorus is generated close to the whistler mode resonance cone but in a very large interval of azimuth angles. This result alone may be important for theoretical considerations. For example, since the group speed can deviate by more than 20 from the local field line (see Figure 4c) the waves can propagate across different L shells; this is in some detail discussed in the companion paper by Chum et al. [2009]. Our analysis, however, has experimental limitations that need to be discussed. First, the time interval of analysis is defined by the time resolution of the STAFF-SA instrument. This leads to averaging of the autopower and cross-power spectral densities over nearly 4 s intervals. During this time, the signal from many chorus wave packets is accumulated (see Figure 2a). The signal is clearly nonstationary but the largest amplitudes are contained in the chorus wave packets, so we can reasonably suppose that the resulting WDF reflects the global propagation properties of chorus. Second, the frequency band of the STAFF-SA instrument in which the analysis is done spans over more than 800 Hz. This band includes the bottom part of the frequency extent of chorus wave packets. The estimated WDF therefore doesn t reflect detailed properties of each frequency and each wave packet separately but a weighted average of the distribution of the wave energy density over the ensemble of many wave packets in a large frequency band. It is possible that each wave packet or frequency contributes to the average by a different interval of azimuth angles, increasing thus the width of the resulting peak. The only possibility for an attempt to resolve this problem at the level of individual chorus wave packets would be to analyze high-resolution waveform data for a set of components of magnetic and/or electric field fluctuations. [35] Occurrence of hiss together with chorus has been known for a long time [Dunckel and Helliwell, 1969; Burtis and Helliwell, 1976], but the new result of our study comes from observations in several spatial points in the chorus source region. Using the measurements onboard the four Cluster spacecraft we are able to show that the changes from discrete chorus to hiss and vice versa occur at the same time at all spacecraft. It indicates that the entire source region changes its state. These changes of source state might be consistent with different regimes of the nonlinear chorus generator mentioned by Titova et al. [2003] in connection to the backward wave oscillator theory by Trakhtengerts [1995]. Obviously, our result also has experimental limitations: we can only work at spatial scales less than the maximum separation of the spacecraft (1000 km). [36] It is important to note that we measure the direction of the Poynting flux during the discrete chorus intervals and we thus know when we are close to the central position of the source region. On the other hand, the magnetic field fluctuations are weak during the hiss intervals and we are unable to measure the Poynting flux in that case. Hiss can thus hypothetically propagate from some other source region that can be for instance located at higher latitudes, or it can leak from the plasmasphere, as it is discussed by Parrot and Lefeuvre [1986]. However, our observations of the quasi-electrostatic hiss rather indicate a common source region with chorus since the two regimes do not overlap but strictly alternate in time. Similar unstable electron distributions can therefore be responsible for generation of either chorus or hiss, according to the regime in which the nonlinear source mechanism is active at a given time. Further stability analysis based on measured electron phase space densities should shed light on this problem. [37] The discrete chorus has been independently found a few degrees from the resonance cone also using the analysis of the ratio of the magnetic field power to the electric field power. The results are consistent with the WDF analysis that was only based on the magnetic field data. For the hiss intervals the magnetic field is very weak which means that the waves propagate in the resonance regime, less than 0.1 from the resonance cone. These results are confirmed by both the WBD and STAFF-SA instruments. The experimental problem here is that none of them measures all the field components. The WBD instruments measure a single component, so the results are randomly affected by the direction of the selected antenna and by the spin phase. The expected random error of the electric or magnetic field power is of the order of tens of percent. The STAFF-SA instrument measures the full vector of magnetic field fluctuations but only two spin plane electric field components. We are thus not able to calculate the full electric field power from the STAFF-SA data. This may lead to a slight systematic underestimation of the closeness of the wave vector to the resonance cone. [38] Another result of this study is also linked to the multipoint measurements. The determination of the passage through the true magnetic equator (see Appendix A) allows us to independently locate the anticipated central position of the chorus source region. This position well corresponds to the Poynting flux measurements. The multipoint measurement also shows that the intensity of discrete chorus emissions increases with the distance from the true magnetic 9of12
10 equator. This is consistent with the idea of an extended source region along the magnetic field lines, centered at the true magnetic equator. Chorus thus can be gradually amplified inside the source region and we observe more intense waves at larger distances from the central position of the source, closer to its ends but still well inside it. [39] Finally, a summary of results of our case study is as follows: [40] 1. The high-resolution waveforms from the Cluster WBD instruments show that in the chorus source region, two regimes alternate in time. Either a sequence of discrete wave packets with falling frequency is generated, or we detect a shapeless hiss. Multipoint observations indicate that these regimes occur at the same time at different positions in the source region. [41] 2. Multicomponent measurements show that in both these regimes the waves propagate close to the whistler mode resonance cone. Two independent methods (estimation of the wave distribution function from the STAFF-SA magnetic field data and measurements of the ratio of power of the magnetic field and electric field fluctuations) show that discrete chorus propagates in a narrow interval of polar angles of a few degrees from the resonance cone. The estimated wave distribution function also shows that the wave energy density spans over 180 in the azimuth angle. Hiss has a very weak magnetic component and propagates closer than 0.1 to the resonance cone. [42] 3. Measurement in four spatial points shows that the intensity of discrete wave packets increases with the distance from the true magnetic equator, estimated as a magnetic field minimum along a given field line. This indicates that the waves are gradually amplified during their propagation though the source region, consistent with the interaction length of several thousands of km along the magnetic field lines [Trakhtengerts et al., 2004; Santolík et al., 2005]. Appendix A: Multipoint Determination of the Magnetic Equator [43] With respect to the wave-particle interactions involved in the process of generation of chorus [e.g., Trakhtengerts, 1995; Omura et al., 2008], the magnetic equator can be defined as a surface perpendicular to the direction of the geomagnetic field where the magnetic field modulus reaches its minimum along every field line. We use measurements of the FGM magnetometers [Balogh et al., 2001] of the four Cluster spacecraft to estimate the projection of the gradient of the magnetic field strength onto the direction of the magnetic field. This allows us to determine the time when a given spacecraft crosses the magnetic equatorial plane. Our method is based on linear interpolation [Chanteur, 2000] and is similar to the method used by Vaivads et al. [2007] for analysis of magnetic field minima close to the dayside magnetopause. [44] As the input data we use the spacecraft positions expressed by their radius vectors R i, i = 1...4, vector of orbital velocity u which is the same for all the spacecraft, and the measured magnetic field vectors at each spacecraft B i. [45] We first define the interspacecraft separation vectors as r ij = R i R j. The reciprocal vectors k i are then defined as r 32 r 42 k 1 ¼ r 12 ðr 32 r 42 Þ ; r 21 r 41 k 3 ¼ r 31 ðr 21 r 41 Þ ; k r 31 r 41 2 ¼ r 21 ðr 31 r 41 Þ ; k r 21 r 31 4 ¼ r 41 ðr 21 r 31 Þ : ða1þ [46] The radius vector of the central position inside the spacefleet is defined as R c ¼ 1 4 X 4 R i i¼1 ða2þ and, at this position, the linearly interpolated vector of the magnetic field is B c ¼ X4 i¼1 ½1 þ k i ðr c R i ÞŠB i : ða3þ The magnetic field strength B = jbj is approximated by a linear function of the radius vector inside the volume of the spacecraft tetrahedron and its gradient can be estimated rb ¼ X4 i¼1 k i jb i j: ða4þ Projection of the gradient of the magnetic field strength onto the direction of the magnetic field at position R c, then s B ¼ B c rb : ða5þ jb c j [47] Given the Northward direction of the terrestrial magnetic field in the equatorial s B is negative to the South for the magnetic equator and positive on its Northern side. The equator is then reached at time t c s B = 0, which means when B is minimum along the given field line. At this moment, however, the equatorial passage is estimated for the central position R c, not for the positions of the particular spacecraft. We thus proceed with shifting the time s B for a given spacecraft according to its separation vector with respect to R c. This vector, projected to the B c direction and divided by the projection of the orbital velocity u onto the B c direction, gives a time shift Dt i ¼ B c ðr c R i Þ ; i ¼ 1...4: ða6þ B c u This gives an estimate of time, t c + Dt i, when the magnetic equatorial passage occurs for each of the four spacecraft. [48] Acknowledgments. We thank the team of the Cluster FGM instrument and its PIs, A. Ballogh and E. Lucek, for the Prime Parameter magnetic field data used in this study. We thank P. Décréau for her help with the data of the WHISPER instrument. We acknowledge the support of NASA Goddard Space Flight Center under grant NNX07AI24G, of the GAAV under grant IAA , and of the NSF under award / ME842. [49] Amitava Bhattacharjee thanks Steven Petrinec and another reviewer for their assistance in evaluating this paper. 10 of 12
11 References Albert, J. M. (2008), Efficient approximations of quasi-linear diffusion coefficients in the radiation belts, J. Geophys. Res., 113, A06208, doi: /2007ja Balogh, A., et al. (2001), The Cluster magnetic field investigation: Overview of in-flight performance and initial results, Ann. Geophys., 19, Bell, T. F. (1984), The nonlinear gyroresonance interaction between energetic electrons and coherent VLF waves propagating at an arbitrary angle with respect to the earth s magnetic field, J. Geophys. Res., 89, Bell, T. F. (1986), The wave magnetic field amplitude threshold for nonlinear trapping of energetic gyroresonant and Landau resonant electrons by nonducted VLF waves in the magnetosphere, J. Geophys. Res., 91, Bortnik, J., R. M. Thorne, N. P. Meredith, and O. Santolik (2007), Ray tracing of penetrating chorus and its implications for the radiation belts, Geophys. Res. Lett., 34, L15109, doi: /2007gl Bortnik, J., R. M. Thorne, and N. P. Meredith (2008), The unexpected origin of plasmaspheric hiss from discrete chorus emissions, Nature, 452, 62 66, doi: /nature Breneman, A. W., C. A. Kletzing, J. Pickett, J. Chum, and O. Santolik (2009), Statistics of multi-spacecraft observations of chorus dispersion and source location, J. Geophys. Res., 114, A06202, doi: / 2008JA Burtis, W. J., and R. A. Helliwell (1976), Magnetospheric chorus: Occurrence patterens and normalized frequency, Planet. Space Sci., 24, Burton, R. K., and R. E. Holzer (1974), The origin and propagation of chorus in the outer magnetosphere, J. Geophys. Res., 79, Chanteur, G. (2000), Spatial interpolation for four spacecraft: Theory, in Analysis Methods for Multi-Spacecraft Data, edited by G. Paschmann and P. W. Daly, pp , Eur. Space Agency, Noordwijk, Netherlands. Chum, J., and O. Santolík (2005), Propagation of whistler-mode chorus to low altitudes: Divergent ray trajectories and ground accessibility, Ann. Geophys., 23, Chum, J., O. Santolik, A. W. Breneman, C. A. Kletzing, D. A. Gurnett, and J. S. Pickett (2007), Chorus source properties that produce time shifts and frequency range differences observed on different Cluster spacecraft, J. Geophys. Res., 112, A06206, doi: /2006ja Chum, J., O. Santolik, D. A. Gurnett, and J. S. Pickett (2009), Oblique lower band chorus waves: Time shifts between discrete elements observed by the Cluster spacecraft, J. Geophys. Res., 114, A00F02, doi: /2009ja Cornilleau-Wehrlin, N., R. Gendrin, F. Lefeuvre, M. Parrot, R. Grard, D. Jones, A. Bahnsen, E. Ungstrup, and W. Gibbons (1978), VLF electromagnetic waves observed onboard GEOS-1, Space Sci. Rev., 22, Cornilleau-Wehrlin, N., et al. (2003), First results obtained by the Cluster STAFF experiment, Ann. Geophys., 21, Dunckel, N., and R. A. Helliwell (1969), Whistler-mode emissions on the OGO 1 satellite, J. Geophys. Res., 74, , doi: / JA074i026p Gendrin, R. (1961), Le guidage des whistlers par le champ magnetique, Planet. Space Sci., 5, , doi: / (61) Goldstein, B. E., and B. T. Tsurutani (1984), Wave normal directions of chorus near the equatorial source region, J. Geophys. Res., 89, Gurnett, D. A., et al. (2001), First results from the Cluster wideband plasma wave investigation, Ann. Geophys., 19, Hattori, K., M. Hayakawa, D. Lagoutte, M. Parrot, and F. Lefeuvre (1991), Further evidence of triggering chorus emissions from wavelets in the hiss band, Planet. Space Sci., 39, , doi: / (91)90075-l. Hayakawa, M., Y. Yamanaka, M. Parrot, and F. Lefeuvre (1984), The wave normals of magnetospheric chorus emissions observed on board GEOS 2, J. Geophys. Res., 89, Hayakawa, M., K. Hattori, S. Shimakura, M. Parrot, and F. Lefeuvre (1990), Direction finding of chorus emissions in the outer magnetosphere and their generation and propagation, Planet. Space Sci., 38, , doi: / (90)90012-f. Helliwell, R. A. (1995), The role of the Gendrin mode of VLF propagation in the generation of magnetospheric emissions, Geophys. Res. Lett., 22, , doi: /95gl Horne, R. B. (2007), Acceleration of killer electrons, Nat. Phys., 3, Inan, U. S., M. Platino, T. F. Bell, D. A. Gurnett, and J. S. Pickett (2004), Cluster measurements of rapidly moving sources of ELF/VLF chorus, J. Geophys. Res., 109, A05214, doi: /2003ja Koons, H. C. (1981), The role of hiss in magnetospheric chorus emissions, J. Geophys. Res., 86, Kozelov, B. V., A. G. Demekhov, E. E. Titova, V. Y. Trakhtengerts, O. Santolik, E. Macusova, D. A. Gurnett, and J. S. Pickett (2008), Variations in the chorus source location deduced from fluctuations of the ambient magnetic field: comparison of Cluster data and the backward-wave oscillator model, J. Geophys. Res., 113, A06216, doi: / 2007JA Lauben, D. S., U. S. Inan, T. F. Bell, and D. A. Gurnett (2002), Source characteristics of ELF/VLF chorus, J. Geophys. Res., 107(A12), 1429, doi: /2000ja LeDocq, M. J., D. A. Gurnett, and G. B. Hospodarsky (1998), Chorus source locations from VLF Poynting flux measurements with the Polar spacecraft, Geophys. Res. Lett., 25, Lefeuvre, F., and R. A. Helliwell (1985), Characterization of the sources of VLF hiss and chorus observed on GEOS 1, J. Geophys. Res., 90, McPherron, R. L., C. T. Russell, and P. J. Coleman Jr. (1972), Fluctuating magnetic fields in the magnetosphere, Part 2. ULF waves, Space Sci. Rev., 13, Means, J. D. (1972), Use of the three-dimensional covariance matrix in analyzing the polarization properties of plane waves, J. Geophys. Res., 77, Omura, Y., N. Furuya, and D. Summers (2007), Relativistic turning acceleration of resonant electrons by coherent whistler mode waves in a dipole magnetic field, J. Geophys. Res., 112, A06236, doi: / 2006JA Omura, Y., Y. Katoh, and D. Summers (2008), Theory and simulation of the generation of whistler-mode chorus, J. Geophys. Res., 113(A12), A04223, doi: /2007ja Parrot, M., and F. Lefeuvre (1986), Statistical study of the propagation characteristics of ELF hiss observed on GEOS 1, outside and inside the plasmasphere, Ann. Geophys., 4, Parrot, M., O. Santolík, N. Cornilleau-Wehrlin, M. Maksimovic, and C. Harvey (2003), Source location of chorus emissions observed by Cluster, Ann. Geophys., 21, Platino, M., U. S. Inan, T. F. Bell, J. S. Pickett, and P. Canu (2006), Rapidly moving sources of upper band ELF/VLF chorus near the magnetic equator, J. Geophys. Res., 111, A09218, doi: /2005ja Samson, J. C. (1973), Descriptions of the polarization states of vector processes: Applications to ULF magnetic fileds, Geophys. J. R. Astron. Soc., 34, Samson, J. C., and J. V. Olson (1980), Some comments on the descriptions of the polarisation states of waves,, Geophys. J. R. Astron. Soc., 61, Santolík, O., and D. A. Gurnett (2002), Propagation of auroral hiss at high altitudes, Geophys. Res. Lett., 29(10), 1481, doi: / 2001GL Santolík, O., and D. A. Gurnett (2003), Transverse dimensions of chorus in thesourceregion,geophys. Res. Lett., 30(2), 1031, doi: / 2002GL Santolík, O., and M. Parrot (2000), Application of wave distribution function methods to an ELF hiss event at high latitudes, J. Geophys. Res., 105, 18,885 18,894. Santolík, O., F. Lefeuvre, M. Parrot, and J. Rauch (2001), Complete wavevector directions of electromagnetic emissions: Application to Interball-2 measurements in the nightside auroral zone, J. Geophys. Res., 106, 13,191 13,201. Santolík, O., D. A. Gurnett, J. S. Pickett, M. Parrot, and N. Cornilleau- Wehrlin (2003a), Spatio-temporal structure of storm-time chorus, J. Geophys. Res., 108(A7), 1278, doi: /2002ja Santolík, O., M. Parrot, and F. Lefeuvre (2003b), Singular value decomposition methods for wave propagation analysis, Radio Sci., 38(1), 1010, doi: /2000rs Santolík, O., D. A. Gurnett, J. S. Pickett, M. Parrot, and N. Cornilleau- Wehrlin (2005), Central position of the source region of storm-time chorus, Planet. Space Sci., 53, Santolík, O., J. Chum, M. Parrot, D. A. Gurnett, J. S. Pickett, and N. Cornilleau-Wehrlin (2006), Propagation of whistler mode chorus to low altitudes: Spacecraft observations of structured ELF hiss, J. Geophys. Res., 111, A10208, doi: /2005ja Shprits, Y. Y., N. P. Meredith, and R. M. Thorne (2007), Parameterization of radiation belt electron loss timescales due to interactions with chorus waves, Geophys. Res. Lett., 34, L11110, doi: /2006gl Stix, T. H. (1992), Waves in Plasmas, Am. Inst. of Phys., New York. Storey, L. R. O., and F. Lefeuvre (1979), The analysis of 6-component measurement of a random electromagnetic wave field in a magnetoplasma, Part 1. The direct problem, Geophys. J. R. Astron. Soc., 56, Summers, D., B. Ni, and N. P. Meredith (2007), Timescales for radiation belt electron acceleration and loss due to resonant wave-particle interac- 11 of 12
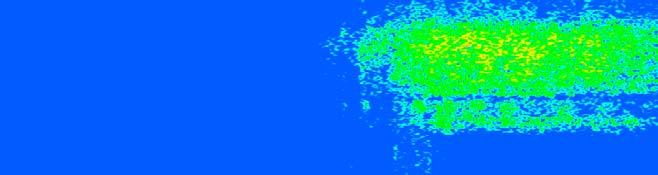
Oblique lower band chorus waves: Time shifts between discrete elements observed by the Cluster spacecraft
 Click Here for Full Article JOURNAL OF GEOPHYSICAL RESEARCH, VOL. 114,, doi:10.1029/2009ja014366, 2009 Oblique lower band chorus waves: Time shifts between discrete elements observed by the Cluster spacecraft
Multispacecraft observations of chorus dispersion and source location
 JOURNAL OF GEOPHYSICAL RESEARCH, VOL. 112,, doi:10.1029/2006ja012058, 2007 Correction published 22 September 2007 Multispacecraft observations of chorus dispersion and source location Aaron Breneman, 1
Landau damping and resultant unidirectional propagation of chorus waves
 GEOPHYSICAL RESEARCH LETTERS, VOL. 33, L03102, doi:10.1029/2005gl024553, 2006 Landau damping and resultant unidirectional propagation of chorus waves J. Bortnik, 1,2 U. S. Inan, 1 and T. F. Bell 1 Received
Statistics of multispacecraft observations of chorus dispersion and source location
 JOURNAL OF GEOPHYSICAL RESEARCH, VOL. 114,, doi:10.1029/2008ja013549, 2009 Statistics of multispacecraft observations of chorus dispersion and source location Aaron W. Breneman, 1,2 Craig A. Kletzing,
Resonant scattering of plasma sheet electrons by whistler-mode chorus: Contribution to diffuse auroral precipitation
 Click Here for Full Article GEOPHYSICAL RESEARCH LETTERS, VOL. 35, L11106, doi:10.1029/2008gl034032, 2008 Resonant scattering of plasma sheet electrons by whistler-mode chorus: Contribution to diffuse
Systematic analysis of equatorial noise below the lower hybrid frequency
 Annales Geophysicae (24) 22: 2587 2595 SRef-ID: 1432-576/ag/24-22-2587 European Geosciences Union 24 Annales Geophysicae Systematic analysis of equatorial noise below the lower hybrid frequency O. Santolík
Characteristics of magnetospherically reflected chorus waves observed by CLUSTER
 Annales Geophysicae (4) : 597 66 SRef-ID: 43-576/ag/4--597 European Geosciences Union 4 Annales Geophysicae Characteristics of magnetospherically reflected chorus waves observed by CLUSTER M. Parrot, O.
LETTERS. The unexpected origin of plasmaspheric hiss from discrete chorus emissions. Jacob Bortnik 1, Richard M. Thorne 1 & Nigel P.
 Vol 2 March 2008 doi:10.1038/nature01 The unexpected origin of plasmaspheric hiss from discrete chorus emissions Jacob Bortnik 1, Richard M. Thorne 1 & Nigel P. Meredith 2 Plasmaspheric hiss 1 is a type
Observations of the relationship between frequency sweep rates of chorus wave packets and plasma density
 JOURNAL OF GEOPHYSICAL RESEARCH, VOL. 115,, doi:10.1029/2010ja015468, 2010 Observations of the relationship between frequency sweep rates of chorus wave packets and plasma density E. Macúšová, 1,2 O. Santolík,
Rapidly moving sources of upper band ELF/VLF chorus near the magnetic equator
 Click Here for Full Article JOURNAL OF GEOPHYSICAL RESEARCH, VOL. 111,, doi:10.1029/2005ja011468, 2006 Rapidly moving sources of upper band ELF/VLF chorus near the magnetic equator M. Platino, 1 U. S.
Possible eigenmode trapping in density enhancements in Saturn s inner magnetosphere
 Click Here for Full Article GEOPHYSICAL RESEARCH LETTERS, VOL. 34, L04103, doi:10.1029/2006gl028647, 2007 Possible eigenmode trapping in density enhancements in Saturn s inner magnetosphere J. D. Menietti,
Interpretation of Cluster data on chorus emissions using the backward wave oscillator model
 PHYSICS OF PLASMAS VOLUME 11, NUMBER 4 APRIL 2004 Interpretation of Cluster data on chorus emissions using the backward wave oscillator model V. Y. Trakhtengerts and A. G. Demekhov Institute of Applied
Full particle simulation of whistler-mode rising chorus emissions in the magnetosphere
 JOURNAL OF GEOPHYSICAL RESEARCH, VOL. 114,, doi:10.1029/2008ja013625, 2009 Full particle simulation of whistler-mode rising chorus emissions in the magnetosphere M. Hikishima, 1 S. Yagitani, 1 Y. Omura,
Locations of chorus emissions observed by the Polar Plasma Wave Instrument
 Click Here for Full Article JOURNAL OF GEOPHYSICAL RESEARCH, VOL. 115,, doi:10.1029/2009ja014579, 2010 Locations of chorus emissions observed by the Polar Plasma Wave Instrument K. Sigsbee, 1 J. D. Menietti,
Cluster measurements of rapidly moving sources of ELF/VLF chorus
 JOURNAL OF GEOPHYSICAL RESEARCH, VOL. 109,, doi:10.1029/2003ja010289, 2004 Cluster measurements of rapidly moving sources of ELF/VLF chorus U. S. Inan, M. Platino, and T. F. Bell STAR Laboratory, Stanford
Electron trapping and charge transport by large amplitude whistlers
 GEOPHYSICAL RESEARCH LETTERS, VOL. 37,, doi:10.1029/2010gl044845, 2010 Electron trapping and charge transport by large amplitude whistlers P. J. Kellogg, 1 C. A. Cattell, 1 K. Goetz, 1 S. J. Monson, 1
Singular value decomposition methods for wave propagation analysis
 RADIO SCIENCE, VOL. 38, NO. 1, 1010, doi:10.1029/2000rs002523, 2003 Singular value decomposition methods for wave propagation analysis O. Santolík, 1 M. Parrot, and F. Lefeuvre Laboratoire de Physique
Intense plasma wave emissions associated with Saturn s moon Rhea
 GEOPHYSICAL RESEARCH LETTERS, VOL. 38,, doi:10.1029/2011gl049219, 2011 Intense plasma wave emissions associated with Saturn s moon Rhea O. Santolík, 1,2,3 D. A. Gurnett, 1 G. H. Jones, 4 P. Schippers,
Modeling the wave normal distribution of chorus waves
 JOURNAL OF GEOPHYSICAL RESEARCH: SPACE PHYSICS, VOL. 8, 74 88, doi:.9/ja8343, 3 Modeling the wave normal distribution of chorus waves Lunjin Chen, Richard M. Thorne, Wen Li, and Jacob Bortnik Received
Title electromagnetic ion cyclotron trigg. Author(s) Shoji, Masafumi; Omura, Yoshiharu.
 Shoji, Masafumi; Omura, Yoshiharu.") Title Precipitation of highly energetic p electromagnetic ion cyclotron trigg Author(s) Shoji, Masafumi; Omura, Yoshiharu Citation Journal of Geophysical Research: Sp 117(A12) Issue Date 2012-12 URL http://hdl.handle.net/2433/193716
Title Precipitation of highly energetic p electromagnetic ion cyclotron trigg Author(s) Shoji, Masafumi; Omura, Yoshiharu Citation Journal of Geophysical Research: Sp 117(A12) Issue Date 2012-12 URL http://hdl.handle.net/2433/193716
Source location of chorus emissions observed by Cluster
 Annales Geophysicae (3) : 73 8 c European Geosciences Union 3 Annales Geophysicae Source location of chorus emissions observed by Cluster M. Parrot, O. Santolík, N. Cornilleau-Wehrlin 3, M. Maksimovic,
Chorus source region localization in the Earth s outer magnetosphere using THEMIS measurements
 Chorus source region localization in the Earth s outer magnetosphere using THEMIS measurements O Agapitov, V Krasnoselskikh, Yu Zaliznyak, V Angelopoulos, O Le Contel, G Rolland To cite this version: O
Magnetic component of narrowband ion cyclotron waves in the auroral zone
 JOURNAL OF GEOPHYSICAL RESEARCH, VOL. 107, N0. A12, 1444, doi:10.1029/2001ja000146, 2002 Magnetic component of narrowband ion cyclotron waves in the auroral zone O. Santolík, 1 J. S. Pickett, and D. A.
Resonant scattering of energetic electrons by unusual low-frequency hiss
 University of New Hampshire University of New Hampshire Scholars' Repository Physics Scholarship Physics 3-2014 Resonant scattering of energetic electrons by unusual low-frequency hiss Binbin Ni University
ELECTROSTATIC AND ELECTROMAGNETIC EMISSIONS NEAR THE PLASMASPHERE. A CASE EVENT: 27 MAY 2003
 ELECTROSTATIC AND ELECTROMAGNETIC EMISSIONS NEAR THE PLASMASPHERE. A CASE EVENT: 7 MAY 3 1 F. El-Lemdani Mazouz (1), S. Grimald (1), J.L. Rauch (1), P.M.E. Décréau (1), G. Bozan (1), G. Le Rouzic (1),
An unusual enhancement of low-frequency plasmaspheric hiss in the outer plasmasphere associated with substorm-injected electrons
 GEOPHYSICAL RESEARCH LETTERS, VOL. 40, 3798 3803, doi:10.1002/grl.50787, 2013 An unusual enhancement of low-frequency plasmaspheric hiss in the outer plasmasphere associated with substorm-injected electrons
Generation Mechanism of Whistler-mode Chorus Emissions
 Generation Mechanism of Whistler-mode Chorus Emissions Yoshiharu Omura Research Institute for Sustainable Humanosphere, Kyoto University, Kyoto, Japan omura@rish.kyoto-u.ac.jp 5th East-Asia School and
Nonlinear interaction of radiation belt electrons with electromagnetic ion cyclotron waves
 Click Here for Full Article GEOPHYSICAL RESEARCH LETTERS, VOL. 36, L12110, doi:10.1029/2009gl038904, 2009 Nonlinear interaction of radiation belt electrons with electromagnetic ion cyclotron waves J. M.
Title waves in Earth's inner magnetospher. Right American Geophysical
 Title Nonlinear spatiotemporal evolution waves in Earth's inner magnetospher Author(s) Summers, Danny; Omura, Yoshiharu; M Dong-Hun Citation Journal of Geophysical Research: Sp 117(A9) Issue Date 01-09
ARTICLE IN PRESS. Journal of Atmospheric and Solar-Terrestrial Physics
 Journal of Atmospheric and Solar-Terrestrial Physics 71 (9) 1636 1646 Contents lists available at ScienceDirect Journal of Atmospheric and Solar-Terrestrial Physics journal homepage: www.elsevier.com/locate/jastp
Nonlinear processes of whistler-mode wave-particle interactions
 Nonlinear processes of whistler-mode wave-particle interactions Yoshiharu Omura Research Institute for Sustainable Humanosphere, Kyoto University omura@rish.kyoto-u.ac.jp RBSP SWG Meeting, APL, May 16-17,
The dual role of ELF/VLF chorus waves in the acceleration and precipitation of radiation belt electrons
 Journal of Atmospheric and Solar-Terrestrial Physics 69 (2007) 378 386 www.elsevier.com/locate/jastp The dual role of ELF/VLF chorus waves in the acceleration and precipitation of radiation belt electrons
Electron precipitation coincident with ELF/VLF wave bursts
 JOURNAL OF GEOPHYSICAL RESEARCH, VOL. 107, NO. A8, 1207, 10.1029/2001JA009100, 2002 Electron precipitation coincident with ELF/VLF wave bursts M. Walt Starlab, Department of Electrical Engineering, Stanford
Magnetospherically reflected chorus waves revealed by ray tracing with CLUSTER data
 Annales Geophysicae (3) : c European Geosciences Union 3 Annales Geophysicae Magnetospherically reflected chorus waves revealed by ray tracing with CLUSTER data M. Parrot, O. Santolík, N. Cornilleau-Wehrlin
Whistler-mode auroral hiss emissions observed near Saturn s B ring
 JOURNAL OF GEOPHYSICAL RESEARCH, VOL. 111,, doi:10.1029/2005ja011432, 2006 Whistler-mode auroral hiss emissions observed near Saturn s B ring L. Xin, 1 D. A. Gurnett, 1 O. Santolík, 1,2 W. S. Kurth, 1
Non Thermal Continuum radiation observed from the Cluster fleet
 Non Thermal Continuum radiation observed from the Cluster fleet P. Décréau, S. Grimald, M. Parrot, O. Randriamboarison, J.-L. Rauch, J._G. Trotignon, X. Vallières, LPCE Orléans, F. P. Canu, N. Cornilleau,
The dawn of chorus in the cacophony: an update on its manifold effects, open problems, and opportunities.
 Explorer 1 launch: Jan. 31 st 1958 The dawn of chorus in the cacophony: an update on its manifold effects, open problems, and opportunities. Jacob Bortnik 1,2, PhD 1 Department of Atmospheric & Oceanic
Scattering rates of inner belt protons by EMIC waves: A comparison between test particle and diffusion simulations
 GEOPHYSICAL RESEARCH LETTERS, VOL. 40, 4793 4797, doi:10.1002/grl.50925, 2013 Scattering rates of inner belt protons by EMIC waves: A comparison between test particle and diffusion simulations M. de Soria-Santacruz,
Test Particle Simulations of Interaction Between Monochromatic Chorus Waves and Radiation Belt Relativistic Electrons
 DOI 10.1007/s10509-014-1859-1 ORIGINAL ARTICLE Test Particle Simulations of Interaction Between Monochromatic Chorus Waves and Radiation Belt Relativistic Electrons Zhonglei Gao Hui Zhu Lewei Zhang Qinghua
Analysis of plasma waves observed within local plasma injections seen in Saturn s magnetosphere
 Click Here for Full Article JOURNAL OF GEOPHYSICAL RESEARCH, VOL. 113,, doi:10.1029/2007ja012856, 2008 Analysis of plasma waves observed within local plasma injections seen in Saturn s magnetosphere J.
Transit time scattering of energetic electrons due to equatorially confined magnetosonic waves
 Click Here for Full Article JOURNAL OF GEOPHYSICAL RESEARCH, VOL. 115,, doi:10.1029/2010ja015283, 2010 Transit time scattering of energetic electrons due to equatorially confined magnetosonic waves J.
First results from the Cluster wideband plasma wave investigation
 First results from the Cluster wideband plasma wave investigation D. A. Gurnett, R. L. Huff, J. S. Pickett, A. M. Persoon, R. L. Mutel, I. W. Christopher, C. A. Kletzing, U. S. Inan, W. L. Martin, J.-L.
Evaluation of Whistler-mode Chorus Intensification on the. Nightside During an Injection Event Observed on the
 1 2 3 Evaluation of Whistler-mode Chorus Intensification on the Nightside During an Injection Event Observed on the THEMIS Spacecraft 4 5 6 W. Li 1, R. M. Thorne 1, V. Angelopoulos 2, J. W. Bonnell 3,
Mission to Understand Electron Pitch Angle Diffusion and Characterize Precipitation Bands and Spikes. J. F. Fennell 1 and P. T.
 Mission to Understand Electron Pitch Angle Diffusion and Characterize Precipitation Bands and Spikes J. F. Fennell 1 and P. T. O Brien 2 1 The Aerospace Corporation, MS:M2-260, P.O.Box 92957, Los Angeles,
First whistler observed in the magnetosphere of Saturn
 GEOPHYSICAL RESEARCH LETTERS, VOL. 33, L20107, doi:10.1029/2006gl027019, 2006 First whistler observed in the magnetosphere of Saturn F. Akalin, 1 D. A. Gurnett, 1 T. F. Averkamp, 1 A. M. Persoon, 1 O.
Experimental determination of the dispersion relation of magnetosonic waves
 JOURNAL OF GEOPHYSICAL RESEARCH, VOL.???, XXXX, DOI:10.1002/, 1 2 Experimental determination of the dispersion relation of magnetosonic waves S. N. Walker, 1 M. A. Balikhin, 1 D. R. Shklyar, 2 K. H. Yearby,
A Semi-Empirical Model for Forecasting Relativistic Electrons at Geostationary Orbit
 2008 Annual Meeting Theme, 20 24 January 2008, New Orleans, Louisiana Fifth Space Weather Symposium A Semi-Empirical Model for Forecasting Relativistic Electrons at Geostationary Orbit Wladislaw Lyatsky
How is Earth s Radiation Belt Variability Controlled by Solar Wind Changes
 How is Earth s Radiation Belt Variability Controlled by Solar Wind Changes Richard M. Thorne Department of Atmospheric and Oceanic Sciences, UCLA Electron (left) and Proton (right) Radiation Belt Models
Advanced modeling of low energy electrons responsible for surface charging
 Advanced modeling of low energy electrons responsible for surface charging Natalia Ganushkina (1, 2), Stepan Dubyagin (1), Ilkka Sillanpää (1), Jean-Charles Matéo Vélez (3), Dave Pitchford (4) (1) Finnish
Low Hanging Fruit. Large-Scale Dynamics & Structure
 Low Hanging Fruit Large-Scale Dynamics & Structure Global Models We plan to try to run DREAM-RB continuously with both SWx data and science data. This will be a limited model (1D, T89...) For events we
Global distribution of electrostatic electron cyclotron harmonic waves observed on THEMIS
 GEOPHYSICAL RESEARCH LETTERS, VOL. 38,, doi:10.1029/2011gl048793, 2011 Global distribution of electrostatic electron cyclotron harmonic waves observed on THEMIS Binbin Ni, 1 Richard Thorne, 1 Jun Liang,
G. Balasis (1), I. A. Daglis (1,2), M. Georgiou (1,2), C. Papadimitriou (1,2), E. Zesta (3), I. Mann (4) and R. Haagmans (5)
, I. A. Daglis (1,2), M. Georgiou (1,2), C. Papadimitriou (1,2), E. Zesta (3), I. Mann (4) and R. Haagmans (5)") G. Balasis (1), I. A. Daglis (1,2), M. Georgiou (1,2), C. Papadimitriou (1,2), E. Zesta (3), I. Mann (4) and R. Haagmans (5) (1) IAASARS-National Observatory of Athens; (2) University of Athens; (3) NASA;
G. Balasis (1), I. A. Daglis (1,2), M. Georgiou (1,2), C. Papadimitriou (1,2), E. Zesta (3), I. Mann (4) and R. Haagmans (5) (1) IAASARS-National Observatory of Athens; (2) University of Athens; (3) NASA;
Multi Spacecraft Observation of Compressional Mode ULF Waves Excitation and Relativistic Electron Acceleration
 Multi Spacecraft Observation of Compressional Mode ULF Waves Excitation and Relativistic Electron Acceleration X. Shao 1, L. C. Tan 1, A. S. Sharma 1, S. F. Fung 2, Mattias Tornquist 3,Dimitris Vassiliadis
The CARISMA Array of Fluxgate and Induction Coil Magnetometers
 The CARISMA Array of Fluxgate and Induction Coil Magnetometers David Milling CARISMA Project Manager dmilling@ualberta.ca Ian Mann CARISMA PI Canada Research Chair in Space Physics ian.mann@ualberta.ca
Electron Acceleration and Loss in the Earth s Radiation Belts: The Contribution of Wave- particle Interactions
 Electron Acceleration and Loss in the Earth s Radiation Belts: The Contribution of Wave- particle Interactions Richard B Horne British Antarctic Survey R.Horne@bas.ac.uk Outline Relevance Radiation belt
Ultra-relativistic acceleration of electrons in planetary magnetospheres
 GEOPHYSICAL RESEARCH LETTERS, VOL. 34, L405, doi:10.109/007gl036, 007 Ultra-relativistic acceleration of electrons in planetary magnetospheres Danny Summers 1 and Yoshiharu Omura Received 5 October 007;
COMPARISON OF THERMAL PLASMA OBSERVATIONS ON SCATHA AND GEOS
 57 COMPARISON OF THERMAL PLASMA OBSERVATIONS ON SCATHA AND GEOS R. C. Olsen The University of Alabama,Huntsville, AL., USA P. M. E. Decreau LPCE, Orleans, France J. F. E. Johnson Department of Physics,
Parallel Heating Associated with Interaction of Forward and Backward Electromagnetic Cyclotron Waves
 J. Geomag. Geoelectr., 40, 949-961, 1988 Parallel Heating Associated with Interaction of Forward and Backward Electromagnetic Cyclotron Waves Yoshiharu OMURA1, Hideyuki USUI2, and Hiroshi MATSUMOTO1 2Department
Outward radial diffusion driven by losses at magnetopause
 JOURNAL OF GEOPHYSICAL RESEARCH, VOL. 111,, doi:10.1029/2006ja011657, 2006 Outward radial diffusion driven by losses at magnetopause Y. Y. Shprits, 1 R. M. Thorne, 1 R. Friedel, 2 G. D. Reeves, 2 J. Fennell,
Magnetopause reconnection impact parameters from multiple spacecraft magnetic field measurements
 Click Here for Full Article GEOPHYSICAL RESEARCH LETTERS, VOL. 36, L20108, doi:10.1029/2009gl040228, 2009 Magnetopause reconnection impact parameters from multiple spacecraft magnetic field measurements
Global distributions of suprathermal electrons observed on THEMIS and potential mechanisms for access into the plasmasphere
 JOURNAL OF GEOPHYSICAL RESEARCH, VOL. 115,, doi:10.1029/2010ja015687, 2010 Global distributions of suprathermal electrons observed on THEMIS and potential mechanisms for access into the plasmasphere W.
Whistler interactions with density gradients in the magnetosphere
 JOURNAL OF GEOPHYSICAL RESEARCH: SPACE PHYSICS, VOL. 118, 167 17, doi:1.19/1ja1838, 13 Whistler interactions with density gradients in the magnetosphere J. R. Woodroffe 1 and A. V. Streltsov 1 Received
Natalia Ganushkina (1, 2), Stepan Dubyagin (1), Ilkka Sillanpää (1)
, Stepan Dubyagin (1), Ilkka Sillanpää (1)") From studying electron motion in the electromagnetic fields in the inner magnetosphere to the operational nowcast model for low energy (< 200 kev) electron fluxes responsible for surface charging Natalia
From studying electron motion in the electromagnetic fields in the inner magnetosphere to the operational nowcast model for low energy (< 200 kev) electron fluxes responsible for surface charging Natalia
Magnetosonic wave instability analysis for proton ring distributions observed by the LANL magnetospheric plasma analyzer
 JOURNAL OF GEOPHYSICAL RESEARCH, VOL. 116,, doi:10.1029/2010ja016068, 2011 Magnetosonic wave instability analysis for proton ring distributions observed by the LANL magnetospheric plasma analyzer Lunjin
1 Introduction. Cambridge University Press Physics of Space Plasma Activity Karl Schindler Excerpt More information
 1 Introduction Space plasma phenomena have attracted particular interest since the beginning of the exploration of space about half a century ago. Already a first set of pioneering observations (e.g.,
Storm-dependent radiation belt electron dynamics
 Click Here for Full Article JOURNAL OF GEOPHYSICAL RESEARCH, VOL. 114,, doi:10.1029/2008ja013480, 2009 Storm-dependent radiation belt electron dynamics Weichao Tu, 1 Xinlin Li, 1 Yue Chen, 2 G. D. Reeves,
Equatorward diffuse auroral emissions at Jupiter: Simultaneous HST and Galileo observations
 Click Here for Full Article GEOPHYSICAL RESEARCH LETTERS, VOL. 36, L07101, doi:10.1029/2009gl037857, 2009 Equatorward diffuse auroral emissions at Jupiter: Simultaneous HST and Galileo observations A.
Kinetic Turbulence in the Terrestrial Magnetosheath: Cluster. Observations
 1 2 Kinetic Turbulence in the Terrestrial Magnetosheath: Cluster Observations 3 4 5 S. Y. Huang 1, F. Sahraoui 2, X. H. Deng 1,3, J. S. He 4, Z. G. Yuan 1, M. Zhou 3, Y. Pang 3, H. S. Fu 5 6 1 School of
Joule heating and nitric oxide in the thermosphere, 2
 JOURNAL OF GEOPHYSICAL RESEARCH, VOL. 115,, doi:10.1029/2010ja015565, 2010 Joule heating and nitric oxide in the thermosphere, 2 Charles A. Barth 1 Received 14 April 2010; revised 24 June 2010; accepted
Whistler mode auroral hiss emissions observed near Jupiter s moon Io
 JOURNAL OF GEOPHYSICAL RESEARCH, VOL. 111,, doi:10.1029/2005ja011411, 2006 Whistler mode auroral hiss emissions observed near Jupiter s moon Io L. Xin, 1 D. A. Gurnett, 1 and M. G. Kivelson 2 Received
Statistical Study of the Ionospheric Density Variation Related to the 2010 Chile Earthquake and Measured by the DEMETER Satellite
 WDS'1 Proceedings of Contributed Papers, Part II, 189 193, 21. ISBN 978-8-7378-14-8 MATFYZPRESS Statistical Study of the Ionospheric Density Variation Related to the 21 Chile Earthquake and Measured by
Cluster and DEMETER Satellite Data. Fabien Darrouzet (Belgian Institute for Space Aeronomy (IASB-BIRA))
)") Cluster and DEMETER Satellite Data Fabien Darrouzet (Belgian Institute for Space Aeronomy (IASB-BIRA)) 1 Outline Magnetosphere Plasmasphere Cluster Mission WHISPER Instrument and Data DEMETER Mission ISL
Cluster and DEMETER Satellite Data Fabien Darrouzet (Belgian Institute for Space Aeronomy (IASB-BIRA)) 1 Outline Magnetosphere Plasmasphere Cluster Mission WHISPER Instrument and Data DEMETER Mission ISL
Plasmasphere Brainstorm Meeting IASB, Brussels February 2003 Minutes (F. Darrouzet)
") Plasmasphere Brainstorm Meeting IASB, Brussels 24-25 February 2003 Minutes (F. Darrouzet) Participants: Arnaud Masson (AM) ESTEC, Noordwijk, The Netherlands amasson@so.estec.esa.nl Fabien Darrouzet (FD)
Plasmasphere Brainstorm Meeting IASB, Brussels 24-25 February 2003 Minutes (F. Darrouzet) Participants: Arnaud Masson (AM) ESTEC, Noordwijk, The Netherlands amasson@so.estec.esa.nl Fabien Darrouzet (FD)
JOURNAL OF GEOPHYSICAL RESEARCH, VOL. 108, NO. A11, 1398, doi: /2003ja010011, 2003
 JOURNAL OF GEOPHYSICAL RESEARCH, VOL. 108, NO. A11, 1398, doi:10.109/003ja010011, 003 Locations of auroral kilometric radiation bursts inferred from multispacecraft wideband Cluster VLBI observations.
Magnetic reconnection and cold plasma at the magnetopause
 GEOPHYSICAL RESEARCH LETTERS, VOL. 37,, doi:10.1029/2010gl044611, 2010 Magnetic reconnection and cold plasma at the magnetopause M. André, 1 A. Vaivads, 1 Y. V. Khotyaintsev, 1 T. Laitinen, 1 H. Nilsson,
Wave observations at the foreshock boundary in the near-mars space
 Earth Planets Space, 50, 439 444, 1998 Wave observations at the foreshock boundary in the near-mars space A. Skalsky 1,2, E. Dubinin 1,2,4, M. Delva 2,5, R. Grard 3, S. Klimov 1, K. Sauer 2,4, and J.-G.
Relationship of Oscillating Aurora to Substorms and Magnetic Field Line Resonances
 Proceedings ICS-6, 2002 Relationship of Oscillating Aurora to Substorms and Magnetic Field Line Resonances James A. Wanliss and Robert Rankin Department of Physics, University of Alberta Edmonton, AB,
Electron flux enhancement in the inner radiation belt during moderate magnetic storms
 Ann. Geophys.,, 19 1, 7 www.ann-geophys.net//19/7/ European Geosciences Union 7 Annales Geophysicae Electron flux enhancement in the inner radiation belt during moderate magnetic storms H. Tadokoro 1,
INNER MAGNETOSPHERE PLASMA DENSITIES. Bodo W. Reinisch and Xueqin Huang
 XA0303034 INNER MAGNETOSPHERE PLASMA DENSITIES Bodo W. Reinisch and Xueqin Huang Environmental, Earth, and Atmospheric Sciences Department, Centerfor Atmospheric Research, University of Massachusetts Lowell,
Observations of lion roars in the magnetosheath by the STAFF/DWP experiment on the Double Star TC1 spacecraft.
 Observations of lion roars in the magnetosheath by the STAFF/DWP experiment on the Double Star TC1 spacecraft. K.H Yearby, H.S.C. Alleyne, Nicole Cornilleau-Wehrlin, O. Santolik, M.A. Balikhin, S.N. Walker,
Low energy electron radiation environment for extreme events
 Low energy electron radiation environment for extreme events Natalia Ganushkina (1, 2) and Stepan Dubyagin (1) Special thanks to Jean-Charles Matéo-Vélez (3) (1) Finnish Meteorological Institute, Helsinki,
Whistler anisotropy instability with a cold electron component: Linear theory
 JOURNAL OF GEOPHYSICAL RESEARCH, VOL. 117,, doi:10.1029/2012ja017631, 2012 Whistler anisotropy instability with a cold electron component: Linear theory S. Peter Gary, 1 Kaijun Liu, 1 Richard E. Denton,
Distribution of density along magnetospheric field lines
 JOURNAL OF GEOPHYSICAL RESEARCH, VOL. 111,, doi:10.1029/2005ja011414, 2006 Distribution of density along magnetospheric field lines R. E. Denton, 1 K. Takahashi, 2 I. A. Galkin, 3 P. A. Nsumei, 3 X. Huang,
Relativistic electron loss due to ultralow frequency waves and enhanced outward radial diffusion
 JOURNAL OF GEOPHYSICAL RESEARCH, VOL. 115,, doi:10.1029/2010ja015755, 2010 Relativistic electron loss due to ultralow frequency waves and enhanced outward radial diffusion T. M. Loto aniu, 1,2,4 H. J.
Direct observation of warping in the plasma sheet of Saturn
 GEOPHYSICAL RESEARCH LETTERS, VOL. 35, L24201, doi:10.1029/2008gl035970, 2008 Direct observation of warping in the plasma sheet of Saturn J. F. Carbary, 1 D. G. Mitchell, 1 C. Paranicas, 1 E. C. Roelof,
Laboratory simulation of magnetospheric chorus wave generation
 Plasma Phys. Control. Fusion 9 (17) 1416 (1pp) Plasma Physics and Controlled Fusion doi:1.188/741-333/9/1/1416 Laboratory simulation of magnetospheric chorus wave generation B Van Compernolle 1, X An,
RBSP Mission: Understanding Particle Acceleration and Electrodynamics of the Inner Magnetosphere
 RBSP Mission: Understanding Particle Acceleration and Electrodynamics of the Inner Magnetosphere A. Y. Ukhorskiy JHU/APL My God, space is radioactive! Ernie Ray, 1958 Спутник II, III [Vernov et al., 1959]
Comment on Effects of fast and slow solar wind on the correlation between interplanetary medium and geomagnetic activity by P.
 JOURNAL OF GEOPHYSICAL RESEARCH, VOL. 108, NO. A10, 1386, doi:10.1029/2002ja009746, 2003 Correction published 20 January 2004 Comment on Effects of fast and slow solar wind on the correlation between interplanetary
Relative contribution of electrons to the stormtime total ring current energy content
 GEOPHYSICAL RESEARCH LETTERS, VOL. 32, L311, doi:1.129/24gl21672, 25 Relative contribution of electrons to the stormtime total ring current energy content S. Liu, 1 M. W. Chen, 2 J. L. Roeder, 2 L. R.
Plasma Observations at the Earth's Magnetic Equator
 Plasma Observations at the Earth's Magnetic Equator R. C. OLSEN, S. D. SHAWHAN, D. L. GALLAGHER, J. L. GREEN, C. R. CHAPPELL, AND R. R. ANDERSON The magnetic equator provides a unique location for thermal
MODELING PARTICLE INJECTIONS TEST PARTICLE SIMULATIONS. Xinlin Li LASP, University of Colorado, Boulder, CO , USA
 1 MODELING PARTICLE INJECTIONS TEST PARTICLE SIMULATIONS Xinlin Li LASP, University of Colorado, Boulder, CO 80303-7814, USA ABSTRACT We model dispersionless injections of energetic particles associated
Cassini observations of the thermal plasma in the vicinity of Saturn s main rings and the F and G rings
 GEOPHYSICAL RESEARCH LETTERS, VOL. 32, L14S04, doi:10.1029/2005gl022690, 2005 Cassini observations of the thermal plasma in the vicinity of Saturn s main rings and the F and G rings R. L. Tokar, 1 R. E.
High-latitude Bow Shock: Tilt Angle Effects
 WDS'7 Proceedings of Contributed Papers, Part II, 9 33, 7. ISBN 978-8-7378-1 MATFYZPRESS High-latitude Bow Shock: Tilt Angle Effects K. Jelínek, Z. Němeček, and J. Šafránková Charles University, Faculty
Energetic outer zone electron loss timescales during low geomagnetic activity
 JOURNAL OF GEOPHYSICAL RESEARCH, VOL. 111,, doi:10.1029/2005ja011516, 2006 Energetic outer zone electron loss timescales during low geomagnetic activity Nigel P. Meredith, 1 Richard B. Horne, 1 Sarah A.
cos 6 λ m sin 2 λ m Mirror Point latitude Equatorial Pitch Angle Figure 5.1: Mirror point latitude as function of equatorial pitch angle.
 Chapter 5 The Inner Magnetosphere 5.1 Trapped Particles The motion of trapped particles in the inner magnetosphere is a combination of gyro motion, bounce motion, and gradient and curvature drifts. In
Wave-Particle Interaction Analyzer: Direct Measurements of Wave-Particle Interactions in the Jovian Inner Magnetosphere
 Symposium on Planetary Science 213 Wave-Particle Interaction Analyzer: Direct Measurements of Wave-Particle Interactions in the Jovian Inner Magnetosphere Yuto Katoh [1] and Hirotsugu Kojima [2] [1] Department
DEMETER satellite observations of lightning-induced electron precipitation
 Click Here for Full Article GEOPHYSICAL RESEARCH LETTERS, VOL. 34, L07103, doi:10.1029/2006gl029238, 2007 DEMETER satellite observations of lightning-induced electron precipitation U. S. Inan, 1 D. Piddyachiy,
RBSP Mission: Understanding Particle Acceleration and Electrodynamics of the Inner Magnetosphere. A. Y. Ukhorskiy, B. Mauk, N.
 RBSP Mission: Understanding Particle Acceleration and Electrodynamics of the Inner Magnetosphere A. Y. Ukhorskiy, B. Mauk, N. Fox JHU/APL My God, space is radioactive! Ernie Ray, 1958 Спутник II, III [Vernov
The STAFF-DWP wave instrument on the DSP equatorial spacecraft: description and first results
 The STAFF-DWP wave instrument on the DSP equatorial spacecraft: description and first results N. Cornilleau-Wehrlin, H. St. Alleyne, K. H. Yearby, B. De La Porte de Vaux, A. Meyer, O. Santolik, M. Parrot,
Ground based observations of diffuse auroral frequencies in the context of whistler mode chorus
 JOURNAL OF GEOPHYSICAL RESEARCH, VOL. 115,, doi:10.1029/2009ja014852, 2010 Ground based observations of diffuse auroral frequencies in the context of whistler mode chorus M. Samara 1 and R. G. Michell