Evaluation of Whistler-mode Chorus Intensification on the. Nightside During an Injection Event Observed on the
|
|
|
- Meryl Cole
- 6 years ago
- Views:
Transcription
1 1 2 3 Evaluation of Whistler-mode Chorus Intensification on the Nightside During an Injection Event Observed on the THEMIS Spacecraft W. Li 1, R. M. Thorne 1, V. Angelopoulos 2, J. W. Bonnell 3, J. P. McFadden 3, C. W. Carlson 3, O. LeContel 4, A. Roux 4, K. H. Glassmeier 5, and U. Auster W. Li and R. M. Thorne (moonli@atmos.ucla.edu; rmt@atmos.ucla.edu), Department of Atmospheric and Oceanic Sciences, University of California, Los Angeles, 405 Hilgard Avenue, Los Angeles, CA, , USA V. Angelopoulos (vassilis@ucla.edu), IGPP/ESS University of California, Los Angeles, CA, , USA J. W. Bonnell, C. W. Carlson, and J. P. McFadden (jbonnell@ssl.berkeley.edu; cwc@ssl.berkeley.edu; mcfadden@ssl.berkeley.edu), Space Sciences Laboratory, University of California, Berkeley, 7 Gauss Way, Berkeley, CA, , USA O. LeContel and A. Roux (Olivier.lecontel@cetp.ipsl.fr; Alain.roux@cetp.ipsl.fr), Centre d étude des Environnements Terrestre et Planétaires (CETP), Avenue de l Europe, Vélizy, France. 1
2 U. Auster and K. H. Glassmeier Institut für Geophysik und extraterrestrische Physik der Technischen 25 Universität Braunschweig, Mendelssohnstrasse 3, 38106, Braunschweig, Germany Department of Atmospheric and Oceanic Sciences, University of California, Los Angeles, CA , USA. 2 Institude of Geophysics and Planetary Physics / Department of Earth and Space Sciences, University of California, Los Angeles, Los Angeles, CA , USA. 3 Space Sciences Laboratory, University of California, Berkeley, Berkeley, CA, , USA. 4 Centre d étude des Environnements Terrestre et Planétaires (CETP)/IPSL, Avenue de l Europe, Vélizy, France. 5 Institut für Geophysik und extraterrestrische Physik der Technischen Universität Braunschweig, Mendelssohnstrasse 3, 38106, Braunschweig, Germany Abstract The intensification of the nightside whistler-mode chorus emissions is observed in the low-density region outside the plasmapause during the injection of anisotropic plasmasheet electrons into the inner magnetosphere. THEMIS data of the electron phase space density (PSD) over the energy range between 0.1 kev and 30 kev are used to develop an analytical model for the distribution of injected suprathermal electrons. The 2
3 path-integrated gain of chorus waves is then evaluated with the HOTRAY code by tracing whistler-mode chorus waves in a hot magnetized plasma. The simulated wave gain is compared to the observed wave electric field and magnetic field respectively. The results indicate that lower-energy (<1keV) plasmasheet electrons can penetrate deeper towards the Earth but cause little chorus intensification, while higher-energy (1keV- tens of kev) electrons can be injected at relatively higher L-shells and are responsible for the intensification of lower-band and upper-band whistler-mode chorus. Compared to the lower-band chorus, relatively higher electron anisotropy is required to generate upperband chorus. In addition, higher plasma density results in stronger wave intensity and broader frequency band of chorus waves. 1. Introduction Chorus waves are one of the most intense VLF emissions detected near the equatorial plane and they are characterized by a sequence of discrete elements (rising and falling tones) with a time separation between 0.1 and 1 seconds [Santolik et al., 2003]. The frequency of the chorus emission is typically in the range of f ce, where f ce is the equatorial electron cyclotron frequency [Burtis and Helliwell, 1969; Tsurutani and Smith, 1977; Koons and Roeder, 1990]. The source region of chorus is located outside the plasmapause near the geomagnetic equator [LeDocq et al., 1998; Lauben et al., 2002; Santolik et al., 2003]. Nightside chorus waves are confined to the equatorial region at latitudes below 10-15, while dayside emissions are stronger at latitudes above 20 [Tsurutani and Smith, 1974; Horne et al., 2005; Bortnik et al., 2007b]. Santolik et al. [2005] investigated the radial evolution of chorus and showed that upper-band chorus disappears for L-shell above 8, while lower-band chorus can be observed at frequencies 3
4 below 0.4 of the electron cyclotron frequency up to L-shell of Chorus emissions are predominantly observed during geomagnetically disturbed conditions [Tsusutani and Smith, 1974; Meredith et al., 2001, 2003a, 2003b; Miyoshi et al., 2003; Lyons et al., 2005] in association with enhanced flux of suprathermal electrons [Anderson and Maeda, 1977; Meredith et al., 2002; Miyoshi et al., 2007]. Whistler-mode chorus has recently received increased attention due to its important role in the physics of the Earth s radiation belts. Stochastic energy diffusion through resonating with chorus waves is a key mechanism for generating relativistic electrons outside the plasmapause in the inner magnetosphere [Horne and Thorne, 1998, 2003; Summers et al., 1998, 2002; Meredith et al., 2001, 2003a, 2003b; Albert, 2002; Miyoshi et al., 2003; Horne et al., 2005, 2006; Albert and Young, 2005; Shprits et al., 2006; Thorne et al., 2007; Bortnik et al., 2007a; Li et al., 2007]. More recently, ultra-relativistic acceleration (URA) of electrons has been shown to be an effective electron energization mechanism in cosmic plasma environments that contain a magnetic mirror geometry and electromagnetic whistlermode emissions [Summers and Omura, 2007]. On the other hand, pitch angle scattering by chorus waves leads to intense microburst precipitation into the atmosphere and removal of energetic electrons from the outer radiation belt [Lorentzen et al., 2001; O Brien et al., 2004; Thorne et al., 2005]. Chorus emissions have been studied for several decades, but the generation mechanism of chorus is not yet well understood. It has been generally accepted that chorus waves are generated by the electron cyclotron resonance of whistler-mode waves with anisotropic electrons with energy between a few kev and tens of kev [e.g., Kennel and Petschek, 1966; Helliwell, 1967; Kennel and Thorne, 1967; Tsurutani and Smith, 4
5 ; Nunn et al., 1997; Trakhtengerts, 1999; Chum et al., 2007; Katoh and Omura, 2007a; 2007b; Omura et al., 2008]. During the interaction, the electron pitch angles are altered and free energy is transferred from the electrons to the waves. If the electron distribution function is approximately bi-maxwellian with T /T // >1 and if this temperature anisotropy is sufficiently large, cyclotron resonant instability can occur whenever the electron flux exceeds the limit for stable trapping [Kennel and Petschek, 1966]. An important consequence of such whistler-mode instability is that wave-particle scattering by enhanced waves will tend to reduce the particle anisotropy, maintaining the distribution at or near the instability thresholds [Gary and Wang, 1996]. Although chorus waves in gyroresonance with electrons may be amplified through the whistler-mode cyclotron instability, during propagation towards higher latitudes in the inhomogeneous magnetosphere, the wave propagation vector will become more oblique [e.g., Thorne and Kennel, 1967] leading to the onset of Landau damping of waves [Kennel and Thorne, 1967; Bortnik et al., 2007b]. Non-linear growth plays an important role in the chorus generation process. Omura and Summers [2004] analyzed the growth of whistler-mode waves driven by temperature anisotropy of hot relativistic electrons and showed that whistler-mode waves ultimately grow non-linearly to a saturation level which occurs due to a combination of non-linear trapping of resonant electrons and quasi-linear relaxation of the temperature anisotropy. Katoh and Omura [2006] carried out a self-consistent particle simulation with a dipole magnetic field model in which field-aligned whistler-mode emissions with rising tones were successfully reproduced using non-linear theory. In a more recent intensive computer simulation, Katoh and Omura [2007a; 2007b] have demonstrated that non- 5
6 linear discrete whistler-mode elements can be produced from the background thermal noise associated with the hot plasma found outside the plasmapause. Inhomogeneity in the background magnetic field has been established as a controlling factor in the chorus generation mechanism [e.g. Katoh and Omura, 2007a, 2007b]. However, in order to reduce computation time in these simulations, the assumption of field-aligned wave propagation was used, thus ignoring the important effect of Landau damping. Furthermore, a relatively large thermal anisotropy (T /T // -1 6) was adopted to provide the source of free energy for the wave growth. Nevertheless, the simulation was successful in demonstrating the spontaneous growth of chorus from background noise levels, wave saturation, and frequency triggering. Simulations that accurately reflect the conditions encountered in the chorus generation region in a large inhomogeneous system are still difficult because of the limitation of the current computational resources. The chorus generation process contains both linear and non-linear growth but linear growth plays a dominant role in the early stage and also has not been well understood yet. Using a one-dimensional Vlasov Hybrid simulation code, Nunn et al. [1997] showed that the most important parameter was linear growth rate and a value larger than 40 db/s was seen as the requirement for absolute non-linear instability. Nunn et al. [2003] showed that the linear growth rate has a two-fold significance: it provides the initial amplification that raises the weak input signals to levels at which non-linear wave trapping of electrons takes place, and non-linear growth rates generally have a magnitude which is roughly equal to the linear growth rate multiplied by a factor equal to the number of trapping oscillations undergone by the resonant particles [Nunn, 1990; 1993]. 6
7 The main purpose of this study is to quantify the path-integrated gain of chorus waves during the linear growth phase using observed particle phase space density (PSD) from the THEMIS spacecraft, and to compare the computed results with wave observation (from THEMIS). Chorus waves on the nightside are especially interesting because of the importance of the nightside storm-time chorus for the dynamics of energetic electrons in the outer radiation belt. The present paper is a sequel of the recent paper of Li et al., [2008], evaluating chorus amplification on the nightside with linear and quasi-linear theory using the observed electron distribution and incorporating important aspects of the oblique wave propagation through the inhomogeneous magnetospheric environment. The path-integrated wave gain is evaluated along the ray path in a realistic inhomogeneous plasma. In section 2, we present simultaneously observed electron flux and chorus spectral intensity during an injection event. The methodology and plasma model employed in the study are described in section 3. Computation of path-integrated gain of chorus waves for two selected events during an injection is presented in section 4 and compared to the observed waves. In section 5 and 6 we discuss and summarize the principal results of the study. 2. Observations From THEMIS A During an Injection Event The THEMIS mission [Angelepoulos, 2008] consists of 5 satellites (A, B, C, D, and E) in near-equatorial orbits with apogees above 10 Earth radii (R E ) and perigees below 2 R E. The electron pitch angle distribution data used in our study are collected from the Electro-Static Analyzer (ESA) [McFadden et al., 2008; Bonnell et al., 2008; Angelepoulos, 2008]. One major advantage of the ESA instument on THEMIS over that of the previous CRRES analysis [Li et al., 2008] is that the electron pitch angle 7
8 distribution is measured with adequate counting statistics over a time interval of ~ 3 seconds (compared to 5 minutes on CRRES). Electric and magnetic fields are observed by three types of sensors on THEMIS. The Flux-Gate Magnetometer (FGM) [Auster et al., 2008; Angelepoulos, 2008] and Search-Coil Magnetometer (SCM) [Roux et al., 2008; Le Contel et al., 2008; Angelepoulos, 2008] measure the magnetic fields, while the Electric Fields Instrument (EFI) [Angelepoulos, 2008] measures the electric fields. The SCM and EFI output waveforms are digitized and processed by the Digital Fields Board (DFB) [Cully et al., 2008]. The resulting amplitude values (filter bank data) are included in the survey mode telemetry, covering most orbits with a measurement cadence of four seconds in 6-logarithmically spaced frequency bands in the range of ~2 Hz 4 khz. For burst mode data the wave amplitudes are obtained with higher frequency resolution (16 bands). Equipped with the high-quality electric fields instrument (EFI) and magnetic fields instrument (SCM), the THEMIS spacecraft offer an excellent opportunity to study the characteristics of whistler-mode waves. In order to evaluate the local electron cyclotron frequency which is used to scale chorus frequencies, we also use the local magnetic field data collected from FGM. The orbit of the THEMIS A (with the apogee of 10 R E ) is especially favorable for the investigation of chorus amplification, when the phase of the apogee of the orbits are in the magnetotail, since the spacecraft scans a large range of radial distances in the inner magnetosphere and is very close to the magnetic equator, where the observation of the strong nightside chorus is expected. Figure 1a and Figure 1b show the three components of the solar wind magnetic field in the Geocentric Solar Magnetospheric (GSM) coordinate system and solar wind velocity in the Geocentric Solar Ecliptic (GSE) coordinate system respectively according 8
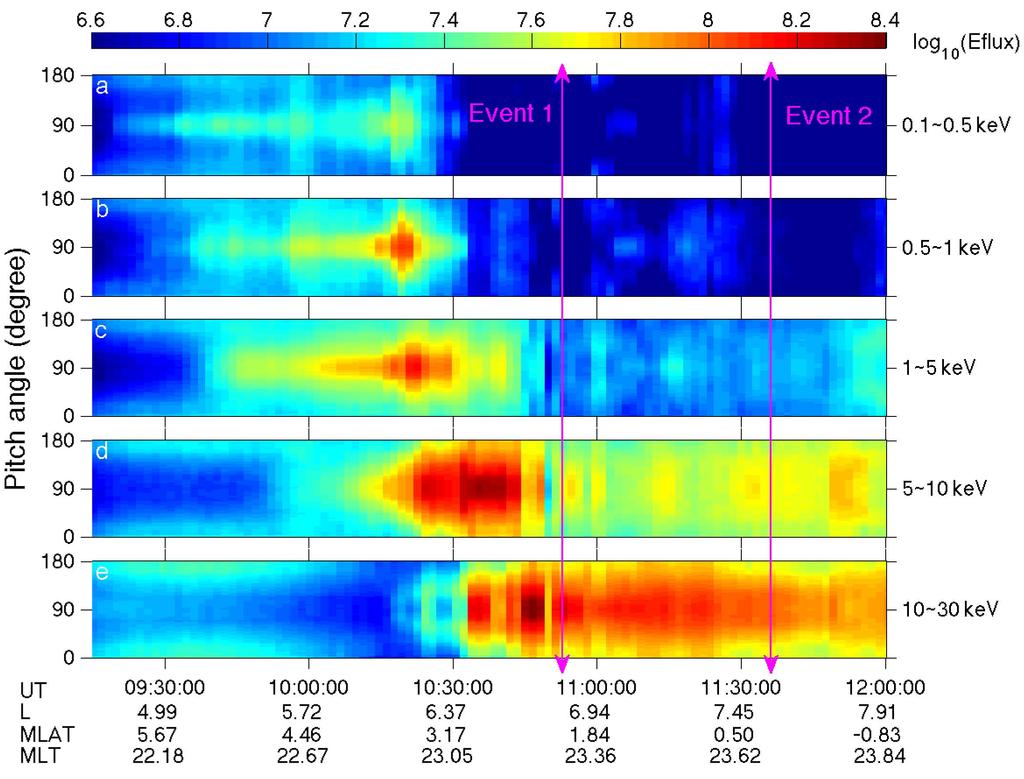
9 to the shifted solar wind data from ACE between 09:15UT and 12:00UT on 16 January Figure 1c shows the simultaneous electron flux observed on THEMIS A on 16 January Around 09:35UT, the z component of the interplanetary magnetic field (IMF) exhibited a northward turning, which could have triggered a substorm-induced injection of plasmasheet electrons [Lyons, 1995; Hsu and McPherron, 2004]. Subsequently, during the period between 10:05UT and 10:50UT, the IMF B z remained southward, the solar wind speed (V x ) persisted around 650 km/s, and B y reaches a high value of ~6 nt, all of which favor the presence of a strong magnetospheric convection leading to the injection of plasmasheet electrons from higher L-shells towards the Earth [Weimer, 1995]. Figure 2 shows the temporal evolution of the electron flux on THEMIS A as a function of pitch angle for various energies from 09:15UT to 12:00UT on 16 January During this period, THEMIS A is moving towards higher L-shells crossing the plasmapause at L~4.5 at ~ 09:20UT (plasmapause location is inferred from the spacecraft potential) and the electron distribution data is collected in the fast survey mode with a cadence of ~90 seconds and an accumulation time of 3 seconds. As it moved to higher L- shells, THEMIS A first observed newly injected anisotropic lower-energy electrons ( 1keV) and then gradually observed anisotropic higher-energy electrons when THEMIS A moved further out to higher L-shells. This differential injection is probably associated with an energy dependent Alfvén layer which allows lower-energy plasmasheet electrons to penetrate closer to the Earth, while higher-energy electrons are confined to relatively higher L-shells due to their stronger gradient drift. In Figure 3 filter bank data of wave electric field (a) and magnetic field (b) are shown on a logarithmic scale from 09:15UT to 9
10 :00UT for the same period as in Figure 2 with the time resolution of 4 seconds. Here the white solid, dot-dashed, and dashed lines indicate equatorial f ce, 0.5 f ce, and 0.1 f ce. Filter bank data are associated with 6 frequency bands between 2Hz and 4kHz. Chorus waves with the frequency of 0.1 f ce - 0.8f f ce are usually located in the top two frequency channels. The local electron cyclotron frequency f ce is obtained for each spectrum from the onboard measurement of the ambient magnetic field on FGM and converted to the equatorial electron cyclotron frequency. The values of L-shell, magnetic local time (MLT), and magnetic latitude (MLAT) have been calculated in the Solar Magnetic (SM) coordinate for each spectrum from the actual spacecraft position using the dipole magnetic field model (with very similar L-shell and MLT but slightly higher MLAT compared to the parameters obtained by Tsyganenko 89 magnetic field model [Tsyganenko, 1989] from SSCWeb). Intense chorus emissions are observed starting at ~10:15UT and persist until 11:50UT, in association with the injection of plasmasheet electrons with energy from a few kev to tens of kev (Figure 2). During this period, chorus waves constantly shift their frequency band from the higher frequency band to lower frequencies. The wave electric field is strongest in the top frequency band ( Hz), while wave magnetic field is strongest in the frequency band of Hz. We suggest that the strong electric field in the top frequency band is primarily due to the strong electrostatic electron cyclotron harmonic (ECH) waves [e.g., Horne et al., 2003], confined near the equator at frequencies above the electron cyclotron frequency. During the time interval between 11:30UT and 12:00UT both electron pitch angle distribution data and wave intensity data are available in the particle burst mode. Figure 4 and Figure 5 show the time evolution of electron flux and corresponding wave electric and magnetic 10
11 field power spectral density (from FFP data) with the same format as in Figure 2 and Figure 3 but during the period between 11:30UT and 12:00UT in the particle burst mode. During this period the electron flux becomes substantially smaller and distribution tends to be more isotropic due to electron scattering by waves as discussed in Li et al. [2008]. With the higher frequency resolution (16 frequency bands) in the particle burst mode data shown in Figure 5, we can clearly establish that chorus intensification is mostly in the lower band (0.1f ce < f < 0.5 f ce ) for both electric field and magnetic field between 11:30UT and 12:00UT. Figure 6 shows the time evolution of the electron PSD as a function of equatorial pitch angle for 15 different energy channels from kev to kev with an accumulation time of 3 seconds. At around 09:27UT there is an injection of anisotropic lower-energy electrons (0.1-1keV) forming pancake distributions. Subsequently, lowerenergy electrons are partially isotropized around 10:23UT, presumably due to the electron scattering by waves (e.g., upper-band chorus [Ni et al., 2008] and ECH waves [Horne et al., 2003]) and the intermediate-energy electrons (1-10keV) are injected simultaneously. As THEMIS A moves further out, intermediate-energy electrons are partially isotropized in association with a simultaneous increase in the PSD of higherenergy (>10keV) electrons at ~10:52UT. In the period of 11:21UT - 11:51UT, electron pitch angle distribution becomes further isotropized and the electron PSD gradually decreases. The evolution of the value of the electron anisotropy for various energy channels is shown in Figure 7. Each value of anisotropy is calculated for a fixed electron kinetic energy from Equation (1) [Chen et al., 1999] 250 π /2 f (E,α 0 )sin 3 α 0 dα 0 0 A = π /2 2 f (E,α 0 )cos 2 α 0 sinα 0 dα (1) 11
12 where α 0 is the equatorial pitch angle, E is kinetic energy, and f is the electron PSD, so that A=0 corresponds to pitch angle isotropy at a fixed energy. The largest anisotropy (~1.8) occurs around 10:18UT at electron energy of ~1keV. Anisotropic distribution of the lowest energy electrons is first observed as THEMIS A moves from lower L-shells to higher L-shells and subsequently the electrons energies associated with anisotropic distribution are observed to gradually increase up to tens of kev. Here we selected two events for detailed analysis: Event 1, at 10:52UT (during the fast survey mode, see mode definitions in Angelopoulos, [2008]), is selected because of the strong wave intensity observed in both electric field and magnetic field, and Event 2, at 11:37UT (during particle burst mode), is selected because of the availability of higher time and frequency resolution data. 3. Methodology and Model Description 3.1. HOTRAY Code The ray tracing program HOTRAY is designed to trace any type of electrostatic or electromagnetic wave mode in a hot, magnetized, linearly unstable plasma containing several electron and ion species with Maxwellian-type components at different temperatures [Horne, 1989]. In this study we evaluate whistler-mode wave growth (and damping) by solving the hot electromagnetic dispersion relation using the HOTRAY code, which determines the ray path and any change in the wave normal angle by integrating Hamilton s equations for a cold plasma so that wave frequency (ω) and wave number (k) remain real. At each step along the ray path the hot plasma dispersion relation is also solved for real ω and complex k = k r +ik i in order to obtain the path-integrated wave gain. Details on the methodology of calculating path-integrated wave gain are 12
13 described in earlier papers [e.g., Horne, 1989; Horne and Thorne, 1997; Horne et al., 2003]. The net amplification of the wave electric field (E/E 0 ) (or gain G in db) over a distance r along the ray path [Horne and Thorne, 1997] is given by: ( E / E ) = k d (2) G = 20log10 0 i r. In order to calculate Hamilton s equation, the particle distribution function must be defined for each particle species, which will be discussed in section 3.2. In addition, solving Hamilton s equation also requires constructing a magnetic field model and plasma density model. We assume chorus propagation in the dipole magnetic field and the detailed plasma density model will be discussed in section Electron distribution function To evaluate the effect of resonant interactions on wave growth and damping we need to model the PSD of the resonant electrons. The observed electron PSD (f) is fitted with a sum of subtracted Maxwellian components [Ashour-Abdalla and Kennel, 1978] given by f = f i (3), i 289 where each component f i is expressed by 290 f ( v i, v ) = π // 3 / 2 Δ i n α i 2 i α // i 2 v exp 2 α v// exp 2 α // i 2 i 2 (1 Δ ) i v + exp( 2 (1 ) βi α i 2 v ) exp( 2 β α i i ). (4) The parameters β i and Δ i determine the loss cone feature of the electron distribution, n i is the electron density, and α i and α //i are the thermal velocities perpendicular and parallel to the ambient magnetic field. The effective pitch angle anisotropy for the resonant 13
14 electrons, which controls the rate of linear wave growth can be obtained from the integral [Kennel and Petschek, 1966] A( V R f f v v dv v// v v v 0 // v// ) = (5). 2 f v dv 0 v// = V R This definition of A, used in the evaluation of wave growth rate, is different from the previous definition in equation (1) for a fixed energy, since it integrates over all v for a given v // and thus spans a large range of particle energies Plasma Density Model Electron and ion density measured from ESA instrument on THEMIS A are generally underestimated since the measurements are limited at low energy (~10eV) due to photoelectrons emitted by the spacecraft surface and returning at the ESA instrument from typical spacecraft potential values of ~10Volts. Consequently, cold electrons (with energy less than a few ev) which probably constitute a large percentage in the total density are not taken into account. Because of the uncertainties in the measured plasma density on the ESA instrument we use three different cold plasma density models (DM 1, DM 2, and DM 3) based on the plasmatrough density model in Sheeley et al. [2001] at the equator as shown in Figure 8. During the studied injection event, the plasmapause is located at L~4.5, which can be inferred from the value of the spacecraft potential measured by EFI on THEMIS A. The black dashed line and solid line are the maximum and minimum plasma density at ~23:30MLT from the statistical plasmatrough density model [Sheeley et al., 2001]. Here we use three cold plasma density models with the main difference of the plasma density outside the plasmapause limited between minimum and 14
15 maximum values in the model of Sheeley et al. [2001]. The three red curves are obtained by adjusting the parameters in a diffusive equilibrium density model based on Angerami and Thomas [1964] and Inan and Bell [1977]. In this paper we will compute the amplification of chorus waves based on these three cold plasma density models and evaluate the effects of plasma density on the generated wave intensity and frequency spectrum. 4. Simulation of the Linear Phase of Chorus Amplification for Event 1 and Event 2 In this section, we show the simulated results of chorus amplification and compare the excited chorus spectrum with observation for the two events occurring at 10:52UT (Event 1) and 11:37UT (Event 2). In order to evaluate chorus amplification, we first trace the rays with the HOTRAY code based on the cold plasma density model (DM 1) shown in Figure 8. The electron PSD observed from THEMIS A at 10:52UT (Event 1) is fitted using the analytical function (Equation (3) and (4)) and the simulation result is shown in Figure 9a. Five components (i = 1, 2, 3, 4, 5) are used to fit the observed electron pitch angle distribution in velocity space in order to minimize the sum of the relative error (the difference of the measured and modeled PSD normalized to the measured PSD). Modeled contours (solid lines) of the electron PSD f(v, v // ) (or f(e, E // )) are obtained by adjusting n i, α i, α //i, Δ i, and β i to fit the observed electron distribution (dotted lines), and the parameters are given in Table 1. The first component represents cold electrons, whose density is from DM 1 at L=6.8 and the remaining four components indicate the suprathermal electrons with different thermal energies injected from the plasmasheet. The superimposed dashed lines represent the ellipses for the first order cyclotron resonance 15
16 with field-aligned chorus waves for the specified value of frequency normalized to the electron cyclotron frequency. These resonance ellipses are obtained by solving the cold plasma dispersion relation and resonance condition using the total electron density of 3.37 cm -3 (the sum of the density for 5 components listed in Table 1). Lower frequency chorus (e.g., 0.3f ce ) tends to resonate with higher energy electrons (a few kev to tens of kev), while higher frequency chorus (e.g., 0.6f ce ) mainly resonate with lower energy electrons (<1keV). The total wave gain for a fixed frequency is evaluated by an integration along the resonance ellipses over various energies (dashed lines in Figure 9a). The electron anisotropy calculated from the fitted electron distribution using equation (5) maximizes at 1.5 for the electrons with parallel energy of ~1keV, and becomes smaller for lower and higher parallel energies, as shown in Figure 9b. The obtained parameters, listed in Table 1, are used as an input to the HOTRAY code to trace the rays and obtain path-integrated wave gain as described below. The distribution of the injected suprathermal electrons is assumed to be constant with latitude and unchanged through the whole simulation (< 1s), which is reasonable over the limited region of wave amplification. The HOTRAY results for the propagation characteristics and amplification of chorus waves with a frequency of f/f ce = 0.42 at 10:52UT using the plasma density model - DM 1 are shown in Figure 10. During this event THEMIS A is located at L ~ 6.8 and 23:17MLT very near the equator (λ<2 ). A number of rays are first launched from the equator (the position E) towards the Southern Hemisphere with various wave normal angles to obtain the final position and wave parameters of the ray which experiences the maximum gain. Subsequently, the optimum ray with strongest amplification is traced 16
17 towards the Northern Hemisphere as shown in Figure 10a from the position A to calculate the wave gain, and finally is stopped at the position B when the gain drops by 20 db (following the maximum wave gain) due to strong Landau damping. Backward ray tracing from the equator (the position E) towards the Southern Hemisphere is performed first to evaluate the optimum conditions for the maximum path-integrated gain over a path between the equator and a point in the Southern Hemisphere where the temporal wave growth rate falls to zero. Rays retraced forwards from this position A to E will experience exactly the same growth rates and path-integrated wave gain and thus identify the equatorial waves with the strongest net gain. Changes in the wave normal angle ψ are indicated along the ray path shown in Figure 10a and Figure 10b. Negative ψ indicates that wave normal points towards lower L-shells, and positive ψ is obtained when wave normal points towards higher L-shells. The depicted ray is initiated near λ = -15º with a wave normal angle of ~ -32.6º, becomes field-aligned at λ ~ -6º, and reaches the equator (the position E) with ψ 24. During this portion of the ray path, the growth rate remains positive (Figure 10d) and the net gain reaches ~ 800 db at the equator (Figure 10c). Interestingly, the maximum normalized wave growth rate (γ/ω e ~ ) is obtained when the ray becomes field-aligned with ψ=0. Subsequently, the wave normal angle becomes more oblique and the ray is ultimately attenuated due to Landau damping once ψ 30. During propagation, wave refraction by plasma density and magnetic field gradients change the wave normal angles and the resonant energies, and thus the locally observed wave spectrum may be somewhat different from the source region. Similar calculations are performed for various frequency waves and the simulation results are shown in Figure 11. Figure 11a and 11b show the path-integrated 17
18 wave gain and L-shell along the ray path as a function of magnetic latitude respectively. Different colors represent the rays with different frequencies each normalized to the equatorial electron cyclotron frequency. All rays are initiated below the equator, and cross the equator with the optimum maximum wave gain among all kinds of rays with different starting wave normal angles and source region. These rays propagate almost along the same magnetic field line crossing a small range of L, typically ΔL 0.2 with the same crossing point (L = 6.8) at the equator (Figure 11b). Lower frequency chorus (f < 0.22 f ce ) and higher frequency chorus (f > 0.58f ce ) exhibit very little amplification owing to low resonant electron flux and insufficient anisotropies respectively. Chorus with a frequency of 0.42 f ce attains the highest wave gain (~800 db) at the equator, and finally becomes Landau damped as the ray becomes more oblique. Near the equator strong wave gain (>50dB), sufficient to drive waves to amplitudes where non-linear process should lead to wave saturation [e.g., Katoh and Omura, 2007a, 2007b], occurs both in the lower band and upper band over a frequency range between 0.22 f ce and 0.58 f ce and such strong wave gain (> 50dB) is confined within 15 of the equator. Gary and Wang [1996] showed that during cyclotron resonant instability the fluctuating wave fields grow rapidly to saturation, followed by electron pitch angle scattering, which reduces T and enhances T // so that electron temperature anisotropy and the maximum growth rate are strongly reduced. After saturation, the wave energy density and T /T // undergo relatively little change. Devine et al. [1995] concluded that resonant electron pitch angle diffusion is consistent with the quasi-linear approach during the early stages of their simulations, but that non-linear trapping may arise later in their runs. In our current study, chorus waves are assumed to grow from the noise level and produce 18
19 observable waves for path-integrated gain larger than 50 db. Since the electron pitch angle distribution remains constant during the ray tracing, the whistler-mode instability is sustained and the wave gain continues to increase. In a realistic magnetosphere, however, non-linear saturation will limit the observed wave intensity once the path-integrated gain exceeds ~50 db. The non-linear phase of wave amplification (G > 50dB) cannot be treated in our simulation. Therefore, we assume that the linear growth rates obtained by ray tracing with HOTRAY provide a realistic treatment of the gain at different frequencies as long as the wave gain is smaller than 50 db, which allows us to predict the frequency band of excited waves. Once the gain exceeds 50 db, non-linear process should come into play and the wave amplitude will saturate and thus the values of G > 50 db are not meaningful. In Figure 11 we continue to plot the gain exceeding 50 db to evaluate the competition between cyclotron resonance and Landau damping. In the cyclotron resonance dominant region, electrons continue to provide free energy to waves which should eventually lead to non-linear effect and wave saturation. In addition, we suggest that after a decrease in wave gain by 20 db due to Landau damping (following the peak gain), chorus should become weak and unobservable, which is indicated by the dotted lines with corresponding colors in Figure 11a. Our simulation of wave amplification with the HOTRAY code is only valid over the initial linear regime of wave growth, and non-linear processes would need to be included to account for the observed saturation of wave intensity. Nonetheless, our calculations indicate that intense wave growth (G > 50 db) can occur until non-linear processes begin to control wave intensities over a broad region within 15 of the equator (Figure 11a), consistent with satellite observations on the distribution of nightside chorus [Tsurutani and Smith, 1974; Meredith 19
20 et al., 2003a; Bortnik et al., 2007b]. Chorus waves become more oblique as they propagate to higher latitudes, and eventually Landau damping will dominate over cyclotron resonant growth [Kennel and Thorne, 1967], which lead to the confinement of nightside chorus to latitudes below ~ From Figure 3 the observed chorus intensity at 10:52UT reaches a large value both in the lower band and upper band, which is consistent with our simulation results for the observable wave bands (>50dB) over the frequency band of 0.22f ce -0.58f ce. A similar analysis is applied to Event 2 (occurring at 11:37UT) when THEMIS A is at L~7.56 and 23:40MLT near the equator. In Event 2 the electron PSD is much lower and electron pitch angle distribution is more isotropic compared to Event 1 as shown in Figure 6. Figure 12 shows the fitted electron PSD for Event 2 (with the same format as Figure 9) and the corresponding parameters obtained from fitting are listed in Table 2. The value of the anisotropy is comparable to 0.35 for electrons with energy larger than ~1keV. Optimum wave gain modeled with the HOTRAY code for various frequencies using the same technique as for Figure 11a is shown in Figure 13a. These rays start from the Southern Hemisphere and propagate towards the Northern Hemisphere across the magnetic equator. The ray paths closely follow along the magnetic field line crossing a small range of L, typically ΔL 0.2 (Figure 13b). The modest wave gain (> 20 db) near the equator occurs over the narrow frequency range of 0.18 f ce ~ 0.22 f ce and the wave gain is below the saturation level (~50dB). From Figure 3 and Figure 5, observed chorus power spectral density at 11:37UT shows a modest intensity in the lower-band (below 0.5f ce ), which is qualitatively consistent with the simulation results. 20
21 The above simulation of chorus amplification for Event 1 and Event 2 is obtained using the plasma density model - DM 1. We also computed the intensified chorus spectrum based on DM 2 and DM 3. The modeled results are exhibited in Figure 14, which shows path-integrated wave gain as a function of normalized wave frequency for Event 1 (blue) and Event 2 (red) with the 3 different plasma density models shown in Figure 8. Compared to Event 2, the excited chorus waves for Event 1 are associated with higher normalized wave frequencies and much larger wave gain independent of plasma density. In both events, the wave gain is stronger and the excited frequency band is broader for higher plasma density, which indicates that the plasma density indeed plays a role in controlling the frequency spectrum and wave intensity of the excited chorus. This is because the change in plasma density affects the wave phase velocity, which determines the minimum resonance energy of electrons. The minimum resonance energy controls the fraction of resonant electrons, thus contributing to the wave growth rates. In order to compare the computed wave intensity with observation, a plot of the observed wave electric field and magnetic field (the top two frequency bands ( Hz and Hz) in Figure 3) is shown in Figure 15. Wave electric field and magnetic field in Event 1 is stronger than that in Event 2 and the strongest wave field tends to shift from the higher frequency band of Hz (blue line) to the lower frequency band of Hz (red line) in Event 2. In Event 1, due to the limited frequency resolution in the survey mode data, it is difficult to directly compare the simulation results with the observed wave spectrum. However, it can still be seen in Figure 3 and Figure 15 that both lower-band and upper-band chorus are indeed intensified at 10:52UT, which is qualitatively consistent with the computed wave spectrum with an excited frequency 21
22 band of f ce shown in Figure 11a and Figure 14. For Event 2, modest intensification of chorus is located in the lower-band as can be clearly seen in Figure 5, which is consistent with simulation results in Figure 13 and Discussion The rate of wave growth or damping depends on the fraction of electrons that resonate with the waves and the electron anisotropy. In order to excite observable chorus emission, the injected electron flux should be high and the resonant electron pitch angle anisotropy should be large enough to satisfy the marginal stability threshold [Kennel and Petschek, 1966] for whistler-mode waves. In Event 1 during the enhanced injection, the PSD of the injected suprathermal electrons was relatively high and the electron anisotropy was large enough, thus causing the excitation of both upper-band and lowerband chorus. However, in Event 2 at relatively higher L-shells when the injection is weak, the PSD of the injected suprathermal electrons is relatively low with small anisotropy, which results in the generation of modest lower-band chorus. This result is consistent with Santolik et al. [2005] showing that the lower-band chorus is observed at relatively higher L-shells and the signature of the upper-band chorus is absent at L 8. In addition, the generated wave intensity and spectrum are also controlled by the plasma density. Higher plasma density will result in stronger wave intensity and broader frequency band of chorus waves. In this paper, we used two kinds of definition for electron anisotropy shown in Equation (1) and Equation (5) respectively. The definition from Equation (1) is for a fixed kinetic energy and is used to show the evolution of the electron pitch angle distribution for different energy levels as THEMIS A moves out from the lower L-shells 22
23 to higher L-shells. However, the linear wave growth rates are directly dependent on the electron anisotropy for the resonant parallel energy defined by Equation (5) since the total wave gain for a fixed frequency is evaluated by an integration over the resonance ellipses. It is interesting to note that intense chorus waves are associated with the injection of the suprathermal electrons with energy between a few kev and tens of kev, while lower-energy (<1keV) electron injection is not accompanied with simultaneous chorus intensification as shown in Figure 2 and Figure 3b, which suggest that lower-energy electrons play a minor role in chorus intensification on the nightside. We suggest the reason is that such lower-energy electrons would resonate with much higher frequencies and would require larger anisotropies for wave generation. For example, lower-energy electrons (<~1keV) are mainly resonating with higher frequency waves (>0.6 f ce ) for the first order resonance and electron anisotropy of at least 1.5 would be required to excite the waves with the frequency of 0.6f ce. In fact, observation of electron distribution with very high anisotropy with enough flux are rare, which results in little contribution to chorus excitation from the lower-energy electrons. Conversely, such lower-energy electrons are effective for Landau resonance, and thus account for wave damping of oblique chorus. Due to the underestimation of the measured plasma density from THEMIS A, we used 3 plasma density models to perform the ray tracing. The plasma density model used in our study contains uncertainties particularly inside the plasmapause. Chorus waves are generally accepted to be excited outside the plasmapause and previous studies (e.g., [Bortnik et al., 2007b]) showed that intense wave power of chorus waves on the nightside 23
24 is confined to the magnetic latitudes below ~ For the nightside chorus waves observed at L=6.8 (Event 1) and L=7.56 (Event 2), the intense wave power is also shown to be confined very near the equator (<15 ) and in both events most chorus is unlikely to penetrate into the plasmasphere during the whole ray tracing process. Therefore, only the plasma density outside the plasmapause (L>4.5) plays an important role in our selected events, which implies that the current plasma density model should lead to reasonable results of path-integrated wave gain. However, for the analysis of dayside chorus which could propagate to higher latitudes (>20 ), a more advanced plasma density model would be required to simulate the chorus wave growth. In our study we used a dipole magnetic field to perform the ray tracing analysis. However, in reality outside the plasmapause near an L-shell of 6-8, the magnetic field is stretched, which might result in the wave gain being more confined to the equator due to the stronger refraction by the magnetic field gradient. A more realistic magnetic field model, including the stretchment on the nightside and compression on the dayside, should be considered in order to more accurately simulate the global distribution of chorus waves and is left for future study. In addition, although both lower-band and upper-band chorus are generated from our simulation, we cannot produce the gap in wave intensity at ~0.5f ce using linear and quasi-linear theory. The gap at 0.5 f ce might be associated with power absorption by particles during chorus propagation or might be related to non-linear effects. Nonetheless, the ray tracing approach using linear and quasi-linear theory allows us to predict the frequency band of excited waves which are qualitatively consistent with observation. 24
25 This study is a sequal of Li et al. [2008], in which an injection event observed by CRRES is simulated in a similar way focusing on the nightside. However, this paper is an improvement compared to Li et al. [2008] due to the following reasons. In Li et al. [2008], electron distribution data from CRRES were averaged over 5 minutes to obtain good counting statistics. However, during 5 minutes, the electron distribution can be partially isotropized by waves, which motivated us to use a slightly higher anisotropy to reproduce the observed wave spectrum. In the injection event observed on CRRES, intensification of the lower-band chorus is mainly observed, since the injected suprathermal electron flux and anisotropy are not large enough to produce the upper-band chorus, while during the strong injection observed on THEMIS, both lower-band and upper-band chorus are intensified due to the higher electron flux and larger anisotropy. The electron distribution data from THEMIS have a much higher time resolution of 3 seconds, so that the temporal evolution of electron distribution can be more realistically recorded. In addition, this study also evaluated the effects of the plasma density on chorus generation and found that higher plasma density results in stronger wave intensity and broader frequency band of chorus waves. 6. Summary and Conclusions In this study we have used the HOTRAY code to evaluate the path-integrated wave gain of whistler-mode chorus on the nightside based on the electron PSD data from the ESA instrument on THEMIS A for two separate events, and compared the results with observed wave intensities from EFI and SCM. The principal objective of this study was to investigate the frequency structure and latitudinal distribution of excited waves with linear and quasi-linear theory using the observed electron distribution. The non- 25
26 linear phase of the wave excitation is not considered here and readers interested in the non-linear wave dynamics including the saturation of wave intensities are referred to the recent work of Nunn et al. [2003], Nunn et al. [2005], Katoh and Omura [2007a; 2007b], and Omura et al. [2008]. The main results of the present study can be summarized as follows: 1. Nightside chorus is excited by the anisotropic distribution of the injected plasmasheet electron population at energies between a few kev and tens of kev. Lower-energy (<1keV) plasmasheet electrons can penetrate deeper towards the Earth but play a minor role in chorus intensification, while higher-energy (1keV - tens of kev) electrons can be injected at relatively higher L-shells where they cause the excitation of the chorus waves. 2. Compared to the lower-band (0.1 f ce < f < 0.5 f ce ) chorus, generation of upper-band (0.5 f ce < f < 0.8 f ce ) nightside chorus requires higher anisotropy to exceed the marginal stability threshold. Therefore, upper-band chorus tends to be excited in a more limited region (e.g., L<7 in the studied injection event), while generation of the lower-band chorus covers a broader region (up to L~7.8 in the studied event). 3. Plasma density affects both the frequency band and wave intensity of generated chorus waves. Higher plasma density results in stronger wave intensity and a broader frequency band of chorus waves. 4. Chorus waves within a limited frequency range initially grow to large amplitudes, but most rays are ultimately attenuated by strong Landau damping as they propagate away from the equator and become more oblique. Therefore, the strong wave power on the nightside is confined near the equator (λ<15 ). 26
27 The simulated chorus waves in Event 1 and Event 2 are qualitatively consistent with observation in terms of path-integrated wave gain and frequency spectrum Acknowledgments This research was funded by the NSF Grant ATM_ , NASA Heliophysics Theory Program Grant NNX08A035G, and NASA NAS The authors acknowledge OMNIWeb for the IMF and solar wind data from the ACE spacecraft and SSCWeb for providing spacecraft location obtained using Tsyganenko 89 magnetic field model References Albert, J. M. (2002), Nonlinear interaction of outer zone electrons with VLF waves, Geophys. Res. Lett., 29(8), 1275, doi: /2001gl Albert, J. M., and S. L. Young (2005), Multidimensional quasi-linear diffusion of radiation belt electrons, Geophys. Res. Lett., 32, L14110, doi: /2005gl Anderson, R. R., and K. Maeda (1977), VLF Emissions Associated With Enhanced Magnetospheric Electrons, J. Geophys. Res., 82(1), Angelopoulos, V. (2008), The THEMIS Mission, Space Sci. Rev., doi: /s Angerami, J. J., and J. O. Thomas (1964), Studies of planetary atmospheres: 1. Distribution of electrons + ions in Earth's exosphere, J. Geophys. Res., 69(21), Ashour-Abdalla, M. and C. F. Kennel (1978), Nonconvective and convective electron cyclotron harmonic instabilities. Journal of Geophysical Research 83(A4): doi: /0JGREA A issn:
28 Auster, H.U., Glassmeier, K.H., Magnes, W., Aydogar, O., Constantinescu, D., Fischer, D., Fornacon, K.H., Georgescu, E., Harvey, P., Hillenmaier, O., Kroth, R., Ludlam, M., Narita, Y., Okrafka, K., Plaschke, F., Richter, I., Schwarzi, H., Stoll, B., Valavanoglu, A., and Wiedemann, M. (2008), The THEMIS fluxgate magnetometer, Space Sci. Rev., doi: /s Bonnell, J.W., Mozer, F.S., Delory, G.T., Hull, A.J., Ergun, R.E., Cully, C.M., Angelopoulos, V., Harvey, P.R., (2008), The Electric Field Instrument (EFI) for THEMIS, Space Sci. Rev, Submitted. Bortnik, J., R. M. Thorne, N. P. Meredith, and O. Santolik (2007a), Ray tracing of penetrating chorus and its implications for the radiation belts, Geophys. Res. Lett., 34, L15109, doi: /2007gl Bortnik, J., R. M. Thorne, and N. P. Meredith (2007b), Modeling the propagation characteristics of chorus using CRRES suprathermal electron fluxes, J. Geophys. Res., 112, A08204, doi: /2006ja Burtis, W. J., and R. A. Helliwell (1969), Banded Chorus A New Type of VLF Radiation Observed in the Magnetosphere by OGO 1 and OGO 3, J. Geophys. Res., 74(11), Chen, M. W., J. L. Roeder, J. F. Fennell, L. R. Lyons, R. L. Lambour, and M. Schulz (1999), Proton ring current pitch angle distributions: Comparison of simulations with CRRES observations, J. Geophys. Res., 104(A8), 17,379 17,389. Chum, J., O. Santolik, A. W. Breneman, C. A. Kletzing, D. A. Gurnett, and J. S. Pickett (2007), Chorus source properties that produce time shifts and frequency range differences observed on different Cluster spacecraft, J. Geophys. Res., 112, A06206, 28
29 doi: /2006ja Cully, C.M., R.E. Ergun, K. Stevens, A. Nammari, and J. Westfall (2008), The THEMIS digital fields board, Space Sci. Rev. submitted. Devine, P. E., S. C. Chapman, and J. W. Eastwood (1995), One- and two-dimensional simulations of whistler mode waves in an anisotropic plasma, J. Geophys. Res., 100(A9), 17,189 17,204. Gary, S. P., and J. Wang (1996), Whistler instability: Electron anisotropy upper bound, J. Geophys. Res., 101(A5), 10,749 10,754. Helliwell, R. A., A theory of discrete emissions from the magnetosphere (1967), J. Geophys. Res., 72, Horne, R. B. (1989), Path-integrated growth of electrostatic waves: The generation of terrestrial myriametric radiation, J. Geophys. Res., 94(A7), Horne, R. B., and R. M. Thorne (1997), Wave heating of He + by electromagnetic ion cyclotron waves in the magnetosphere: Heating near the H + -He + bi-ion resonance frequency, J. Geophys. Res., 102(A6), 11,457 11,471. Horne, R. B., and R. M. Thorne (1998), Potential Waves for Relativistic Electron Scattering and Stochastic Acceleration During Magnetic Storms, Geophys. Res. Lett., 25(15), Horne R. B., R. M. Thorne (2003), Relativistic electron acceleration and precipitation during resonant interactions with whistler-mode chorus, Geophys. Res. Lett., 30 (10), 1527, doi: /2003gl Horne, R. B., R. M. Thorne, N. P. Meredith, and R. R. Anderson (2003), Diffuse auroral electron scattering by electron cyclotron harmonic and whistler mode waves during an 29
30 isolated substorm, J. Geophys. Res., 108(A7), 1290, doi: /2002ja Horne, R. B., R. M. Thorne, S. A. Glauert, J. M. Albert, N. P. Meredith, and R. R. Anderson (2005), Timescales for radiation belt electron acceleration by whistler mode chorus, J. Geophys. Res., 110, A03225, doi: / 2004JA Horne, R. B., N. P. Meredith, S. A. Glauert, A. Varostsou, D. Boscher, R. M. Thorne, Y. Y. Shprits, and R. R. Anderson (2006), Mechanisms for the acceleration of radiation belt electrons, in Recurrent Magnetic Storms: Corotating Solar Wind Streams, Geophys. Monogr. Ser., vol. 167, edited by B. Tsurutani et al., pp , AGU, Washington, D. C. Hsu, T.-S., and R. L. McPherron (2004), Average characteristics of triggered and nontriggered substorms, J. Geophys. Res., 109, A07208, doi: /2003ja Inan, U. S., and T. F. Bell (1977), The Plasmapause as a VLF Wave Guide, J. Geophys. Res., 82(19), Katoh, Y., and Y. Omura (2006), A study of generation mechanism of VLF triggered emission by self-consistent particle code, J. Geophys. Res., 111, A12207, doi: /2006ja Katoh, Y., and Y. Omura (2007a), Computer simulation of chorus wave generation in the Earth's inner magnetosphere, Geophys. Res. Lett., 34, L03102, doi: /2006gl Katoh, Y., and Y. Omura (2007b), Relativistic particle acceleration in the process of whistler-mode chorus wave generation, Geophys. Res. Lett., 34, L13102, doi: /2007gl Kennel, C. F., and H. E. Petschek (1966), Limit on stable trapped particle fluxes, J. 30
31 Geophys. Res., 71, Kennel, C. F., and R. M. Thorne (1967), Unstable Growth of Unducted Whistlers Propagating at an Angle to the Geomagnetic Field, J. Geophys. Res., 72(3), Koons, H. C., and J. L. Roeder (1990), A survey of equatorial magnetospheric wave activity between 5 and 8 R E, Planet. Space Sci., 38(10), Lauben, D. S., U. S. Inan, T. F. Bell, and D. A. Gurnett (2002), Source characteristics of ELF/VLF chorus, J. Geophys. Res., 107(A12), 1429, doi: /2000ja Le Contel, O., Roux, A., Robert, P., Coillot, C., Bouabdellah, A., de la Porte, B., Alison, D., Ruocco, S., Angelopoulos, V., Bromund, K., Chaston, C.C., Cully, C., Auster, H.U., Glassmeier, K.H., Baumjohann, W., Carlson, C.W., McFadden, J.P., Larson, D. (2008), First results of the THEMIS searchcoil magentometers, Space Sci. Rev., doi: /s y. LeDocq, M. J., D. A. Gurnett, and G. B. Hospodarsky (1998), Chorus Source Locations from VLF Poynting Flux Measurements with the Polar Spacecraft, Geophys. Res. Lett., 25(21), Li, W., Y. Y. Shprits, and R. M. Thorne (2007), Dynamic evolution of energetic outer zone electrons due to wave-particle interactions during storms, J. Geophys. Res., 112, A10220, doi: /2007ja Li, W., R. M. Thorne, N. P. Meredith, R. B. Horne, J. Bortnik, Y. Y. Shprits, and B. Ni (2008), Evaluation of whistler mode chorus amplification during an injection event observed on CRRES, J. Geophys. Res., 113, A09210, doi: /2008ja Lorentzen, K. R., J. B. Blake, U. S. Inan, and J. Bortnik (2001), Observations of relativistic electron microbursts in association with VLF chorus, J. Geophys. Res., 31
32 (A4), Lyons, L. R. (1995), A New Theory for Magnetospheric Substorms, J. Geophys. Res., 100(A10), 19,069 19,081. Lyons, L. R., D.-Y. Lee, R. M. Thorne, R. B. Horne, and A. J. Smith (2005), Solar windmagnetosphere coupling leading to relativistic electron energization during high-speed streams, J. Geophys. Res., 110, A11202, doi: /2005ja McFadden, J.P., Carlson, C.W., Larson, D., Angelopoulos, V., Ludlam, M., Abiad, R., Elliott, B., Turin, P., Marckwordt, M. (2008), The THEMIS ESA plasma instrument and in-flight calibration, Space Sci. Rev., submitted. Meredith, N. P., R. B. Horne, and R. R. Anderson (2001), Substorm dependence of chorus amplitudes: Implications for the acceleration of electrons to relativistic energies, J. Geophys. Res., 106(A7), 13,165 13,178. Meredith, N. P., R. B. Horne, R. H. A. Iles, R. M. Thorne, D. Heynderickx, and R. R. Anderson (2002), Outer zone relativistic electron acceleration associated with substorm-enhanced whistler mode chorus, J. Geophys. Res., 107(A7), 1144, /2001JA Meredith, N. P., R. B. Horne, R. M. Thorne, and R. R. Anderson (2003a), Favored regions for chorus-driven electron acceleration to relativistic energies in the Earth's outer radiation belt, Geophys. Res. Lett., 30(16), 1871, doi: /2003gl Meredith, N. P., M. Cain, R. B. Horne, R. M. Thorne, D. Summers, and R. R. Anderson (2003b), Evidence for chorus-driven electron acceleration to relativistic energies from a survey of geomagnetically disturbed periods, J. Geophys. Res., 108(A6), 1248, doi: /2002ja
33 Miyoshi, Y., A. Morioka, H. Misawa, T. Obara, T. Nagai, and Y. Kasahara (2003), Rebuilding process of the outer radiation belt during the 3 November 1993 magnetic storm: NOAA and Exos-D observations, J. Geophys. Res., 108(A1), 1004, doi: /2001ja Miyoshi, Y., A. Morioka, R. Kataoka, Y. Kasahara, and T. Mukai (2007), Evolution of the outer radiation belt during the November 1993 storms driven by corotating interaction regions, J. Geophys. Res., 112, A05210, doi: /2006ja Ni, B., R. M. Thorne, Y. Y. Shprits, and J. Bortnik (2008), Resonant scattering of plasma sheet electrons by whistler-mode chorus: Contribution to diffuse auroral precipitation, Geophys. Res. Lett., 35, L11106, doi: /2008gl Nunn, D. (1990), The numerical simulation of VLF non-linear wave particle interactions in collision free plasmas using the Vlasov Hybrid Simulation technique, Computer Physics Comms., 60, Nunn, D. (1993), A novel technique for the numerical simulation of hot collision free plasma; Vlasov Hybrid Simulation, J. Computational Phys., 108(1), Nunn, D., Y. Omura, H. Matsumoto, I. Nagano, and S. Yagitani (1997), The numerical simulation of VLF chorus and discrete emissions observed on the Geotail satellite using a Vlasov code, J. Geophys. Res., 102(A12), 27,083 27,098. Nunn, D., A. Demekhov, V. Trakhtengerts, and M. J. Rycroft, (2003), VLF emission triggering by a highly anisotropic electron plasma, Ann. Geophys., 21, Nunn, D., M. Rycroft, and V. Trakhtengerts, (2005), A parametric study of the numerical simulations of triggered VLF emissions, Ann. Geophys., 23, Omura, Y., and D. Summers (2004), Computer simulations of relativistic whistler-mode 33
34 wave-particle interactions, Phys. Plasmas, 11, Omura, Y., Y. Katoh, and D. Summers (2008), Theory and simulation of the generation of whistler-mode chorus, J. Geophys. Res., 113, A04223, doi: /2007ja O'Brien, T. P., M. D. Looper, and J. B. Blake (2004), Quantification of relativistic electron microburst losses during the GEM storms, Geophys. Res. Lett., 31, L04802, doi: /2003gl Roux, A., Le Contel, O., Coillot, C., Bouabdellah, A., de la Porte, B., Alison, D., Ruocco, S., and Vassal, M.C. (2008), The search coil magentometer for THEMIS, Space Sci. Rev, submitted Santolík, O., D. A. Gurnett, J. S. Pickett, M. Parrot, and N. Cornilleau-Wehrlin (2003), Spatio-temporal structure of storm-time chorus, J. Geophys. Res., 108(A7), 1278, doi: /2002ja Santolik, O., E. Macusova, K. H. Yearby, N. Cornilleau-Wehrlin, and H. StC. K. Alleyne (2005), Radial variation of whistler-mode chorus: First results from the STAFF/DWP instrument onboard the Double Star TC 1 spacecraft, Ann. Geophys., 23, Sheeley, B. W., M. B. Moldwin, H. K. Rassoul, and R. R. Anderson (2001), An empirical plasmasphere and trough density model: CRRES observations, J. Geophys. Res., 106(A11), 25,631 25,641. Shprits, Y. Y., R. M. Thorne, R. B. Horne, S. A. Glauert, M. Cartwright, C. T. Russell, D. N. Baker, and S. G. Kanekal (2006), Acceleration mechanism responsible for the formation of the new radiation belt during the 2003 Halloween solar storm, Geophys. Res. Lett., 33, L05104, doi: /2005gl
35 Summers, D., R. M. Thorne, and F. Xiao (1998), Relativistic theory of wave-particle resonant diffusion with application to electron acceleration in the magnetosphere, J. Geophys. Res., 103(A9), 20,487 20,500. Summers, D., C. Ma, N. P. Meredith, R. B. Horne, R. M. Thorne, D. Heynderickx, and R. R. Anderson (2002), Model of the energization of outer-zone electrons by whistlermode chorus during the October 9, 1990 geomagnetic storm, Geophys. Res. Lett., 29(24), 2174, doi: /2002gl Summers, D., and Y. Omura (2007), Ultra-relativistic acceleration of electrons in planetary magnetospheres, Geophys. Res. Lett., 34, L24205, doi: /2007gl Thorne, R., and C. Kennel (1967), Quasi-Trapped VLF Propagation in the Outer Magnetosphere, J. Geophys. Res., 72(3), Thorne, R. M., T. P. O'Brien, Y. Y. Shprits, D. Summers, and R. B. Horne (2005), Timescale for MeV electron microburst loss during geomagnetic storms, J. Geophys. Res., 110, A09202, doi: /2004ja Thorne, R. M., Y. Y. Shprits, N. P. Meredith, R. B. Horne, W. Li, and L. R. Lyons (2007), Refilling of the slot region between the inner and outer electron radiation belts during geomagnetic storms, J. Geophys. Res., 112, A06203, doi: /2006ja Trakhtengerts, V. Y. (1999), A generation mechanism for chorus emission, Ann. Geophys., 17, 95. Tsurutani, B. T., and E. J. Smith (1974), Postmidnight Chorus: A Substorm Phenomenon, J. Geophys. Res., 79(1),
36 Tsurutani, B. T., and E. J. Smith (1977), Two Types of Magnetospheric ELF Chorus and Their Substorm Dependences, J. Geophys. Res., 82(32), Tsyganenko, N. A. (1989), A magnetospheric magnetic field model with a warped tail current sheet, Planet. Space Sci., 37, 5. Weimer, D. R. (1995), Models of High-Latitude Electric Potentials Derived with a Least Error Fit of Spherical Harmonic Coefficients, J. Geophys. Res., 100(A10), 19,595 19,607. Figure 1. (a) Three components of the solar wind magnetic field in GSM coordinate system and (b) solar wind velocity in GSE coordinate system observed on ACE satellite from 09:15UT to 12:00UT on 16 January (c) The time evolution of the logarithmic of electron flux as a function of electron kinetic energy in units of cm -2 s -1 sr -1 observed from the ESA instrument on THEMIS A from 09:15UT to 12:00UT on 16 January Figure 2. The time evolution of the logarithmic of the electron flux measured by the ESA instrument on THEMIS A in units of cm -2 s -1 sr -1 using the fast survey mode with a cadence of ~90 seconds and an accumulation time of 3 seconds for various energy channels (a: keV, b: 0.5-1keV, c: 1-5keV, d: 5-10keV, e: 10-30keV). Electron flux is shown as a function of pitch angle for various energy electrons from 09:15 UT to 12:00 UT on 16 January Figure 3. Spectrograms of the logarithmic of wave electric field (a) and magnetic field (b) from the filter bank data on THEMIS A with an accumulation time of 4 seconds from 09:15 UT to 12:00 UT in units of mv/m and nt respectively. The solid, dot-dashed, and dashed white lines indicate equatorial electron cyclotron frequency (f ce ), 0.5 f ce, and 0.1 f ce respectively. 36
37 Figure 4. The time evolution of the logarithmic of the electron flux in units of cm -2 s -1 sr - 1 as a function of pitch angle for various energy electrons from 11:30 UT to 12:00 UT on 16 January 2008 using particle burst mode data with a time interval of 3 seconds for various energy channels (a: keV, b: 0.5-1keV, c: 1-5keV, d: 5-10keV, e: 10-30keV). Figure 5. (a) Spectrograms of the logarithmic of electric field power spectral density measured from EFI (particle burst mode) on THEMIS A between 11:30 UT and 12:00 UT in units of V 2 m -2 Hz -1. The solid, dot-dashed, and dashed white lines indicate f ce, 0.5f ce, and 0.1f ce. (b) Spectrograms of the logarithmic of magnetic field power spectral density measured from SCM (particle burst mode) on THEMIS A in units of nt 2 Hz -1 during the same period. Figure 6. The time evolution of electron phase space density as a function of pitch angle for 15 different energy levels ( kev) from 09:14:41 UT to 11:51:28 UT with an accumulation time of 3 seconds. Figure 7. The time evolution of the electron anisotropy for various energy electrons with an accumulation time of 3 seconds from 09:15UT to 12:00UT. Figure 8. Models of cold electron density as a function of L-shell. The black dashed line and solid line indicate maximum and minimum electron density from the plasmatrough density model [Sheeley et al., 2001], and the red lines are three different density models (DM 1, DM 2, and DM 3) used in this study. Figure 9. (a) Contours of the electron PSD in (ln (s 3 m -6 )) as a function of perpendicular and parallel velocity (ms -1 ) (or corresponding perpendicular and parallel kinetic energy (kev) indicated by red axis). The dotted lines are the electron PSD data from ESA 37
38 measurement at 10:52 UT and the solid lines represent the contours of the electron PSD computed from the model. The dashed lines indicate the resonant ellipses for chorus waves with various frequencies (black: f = 0.3 f ce ; blue: f = 0.4 f ce ; magenta: f = 0.5 f ce ; red: f = 0.6 f ce ). (b) Electron anisotropy as a function of parallel electron velocity (ms -1 ). Figure 10. (a) HOTRAY simulation of ray tracing for whistler-mode chorus with frequency of 0.42 f ce starting from the position A at magnetic latitude of ~ -15 at 10:52UT and at ~23:17 MLT. The red line represents the ray path (from A to B) across the equator (E) at L~6.8, short blue lines are the corresponding wave normal directions, and the black dashed lines are the dipole magnetic field. Plotted below are the wave normal angle (b), path-integrated wave gain in units of db (c), normalized growth rate (γ/ω e ) (d), and magnetic latitude (λ) (e) as a function of group time in units of second. Figure 11. (a) Simulated path-integrated chorus wave gain in Event 1 as a function of magnetic latitude (λ) for various frequency waves normalized to the equatorial electron cyclotron frequency. The black dashed line represents the magnetic equator, and dotted lines with different colors correspond to waves damped by more than 20 db after the maximum gain is attained. The area below the dashed red line represents the region where the wave gain is smaller than 50 db, suggesting that wave intensity is below the observable value. (b) L-shell of the ray path as a function of magnetic latitude for the corresponding waves. Figure 12. The same format as Figure 9 but for the Event 2. The dashed lines are the resonant ellipses for the chorus waves with various frequencies (black: f = 0.2 f ce ; blue: f = 0.3 f ce ; magenta: f = 0.4 f ce ; red: f = 0.5 f ce ). Figure 13. The same format as Figure 11 but for the Event 2. 38
39 Figure 14. Equatorial chorus wave gain as a function of wave frequency normalized to the equatorial electron cyclotron frequency for Event 1 (blue) and Event 2 (red). Three different symbol lines indicate the computed wave gain with three different plasma density models shown in Figure 8 and the black dashed line indicates wave gain of 50 db. Figure 15. The time evolution of filter bank data of the amplitude of wave electric field (top) and magnetic field (bottom) in units of mv/m and nt respectively for the top two frequency channels in Figure 3 with the frequency range of Hz (blue line) and Hz (red line). Table 1. Parameters of electrons (5 components) used to simulate the observed 876 suprathermal electron PSD for Event 1. α i and α //i are perpendicular and parallel thermal velocity, n i is suprathermal electron density, and Δ i and β i describe loss cone features, where i represents each component. α i (m/s) α //i (m/s) n i (m -3 ) Δ i β i Table 2. The same format as Table 1 but for Event 2. 39
40 α i (m/s) α //i (m/s) n i (m -3 ) Δ i β i
41
42

43

44

45
Resonant scattering of plasma sheet electrons by whistler-mode chorus: Contribution to diffuse auroral precipitation
 Click Here for Full Article GEOPHYSICAL RESEARCH LETTERS, VOL. 35, L11106, doi:10.1029/2008gl034032, 2008 Resonant scattering of plasma sheet electrons by whistler-mode chorus: Contribution to diffuse
Landau damping and resultant unidirectional propagation of chorus waves
 GEOPHYSICAL RESEARCH LETTERS, VOL. 33, L03102, doi:10.1029/2005gl024553, 2006 Landau damping and resultant unidirectional propagation of chorus waves J. Bortnik, 1,2 U. S. Inan, 1 and T. F. Bell 1 Received
Modeling the wave normal distribution of chorus waves
 JOURNAL OF GEOPHYSICAL RESEARCH: SPACE PHYSICS, VOL. 8, 74 88, doi:.9/ja8343, 3 Modeling the wave normal distribution of chorus waves Lunjin Chen, Richard M. Thorne, Wen Li, and Jacob Bortnik Received
An unusual enhancement of low-frequency plasmaspheric hiss in the outer plasmasphere associated with substorm-injected electrons
 GEOPHYSICAL RESEARCH LETTERS, VOL. 40, 3798 3803, doi:10.1002/grl.50787, 2013 An unusual enhancement of low-frequency plasmaspheric hiss in the outer plasmasphere associated with substorm-injected electrons
LETTERS. The unexpected origin of plasmaspheric hiss from discrete chorus emissions. Jacob Bortnik 1, Richard M. Thorne 1 & Nigel P.
 Vol 2 March 2008 doi:10.1038/nature01 The unexpected origin of plasmaspheric hiss from discrete chorus emissions Jacob Bortnik 1, Richard M. Thorne 1 & Nigel P. Meredith 2 Plasmaspheric hiss 1 is a type
Full particle simulation of whistler-mode rising chorus emissions in the magnetosphere
 JOURNAL OF GEOPHYSICAL RESEARCH, VOL. 114,, doi:10.1029/2008ja013625, 2009 Full particle simulation of whistler-mode rising chorus emissions in the magnetosphere M. Hikishima, 1 S. Yagitani, 1 Y. Omura,
Global distribution of electrostatic electron cyclotron harmonic waves observed on THEMIS
 GEOPHYSICAL RESEARCH LETTERS, VOL. 38,, doi:10.1029/2011gl048793, 2011 Global distribution of electrostatic electron cyclotron harmonic waves observed on THEMIS Binbin Ni, 1 Richard Thorne, 1 Jun Liang,
Nonlinear processes of whistler-mode wave-particle interactions
 Nonlinear processes of whistler-mode wave-particle interactions Yoshiharu Omura Research Institute for Sustainable Humanosphere, Kyoto University omura@rish.kyoto-u.ac.jp RBSP SWG Meeting, APL, May 16-17,
Locations of chorus emissions observed by the Polar Plasma Wave Instrument
 Click Here for Full Article JOURNAL OF GEOPHYSICAL RESEARCH, VOL. 115,, doi:10.1029/2009ja014579, 2010 Locations of chorus emissions observed by the Polar Plasma Wave Instrument K. Sigsbee, 1 J. D. Menietti,
Vania K. Jordanova Los Alamos National Laboratory, Los Alamos, NM 87545, USA
 Vania K. Jordanova Los Alamos National Laboratory, Los Alamos, NM 87545, USA What is the contribution from different ion species to inner magnetosphere dynamics:» Simulations of ring current H +, He +,
Oblique lower band chorus waves: Time shifts between discrete elements observed by the Cluster spacecraft
 Click Here for Full Article JOURNAL OF GEOPHYSICAL RESEARCH, VOL. 114,, doi:10.1029/2009ja014366, 2009 Oblique lower band chorus waves: Time shifts between discrete elements observed by the Cluster spacecraft
Mission to Understand Electron Pitch Angle Diffusion and Characterize Precipitation Bands and Spikes. J. F. Fennell 1 and P. T.
 Mission to Understand Electron Pitch Angle Diffusion and Characterize Precipitation Bands and Spikes J. F. Fennell 1 and P. T. O Brien 2 1 The Aerospace Corporation, MS:M2-260, P.O.Box 92957, Los Angeles,
Global distributions of suprathermal electrons observed on THEMIS and potential mechanisms for access into the plasmasphere
 JOURNAL OF GEOPHYSICAL RESEARCH, VOL. 115,, doi:10.1029/2010ja015687, 2010 Global distributions of suprathermal electrons observed on THEMIS and potential mechanisms for access into the plasmasphere W.
Scattering rates of inner belt protons by EMIC waves: A comparison between test particle and diffusion simulations
 GEOPHYSICAL RESEARCH LETTERS, VOL. 40, 4793 4797, doi:10.1002/grl.50925, 2013 Scattering rates of inner belt protons by EMIC waves: A comparison between test particle and diffusion simulations M. de Soria-Santacruz,
Generation Mechanism of Whistler-mode Chorus Emissions
 Generation Mechanism of Whistler-mode Chorus Emissions Yoshiharu Omura Research Institute for Sustainable Humanosphere, Kyoto University, Kyoto, Japan omura@rish.kyoto-u.ac.jp 5th East-Asia School and
Whistler anisotropy instability with a cold electron component: Linear theory
 JOURNAL OF GEOPHYSICAL RESEARCH, VOL. 117,, doi:10.1029/2012ja017631, 2012 Whistler anisotropy instability with a cold electron component: Linear theory S. Peter Gary, 1 Kaijun Liu, 1 Richard E. Denton,
How is Earth s Radiation Belt Variability Controlled by Solar Wind Changes
 How is Earth s Radiation Belt Variability Controlled by Solar Wind Changes Richard M. Thorne Department of Atmospheric and Oceanic Sciences, UCLA Electron (left) and Proton (right) Radiation Belt Models
Low energy electron radiation environment for extreme events
 Low energy electron radiation environment for extreme events Natalia Ganushkina (1, 2) and Stepan Dubyagin (1) Special thanks to Jean-Charles Matéo-Vélez (3) (1) Finnish Meteorological Institute, Helsinki,
Natalia Ganushkina (1, 2), Stepan Dubyagin (1), Ilkka Sillanpää (1)
, Stepan Dubyagin (1), Ilkka Sillanpää (1)") From studying electron motion in the electromagnetic fields in the inner magnetosphere to the operational nowcast model for low energy (< 200 kev) electron fluxes responsible for surface charging Natalia
From studying electron motion in the electromagnetic fields in the inner magnetosphere to the operational nowcast model for low energy (< 200 kev) electron fluxes responsible for surface charging Natalia
Test Particle Simulations of Interaction Between Monochromatic Chorus Waves and Radiation Belt Relativistic Electrons
 DOI 10.1007/s10509-014-1859-1 ORIGINAL ARTICLE Test Particle Simulations of Interaction Between Monochromatic Chorus Waves and Radiation Belt Relativistic Electrons Zhonglei Gao Hui Zhu Lewei Zhang Qinghua
Title electromagnetic ion cyclotron trigg. Author(s) Shoji, Masafumi; Omura, Yoshiharu.
 Shoji, Masafumi; Omura, Yoshiharu.") Title Precipitation of highly energetic p electromagnetic ion cyclotron trigg Author(s) Shoji, Masafumi; Omura, Yoshiharu Citation Journal of Geophysical Research: Sp 117(A12) Issue Date 2012-12 URL http://hdl.handle.net/2433/193716
Title Precipitation of highly energetic p electromagnetic ion cyclotron trigg Author(s) Shoji, Masafumi; Omura, Yoshiharu Citation Journal of Geophysical Research: Sp 117(A12) Issue Date 2012-12 URL http://hdl.handle.net/2433/193716
Low Hanging Fruit. Large-Scale Dynamics & Structure
 Low Hanging Fruit Large-Scale Dynamics & Structure Global Models We plan to try to run DREAM-RB continuously with both SWx data and science data. This will be a limited model (1D, T89...) For events we
Relativistic Solar Electrons - where and how are they formed?
 Relativistic Solar Electrons - where and how are they formed? Ilan Roth Space Sciences, UC Berkeley Nonlinear Processes in Astrophysical Plasmas Kavli Institute for Theoretical Physics Santa Barbara September
The dawn of chorus in the cacophony: an update on its manifold effects, open problems, and opportunities.
 Explorer 1 launch: Jan. 31 st 1958 The dawn of chorus in the cacophony: an update on its manifold effects, open problems, and opportunities. Jacob Bortnik 1,2, PhD 1 Department of Atmospheric & Oceanic
Nonlinear interaction of radiation belt electrons with electromagnetic ion cyclotron waves
 Click Here for Full Article GEOPHYSICAL RESEARCH LETTERS, VOL. 36, L12110, doi:10.1029/2009gl038904, 2009 Nonlinear interaction of radiation belt electrons with electromagnetic ion cyclotron waves J. M.
Title waves in Earth's inner magnetospher. Right American Geophysical
 Title Nonlinear spatiotemporal evolution waves in Earth's inner magnetospher Author(s) Summers, Danny; Omura, Yoshiharu; M Dong-Hun Citation Journal of Geophysical Research: Sp 117(A9) Issue Date 01-09
Advanced modeling of low energy electrons responsible for surface charging
 Advanced modeling of low energy electrons responsible for surface charging Natalia Ganushkina (1, 2), Stepan Dubyagin (1), Ilkka Sillanpää (1), Jean-Charles Matéo Vélez (3), Dave Pitchford (4) (1) Finnish
Multispacecraft observations of chorus dispersion and source location
 JOURNAL OF GEOPHYSICAL RESEARCH, VOL. 112,, doi:10.1029/2006ja012058, 2007 Correction published 22 September 2007 Multispacecraft observations of chorus dispersion and source location Aaron Breneman, 1
cos 6 λ m sin 2 λ m Mirror Point latitude Equatorial Pitch Angle Figure 5.1: Mirror point latitude as function of equatorial pitch angle.
 Chapter 5 The Inner Magnetosphere 5.1 Trapped Particles The motion of trapped particles in the inner magnetosphere is a combination of gyro motion, bounce motion, and gradient and curvature drifts. In
Resonant scattering of energetic electrons by unusual low-frequency hiss
 University of New Hampshire University of New Hampshire Scholars' Repository Physics Scholarship Physics 3-2014 Resonant scattering of energetic electrons by unusual low-frequency hiss Binbin Ni University
Turbulent heating and cross-field transport near the magnetopause from THEMIS
 Click Here for Full Article GEOPHYSICAL RESEARCH LETTERS, VOL. 35, L17S08, doi:10.1029/2008gl033601, 2008 Turbulent heating and cross-field transport near the magnetopause from THEMIS C. Chaston, 1 J.
Electron Acceleration and Loss in the Earth s Radiation Belts: The Contribution of Wave- particle Interactions
 Electron Acceleration and Loss in the Earth s Radiation Belts: The Contribution of Wave- particle Interactions Richard B Horne British Antarctic Survey R.Horne@bas.ac.uk Outline Relevance Radiation belt
COMPARISON OF THERMAL PLASMA OBSERVATIONS ON SCATHA AND GEOS
 57 COMPARISON OF THERMAL PLASMA OBSERVATIONS ON SCATHA AND GEOS R. C. Olsen The University of Alabama,Huntsville, AL., USA P. M. E. Decreau LPCE, Orleans, France J. F. E. Johnson Department of Physics,
participation in magnetopause reconnection: first results
 Structure of plasmaspheric plumes and their participation in magnetopause reconnection: first results from THEMIS 0 J. P. McFadden, C. W. Carlson, D. Larson, J. Bonnell, F. S. Mozer, V. Angelopoulos,,
The Structure of the Magnetosphere
 The Structure of the Magnetosphere The earth s magnetic field would resemble a simple magnetic dipole, much like a big bar magnet, except that the solar wind distorts its shape. As illustrated below, the
ARTICLE IN PRESS. Journal of Atmospheric and Solar-Terrestrial Physics
 Journal of Atmospheric and Solar-Terrestrial Physics 71 (9) 1636 1646 Contents lists available at ScienceDirect Journal of Atmospheric and Solar-Terrestrial Physics journal homepage: www.elsevier.com/locate/jastp
Outward radial diffusion driven by losses at magnetopause
 JOURNAL OF GEOPHYSICAL RESEARCH, VOL. 111,, doi:10.1029/2006ja011657, 2006 Outward radial diffusion driven by losses at magnetopause Y. Y. Shprits, 1 R. M. Thorne, 1 R. Friedel, 2 G. D. Reeves, 2 J. Fennell,
MODELING PARTICLE INJECTIONS TEST PARTICLE SIMULATIONS. Xinlin Li LASP, University of Colorado, Boulder, CO , USA
 1 MODELING PARTICLE INJECTIONS TEST PARTICLE SIMULATIONS Xinlin Li LASP, University of Colorado, Boulder, CO 80303-7814, USA ABSTRACT We model dispersionless injections of energetic particles associated
Parallel Heating Associated with Interaction of Forward and Backward Electromagnetic Cyclotron Waves
 J. Geomag. Geoelectr., 40, 949-961, 1988 Parallel Heating Associated with Interaction of Forward and Backward Electromagnetic Cyclotron Waves Yoshiharu OMURA1, Hideyuki USUI2, and Hiroshi MATSUMOTO1 2Department
RBSP Mission: Understanding Particle Acceleration and Electrodynamics of the Inner Magnetosphere
 RBSP Mission: Understanding Particle Acceleration and Electrodynamics of the Inner Magnetosphere A. Y. Ukhorskiy JHU/APL My God, space is radioactive! Ernie Ray, 1958 Спутник II, III [Vernov et al., 1959]
Fermi acceleration of electrons inside foreshock transient cores
 Fermi acceleration of electrons inside foreshock transient cores Terry Z. Liu 1, San Lu 1, Vassilis Angelopoulos 1, Heli Hietala 1, and Lynn B. Wilson III 2 1 Department of Earth, Planetary, and Space
Oblique propagation of whistler mode waves in the chorus source region
 Click Here for Full Article JOURNAL OF GEOPHYSICAL RESEARCH, VOL. 114,, doi:10.1029/2009ja014586, 2009 Oblique propagation of whistler mode waves in the chorus source region O. Santolík, 1,2 D. A. Gurnett,
RBSP Mission: Understanding Particle Acceleration and Electrodynamics of the Inner Magnetosphere. A. Y. Ukhorskiy, B. Mauk, N.
 RBSP Mission: Understanding Particle Acceleration and Electrodynamics of the Inner Magnetosphere A. Y. Ukhorskiy, B. Mauk, N. Fox JHU/APL My God, space is radioactive! Ernie Ray, 1958 Спутник II, III [Vernov
A Semi-Empirical Model for Forecasting Relativistic Electrons at Geostationary Orbit
 2008 Annual Meeting Theme, 20 24 January 2008, New Orleans, Louisiana Fifth Space Weather Symposium A Semi-Empirical Model for Forecasting Relativistic Electrons at Geostationary Orbit Wladislaw Lyatsky
INNER MAGNETOSPHERE PLASMA DENSITIES. Bodo W. Reinisch and Xueqin Huang
 XA0303034 INNER MAGNETOSPHERE PLASMA DENSITIES Bodo W. Reinisch and Xueqin Huang Environmental, Earth, and Atmospheric Sciences Department, Centerfor Atmospheric Research, University of Massachusetts Lowell,
Magnetosonic wave instability analysis for proton ring distributions observed by the LANL magnetospheric plasma analyzer
 JOURNAL OF GEOPHYSICAL RESEARCH, VOL. 116,, doi:10.1029/2010ja016068, 2011 Magnetosonic wave instability analysis for proton ring distributions observed by the LANL magnetospheric plasma analyzer Lunjin
THEMIS multi-spacecraft observations of magnetosheath plasma penetration deep into the dayside low-latitude
 Click Here for Full Article GEOPHYSICAL RESEARCH LETTERS, VOL. 35, L17S11, doi:10.1029/2008gl033661, 2008 THEMIS multi-spacecraft observations of magnetosheath plasma penetration deep into the dayside
Experiments with a Supported Dipole
 Experiments with a Supported Dipole Reporting Measurements of the Interchange Instability Excited by Electron Pressure and Centrifugal Force Introduction Ben Levitt and Dmitry Maslovsky Collisionless Terrella
Electron trapping and charge transport by large amplitude whistlers
 GEOPHYSICAL RESEARCH LETTERS, VOL. 37,, doi:10.1029/2010gl044845, 2010 Electron trapping and charge transport by large amplitude whistlers P. J. Kellogg, 1 C. A. Cattell, 1 K. Goetz, 1 S. J. Monson, 1
Statistics of multispacecraft observations of chorus dispersion and source location
 JOURNAL OF GEOPHYSICAL RESEARCH, VOL. 114,, doi:10.1029/2008ja013549, 2009 Statistics of multispacecraft observations of chorus dispersion and source location Aaron W. Breneman, 1,2 Craig A. Kletzing,
Relationship of Oscillating Aurora to Substorms and Magnetic Field Line Resonances
 Proceedings ICS-6, 2002 Relationship of Oscillating Aurora to Substorms and Magnetic Field Line Resonances James A. Wanliss and Robert Rankin Department of Physics, University of Alberta Edmonton, AB,
1 Introduction. Cambridge University Press Physics of Space Plasma Activity Karl Schindler Excerpt More information
 1 Introduction Space plasma phenomena have attracted particular interest since the beginning of the exploration of space about half a century ago. Already a first set of pioneering observations (e.g.,
ESS 200C Aurorae. Lecture 15
 ESS 200C Aurorae Lecture 15 The record of auroral observations dates back thousands of years to Greek and Chinese documents. The name aurora borealis (latin for northern dawn) was coined in 1621 by P.
General aspects of whistler wave generation in space plasmas K. Sauer and R. Sydora
 General aspects of whistler wave generation in space plasmas K. Sauer and R. Sydora Institute of Geophysics, University of Alberta, Canada ISSS-10, Banff, Canada, July 24-30, 2011 General aspects of whistler
Electron precipitation coincident with ELF/VLF wave bursts
 JOURNAL OF GEOPHYSICAL RESEARCH, VOL. 107, NO. A8, 1207, 10.1029/2001JA009100, 2002 Electron precipitation coincident with ELF/VLF wave bursts M. Walt Starlab, Department of Electrical Engineering, Stanford
Science Overview. Vassilis Angelopoulos, ELFIN PI
 Science Overview Vassilis Angelopoulos, ELFIN PI Science Overview-1 MPDR, 2/12/2015 RADIATION BELTS: DISCOVERED IN 1958, STILL MYSTERIOUS Explorer 1, 1958 Time Magazine, May 4, 1959 Science Overview-2
Solar Wind Turbulent Heating by Interstellar Pickup Protons: 2-Component Model
 Solar Wind Turbulent Heating by Interstellar Pickup Protons: 2-Component Model Philip A. Isenberg a, Sean Oughton b, Charles W. Smith a and William H. Matthaeus c a Inst. for Study of Earth, Oceans and
Possible eigenmode trapping in density enhancements in Saturn s inner magnetosphere
 Click Here for Full Article GEOPHYSICAL RESEARCH LETTERS, VOL. 34, L04103, doi:10.1029/2006gl028647, 2007 Possible eigenmode trapping in density enhancements in Saturn s inner magnetosphere J. D. Menietti,
Low energy electrons in the inner Earth s magnetosphere
 Low energy electrons in the inner Earth s magnetosphere Natalia Ganushkina (1, 2) (1) University of Michigan, Ann Arbor MI, USA (2) Finnish Meteorological Institute, Helsinki, Finland The research leading
A comparison of magnetic field measurements and a plasma-based proxy to infer EMIC wave distributions at geosynchronous orbit
 JOURNAL OF GEOPHYSICAL RESEARCH, VOL. 117,, doi:10.1029/2011ja017474, 2012 A comparison of magnetic field measurements and a plasma-based proxy to infer EMIC wave distributions at geosynchronous orbit
Specification of electron radiation environment at GEO and MEO for surface charging estimates
 Specification of electron radiation environment at GEO and MEO for surface charging estimates Natalia Ganushkina (University of Michigan/FMI) Collaborators: S. Dubyagin (FMI), J.-C. Matéo Vélez, A. Sicard
Sources and sinks of equatorially mirroring energetic charged particles in the earth s inner magnetosphere
 Sources and sinks of equatorially mirroring energetic charged particles in the earth s inner magnetosphere M. M. Klida and T. A. Fritz Center for Space Physics, Boston University, Boston, MA 02215, USA
The CARISMA Array of Fluxgate and Induction Coil Magnetometers
 The CARISMA Array of Fluxgate and Induction Coil Magnetometers David Milling CARISMA Project Manager dmilling@ualberta.ca Ian Mann CARISMA PI Canada Research Chair in Space Physics ian.mann@ualberta.ca
JOURNAL OF GEOPHYSICAL RESEARCH, VOL. 115, A01205, doi: /2009ja014423, 2010
 Click Here for Full Article JOURNAL OF GEOPHYSICAL RESEARCH, VOL. 115,, doi:10.1029/2009ja014423, 2010 On phase space density radial gradients of Earth s outer-belt electrons prior to sudden solar wind
Mercury s magnetosphere-solar wind interaction for northward and southward interplanetary magnetic field during the MESSENGER Flybys
 Mercury s magnetosphere-solar wind interaction for northward and southward interplanetary magnetic field during the MESSENGER Flybys P. M. Trávníček 1,3, D. Schriver 2, D. Herčík 3, P. Hellinger 3, J.
Systematic analysis of equatorial noise below the lower hybrid frequency
 Annales Geophysicae (24) 22: 2587 2595 SRef-ID: 1432-576/ag/24-22-2587 European Geosciences Union 24 Annales Geophysicae Systematic analysis of equatorial noise below the lower hybrid frequency O. Santolík
Chorus source region localization in the Earth s outer magnetosphere using THEMIS measurements
 Chorus source region localization in the Earth s outer magnetosphere using THEMIS measurements O Agapitov, V Krasnoselskikh, Yu Zaliznyak, V Angelopoulos, O Le Contel, G Rolland To cite this version: O
Single particle motion and trapped particles
 Single particle motion and trapped particles Gyromotion of ions and electrons Drifts in electric fields Inhomogeneous magnetic fields Magnetic and general drift motions Trapped magnetospheric particles
Nonlinear evolution of EMIC waves in a uniform magnetic field: 1. Hybrid simulations
 JOURNAL OF GEOPHYSICAL RESEARCH, VOL. 115,, doi:10.1029/2010ja015607, 2010 Nonlinear evolution of EMIC waves in a uniform magnetic field: 1. Hybrid simulations N. Omidi, 1 R. M. Thorne, 2 and J. Bortnik
Relative contribution of electrons to the stormtime total ring current energy content
 GEOPHYSICAL RESEARCH LETTERS, VOL. 32, L311, doi:1.129/24gl21672, 25 Relative contribution of electrons to the stormtime total ring current energy content S. Liu, 1 M. W. Chen, 2 J. L. Roeder, 2 L. R.
Estimation of magnetic field mapping accuracy using the pulsating aurora chorus connection
 GEOPHYSICAL RESEARCH LETTERS, VOL. 38,, doi:10.1029/2011gl048281, 2011 Estimation of magnetic field mapping accuracy using the pulsating aurora chorus connection Y. Nishimura, 1,2 J. Bortnik, 1 W. Li,
High energy particles from the Sun. Arto Sandroos Sun-Earth connections
 High energy particles from the Sun Arto Sandroos Sun-Earth connections 25.1.2006 Background In addition to the solar wind, there are also particles with higher energies emerging from the Sun. First observations
Destruction of a Magnetic Mirror-Trapped Hot Electron Ring by a shear Alfven Wave
 Destruction of a Magnetic Mirror-Trapped Hot Electron Ring by a shear Alfven Wave Y. Wang 1, W. Gekelman 1, P. Pribyl 1, D. Papadopoulos 2 1 University of California, Los Angeles 2 University of Maryland,
In-Situ vs. Remote Sensing
 In-Situ vs. Remote Sensing J. L. Burch Southwest Research Institute San Antonio, TX USA Forum on the Future of Magnetospheric Research International Space Science Institute Bern, Switzerland March 24-25,
FAST Observations of Ion Outflow Associated with Magnetic Storms
 FAST Observations of Ion Outflow Associated with Magnetic Storms J. P. McFadden 1, Y. K. Tung 1, C. W. Carlson 1, R. J. Strangeway 2, E. Moebius 3, and L. M. Kistler 3 New observations from the FAST mission
Energetic outer zone electron loss timescales during low geomagnetic activity
 JOURNAL OF GEOPHYSICAL RESEARCH, VOL. 111,, doi:10.1029/2005ja011516, 2006 Energetic outer zone electron loss timescales during low geomagnetic activity Nigel P. Meredith, 1 Richard B. Horne, 1 Sarah A.
The Role of the Plasmasphere in Radiation Belt Particle Energization and Loss
 The Role of the Plasmasphere in Radiation Belt Particle Energization and Loss Wm. Robert Johnston Ph.D. Dissertation Presentation University of Texas at Dallas 8 April 2009 Outline Background plasmasphere,
Ion observations from geosynchronous orbit as a proxy for ion cyclotron wave growth during storm times
 University of New Hampshire University of New Hampshire Scholars' Repository Physics Scholarship Physics 10-28-2009 Ion observations from geosynchronous orbit as a proxy for ion cyclotron wave growth during
Features of energetic particle radial profiles inferred from geosynchronous responses to solar wind dynamic pressure enhancements
 Author(s) 2009. This work is distributed under the Creative Commons Attribution 3.0 License. Annales Geophysicae Features of energetic particle radial profiles inferred from geosynchronous responses to
THEMIS observations of a hot flow anomaly: Solar wind, magnetosheath, and ground-based measurements
 Click Here for Full Article GEOPHYSICAL RESEARCH LETTERS, VOL. 35, L17S03, doi:10.1029/2008gl033475, 2008 THEMIS observations of a hot flow anomaly: Solar wind, magnetosheath, and ground-based measurements
A small magnetosphere-solar wind interaction for northward and southward interplanetary magnetic field: Hybrid simulation results
 A small magnetosphere-solar wind interaction for northward and southward interplanetary magnetic field: Hybrid simulation results Pavel M. Trávníček Institute of Geophysics and Planetary Physics, UCLA,
Large enhancement of the outer belt electrons during magnetic storms
 Earth Planets Space, 53, 1163 1170, 2001 Large enhancement of the outer belt electrons during magnetic storms Takahiro Obara 1, Yoshizumi Miyoshi 2, and Akira Morioka 2 1 Communications Research Laboratory,
Multi Spacecraft Observation of Compressional Mode ULF Waves Excitation and Relativistic Electron Acceleration
 Multi Spacecraft Observation of Compressional Mode ULF Waves Excitation and Relativistic Electron Acceleration X. Shao 1, L. C. Tan 1, A. S. Sharma 1, S. F. Fung 2, Mattias Tornquist 3,Dimitris Vassiliadis
Loss of Relativistic and Ultra-Relativistic Electrons From the Radiation Belts
 Loss of Relativistic and Ultra-Relativistic Electrons From the Radiation Belts Yuri Shprits 1,2, Nikita Aseev 1,2,Alexander Drozdov 1, Adam Kellerman 1, Maria Usanova 4, Irina Zhelavskaya 1,2, Ingo Michaelis
Magnetic Reconnection
 Magnetic Reconnection? On small scale-lengths (i.e. at sharp gradients), a diffusion region (physics unknown) can form where the magnetic field can diffuse through the plasma (i.e. a breakdown of the frozenin
SOLAR WIND ION AND ELECTRON DISTRIBUTION FUNCTIONS AND THE TRANSITION FROM FLUID TO KINETIC BEHAVIOR
 SOLAR WIND ION AND ELECTRON DISTRIBUTION FUNCTIONS AND THE TRANSITION FROM FLUID TO KINETIC BEHAVIOR JUSTIN C. KASPER HARVARD-SMITHSONIAN CENTER FOR ASTROPHYSICS GYPW01, Isaac Newton Institute, July 2010
Intense plasma wave emissions associated with Saturn s moon Rhea
 GEOPHYSICAL RESEARCH LETTERS, VOL. 38,, doi:10.1029/2011gl049219, 2011 Intense plasma wave emissions associated with Saturn s moon Rhea O. Santolík, 1,2,3 D. A. Gurnett, 1 G. H. Jones, 4 P. Schippers,
Accelerated Electrons as the Source of Auroral Kilometric Radiation. R. J. Strangeway. Institute of Geophysics and Planetary Physics,
 Accelerated Electrons as the Source of Auroral Kilometric Radiation R. J. Strangeway Institute of Geophysics and Planetary Physics, University of California, Los Angeles, CA 99, USA R. E. Ergun Laboratory
Substorm-associated effects in the variations of low energy electron fluxes in the inner magnetosphere: Does the substorm s strength matter?
 Substorm-associated effects in the variations of low energy electron fluxes in the inner magnetosphere: Does the substorm s strength matter? N. Ganushkina (1, 2), S. Dubyagin (1), I. Sillanpää (1), D.
Observations of the relationship between frequency sweep rates of chorus wave packets and plasma density
 JOURNAL OF GEOPHYSICAL RESEARCH, VOL. 115,, doi:10.1029/2010ja015468, 2010 Observations of the relationship between frequency sweep rates of chorus wave packets and plasma density E. Macúšová, 1,2 O. Santolík,
Ground based observations of diffuse auroral frequencies in the context of whistler mode chorus
 JOURNAL OF GEOPHYSICAL RESEARCH, VOL. 115,, doi:10.1029/2009ja014852, 2010 Ground based observations of diffuse auroral frequencies in the context of whistler mode chorus M. Samara 1 and R. G. Michell
Auroral Disturbances During the January 10, 1997 Magnetic Storm
 Auroral Disturbances During the January 10, 1997 Magnetic Storm L. R. Lyons and E. Zesta J. C. Samson G. D. Reeves Department of Atmospheric Sciences Department of Physics NIS-2 Mail Stop D436 University
Relativistic electron loss due to ultralow frequency waves and enhanced outward radial diffusion
 JOURNAL OF GEOPHYSICAL RESEARCH, VOL. 115,, doi:10.1029/2010ja015755, 2010 Relativistic electron loss due to ultralow frequency waves and enhanced outward radial diffusion T. M. Loto aniu, 1,2,4 H. J.
Rapidly moving sources of upper band ELF/VLF chorus near the magnetic equator
 Click Here for Full Article JOURNAL OF GEOPHYSICAL RESEARCH, VOL. 111,, doi:10.1029/2005ja011468, 2006 Rapidly moving sources of upper band ELF/VLF chorus near the magnetic equator M. Platino, 1 U. S.
Distribution of density along magnetospheric field lines
 JOURNAL OF GEOPHYSICAL RESEARCH, VOL. 111,, doi:10.1029/2005ja011414, 2006 Distribution of density along magnetospheric field lines R. E. Denton, 1 K. Takahashi, 2 I. A. Galkin, 3 P. A. Nsumei, 3 X. Huang,
Kinetic Turbulence in the Terrestrial Magnetosheath: Cluster. Observations
 1 2 Kinetic Turbulence in the Terrestrial Magnetosheath: Cluster Observations 3 4 5 S. Y. Huang 1, F. Sahraoui 2, X. H. Deng 1,3, J. S. He 4, Z. G. Yuan 1, M. Zhou 3, Y. Pang 3, H. S. Fu 5 6 1 School of
Evidence for acceleration of outer zone electrons to relativistic energies by whistler mode chorus
 Evidence for acceleration of outer zone electrons to relativistic energies by whistler mode chorus N. P. Meredith, R. B. Horne, D. Summers, R. M. Thorne, R. H. A. Iles, D. Heynderickx, R. R. Anderson To
CHAPTER 2 DATA. 2.1 Data Used
 CHAPTER DATA For the analysis, it is required to use geomagnetic indices, which are representatives of geomagnetic activity, and Interplanetary Magnetic Field (IMF) data in addition to f F,which is used
Magnetospheric Currents at Quiet Times
 Magnetospheric Currents at Quiet Times Robert L. McPherron Institute of Geophysics and Planetary Physics University of California Los Angeles Los Angeles, CA 90095-1567 e-mail: rmcpherron@igpp.ucla.edu
The Dependence of the Magnetic Field Near the Subsolar Magnetopause on IMF in Accordance with THEMIS Data
 WDS'11 Proceedings of Contributed Papers, Part II, 45 50, 2011. ISBN 978-80-7378-185-9 MATFYZPRESS The Dependence of the Magnetic Field Near the Subsolar Magnetopause on IMF in Accordance with THEMIS Data