Politecnico di Torino. Porto Institutional Repository
|
|
|
- Bonnie Davis
- 6 years ago
- Views:
Transcription
![Politecnico di Torino Porto Institutional Repository [Doctoral thesis] Development of composite piezoelectric materials for tactile sensing Original Citation: Di Donato M. (2015).](/docs-images/72/66823441/images/1-0.jpg "Development of composite piezoelectric materials for tactile sensing. PhD thesis Availability: This version is available at : http://porto.polito.")
, as described at")
1 Politecnico di Torino Porto Institutional Repository [Doctoral thesis] Development of composite piezoelectric materials for tactile sensing Original Citation: Di Donato M. (2015). Development of composite piezoelectric materials for tactile sensing. PhD thesis Availability: This version is available at : since: February 2015 Published version: DOI: /polito/porto/ Terms of use: This article is made available under terms and conditions applicable to Open Access Policy Article ("Public - All rights reserved"), as described at html Porto, the institutional repository of the Politecnico di Torino, is provided by the University Library and the IT-Services. The aim is to enable open access to all the world. Please share with us how this access benefits you. Your story matters. (Article begins on next page)

2 Politecnico di Torino Dipartimento di Scienza Applicata e Tecnologia PhD Thesis in Physics XXVII cycle Development of composite piezoelectric materials for tactile sensing Supervisor: Prof. Candido Fabrizio Pirri Tutor: Prof.ssa Mariangela Lombardi Marco Di Donato January December 2014
3
4 Contents Summary iii I Theoretical background 1 1 Piezoelectricity Piezoelectric effect Mechanical and electrical behavior of the materials Piezoelectricity constitutive equations and figures of merit Piezoelectric materials Ferroelectric ceramics Piezoelectric polymers Piezoelectric composite materials for tactile sensing Composites and concept of connectivity piezoelectric composite materials Piezoelectric models for 0-3 ceramic-polymer composites Models for random 0-3 composites dielectric properties.. 30 II Experimental activity 32 3 Piezoelectric 0-3 composites: formulation, materials and methods Introduction Materials Elaboration of 0-3 composites Composites formation techniques: a brief overview Preparation Characterization techniques Phases characterization Piezoelectric and dielectric characterizations Results and discussion Preliminary characterization of barium titanate powders Crystallization of PVDF Characterization of 0-3 composites FESEM morphological characterization Matrices phase identification i
5 CONTENTS Thermal behavior of polymeric matrices Piezoelectric and dielectric characterization Permittivity measurements Piezoelectric coefficient Conclusions 61 A Voigt notation 63 B Models for permittivity in 0-3 composite materials 65 C FESEM images 68 D Dielectric characterization 73 E Piezoelectric coefficients 78 Bibliography 91 ii
6 Summary The present thesis aims is to describe the experimental activities performed during the three years of PhD. The work was carried out in the laboratory LINCE (Laboratorio di Ingegnerizzazione di Materiali Ceramici) of Politecnico di Torino and the IIT (Istituto Italiano di Tecnologia) Center fo Space Human Robotics of Turin. All the functional piezoelectric and dielectric characterizations were performed in laboratory of ceramic material in EPFL (École Polytechnique Fédérale de Lausanne). The objective of the PhD project is to evaluate cheap and easily processable flexible materials that can be used for robotic sensitive skin applications. This activity is embedded in a more general project of IIT concerning the development of a fully functioning hand exoskeleton. Piezoelectricity is the physical property chosen to ensure the response to the tactile stimulus. Composite materials based on a piezoelectric phase dispersed in a polymeric matrix should, in principle, grant both an adequate piezo response and the flexibility required by the robotic skin application. The manuscript is divided into two parts. The former is a theoretical background. First of all a general Introduction about the problem of tactile sensing is reported along with a brief overview of the materials and the solutions studied in literature and the physical properties involved. The purpose of the Chapter 1 is to go deeply in the theoretical aspects of the piezoelectricity from the physical point of view. There will be explained the laws of piezoelectricity and the classification of materials in which it occurs. In Chapter 2 the topic is composites: the classification, mixing rules and how they can be prepared for piezoelectric applications. The latter part concern the PhD project from the concept to the experimental activity from the data analysis to the conclusions. In Chapter 3 the objectives of the experimental activity will be clearly defined, along with the strategies adopted to fulfil them and an overview of materials and methods used. In Chapter 4 results will be exposed and discussed. Not only the final functional property but also the characterization of PVDF matrix are reported. Chapter 5 is dedicated to conclusions. iii
7 Part I Theoretical background 1
8 Tactile sensing: a general introduction This brief introduction aims is to show the complexity of the topic of this thesis: the tactile sensing. An ideal solution cannot be find also because at this time several disciplines are involved in researching the best one on the specific application [1]. The human sense of touch Skin is a very important tissue in human body. Its main role is to protect internal organs and to allow the interation of the whole body with the external environment. Among these functions there is the sense of tact. It allows to asses object properties such as roughness, shape, temperature, vibration but also the force applied to it during the manipulation of the same. In human skin all these tasks are performed by different kind of receptor each providing a detailed and specialized feedback. In the human physiology the mechanotransduction mechanism in the skin receptors transforms the mechanical stimulus into a sequence of electrical discharges transmitted to the central nervous system. There are different mechanoreceptors. That can be classified on the basis of the structure of receptive field and on the rate of adaptation: Fast adapting receptors respond with a burst of action potential when the stimulus is applied or removed but are insensitive to dynamic forces while Slowly adapting receptors remain active during the period during which the stimulus is in mechanical contact with its receptive field. A further classification divides the mechanoreceptors in small and large receptive field with distinct and diffuse borders. By integration of the signals coming from these receptors human brain is able to reconstruct perception of several behavior of bodies: Force perception Form perception, defined as the "perception of the specific geometric structure of a surface of an object" Texture perception, which corresponds to "the subjective feel of a surface and depends on its distributed, statistical properties" Softness perception, defined as "the progressice donformation to the contours of the fingers and hands in proportion to contact force" 2
9 Curvature perception, considered as "the rate of change in the angle of a tangent line to a curve as the tangent point moves along it" The task to emulate the detection and elaboration of such a complexity of information is very tricky. As will be shown in the next section there is not a solution suitable to perform all these sensitive tasks. Artificial tactile sensing Until now three main strategies have been tested in order to fulfil the complex tasks of human skin: Fully-synthetic tactile sensing Bio-Hybrid tactile sensing Fully-biological tactile sensing The first strategy implies the exploitation of physical properties of synthetic materials. The other two have in common the use of a tissue engineered skin: in the first case synthetic receptor are used while the second is a trial to use a biological mimic system. The science and engineering supporting artificial skin is consolidated while byo-artificial devices are relatively new. In Table 1 are reported the main advantages and disadvantages of these approaches. Table 1: Comparison between the different strategies for artificial tactile sensing [1]. Artificial tactile sensing Approaches Types Advantages Disadvantages Fully-synthetic Capacitive Piezoelectric Piezoresistive Inductive Optoelectric Strain gauge Physical robustness Greater sensitivity No self-healing Biocompatibility Bio-hybrid Silicon based sensor with conductive sensor MEMS sensors with tissue engineered skin Substrate with bio-hybrid skin-like electrode Bio-mimicry Bio-inspiration Self-healing Greater softness and compliance Conservation of living cells Fully-biological Hydrogel based artificial skin Gelatin based artificial skin Tissue engineered skin Merkel cells Bio-mimicry Bio-inspiration Self-healing Wettability Regeneration of tissue Greater compliance Biocompatibility Biodegradability Conservation of living cells Rejection As the most consolidated technologies for tactile sensors are the fully-synthetic ones, the objective of this thesis will be the investigation of one of these, the piezoelectricity. In order to complete the overview on this general topic in Table 2 are reported the most investigated fully-synthetic solutions. 3
10 Table 2: Fully synthetic tactile sensing transduction method [1]. Transduction method Fully-synthetic tactile sensing Modulated Advantages parameter Disavantages Capacitive Piezoelectric Piezoresistive Strain gauge Inductive Optoelectric Change in capacitance Strain polarization Change in resistance Change in resistance Change in inductance Light intesity Spectrum change High spatial resolution Good frequency response Long term drift stability High sensitivity Low temperature sensitivity Low power consuption Flexibility Workability Chemical stability Good high-frequency response Flexibility Good sensitivity Low noise Low cost Simple electronics Sensing range High sensitivity Low cost High sensitivity High dynamic range No mechanical hysteresis Linear response Physical robustness High density High spatial resolution Senses both shear and normal contact forces Immunity from EMI Severe hysteresis Stray capacitance Complex electronics Noise susceptible High temperature sensitivity Poor spatial resolution Dynamic sensing only Simple electronics Large hysteresis Low frequency response Low repeatability High hysteresis Non linear response Susceptible to temperature changes Complex electronics Limited to nonmagnetic medum Low spatial resolution Low repeatability Complex electronics Large size Rigidness Loss of light by microbending causes distorsion signal 4
11 Chapter 1 Piezoelectricity 1.1 Piezoelectric effect The word piezoelectricity finds its etymological origin in the Greek words πιέζειν (piézein) which means to squeeze or to press, and έλεςτρον (electron) which in ancient times were the name for amber, a material known for being capable to develop electrostatic charge. The first observation of the phenomenon occurred in 1824 in Rochelle salt. But the first experimental work concerning this topic was published in 1880 by Curie brothers. They observed the formation of electric polarisation in a quartz single crystal subjected to a mechanical stress [2]. Piezoelectricity is a property that couples mechanical and electric behavior of a certain class of materials. Some non-centric crystals, or similar materials, can generate polarisation when subjected to a mechanical stress and vice-versa. This two phenomena can both be classified as a piezoelectric response. It is commonly defined as the direct piezoelectric effect the change of polarisation proportional to the applied strain. The application of an external stress leads to a dielectric displacement that manifests itself with an internal electric polarization. The converse piezoelectric effect (also inverse, reciprocal) is, on the contrary, the strain appearing when an external electric field is applied [3]. In Figure 1.1 a simple and very schematic representation of these two effects is proposed. Some trivial applications based on these effects can be imagined. For instance a piezoelectric sensor is a device which converts a mechanical event affecting the material (displacement, stress, pressure) in a measurable electric quantity (charge, voltage). The same effect can be exploit for power generation. On the contrary an actuator material acts converting electrical power in mechanical force or displacement Mechanical and electrical behavior of the materials Concerning the electrical properties the three fundamental quantities to consider are the electric field strength vector E, the electric polarisation vector P and the electric displacement vector D. These quantities are related by the equation D = ε 0 E+P (1.1) 5

12 CHAPTER 1. PIEZOELECTRICITY Figure 1.1: Graphical description of the two macroscopic piezoelectric effects. In the first image the application of a compressive stress generates a polarization in the material and a current can be measured. In the latter the application of a voltage lead to mechanical compression of the material and, of course, to dielectric polarisation [4]. where ε 0 is known as the vacuum permittivity (8.854 [F/m]). The application of an electric field on an insulating material polarises it, by separating the charges. In an isotropic material this can be expressed as P = χε 0 E (1.2) introducing the dielectric susceptibility χ [ ]. For an anisotropic body it is necessary the use of tensor notation [5]. In this way the application of an electric field E j [V/m] lead to a polarisation P i [C/m 2 ] (i,j = 1,2,3) By substituting 1.3 in 1.1 P i = χ ij ε 0 E j. (1.3) D i = ε 0 E i +ε 0 χ ij E j = ε 0 (δ ij E j +χ ij E j ) = ε 0 (δ ij +χ ij )E j = ε ij E j. (1.4) The symbol δ ij is the well known Kroenecker s symbol and quantity ε ij is known as the dielectric permittivity of the material. An important quantity is also defined as the relative permittivity or dielectric constant of the material κ ij = ε ij /ε 0 = δ ij +χ ij. (1.5) The relations 1.3 and 1.4 are valid only for linear approximation [6]. A piezoelectric material exploited in a device undergoes displacement several times. In order to be unmodified by this cyclic work, it is critical that the deformation stays in the elastic range. The basic assumption of the model for an ideal elastic material, is that the stress sensor depends only on the deformation at the same time and at the same point. This means that elastic properties are independent of time (for instance stresses are independent on the straining rate). As a consequence stress and strain change without time delay. Another assumption is that the material is considered to be homogeneous. For sufficiently small deformation, Hooke s law generalization for isotropic bodies takes the form 6
13 1.1. PIEZOELECTRIC EFFECT σ m = c mn x n (1.6) or expressing the elements of the strain tensor in terms of the stress x m = s mn σ n (1.7) where σ m [N/m 2 ] is the applied stress, x n [ ] the displacement and c mn [N/m 2 ], s mn [m 2 /N] the elastic stiffness tensor and the elastic compliance tensor respectively [3]. The m,n indices range from 1 to 6 accordingly to the Voigt notation (see Appendix A) Piezoelectricity constitutive equations and figures of merit As stated before, in piezoelectric materials mechanical and electrical properties are coupled so that a linear relationship between applied stress and resulting charge density is found D i = d im σ m. (1.8) The quantity d im [C/N] is known as direct piezoelectric coefficients. Using the indices notation for which i,j,k = 1,2,3 while m,n,l = 1,2,3,4,5,6 it is evident that d is a third-rank tensor. The other abilities of piezoelectric materials consists to contract or expand when subjected to electric field. This strain is described as follow x m = d km E k (1.9) with d km [m/v] is known as inverse piezoelectric coefficient. These two coefficients are thermodynamically identical. To fully describe the second order material coefficients, derived from the coupling of elastic and dielectric properties, eight equations are needed D i = ε ik E k +d im σ m (1.10) x n = d kn E k +s nm σ m (1.11) E k = β ik D i g km σ m (1.12) x n = g in D i +s nm σ m (1.13) D i = ε ik E k +e in x n (1.14) σ m = e km E k +c nm x n (1.15) E k = β ik D i +h kn x n (1.16) σ m = h im D i +c nm x n (1.17) 7
14 CHAPTER 1. PIEZOELECTRICITY where c nm [Nm 2 ] and s nm [N 1 m 2 ] are previously mentioned elastic stiffness and elastic compliance tensor, ε ik [Fm 1 ] is the dielectric permittivity and β ik [F 1 m] is the dielectric impermittivity. Piezoelectric effect can be described by four different coefficients, summarized in Table 1.1. The first two Equations, namely 1.8 and 1.9 are the most used. It is important to specify that the Equations are in isothermal or adiabatic condition otherwise other contributions, due to temperature and entropy, would be present [7]. Table 1.1: Piezoelectric coefficients for direct and inverse effects. Piezoelectric coefficients Direct effect Converse effect Direct units Converse unit ( ) ( ) [ ] Di xm C [ m ] d im = = σ m E E i σ N V ( ) ( ) [ ] [ ] Ei xm Vm m 2 g im = = σ m D D i σ N C ( ) ( ) [ ] [ ] Ei σm V N h im = = x m D D i x m C ( ) ( ) [ ] [ ] Di σm C N e im = = x m E i m 2 Vm E x All the piezoelectric coefficients are mutually related by the relationships: d im = e in s nm = ε ij g jm (1.18) e im = d in c nm = ε ij h jm (1.19) g im = h in s nm = β ij d jm (1.20) h im = g in c nm = β ij e jm. (1.21) Relations between variables are represented briefly in Figure 1.2. Piezoelectric coefficients connect mechanical and electrical quantities. Another important parameter for a piezoelectric material is the coupling factor k eff which gives a measure of the effectiveness with which electrical energy is converted into mechanical and vice-versa [8]. Below resonant frequencies of the body it takes the form k 2 eff = Resulting converted energy. (1.22) Input energy The choice of the proper constitutive equation depends on the experimental conditions (in particular the elastic and electric boundary conditions) for which the independent variables are chosen. Electrical free condition can be easily achieved by snorting the electrodes where the piezoelectric generated charge is 8
15 1.1. PIEZOELECTRIC EFFECT Figure 1.2: Relations among electrical and mechanical quantities. Arrows always start from an independent variable and end on a dependent one [3]. collected. Charges can freely move in a device so that polarisation is compensated and electric field remains equal to zero. It is not easy to reach a well defined mechanical state. Because of the use of system to grip and/or apply the force on the sample it is very easy to introduce some shear components in the interface piezoelectric material/sample holder. It is sometimes easier to measure the d coefficient using inverse effect, considering the sample as mechanically free (σ = 0). The condition of a constant electric displacement can be reached by forcing free charges not to move. This can be obtained, in principle, in non-conductive enviroment for the non-conductive sample without electrodes. Every piezoelectric element d im corresponds to the interaction between a stress component σ m and an electric displacement component D i. According to their direction 4 different cases can be distinguished, as schematically displayed in Figure 1.3. Figure 1.3: Four possible orientation of piezoelectric effect. In the order: L d 22, T d 12, S L d 36, S T d 26 [3]. Coefficients d 11, d 22, d 33 describe the effect where the normal mechanical stress causes polarisation in the same direction and it is called longitudinal piezoelectricity "L". Another possibility is a polarisation perpendicular to the applied normal stress which is called transversal effect "T" and is characterized by the coefficients d 12, d 13, d 21, d 23, d 31, d 32. If the shear mechanical stress is applied two possibilities arise: one is the longitudinal shear, "S L ", characterized by a polarisation perpendicular to the plane of applied stress and coefficients 9
16 CHAPTER 1. PIEZOELECTRICITY d 14, d 25, d 36 ; the other possibility is that the polarisation lays on the shear plane and this is called transversal shear, "S T ", characterized by the coefficients d 15, d 16, d 24, d 26, d 34, d Piezoelectric materials Introducing this topic it is important to understand why some materials show piezoelectricity. According to Neumann s principle [5]: The symmetry elements of any physical property of a crystal must include the symmetry elements of the point group of the crystal. This means that if a material group point includes a centre of symmetry piezoelectric effect is forbidden. A first classification can be done by dividing the 32 crystallographic classes into 11 centrosymmetrical, not showing piezoelectricity, and 21 non-centrosymmetrical. Among these, the class 432 do not show piezoelectricity due to other crystallographic constraints. The 21 groups are further divided in to two classes: 10 groups with a singular polar axis, known as polar crystal and having pyroelectric behavior; 11 groups have combinations of several crystallographic equivalent polar axis resulting in zero sum. Those are called polar-neutral crystals. In Table 1.2 the different point groups are classified. Table 1.2: Centrosymmetric and non-centrosymmetric point groups in crystals with different symmetries [9]. Crystal Symmetry Centro- Non-centrosystem elements symmetric symmetric Triclinic Center 1 1 Monoclinic Center, axis, plane 2/m 2, m Orthorombic Center, axis, plane mmm 222, mm2 Tetragonal Center, axis, plane 4/m, 4/mmm 4, 4, 442, 4mm, 42m Trigonal Center, axis, plane 3, 3m 3, 32, 3m Hexagonal Center, axis, plane 6/m, 6/mmm 6, 6, 622, 6mm, 6m2 Cubic Center, axis, plane m3, m3m 23, 43m, 432 The phenomenon of piezoelectricity can be described as the motion of ions inside certain crystalline structures, leading to a variation of dipolar moment. In the presence of a centre of symmetry no dipoles are present, thus no piezoelectricity can be found. Applying stress to a polar crystal, the piezoelectric polarisation will contribute to already existing spontaneous polarisation. In polar-neutral crystals, with the exception of 432 group, the effect of an external mechanical stress is to generate a single polar direction; a graphical example is given in Figure 1.4. As stated before, 10 point groups show a spontaneous polarization due to a singular crystallographic polar direction. The total polarisation vector 10
![1.2. PIEZOELECTRIC MATERIALS Figure 1.4: Piezoelectric effect in polar-neutral symmetries explained with a simple molecular model [9].](/docs-images/72/66823441/images/17-0.jpg "is changed not only by the application of an external stress, but it is also influenced by temperature. This dependence is the aforementioned phenomenon of pyroelectricity.")
17 1.2. PIEZOELECTRIC MATERIALS Figure 1.4: Piezoelectric effect in polar-neutral symmetries explained with a simple molecular model [9]. is changed not only by the application of an external stress, but it is also influenced by temperature. This dependence is the aforementioned phenomenon of pyroelectricity. As in the case of piezoelectricity, there is a converse phenomenon called electrocaloric effect, that is a variation in temperature due to an external electric field. Pyroelectrics are a sub-class of piezoelectric materials. In the boundary condition of mechanically free and short circuited sample, the dielectric displacement due to pyroelectric effect is where the pyroelectric coefficient is defined as D i = p i T (1.23) p i = D i T. (1.24) A curious phenomenon of these materials is the existence of hydrostatic piezoeletricity i.e. the polarisation due to isotropic stress. Ferroelectrics are a sub-group of pyroelectric materials (see Figure 1.5). In these materials the spontaneous polarisation can be switched (both reversed or rotated) from one crystallographic orientation to others. Pyroelectricity is a necessary but not a sufficient condition fo ferroelectricity. Figure 1.5: Schematic hierarchy of piezoelectric materials Ferroelectric ceramics A classic and most widely used definition of a ferroelectric material has been given by Damjanovic [6]: 11

18 CHAPTER 1. PIEZOELECTRICITY Ferroelectrics are a special case of polar materials where spontaneous polarization possesses at least two equilibrium states; the direction of the spontaneous polarization vector may be switched between those orientations by an electric field. Another theory of spontaneous polarization has emerged recently but from the experimental point of view the classic explanation suites very well [10]. The spontaneous polarisation of these materials exists only in a certain temperature range. Below a so called Curie temperature T C, all the ferroelectric materials show the typical spontaneous polarisation. Above this temperature the crystals are in the paraelectric form, with no spontaneous polarisation. By crossing this critical temperature the materials undergoes a phase transition. Some materials, like barium titanate, undergoes several phase transitions with several successive ferroelectric phases [11,12]. The most commonly known ferroelectric ceramics have a perovskite structure ABO 3. "A" is 12 fold coordinated with respect to oxygen and B is octahedrally coordinated by oxygen. The structure is typically represent with the A site at the corner of the cube, the B site at the center and an oxygen at the middle of each face. This structure allows a great number of different cations and even doping being able to adapt the mismatch between the equilibrium A-O and B-O bond lengths. In this way a lot of stoichiometries are allowed. The structure has a great tolerance about the distortions. Moving from the cubic cell, also tetragonal, orthorhombic, rhombohedral and monoclinic cells can be found [13]. In Figure 1.6 is reported an example of different perovskite cells. Figure 1.6: Perovskite crystal in cubic, tetragonal and rombohedral states [6]. The most widely investigated and used ferroelectric materials belong to perovskite family like BaTiO 3 (barium titanate), (Na 0.5 K 0.5 )NbO 3 (sodium potasium niobate), PbTiO 3 lead titanate, PbZr 1 x Ti x O 3 (lead zirconate titanate) and so on. Particularly effective are the lead based ceramics but for enviromental and health reasons the research is moving towards the lead free alternatives [14,15]. Passing the Curie temperature there is the phase transition from the hightemperature cubic cell to the low-temperature tetragonal (or other) one. Moving to lower symmetry structure, the ions B, originally in the centre of the oxigen octahedra, jumps between energetically favourable positions out of the octahedron centre. Breaking the symmetry centre, the centre of positive and negative charge within the unit cell is no longer coincident, which is the origin of the spontaneous polarisation. The transition into a ferroelectric phase usually leads to anomalies in dielectric, thermal, elastic and other properties of the material. The transition is accompanied by a spontaneous strain of the unit cell. A significant temperature 12
19 1.2. PIEZOELECTRIC MATERIALS dependence of permittivity is found around T C, described by the Curie-Weiss law and immediately below the Curie temperature 1 ε r = ε 0 +C (1.25) T T C ε r = ε 0 +C 1 T C T (1.26) where ε r is the relative permittivity of the material and C is the Curie-Weiss constant. This two equations are valid for second-kind ferroelectric transitions. For first-kind ferroelectric transition T C is substituted by the transition temperature which does not coincide with Curie temperature [3]. Domain structure The spontaneous polarisation in a not ideal ferroelectric material is not uniformly aligned through all the volume in the same direction. By cooling a perovskite through the Curie temperature, the ion in the centre of the octahedra shifts towards one of the oxygens. The six possible directions are all equivalent. This means that spontaneous polarisation may arise with the same probability along any of them. The volume of material showing a single polarisation orientation is called domain. The region between different domains is called domain wall. Two kinds of wall can be found in tetragonal perovskites: if the domain have opposite polarisation the domain wall is called 180 wall if the polarisations of the neighbour regions are perpendicular is called a 90 domain wall Because of the different dimension of the sides of the tetragonal cell, the 90 domain wall will result with slightly lower angles. Depending on the crystalline structure, other domain wall angles are allowed. Along the domain walls the polarisation changes continuously but steeply. Commonly has been found a width of about 2-3 crystal unit cells, much narrower than the respective ferromagnetic domain wall [16]. The presence of ferroelectric domains allows to minimize the electrostatic energy of the depolarizing field and the elastic energy accumulated during the phase transition from paraelectric to ferroelectric. The polarisation of the material generates an accumulation of charge at the surface of the material. In turn this charge accumulation generates an electric field, called depolarizing field, which is oriented oppositely to the polarisation. It is present whenever there is a non-homogeneous distribution of the spontaneous polarisation (domain wall, material surface). The field can be pretty strong reaching the order of MV/m. To minimize the electrostatic energy associated with this field there are two possibilities: Ferroelectrics split into domains with opposite polarisation The depolarising charge is compensated by an electrical conduction through the crystal or by surrounding material. 13
20 CHAPTER 1. PIEZOELECTRICITY Splitting into domains can be also due to mechanical stresses. Let us assume the cubic cell of a perovskite above the Curie temperature is compressed along the [100] direction. To minimize the elastic energy, the long axis of the tetragonal cell will develop perpendicularly to the stress direction, while other unstressed areas remain parallel to the stress. The combination of electrical and elastic boundary conditions acting during the ferroelectric phase transition determines the domain structure (Figure 1.7). Figure 1.7: Formation of 180 and 90 domain wall in a tetragonal perovskite [6]. Both 180 and 90 domain walls contribute to the reduction of electrostatic energy. They are called ferroelectric domain wall because they differ in orientation with respect to the spontaneous polarisation. Only the 90 minimize the elastic energy. This kind of wall is also called ferroelastic because the orientation differs from the spontaneous strain tensor [6]. Switching and hysteresis When cooled below the Curie temperature, a ferroelectric ceramic experiences a complex mix of elastic and electric boundaries which split the material into various domains. Thus, even in a single crystal, because of the random spontaneous polarisation, the net macroscopic polarisation is zero. By the application of an electric field it is possible to reorient the domains along the applied field. Application of the electric field will reduce (in ceramics) or completely remove (in crystal) the domain walls. A direct consequence of the domain wall switching is the hysteretic behavior of polarisation as a function of the applied field. Figure 1.8: P-E behavior of different material: a) Ideal linear capacitor, b) Ideal resistor, c) Lossy capacitor, d) Non-linear ferroelectric [17]. The P-E behavior of an ideal linear capacitor, Figure 1.8a, is represented by a straight line whose gradient is proportional to the capacitance. In this material there is a 90 phase difference between the current and the voltage. The charge, which is the first derivative of the current, results in phase with the voltage. For 14
21 1.2. PIEZOELECTRIC MATERIALS an ideal resistor the current and the voltage are in phase so the P-E loop is a circle with the centre in the origin (Figure 1.8b). Combining these two elements a behavior like that in 1.8c is obtained. In such a lossy capacitor the area within the loop is proportional to the loss tangent of the device. In Figure 1.9a is reported a detailed hysteresis loop of a PZT film, very similar to that of Figure 1.8d. At small values of the alternating electric field the polarisation increases linearly with field amplitude (AB). Increasing the field the domains tend to switch along the direction of the field, or at least along the crystallographic directions as close as possible to it. The polarisation grow fast with a non linear behavior (BC). As the domains are aligned (C) the material begin to act again as a linear dielectric (CD). Decreasing the field some domain will remain orientated, resulting in a non zero polarisation called remnant polarisation (P R ). To reach the zero polarisation a coercive field E C has to be imposed. Figure 1.9: a) Ferroelectric P-E hysteresis loop in switching mode. The hexagons show a schematic representation of two domains with different orientation [6]. b) Hysteresis at various amplitude of field. At lower fields the switching of the domains is not achieved [18] In Figure 1.9b is also reported the effect of different field amplitudes. At lower fields the domain structure on average remains the same, while domain walls may move at a small scale. In addition to the P-E loop there is another hysteresis phenomenon concerning the displacement, as can be seen in Figure Moving from the zero field condition (A) an electric field is applied in the direction of spontaneous polarisation. The crystal expands linearly because of the piezoelectric effect until the maximum field is reached (C). At that point the field begins to decrease, and the sample is compressed, until it changes direction (AD) and then becomes strong enough to switch the direction of polarisation. It becomes parallel to the field and the displacement is positive again. Poling and ageing As stated before, a ferroelectric ceramic may have a net polarization equal to zero for the random orientation of the domains. The piezoelectric effect of the different domains will cancel each others. In order to exploit the piezoelectricity of polycristalline ferroelectrics it has be brought in a polar state. The process is called poling and consists in the application of a strong continuous electric field ( kv/cm) at high temperature, near the Curie temperature. The combined action of electric field and high temperature should accelerate the movement 15
22 CHAPTER 1. PIEZOELECTRICITY Figure 1.10: Strain-electric field hysteresis loop (butterfly loop) [6] of the domain walls through the imposed orientation. Thus the three critical parameters in this process are: Temperature Time Voltage. Another possible strategy is to brought the material at a temperature higher than T C, inducing the phase transformation in the cubic phase, and cooling it while the field is still applied. In this way the field boundary constrains the domains to be orientated in the same direction. It is important to reach the highest macroscopic polarisation avoiding the breakdown of the material. It can occur due to dielectric breakdown of the material itself, moisture, interfacial discharge, defects, cracks, bubbles. It is not trivial to understand the reason for the breakdown of the samples. The dielectric strength is also increased by increasing the thickness of the sample, but this is not always practicable [19]. In any case alignment is never complete; depending on the preparation of the material and the crystalline structure, it can reach the 83% for the tetragonal phase to 86% for the rhombohedral phase, and to 91% for the orthorhombic phase, when compared with single-domain, single-crystal values [2]. The macroscopic polarisation given to a ferrolectric tends to decrease as a function of the time after the field removal. This is a normal process of ageing of the properties. Although several mechanisms have been proposed it is not clear what are the effective contribution of each of them. The origin of the domain structures is to minimize the electrostatic energy of the depolarizing field, thus the main cause of ageing can be considered the thermodynamic necessity to reach again a situation of minimum energy. Despite this consideration, the depolarizing field is not considered as the only driving force [20]. The defect dipole reorientation model seems to be effective to explain the ageing behavior as a function of the vacancies concentration. A mobile charged defect can interact with the spontaneous polarisation in two ways: Migration of free charges to the external perimeter of the crystal(grain boundaries) decreases the effective polarisation response Orientation of defect-dipoles along the spontaneous polarisation. Due to the low mobility of these kind of dipoles the effect is a material hardening. 16

23 1.2. PIEZOELECTRIC MATERIALS The two mechanisms act in a very different way so that two materials with the same concentration of defects can behave differently according to which is the main acting mechanism [21] Piezoelectric polymers Piezoelectricity and ferroelectricity in a polymer was firstly discovered in PVDF by Kaway in the year 1969 [22]. Since that year researchers have found ferroelectric behavior in several others polymers such as odd-numbered Nylons [23], where the polar carbonyl groups are all oriented in the same direction, polyureas [24], polyurethanes [25], cyano polymers [26]. Also from the application point of view, this group of ferroelectrics has attracted great attention. Piezoelectric polymers, compared with the most used piezoelectric ceramics, show a lower strain coefficient d 33. However the low value of permittivity of the polymers leads to high values of voltage constants g 33 (g jm = d im /ε ij as in Equation 1.18) [27]. This means that they can be excellent sensors. Other attractive characteristics are flexibility, low density, lightweight, low cost (relatively speaking, fluoride ones are among the most expensive polymers), low refractive index, and an acoustic impedance much lower than those of ceramics (crucial for medical and underwater applications). Typically polymers exhibit a higher dielectric resistance to breakdown, sustaining higher operating electric fields than ceramics [28]. As shown in Figure 1.11 these polymers find application in a wide variety of devices. Figure 1.11: Piezoelectric and pyroelectric applications of electroactive polymers during the years from 1999 to 2004 [27]. Despite mechanisms for amorphous and semicrystalline materials differ, for both the morphologies four critical requirements exist to have piezoelectricity: The presence of molecular dipoles The ability to orient or align these dipoles The ability to sustain the dipoles alignment 17
 in an amorphous matrix (as in Figure 1.12).")
24 CHAPTER 1. PIEZOELECTRICITY The ability to undergo great strain when stress is applied. Within this thesis the discussion will be focused on the semi-crystalline polymers. In this case the microstructure is constituted by crystalline "isles" (that brought a net polarisation) in an amorphous matrix (as in Figure 1.12). As for ferroelectric ceramics, a poling process is needed in order to obtain a macroscopic polarisation that differs from zero. Optimal poling condition usually requires to overcome the glass transition temperature, in order to have a sufficient chain mobility [29]. Uniaxial stretching may somehow orientate the polymeric chains increasing the spontaneous net polarisation. Sometimes both stretching and poling are performed simultaneously [30]. Figure 1.12: a) Illustration of the microstructure of a semi-crystalline ferroelectric polymer. b) Mechanical stretching of the material can improve the alignement of the crystalline portion, increasing also the net polarisation. c) Depositing electrodes on the surfaces it is possible to perform the poling process to align the crystallite dipoles [28]. PVDF and its copolymers From the application point of view polyvinylidene fluoride PVDF is the most important ferroelectric polymer. Its chemical structure is simple: the monomer consists of two vinyl atoms of carbon with one of them bringing two fluorine atoms. The strong electronegativity of the halogen atoms determines the polarisation of the group. PVDF has different polymorphs, with different piezoelectric behaviors as shown in Figure Nature of the chains, casting techniques and posttreatments are the key to obtain a certain phase. Depending on the reciprocal orientation of the C-F 2 dipoles, the chain packaging may have a net polarisation. α-phase This phase is typically obtained when the polymer is cooled from the melt. It is a non-polar conformation trans-gauche-trans-gauche distorted by the steric interaction between the two fluorine atoms. β-phase This is the most interesting phase for the sensing application because it shows pyro- and ferroelectric behavior. The conformation is all trans so that the dipoles CF 2 are all oriented in the same direction. This is the origin of the spontaneous polarisation. The planar zigzag conformation is distorted because the fluorine atoms are too large to allow a simple all-trans conformation. 18
![1.2. PIEZOELECTRIC MATERIALS Figure 1.13: Unit cell of α (A), δ (B), γ (C), β (D). Schematic chain conformation of α and δ (E), γ (F), β (G). The green arrow indicates the dipoles direction [31].](/docs-images/72/66823441/images/25-0.jpg "γ-phase This phase is characterized by a chain conformation TTTGTTTG that confers a low spontaneous polarisation. Anyway it is not high enough to make this phase interesting for application.")
25 1.2. PIEZOELECTRIC MATERIALS Figure 1.13: Unit cell of α (A), δ (B), γ (C), β (D). Schematic chain conformation of α and δ (E), γ (F), β (G). The green arrow indicates the dipoles direction [31]. γ-phase This phase is characterized by a chain conformation TTTGTTTG that confers a low spontaneous polarisation. Anyway it is not high enough to make this phase interesting for application. δ-phase Application of a strong electric field to α-phase may cause 180 rotation of alternate chains leading to a polar, monoclinic form of α-phase. Another phase is obtained under very particular conditions and it is called ǫ-phase. Because it is very uncommon and hard to obtain there is poor literature about that. Table 1.3: Summary of the four polymorphs of PVDF [32]. Phase Conformation Unit Space Cell cell group parameters [Å] α TGTG Monoclinic P2 1 /c a=4.96 b=9.64 c=4.62 β TTTT Othorombic Cm2m a=9.64 b=4.96 c=2.56 γ T 3 GT 3 G Monoclinic C2cm a=4.96 b=9.58 c=9.23 δ TGTG Monoclinic P2 1 /c a=4.96 b=9.64 c=4.62 Depending on the molecular weight, chain terminal groups, processing techniques, post treatment and,possible inclusions, PVDF can exhibit different microstructures, phases and crystalline fractions. The latter typically ranges from 50 to 60%. Linear PVDF commonly crystallizes into spherulites that are lamellae of polymer chain segments. By cooling the polymer directly from the melt practically only α-phase is obtained. Several studies indicates a certain control in the crystallization of this polymer by casting it from a solution in strong polar solvents as DMF [33 36], DMSO [32,36], NMP [37], MEK [36], THF [36]. Several of these studies claimed the success in obtain β-phase. Investigation of the crystallization process and of its 19
26 CHAPTER 1. PIEZOELECTRICITY dependence on temperature, time, and on the nature of the solvent indicates that β-phase is thermodynamically more favourable while α-phase is kinetically favoured [33]. In literature it has been found that β-phase is promoted by the addition of certain fillers, in particular clays [38 42], or carbon nanotubes [43], or by the blend with other polymers, like PMMA [44,45], or ionic liquids [46,47]. Also the stretching of the sample allows the chains to rearrange in a more elongated conformation, thus increasing the β-phase fraction [30,35,48]. Sometimes the papers claiming β-phase are not so reliable. In fact it seems that polar solvents promote the γ-phase but it is hard to discriminate the two polar phases. Almost all the papers reporting the β-phase does not show the region of IR spectrum where it is possible to discriminate the β-phase from the γ-phase. Similar lack of attention in the PVDF characterizations appear both in the papers where the crystallization is promoted by solvents and where it is promoted by other nucleants. The presence of defects and short ramifications is detrimental for the crystallization ot the highly ordered β-phase. It seems that the polar phase crystallizes in the range of 11-14% of defects while in the extreme of this range α-phase dominates [49]. For piezoelectric purposes is mostly used polyvinylidene fluoride trifluoroethylene PVDF-TrFE which is a copolymer of PVDF. The characteristics of this polymer is to crystallize in β-phase directly from the melt. As stated before, β-phase is thermodynamically favoured but cooling from the melt it does not appear. Similarly to ferroelectric ceramics PVDF, should encounter a Curie temperature where the transition from para- to ferro-electric takes place. In PVDF this temperature is over the melting point while in PVDF-TrFE it is below. In some cases two Curie temperatures have been found. This lead to think that β-phase can have two slightly different sub-phases, one more organized and the other more defective. 20
27 Chapter 2 Piezoelectric composite materials for tactile sensing 2.1 Composites and concept of connectivity Composites are a very complex class of materials. The main objective for which they have been developed is to couple and modulate the properties of different kind of materials. Even though the choice of the constituents is a critical step, it is not the only parameter affecting the final material properties. A fundamental role is played by the way they are coupled. It is, in principle, possible to obtain a wide variety of properties by designing the composite taking into account various characteristics: connectivity pattern, which acts on field and force concentration symmetry at various levels, from the crystallographic structure of the raw materials to the combined symmetry of the composites the use of periodicity in the inclusions dimensions of the inclusions interfacial phenomena between matrix and filler presence of porosity possibly due to the preparation process. These ideas, summarized in Figure 2.1, provide a basic understanding of functional composite sensors and actuators [50]. Let us consider a physical property which relates an input physical quantity m, such as the volume fraction of the components, to output physical responses Y (n) (m) and Z (n) (m). Generally speaking the properties Y (m), Z (m) of composites are modified by three main effects due to the presence of different phases: Sum properties Combination properties Product properties. 21
28 CHAPTER 2. PIEZOELECTRIC COMPOSITE MATERIALS FOR TACTILE SENSING Figure 2.1: Flow chart illustrating design consideration for composite materials [51]. In sum properties, Y (m) obeys to a monotonic dependence from the volume fraction such that it can be defined as Y (m) = Y (1) (m)+y (2) (1 m)+ Y (2.1) where Y defines the deviation from a linear dependence. This behaviour is typical of elastic moduli, piezoelectric coefficients and dielectric permittivities of 0-3, 1-3 composites. Given two sum properties Y (m) and Z (m), both following a monotonic dependence from the volume fraction, a third property W (m) is defined as a combination of the previous ones. The monotonic character of Y (m) and Z (m) does not imply a monotonic volume fraction behaviour of the combination property. In piezo-composites this can be observed in the piezoelectric voltage coefficient g ij = d ij /ε ij. In general, product properties appear when generated by the interaction of two complementary properties. A response activated by a stimulus and volume fraction dependent can, in principle, be a stimulus itself for another response. In practice a sort of indirect triggered property [52]. As introduced before, phases configuration is an important feature in engineering a composite. Different structures can affect dramatically the magnitude of a physical response or the generation/combination of properties. An important contribution to this matter had been given by Newnham et al. which in the 1978 proposed a classification based on the concept of connectivity. A composite is labelled by numbers which represent the dimensions in which the different phases are connected. In this way a two phase composite can have ten different 22

29 2.1. COMPOSITES AND CONCEPT OF CONNECTIVITY connectivities, namely: 0-0, 1-0, 2-0, 3-0, 1-1, 2-1, 3-1, 2-2, 3-2, 3-3. In Figure 2.2 there is a schematic representation of the different composite structures. Figure 2.2: The ten connectivity patterns allowable for a two phase composite [53]. Concerning the piezoelectric properties, which are the main topic of this thesis, Newnham proposed two simple models to predict the behavior of composite materials assembling the characteristics of the two constituents. By putting in series and parallel the two phases, respect to the external field (whatever it is), it is possible to have a forecast of the final property. Despite these models are extremely simplistic, they represent a sort of delimitation for the values the piezoelectric coefficient may have. In the following equations the superscript (m) indicates the matrix, while (f) the filler. The quantities taken into account are the volume fraction φ, the dielectric permittivity ε 33, the elastic compliance s 33 and, of course, the dielectric coefficients d 33 and g 33. d 33 = (f) φ (f) d 33 (m) ε 33 + (m) φ (m) d 33 (f) ε 33 (f) φ (m) ε 33 + (m) φ (f) ε 33 (2.2) using the well known definition for the voltage coefficient g 33 = d 33 /ε 33 from Equation 1.18 g 33 = (f) φ (f) g 33 + (m) φ (m) g 33 (2.3) In this kind of connection even a thin layer of polymer, with permittivity sensibly lower than a ceramic, can lower the d-coefficient, while the correspondent g- coefficient remains substantially unaffected. For the parallel connection the two 23
30 CHAPTER 2. PIEZOELECTRIC COMPOSITE MATERIALS FOR TACTILE SENSING layers lay perpendicular to the electrodes, and the piezoelectric coefficients can be defined as d 33 = (f) φ (f) d 33 (m) s 33 + (m) φ (m) d 33 (f) s 33 (f) φ (m) s 33 + (m) φ (f) s 33 (2.4) g 33 = (f) φ (f) d 33 (m) s 33 + (m) φ (m) d 33 (f) s 33 ( (f) φ (m) s 33 + (m) φ (f) s 33 ) ( (f) φ (f) ε 33 + (m) φ (m) ε 33 ) (2.5) For a parallel connected composite with a stiff piezoelectric phase (i.e. a ferroelectric ceramic) and an elastically compliant polymeric phase the equations can be simplified considering that (f) d 33 >> (m) d 33, (m) s 33 >> (f) s 33 and (m) φ = (f) φ = 0.5. In this case d 33 (f) d 33 and if (f) ε 33 >> (m) ε 33, then g 33 (f) g 33 / (f) φ = 2 (f) g 33. It is evident that with smaller volume fractions, the voltage coefficient increases [51,54]. Figure 2.3: The series and parallel models proposed to estimate the piezoelectric and pyroelectric properties of composites [54] piezoelectric composite materials By arranging in different configurations the same raw constituents, a final composite can result with a very wide range of properties values. For this reason piezoelectric composites with the same composition, but different configurations, have been investigated for a wide range of applications and work conditions. Among the configurations the most simple is the 0-3 one. It consist of a random array of particles dispersed in a matrix. The most common materials used for piezoelectric applications are ceramic piezoelectric particles, such as ferroelectric perovskites, in a polymeric matrix which can be piezo-active or passive. Despite the simplicity, polymer-ceramic composites in this configuration have a series of advantages: Processability The process for the preparation can vary from simple mechanical mixing between particles and polymer melt or solution, to more refined techniques of dispersion in photo-curable monomer or in situ synthesis of particles. Other possibilities are to combine the raw materials in order to get a paste or an ink, depositing the composite via screen printer or inkjet printer. Otherwise they can be processed more or less like a pristine polymer (meltcast, pressed ate relatively low temperature, extruded) obtaining a large number of shapes for the final product. This wide variety of choice has great impact on the attractiveness of these materials from the industrial 24
31 PIEZOELECTRIC COMPOSITE MATERIALS point of view because of the consequent adaptability to industrial processes and possibility to reduce the costs of production. Matrix effect The main purpose of these composites is to extend the application of ceramic functional properties to mechanical environment other than the usual. The polymer matrix grants flexibility and the possibility of being shaped in several forms. For actuation application this allows bigger displacement and an extended working electric field, due to the higher breakdown resistance. Functional properties In principle the functional property of interest can be modulated by varying the filler content. This is partially true. For piezoelectricity over a certain volume fraction the agglomerates of particles can be detrimental for various reasons. For piezoelectric application this kind of composites have been explored, especially with low filler fractions. Of course the piezoelectric response is far from the pristine ceramic materials, but they can be suitable for sensor applications Piezoelectric models for 0-3 ceramic-polymer composites One of the interest in composite formulation is to achieve a prediction, as precise as possible, of the final piezoelectric constant. As stated before, the models in series and in parallel combine two phases obtaining the lower and the highest values that can be obtained in a composite. From a geometrical point of view, these models exploit a 2-2 composite applying a field parallel and perpendicular to the layers. For a 0-3 composite several models have been proposed in order to describe the behavior of the piezoelectric constant within this threshold; in the next pages the most commonly used ones will be illustrated. Furukawa Apart the simple series and parallel model proposed by Newnham [51,54], the first attempt to match a theoretical description of piezoelectric composites to experimental data is due to Furukawa in 1976 [55,56]. This model contemplates an isotropic composite with spheric inclusions. It introduces the concept of local field by the use of local field coefficient. They express the ratio between the field perceived by the inclusions and the total field. The coefficients L for the different fields (L σ stress, L x strain, L E electric field, L D dielectric displacement) are functions of the volume fraction φ, the dielectric permittivity ε and the elastic modulus c. L σ = L x = 5 (f) c 3(1 φ) (m) c+(2+3φ) (f) c 5 (m) c (3+2φ) (m) c+2(1 φ) (f) c (2.6) (2.7) 25
32 CHAPTER 2. PIEZOELECTRIC COMPOSITE MATERIALS FOR TACTILE SENSING L E = 3 (m) ε (2+φ) (m) ε+(1 φ) (f) ε (2.8) L D = 3 (m) ε 2(1 φ) (m) ε+(1+2φ) (f) ε (2.9) The strain generates on the material a local strain on the particles which start the local dielectric displacement and then the final global dielectric displacement. In Figure 2.4 there is a graphical explanation for the e constant. Figure 2.4: Description of the piezoelectric effect for a two phase system including the local field concept [56]. The four coefficient can be expressed as a function of the local field d = φl σ L E (f) d (2.10) e = φl x L E (f) e (2.11) g = φl σ L D (f) g (2.12) h = φl x L D (f) h (2.13) The greatest limit of this model is the narrow range of applicability. In fact it matches experimental results only for low ceramic loads, typically with volume fraction less than 0.3. Yamada Yamada model have been developed to describe ellipsoidal inclusions in continuous non piezoelectric medium [57]. The microstructure is described by a shape factor n used to define the local electric field and, consequently, the dielectric permittivity { } ε = (m) n (f) φ( (f) ε (m) ε) ε 1+ (2.14) n (m) ε+( (f) ε (m) ε)(1 (f) φ) A new local field coefficient G is defined 26
33 PIEZOELECTRIC COMPOSITE MATERIALS G = and the piezoelectric constant is given by nε nε+( (f) ε ε) (2.15) d = (f) φαg (f) d (2.16) In this model is taken into account the role of poling by the product for a parameter α which varies from 0 to 1. When the sample is un-poled, α = 0, no piezoelectric response can be found. By using this model also the elastic coefficient (Young modulus) c has been calculated { } (f) c = (m) φ( (f) c m c) c 1+ (2.17) (m) c+n ( (f) c+ (m) c)(1 (f) φ) where n is a parameter related to the shape of the inclusions. In all the equations the material is considered loss-free both from the mechanical and dielectric point of view. Jayasundere Jayasundere and Smith proposed an analytical expression for permittivity and dielectric coefficient by considering the composite as piezoelectric spheres randomly dispersed in a dielectric continuum, and subjects to the condition (f) ε >> (m) ε. The electric field interactions between spheres were included in the model [58,59]. d 33 = (f) φ (f) d 33 (f) σ σ ( ) ε 1+ 3(f) φ (f) ε (f) ε 2 (m) ε (f) ε (2.18) The analytical expression of the stress ratio developed in the Furukawa model [55] was (f) σ σ = 1 (f) c c (m) c (f) φ c (f) c (m) c (2.19) where c represents the elastic constant. At a first approximation for highly loaded composites c, (f) c >> (m) c so that the stress ratio can be approximated as (f) σ σ 1 (f) φ (2.20) and, by substituting in Equation 2.19, a new simplified expression for highly loaded ceramic composite is obtained ( ) d 33 (f) d ε 1+ 3(f) φ (f) ε (2.21) (f) ε 2 (m) ε+ (f) ε 27
34 CHAPTER 2. PIEZOELECTRIC COMPOSITE MATERIALS FOR TACTILE SENSING Banno Banno proposed a model in 1994 moving from the series-parallel analysis [60,61]. The 0-3 composite is represented by a representative volume element that comprises parallelepiped-like inclusions and the surrounding matrix. The effective electromechanical properties in this composite are determined by direct averaging of the properties in the components. In the averaging the shape of the inclusions plays a key role but the interaction between the phases is negligible. The final equation for the dielectric constant is d = 4a 2 {a (m) ε (f) d+(1 a) (f) ε (m) d} [a (m) ε+(1 a) (f) ε]+(1 4a 2 ) (m) d (2.22) where a is a parameter related to the volume fraction of the filler: (f) φ = a 3 and 0 a 0.5. Matrix method This method has been proposed by Levassort et al. [62, 63] developing a previous model born for 2-2 composites based, in turn, on the Banno parallelepiped unit cell. The electro mechanical coefficients (elastic stifness, dielectric permittivity and piezoelectric tensor element) are involved in a 9x9 matrix to which boundary conditions derived from the connectivity are applied. Shin Poon Shin and Poon s group tried, in several works, to obtain simple expressions for permittivity and piezoelectric coefficients [64 67]. Their purpose is to overcome some approximations of the previous models (like non interacting particles, incompressible particles and so on) with a model that allows to obtain an analytic expression of the coefficients without the need of heavy computation. In principle their objectives is to have simple expressions with an applicability extended on a wide range of volume fraction of inclusions. The basic assumption is to have elastic spherical inclusions embedded in an infinitely large matrix. Both materials are assumed to be isotropic and homogeneous. As an approximation, the electric field is considered not to alter the mechanical equilibrium, hence the stress distribution is handled solely by the elastic theory. The one particle problem is then generalized defining volumetric average of the applied field and deriving the local field coefficients acting on the material. L E = 1 ε (m) ε φ (f) ε (m) ε { } L 1 k 1 (m) k 1 σ = 3 (f) k 1 (m) k 1 µ 1 (m) µ (f) µ 1 (m) µ 1 { } L 1 k 1 (m) k 1 σ = 3 (f) k 1 (m) k + 2 µ 1 (m) µ (f) µ 1 (m) µ 1 (2.23) (2.24) (2.25) L E = (1 φl E )/(1 φ) (2.26) 28
35 PIEZOELECTRIC COMPOSITE MATERIALS L σ = φl σ/(1 φ) (2.27) L σ = (1 φl σ)/(1 φ) (2.28) where ε, k, µ represent the permittivity, the bulk coefficient and the shear modulus while φ is the volume fraction of the ceramic filler. The effective permittivity and piezoelectric constant are ε = (m) ε+ φ( (f) ε (m) ε) (f) ε+2 (m) ε φ( (f) ε (f) ε) φ+(1 φ) 3 (m) ε (2.29) d 33 = φl E { 2L σ (f) d 31 +L σ (f) d 33 }+ (1 φ)l E { 2L σ (m) d 31 +L σ (m) d 33 } (2.30) This model is as effective as the Furukawa s and Jayasundere s ones for low ceramic load but fits much better higher loads. From the same group there has been an attempt of modelling the poling process [68]. Model for dielectrophoretically aligned piezocomposites Dielectrophoretic effect can be utilized to manipulate particles dispersed in viscous media. In a work by van den Ende et al. [69] dielectrophoresis is applied to an uncured thermosetting polymer so that the dispersed particles form chains which are stuck in place once the matrix is cured. From the theoretical point of view, they use the Yamada model considering that the particles experience a strong interaction in the direction of alignment resembling like a 1-3 composite. The piezoelectric coefficient is defined as DEP (f) φ (m) S d 33 = (f) φ (m) S +(1 (f) φ) (f) S 33 (2.31) while the dielectric permittivity is R DEP ε = φ[ (f) (m) ε (f) ] ε +(1 (f) φ) (m) ε (2.32) (f) ε+r (m) ε The dielectrophoresis appears both in simulations and experimental validation to improve the dielectric coefficients d 33 and g 33 until a certain concentration is reached. The purpose of this process is to create chain of particles at small distance with a favourable polar interaction among them. It is clear that once the particles concentration is very high the distance is already favourable, and such a process is not needed. 29
36 CHAPTER 2. PIEZOELECTRIC COMPOSITE MATERIALS FOR TACTILE SENSING Models for random 0-3 composites dielectric properties A great drawback for the technological exploitation of 0-3 composites is the lies in the decrease of dielectric strength. Typically great the higher the permittivity the lower the value of dielectric breakdown (expressed as the electric field at which the breakdown occurs E break ). Although a satisfactory reliable expression for the breakdown field has not been proposed yet it is worthwhile to present two simple models, well reviewed in Dang s work [53]. The first one deals with a very rough schematization that considers the polymer as a homogeneous material and a purely elastic body at low strains. Under such conditions the nominal breakdown field of the material is given by the following expression: E break = V break Y 0.6 (2.33) d 0 2ε where V break is the breakdown voltage, d 0 the thickness at rest and ε the permittivity of the material. Another model is taken from the field theory of dielectric media. The field applied to the material is considered as an average value. The actual internal field can vary from point to point depending on interactions of local fields generated by dipoles. Assuming that the local breakdown field is the same for the matrix in its pristine and composite form, the local field breakdown expression can be equated (m) ε+2 (c) ε+2 (m) E break = (c) E break (2.34) 3 3 A number of models have been proposed for predicting the behavior of relative permittivity ε once a second phase is added to a matrix. In Appendix B are presented several solutions collected in some reviews [53, 70 72]. As stated before the two simplest interpretations are the series (Equation B.1) and parallel (Equation B.2) models which represent a sort of lower and upper limits. According to Araùjo et al. [70] the models can be classified in three main groups: 1. These models were historically the first and typically consider composite systems where spherical inclusions are embedded in a polymer matrix. Neither the interactions between particles or particle and matrix nor the size of the inclusions are taken into account. The involved Equations range from B.3 to B These models are used typically to describe composites with spherical inclusions in a polymer matrix. In these models are considered the polarization of materials by an applied electric field, interaction with this field and interaction between filler and matrix. As a low concentration is maintained interaction among the particles can be neglected. The Equations included in this family are those from B.8 to B The last group includes refined models, that typically improvement of the previous ones. Depolarizing field and/or particle shape, ellipsoids in most of the cases, are taken into account with the introduction of two parameters 30
37 PIEZOELECTRIC COMPOSITE MATERIALS n and n. The Equations belonging to this group are those from B.16 to B
38 Part II Experimental activity 32
39 Chapter 3 Piezoelectric 0-3 composites: formulation, materials and methods 3.1 Introduction A device working as tactile sensor can be designed following two different strategies: a distribute sensors array a sensitive skin. In the first case the main problem is the integration of a big number of devices on a substrate, which in principle can be rigid or flexible. In the second one the main problem is to have a material with both a measurable response to the stimuli and flexibility. In the project of this thesis concerning a fully functioning hand exoskeleton the second choice appears very attractive. Since some sensors of that kind have already been built [73] with piezoactive polymers to this application, an improvement in the properties is highly desired. Sensors is not the only application for these materials. In fact a flexible lead free material able to generate charge as a function of the deformation can be exploited for power generation [74]. In this PhD project the main objective is to produce and characterize materials which can possibly be used for sensing applications. This imposes that they should have good piezoelectric response and flexibility, in order to be used as an artificial skin. In addition, the materials should have a low cost and an easy processability. Because of these requirements we decided to study 0-3 piezoelectric composites based on a polymeric matrix, granting flexibility, and piezo-active fillers, granting the functional properties. Their simple connectivity grants wide possibilities of processing of the materials. 33
40 CHAPTER 3. PIEZOELECTRIC 0-3 COMPOSITES: FORMULATION, MATERIALS AND METHODS 3.2 Materials In this thesis barium titanate was chosen as piezoelectric ceramic phase. Other ferroelectric perovskites have higher performances but all of them are lead based. So this choice is based on the will to prepare a material totally lead-free. In addition barium titanate has a Curie temperature relatively low ( 130 C). It can be sustained by polymer during poling process, and it is high enough to avoid an easy thermal depoling. Ceramic filler was introduced in increasing vol% of 20, 35, 50. PVDF along with two copolymers were characterized for their exploitation as matrices piezoelectric composites and barium titanate particles was used as active fillers. The similar chemical nature of these polymers should, in principle, grants a similar dispersion of the powder when the processing conditions coincide. These polymers, depending on the crystalline phase, can behave with different piezoelectric responses; in addition they have different mechanical properties. In this way similar composite microstructures are explored changing the property of the matrix. Being the piezoelectric coefficient of the PVDF opposite respect to that of the barium titanate, they are expected to be subtracted, decreasing the overall effect. Nevertheless it is interesting for the application evaluating how two opposite contributions interact. Another commonly used polymer, such as PMMA, was studied as matrix in order to evaluate the effect of filler on a cheap material with relatively poor mechanical properties. The raw commercial materials used to prepare the composites were: BaTiO 3 particles (from now on indicated as BT) produced by Inframat, Advance Material. The mean particle size declared by the supplier is 500 nm. The density is 5.85 g/cm 3 Polyvinylidenefluoride (from now on indicated as PVDF) Kynar 720 (pellets), produced by Arkema, having an average M W and a density of 1.78 g/cm 3 Copolymer polyvinylidenefluoride-co-hexafluoropropylene P(VDF-HeFP) (from now on indicated as HeFP) Kynar-Superflex 2500 (pellets), produced by Arkema with a 20 w% of HeFP and a density 1.79 g/cm 3 Copolymer polyvinylidenefluoride-co-trifluoroethylene P(VDF-TrFE) (from now indicated as TrFE) Solvene250 (powder), produced by Solvay and characterized by an average M W , density 1.88 g/cm 3 Polymethilmetacrilate (PMMA), Sigma Aldrich. with an average M W and a density of 1.17 g/cm 3 Dimethylsulfoxide (DMSO), Sigma Aldrich with a density of g/cm 3 and a boiling point 189 C 3.3 Elaboration of 0-3 composites The final properties of a composite are influenced not only by the composition, intended as the choice and the amount of the constituents. A critical parameter 34
41 3.3. ELABORATION OF 0-3 COMPOSITES is also the morphology, which is strictly related to the processing technique used to obtain the final material. Different processes may lead, in principle, to very different microstructures in terms of defects and particle dispersion. Moreover, using a semi-crystalline polymer as the matrix, the process may have influence, along with the presence of a second constituent, the final crystalline form. The complexity increases considering that piezoelectricity is a property derived from the coupling of the electric and the mechanical behavior of the materials. Let us consider a composite constituted by a piezo active matrix with piezoelectric inclusions. The process may, in principle, modifies the piezoelectric response and the mechanical behavior of the polymeric matrix (assuming that both depend on the phase and on the degree of crystallization). The latter has a direct influence on the piezoelectric behavior of the polymer (as in Equation from 1.10 to 1.17) and an indirect influence on the response of the fillers, being responsible of the stress effectively transmitted to it. Moreover it is important to consider that the contribution of some elements such as amorphous fraction, amorphous-crystalline interfaces and polymer-ceramic interfaces are not clarified and, in any case, can hardly be estimated [75] Composites formation techniques: a brief overview The dispersion of a ceramic filler in a polymeric matrix is a crucial parameter affecting the final properties and applicability of the composites. On the basis of the objectives many strategies can be chosen, all of them presenting advantages and drawbacks. Concerning 0-3 composites, in fact, three main families of processes can be identified [76]: Mixing of pre-synthesized constituents (ex situ matrix and inclusion) Addition of inclusion to matrix precursor (ex situ inclusions, in situ matrix) Simultaneous in situ synthesis and in situ polymerization of filler and matrix This project is focused on the exploitation of ex situ/ex situ processing techniques to control matrix phase and global microstructure of composites. These techniques are so far the most commonly used in the industry because of the relative simplicity of the required technologies. The choice to use raw commercial materials is attractive also for a technological research approach. It allows to focus the attention on the morphology-properties relation without considering the first synthetic step, which can be a source of problems concerning the reproducibility. The mixing step of the two constituents can be performed with various techniques [53]: Direct solid state mixing, that involves the mixture of fillers and a thermoplastic polymer without any pre-treatment. It is commonly used when both the constituents are powders that, after mixing, were submitted to hot pressing in order to produce the final material. The main drawback is that this kind of mixing leads to a very limited dispersion due to the tendency of sub-micron and nanometric particles to agglomerate. 35
42 CHAPTER 3. PIEZOELECTRIC 0-3 COMPOSITES: FORMULATION, MATERIALS AND METHODS In melt compounding the particle aggregates are broken by high shear forces of the melt matrix that is highly viscous. The most commonly used equipment for this kind of mixing is the twin screw extruder. This kind of process is quite energy expensive. At high filler concentration melt mixing can be difficult because of the high viscosity of the system. High amount of fillers can be incorporated into polymer matrices by using solution processing. This process involves the dispersion of both polymer and filler in a solvent. The problem is that this process requires the use of large volumes of solvents which affects the costs of production. Over all, the most common solvents are of high toxicity, so that precautions concerning safety and environmental risk should be taken into account Preparation Two preparation techniques among the previously exposed were used, with little variations. The first step for composite preparation was to dissolve the polymers in DMSO. The chosen concentration was 20 wt%: after few dissolution tests, this value appeared as a good compromise between solvent consumption and viscosity. For PMMA the concentration was 10 wt% because of difficulties during the casting step of polymeric pellets or powders were put in a sealed vessel under magnetic stirring at about 60 C for 60 minutes. Once the polymer was fully dissolved, BT powder was added and left under stirring for 20 minutes in order to mix the constituents. After that, other 20 minutes of strong mixing were performed using Ultra-Turrax IKA at rpm. Purpose of this mixing was to homogenize the mixture and breaking particles agglomerates. Composite thick films were then prepared by casting the mixture on glass slides. After the deposition step the composites were left in a close chamber for 24 hours. A preliminary test was performed at various temperatures in order to correlate evaporation temperature and crystallized phase. Once verified that this parameter has a little influence, 100 C, the highest temperature considered, was chosen to prepare all the composites. The reason for this choice is to evaporate as much solvent as possible, in particular considering the high boiling point of DMSO. Among all the polar solvents DMSO was chosen due to its low toxicity. A second process was applied in order to improve the dispersion of fillers and to reduce possible matrix defects. For each composition, some samples were heated at 230 C and pressed. Heating at such a temperature should have also the effect of evaporate the residual solvent. In Figure 3.1 the preparation process is resumed. 3.4 Characterization techniques Phases characterization Infrared spectroscopy Infrared spectroscopy is an analytical technique based on the interaction between an electromagnetic radiation and matter. When an organic compound 36
, energy is absorbed at certain frequency by the stimulation of vibrational modes of the molecules.")
43 3.4. CHARACTERIZATION TECHNIQUES Figure 3.1: Flow chart resuming the preparation step for the composites. is exposed to infrared radiation (form to 10 cm 1 ), energy is absorbed at certain frequency by the stimulation of vibrational modes of the molecules. The signals are influenced by several chemical, structural factors (for instance hydrogen bond, polarization, conjugation, sterical interaction). Adsorption of the radiation from the samples is detected as spectra where every compound has a typical behavior. This technique results particularly useful for chemical and even phase identification of the polymers. The most typical configuration fo this kind of measurement is in transmission. Because of thickness and the high absorption of the samples such a configuration was not possible. The spectra presented in this thesis were all collected via total attenuated reflectance (ATR). In this technique the sample is in contact with a material with a high refraction index in the infrared range. The radiation is reflected several times penetrating for few microns in the sample and then collected. This technique has a depth of penetration given by: 1 d = 2πn c σ sin 2 θ n 2 x (3.1) where n c is the refractive index of the high refractive crystal, n x is the ratio between the refractive index of the material and that of the crystal, θ the angle of incidence and σ the wavenumber [77]. ATR is considered a surface characterization technique because the maximum depth of penetration in the samples is about two microns. In this work a Bruker Tensor 27 spectrometer was used. All the ATR spectra were collected in the range cm 1, but in the following will be reported only the range cm 1, that is useful for PVDF phase identification. In all the cases samples are scanned on both faces. Differential scanning calorimetry (DSC) This technique is widely used in polymer science to evaluate phase transitions and thermal behavior. Differential scanning calorimeters consist commonly of two sample positions, one for the sample and the other for a reference (usually an empty crucible). 37
44 CHAPTER 3. PIEZOELECTRIC 0-3 COMPOSITES: FORMULATION, MATERIALS AND METHODS Temperatures of both are measured by a resistive sensor and both have a resistance heater. A temperature program is applied and if a temperature difference is detected between the sample and reference, due to a phase change in the sample, energy is supplied until the temperature difference is compensated. The energy input per unit time is recorded as a function of temperature or time [78]. Phase transitions appear as peaks in the thermograms and the area under the curve is defined as heat of transition. DSC is the most widely used technique to evaluate the cristallinity of the polymeric materials according to X c = H m H 0 m (3.2) where H m is the measured melting enthalpy, H 0 m is melting enthalpy of the 100% crystalline polymer. Considering the matrix of a composite, the real melting enthalpy is found from the ratio between the measured peak signal and the mass fraction of the polymer: H m = Hmeas m (1 w) = Hmeas m ρ p φ p +ρ f φ f ρ p φ p (3.3) where Hm meas is the area under the melting peak, w is the mass fraction of the ceramic filler, ρ is the density, φ the volume fraction; the subscript p indicates the polymer, while f the filler. The instrument used during this thesis work was a Netzsch DSC 204 F1 Phoenix. All the thermograms are collected in the range -70 to 230 with heating/cooling rates of 10 C/min. X-ray diffraction (XRD) X-ray diffraction is a widely used technique for the characterization of the crystalline materials. It is based on the capability of atoms to act as scattering centres. When an x-ray radiation falls on crystalline structure, due to the fact that interatomic distances are comparable with X-ray wavelength, a reflection signal is generated, according to the Bragg s law nλ = 2d hkl sinθ (3.4) where n is an integer, λ the wavelength, d hkl the interplanar distance of the "hkl" planes and θ the angle between the incident radiation and the scattering planes. When this equation is satisfied, scattering can occur. In diffractograms are shown the peaks intensities as a function of the diffraction angle. Peak position is related to the interplanar distances so that it can be used for the identification of the crystalline phases. In this work a diffractometer Philips PW This instrument has a Bregg-Brentano geometry and a Cu Kα radiation Piezoelectric and dielectric characterizations For this kind of measurements Au electrodes were deposited on the composites films. The samples were cut into disks of 5 mm diameter and the thickness evaluated with a gauge. 38
45 3.4. CHARACTERIZATION TECHNIQUES Poling process Because of the random orientation of ferroelectric domains, as-prepared ferroelectric materials do not show any piezoelectric activity. To obtain a nonzero net polarisation it is necessary to force the piezoelectric domains walls to move (either from ceramic or polymer) in order to grow aligned domains. The alignment is given by an electric field above the coercive field. To favour the mobility of domain walls the process is performed at a temperature slightly below the Curie temperature. The other parameter to be set is the poling time. Theoretically the higher the poling field the more effective is the domain switching. A limitation in the applied field is given by the possibility of dielectric breakdown. Apart the intrinsic breakdown, which is a characteristic of the ideal material itself, discharges can easily generate between the electrode and the tip. In order to avoid the flashover, poling is usually performed in silicone oil. Dielectric strength of the real material is the other main limitation for the maximum poling field. This is related to the defects and the interfaces present in the material. Because of this, the pristine polymer can sustain higher electric field than its composites. Poling is a very critical step for the study of piezoelectric properties and it should need an optimization. In this project for a reason of time it was not possible to analyze the poling conditions and the samples were poled according to the cycle of Figure 3.2, inspired by reference paper [79]. In particular the samples were immersed in oil and the temperature raised. Once reached 110 C the electric field was switched on at about 12 V/µm. After 30 minutes, cooling begans, going on for further 30 minutes when the temperature arrives at about 35 C and the electric field was removed. Figure 3.2: Graphical representation of poling process. 39
46 CHAPTER 3. PIEZOELECTRIC 0-3 COMPOSITES: FORMULATION, MATERIALS AND METHODS Evaluation of piezoelectric coefficient: the Belincourt method Piezoelectric performances in materials were evaluated by the coefficients defined in Table 1.1. Direct methods consists in measuring charge upon the application of a mechanical stress according to Equation 1.8. The Belincourt d 33 -meter is one of the most commonly used piece of testing equipment for piezoelectric material [80]. The sample is put between metallic jaws and subjected to a mechanical stress. The generated charge is collected. The force applied on the material is probed by a piezoelectric of known performance (usually quartz) put in series with sample, so that both feel the same force F. The charges produce by the sample and the reference, namely Q s and Q r, are measured as voltage at the parallel capacitance C s, C r. Since both the sample and reference undergo the same force it can be written that Q s = d s F and Q s = d s F. Equalizing this two expressions the coefficient of the sample will be equal to ( ) Qs d s = d r (3.5) Q r Since the signal is measured as a voltage on a capacitance, the expressions Q s = C s V s and Q r = C r V r can be inserted giving the final expression for the piezoelectric coefficient d s = d r ( Cs C r )( Vs V r ) (3.6) d r is known, and the ratio between the capacitance can be set to unity. This means that it is possible to evaluate the piezoelectric coefficient by measuring two voltages. Dielectric measurement Permittivity is a complex, frequency dependent quantity defined as ε(ω) = ε (ω) iε (ω) (3.7) The imaginary part is related to all the phenomena of dissipation occurring. A loss factor is defined as tanδ(ω) = ε (ω) ε (ω) (3.8) Both the values are very different between nonpolar and polar materials. In the former case they are nearly constant over a wide frequency range and for temperatures below the softening point. In contrast, for polar materials, the dielectric constant decreases with an increase in frequency, whereas the dissipation factor increases and decreases in a cyclic manner [81]. The relative permittivity ε r (real part of the complex quantity) was determined from the measurement of the capacitance according to the relation ε r = Ct ε 0 A (3.9) Both the capacitance and losses were measured with a high precision HP4284A LCR meter. 40
47 Chapter 4 Results and discussion 4.1 Preliminary characterization of barium titanate powders Barium titanate is the firstly discovered ferroelectric perovskite. Its ferroelectricity is strictly connected with its crystalline phase. The Curie point of barium titanate can be found in the range C. Above this temperature the cubic cell is stable up to 1460 C, and further above the hexagonal structure is found. At the Curie temperature barium titanate undergoes paraelectric to ferroelectric transition and the tetragonal phase takes place. Below 10 C orthorhombic structure is stable until -90 C where the low temperature phase has a trigonal structure [82]. Many effects can occur altering the stability of the tetragonal phase. In particular several works have related grains or particle size with the stable phase. In fact it seems that below a certain threshold of grain size, cubic cell is stable at room temperature [83]. Barium titanate submicron- or nano- particles have a shell crystalline structure. Due to the absence of Ba ions in the structure at the powder surface [84], the core of the particles has a tetragonal structure, while the external shell is in the cubic form with a gradient lattice strain layer between them [85]. Because of this layered structure BaTiO 3 particles whose size is below 200 nm are easily detected as fully cubic. For the just explained reason the powder chosen for this project was characterized by a mean particle size of 500 nm. Nonetheless due to synthetic techniques (critical for the presence of inner pores [86]) or impurities, the cubic phase may result stabilized even for relatively large particle size. A careful check of the crystalline phase of the raw commercial powders is therefore needed. In Figure 4.1 phase transformations are shown. Dielectric characterization was performed on a pellet prepared by cold pressing the powder. It is well known that the permittivity is dependent on temperature and frequency. The temperature dependence has been reported on in several of papers, where barium titanate was prepared by different types of synthesis showing in all the cases discontinuities at the onset of the transitions [12, 87, 88]. As the BaTiO 3 is cooled below the Curie temperature, tetragonal domains begin to nucleate and at around 10 C the orthorhombic phase appears. The phase transitions of barium titanate are first order transitions, therefore accompanied by hysteresis. 41
48 CHAPTER 4. RESULTS AND DISCUSSION During the heating step a broad signal in the dielectric characterization is found in the range 0-50 C. This effect can be assigned to the adsorbed moisture. Accordingly to other studies it could be a dynamic process of water absorption and desorption [89]. DSC analysis confirms the transitions and heating/cooling cycle dependency. There remains one anomalous peak at about 40 C. This can be treated as a stress induced Curie temperature. It has been demonstrated that hydrostatic compression of BaTiO 3 favours the smaller volume phase. The cubic phase cell has a smaller volume so it results stabilized at room temperature [90]. In powder sample this might be not so effective allowing the crystallographic compression of a fraction of particles. Figure 4.1: Comparison of two characterizations inherent to barium titanate phase transition. The coloured curves represent the permittivity and the black one DSC signal, both as a function of temperature. The permittivity curves are taken at various frequencies. Dashed lines represent heating step, whereas solid lines represents cooling step. XRD spectra are compatible with that of tetragonal barium titanate (JCPDS # ) [86]. The peaks at 45.1 and 45.6 are those typical of tetragonal structure. Smaller barium titanate particles having cubic structure show a single peak assigned to the crystallographic plane (200) [85,91,92]. Figure 4.2: XRD spectrum of raw barium titanate powder. 42
49 4.2. CRYSTALLIZATION OF PVDF FT-IR spectrum show two broad and intense signal in the range cm 1 (not reported). This technique usually is not used for phase identification of barium titanate. In literature it has been find out only one work, published in 1956, where barium titanate phase discrimination was performed by FT-IR [11]. 4.2 Crystallization of PVDF As stated in Section 1.2.2, piezoelectric properties of PVDF can be measured only in β-phase. Several attempt have been done in literature to obtain this phase, but some papers are not completely reliable. The most commonly used technique for the phase identification of PVDF is Infrared spectroscopy. Lanceros- Mendez et al. [93] tried to bring order by collecting all the signals of PVDF from different references. Still they fall in the mistake not to take into account γ-phase. Indeed the most common mistake concerning IR identification of PVDF is not to consider that, despite α-phase can be easily recognized, it is very difficult to distinguish β- and γ-phase because their signals are very similar. The only signals that can be unambiguously used to distinguish the two forms are at about 1234 cm 1 for γ-phase and 1279 cm 1 for β-phase [32,34,36,45,47,77]. Another slight difference lays in the intensity of the peak at 839 cm 1, which can be found in the spectra of both the phases, but it is more intense in the β-phase. In the greatest part of the works, spectra cut in the region cm 1 are shown [30,33,35,37,43,48,93 96], but neglecting the region cm 1 the identification of β- rather than γ-phase becomes uncertain. In Table 4.1 the characteristic bands of PVDF are collected. Being interested in piezoelectric effect, one of the first steps of this work concerned the preparation of PVDF crystallized in β-phase. According to the procedure chosen for the preparation of composites, crystallization behavior of PVDF was systematically investigated. Solutions of PVDF in DMSO at 10 and 20 wt% were prepared and cast on glass slides, then put in a chamber for 24 hours. It is widely accepted in literature that casting of PVDF from solution in polar solvents promotes the formation of the polar β-phase. It depends basically on the evaporation rates of the solvent during crystallization. Low evaporation rates favour nucleation and growth of the thermodynamically stable β-phase, whereas high evaporation rates yield the metastable α-phase [33]. Figure 4.3a show the films cast at different temperatures. Opacity is a common characteristic for all the samples. Opacity in polymers is usually due to the dimension of crystallites: the smaller the crystallites the more important the scattering of the light, the more evident the opacity. In the case of solvent cast materials another reason is that the solvent, evaporating, digs paths in the polymer. Depending on the rheological behavior of the material, a very defective, even membrane-like, films may be obtained. In Figure 4.3b ATR spectra are reported. Because of the evaporation rate changes at different depths of the material, spectra were collected on both sides of the film, obtaining similar spectra. Although lots of papers assert that β-phase can be obtained via solvent casting with polar solvents, in almost all the conditions γ-phase was obtained. Despite, as stated before, IR spectra interpretation in literature are sometimes ambiguous, our results are not enough to state that solvent casting leads necessarily to γ-phase. Polymers are very complex systems so that different raw materials may, in principle, imply to very different behaviors. Crystallization, 43
50 CHAPTER 4. RESULTS AND DISCUSSION Table 4.1: Characteristic bands in PVDF FTIR spectrum [77,93]. Wavenumber [cm 1 ] Group Vibration Phase 3016 CH 2 Symmetric stretching 2978 CH 2 Asymmetric stretching In-plane bending 1453 CH 2 or scissoring Out-of-plane bending 1335 CH 2 (wagging or twisting) 1279 β-phase 1234 γ-phase CH 2 rocking and CF 2 β- and γ-phase 840 CH 2, CH 2 asymmetric stretching (more intense in β-) 763 In-plane bending or rocking α-phase 745 In-plane bending β- and γ-phase 677 or rocking Presence of head-to-head tail-to-tail defects 615 CF 2, CCC CF2 bending and CCC skeletal vibration α-phase 510 CF 2 Bending β- and γ-phase 490 CF 2 Bending and wagging α-phase 445 β-phase for instance, can be dramatically affected by molecular weight, defects, branching and terminal groups [97]. Table 4.2: Characteristic peaks in PVDF XRD spectrum [32,36]. 2θ Crystallographic plane Phase 17.6 (100) α 18.4 (020) α 19.9 (110) α 20.3 (101) γ 20.7 (200) β 20.8 (110) β 26.6 (021) α 39.5 (041) (132) γ In Figure 4.3c collected diffractograms are reported. XRD interpretation is controversial as well. The profile typical for γ- and β-phase can be easily confused, because of the most intense reflections are very near: about 20.3 for γ- and 20.7 for β. To discriminate properly the two phases it should be taken into account the peak at about 40, which is typical of γ-phase. Film obtained via solvent casting technique and hot pressed at a temperature above the melting point of the polymer is fully crystallized in α-phase. All the reflection signals 44
![4.2. CRYSTALLIZATION OF PVDF are collected in Table 4.2. In the confusion concerning the possible interpretations of PVDF phase characterizations, some order is brought by Satapathy et al. [32].](/docs-images/72/66823441/images/51-0.jpg "Once considered full spectra, for both XRD and FTIR, the identification is no more ambiguous.")
51 4.2. CRYSTALLIZATION OF PVDF are collected in Table 4.2. In the confusion concerning the possible interpretations of PVDF phase characterizations, some order is brought by Satapathy et al. [32]. Once considered full spectra, for both XRD and FTIR, the identification is no more ambiguous. As outlined by their work, PVDF dissolved in DMSO crystallizes in γ-phase if the temperature of the solution is higher than 50 C when cast, for crystallization at room temperature. At such a temperature the viscosity of the PVDF solution is high so that the thermal energy is not sufficient to rotate the CF 2 group. Increasing the temperature the viscosity of the solution decreases and the total energy is enough to rotate the dipoles leading to a cooperative motion, resulting in obtaining the two polar phases (in this case γ-phase). Similarly in this work the solution of PVDF was prepared at a temperature of about 60 but we preferred to crystallize the polymer at high temperatures in order to evaporate as much solvent as possible. (a) Picture of PVDF cast at 60 C, 70 C, 80 C, 90 C, 100 C from a 20 wt% solution in DMSO. (b) ATR spectra of PVDF in DMSO cast at different temperatures. Solid lines are related to 10 wt% solution, dotted lines to 20 wt%. (c) XRD diffrattogram of films cast from 20 wt% solution of PVDF in DMSO along with hot pressed film. Figure 4.3: Preliminary study on PVDF crystallization. Differential scanning calorimetry can be hardly used for the phase identification in PVDF. Melting peaks of the different forms, in fact, occurs at temperature that are very close, and also the peak shape can be very similar. Furthermore PVDFs from different producers can show slight differences in melting temperature. The importance of this technique for PVDF is to give an indication of the crystalline fraction which, in case of β-phase, gives an idea of the portion of the 45
52 CHAPTER 4. RESULTS AND DISCUSSION polymer that contributes to the piezoelectric response of the composites. (a) 1 heating step (b) Cooling step (c) 2 heating step Figure 4.4: DSC on PVDF samples cast from DMSO solution at 60, 80, 90, and obtained by pressing over the melt point. Melting temperatures of the different phases lay in the range from 168 to 173 C. The lowest value is for α-pvdf being thermodynamically unfavoured. At 60 the peak is curiously narrower than the others. Broader melting peak is usually explained with a broader distribution of the crystallites sizes. Smaller crystallites have a slightly lower melting temperature. Degree of crystallizations, listed in Table 4.3, are slightly higher for solvent cast samples with a maximum for material prepared at 60 C. Due to the arbitrariness inherent to the peak area determination, these values cannot be used to infer that there is a general trend about the degree of crystallization ( ±5% can be considered a reasonable error). On the second heating cycle the melting peak is at 168 C for all the samples and the degree of crystallinity is much more similar to those of melt cast PVDF. Thermal history of the sample is not necessarily erased by heating above the melting temperature. The choice to heat at 230 C, well above the melting temperature, is necessary in order to destroy all the crystal nuclei, as clearly outlined by Judovits [98]. The calculation of crystallization degree was performed according to the Equation 3.3 considering the melting enthalpy of PVDF H 0 m,α = 104.7J/g which is the melting enthalpy for α-phase. Only Gradys and Sajkiewicz [34] have tried to determine the melting enthalpy for β-phase and there is no literature concerning γ-phase. Interestingly 60 C cast PVDF shows a second broad peak at about 60 whose area of the peak is about 22J/g. It disappears completely in the second heating step. This phenomenon is pretty well known among several polymers as 46
53 4.2. CRYSTALLIZATION OF PVDF secondary crystallization and has been extensively studied even for PVDF [99]. PVDF undergoes structural evolution during annealing over a wide range of temperatures. The molecular organization that develops during such annealing is destroyed at slightly higher temperatures. This can be detected by a small endotherm like the one found for the 60 C cast sample. According to Neidhofer, no evidence of dependency of the secondary crystallization on the PVDF phase has been observed. Table 4.3: Crystallinity of PVDF from DMSO casting at different temperatures compared to the hot pressed one. PVDF T M [ C] Crystallinity sample 1 heating 2 heating 1 heating 2 heating 60 C % 36% 80 C % 38% 90 C % 35% Hot press % 35% Considering the conditions used for composite preparation as can be seen in Figure 4.5a DSC analysis on PVDF cast at 100 C and remelted under pressure shows slight differences in melting peaks. On the first heating, solvent cast sample has a melting temperature (around 173 C) higher then remelted sample. Of course the second heating cycle on both the samples shows the same melting peak at about 168 C. Differential scanning calorimetry technique is sensitive to the dimension of crystallites. Slight differences on the onset and/or peak temperature can be found for the same sample with different crystallite dimension. Moreover the width of the peaks is an index of the dispersion of the crystallites dimensions. Cast PVDF melting peak is broader than the remelted one, meaning a less homogeneous distribution of crystallite size. On the second heating cycle peaks have a much similar shape and the same position. Crystallinity lays around 35 % for cast sample and around 30 % for remelted one. (a) Heating steps (b) Cooling step Figure 4.5: DSC on PVDF samples cast from DMSO solution at 100, and obtained by remelting the cast sample via hot press. 47


54 CHAPTER 4. RESULTS AND DISCUSSION 4.3 Characterization of 0-3 composites FESEM morphological characterization In this section will be discussed the microstructure of the composites observed by FESEM characterization. The collection of all the cross section images is shown in Appendix C. FESEM images of PVDF composites (for example, the microstructure reported in Figure C.1), show a relevant difference between solvent cast and hot press samples. The former have a very defective structure with cracks and bubbles that sometimes develop through all the thickness of the materials, as can be clearly seen in Figure 4.6a. The latter show a much more uniform microstructure (4.6b), due to the melting that the polymeric phase undergoes during hot pressing process. (a) PVDF_35v-sc (b) PVDF_35v-hp Figure 4.6: Comparison of PVDF composites cross section in the case of 35 vol% of filler. The upper surface of the solvent cast samples, illustrated in Figure 4.7a, clearly shows the nature of crystallization in spherulite structures. The greatest part of the defects developed during solvent casting are corrected by remelting the sample under pressure. As shown in Figure 4.7b the microstructure is no more globular and the dispersion of the powder appears effective. Of course powder agglomerates cannot be completely avoided, but this kind of samples approximates well enough the morphology of an ideal 0-3 composite material. (a) PVDF_BT(35v)-sc (b) PVDF_BT(50v)-hp Figure 4.7: PVDF-BT composites: FESEM images of the surfaces. Microstructures similar to those of hot pressed PVDF composites have been 48
![4.3. CHARACTERIZATION OF 0-3 COMPOSITES found in literature for different kinds of processing: Melt mixing at 200 C [100] Simple physical mixing of powders followed by hot pressing [101] High energy](/docs-images/72/66823441/images/55-0.jpg "ball milling under cryogenic conditions followed by hot pressing [102] Solvent casting from 1-methyl-2-pyrrolidone (NMP) [103] The difference in the microstructure found in the latter work and in the")

55 4.3. CHARACTERIZATION OF 0-3 COMPOSITES found in literature for different kinds of processing: Melt mixing at 200 C [100] Simple physical mixing of powders followed by hot pressing [101] High energy ball milling under cryogenic conditions followed by hot pressing [102] Solvent casting from 1-methyl-2-pyrrolidone (NMP) [103] The difference in the microstructure found in the latter work and in the present one, both implying solvent casting, may be related to the different viscosity of the solvent and, consequently, of the solution during the evaporation step. Higher viscosity means that the crystallizing material is not compliant with the stresses accompanied by solvent removal, and this is translated in a final defective microstructure. So, in principle, one can expect that NMP solution has a lower viscosity than DMSO one (considering that initial viscosity η NMP = 1.67cP, η DMSO = 2.0cP). Of course this hypothesis should be experimentally confirmed. (a) HeFP_BT50v-sc (b) HeFP_BT50v-hp Figure 4.8: Comparison of HeFP composites cross section in the case of 50 vol% of filler. Section of PVDF-HeFP matrix composites show a different degree of agglomeration depending on the preparation. In solvent cast sample (Figure 4.8a) aggregates of particles can be clearly identified whereas in hot pressed sample (Figure 4.8b) again looks like an almost "ideal" 0-3 composites with isolated particles. Concerning surfaces, solvent cast pristine polymer (Figure 4.9a) shows the globular surface typical of spherulite crystallization that have been already observed in the case of PVDF. On the other hand, surfaces of the composites shown in Figure 4.9b and 4.9c are very different. The distribution of polymer is highly depth depending so that the bottom surface is in a situation of 0-3 composite, while the top one looks like an agglomeration of particles with occasional presence of polymer in some isles. Also in this case these imperfections are recovered after hot press processing which grants an almost ideal morphology (see Appendix C). PVDF-TrFE surface (Figure 4.10a) has a different appearance respect to other polymers. Instead of a globular like morphology the surface is wizened. Such appearance has been found to develop for casting or annealing temperature 49
![CHAPTER 4. RESULTS AND DISCUSSION (a) HeFP-sc (b) HeFP_BT50v-sc bottom surface (c) HeFP_BT50v-sc top surface Figure 4.9: FESEM images of HeFP-BT composites surfaces. over 100 C [104].](/docs-images/72/66823441/images/56-0.jpg "Composites sections are pretty satisfactory in terms of particles dispersion, referring to Figure C.3.")


56 CHAPTER 4. RESULTS AND DISCUSSION (a) HeFP-sc (b) HeFP_BT50v-sc bottom surface (c) HeFP_BT50v-sc top surface Figure 4.9: FESEM images of HeFP-BT composites surfaces. over 100 C [104]. Composites sections are pretty satisfactory in terms of particles dispersion, referring to Figure C.3. Again problems of homogeneity of the composites are detectable by observing the two surfaces of the solvent cast sample (Figure 4.10b and 4.10c), as for HeFP composites. Such a behavior has not been detected for PVDF composites. And again the explanation may live in a matter of viscosity. A too low viscosity can favour the flow down of the polymer solution from the top to the bottom, after casting. In a polymer solution viscosity depends to several factors as molecular weight, branching degree and length, defects. Another explanation could be related to different capability of the polymer solution to act as a dispersant for the ceramic powders. The driving force is the chemical affinity between the solution and particles. In this case the chemical affinity it is not expected to vary between PVDF and its copolymers with barium titanate. This lead to be incline to the hypothesis of a different viscosity effect. Because of processing is not strictly the topic of this thesis, and considering that the morphology has been anyway optimized via hot press method no further investigations were carried on. Nevertheless the suggested interpretations need to be experimentally evaluated. Interestingly, PMMA shows a bottom surface (Figure 4.11c) which is rich in ceramic particles and a top surface that is poorer. Contrary to PVDF and its copolymers. The first explanation is the difference in the density of the polymers. In PMMA, which has a lower density, particles tend to sink faster. Moreover, taking again into account the double hypotheses given before, this can be interpreted a precipitation for gravity that is typical for ceramic particles in a non dispersant media. This hypothesis is supported by considering also the FESEM images of the cross section (Figure 4.11). In the case of 50


57 4.3. CHARACTERIZATION OF 0-3 COMPOSITES (a) TrFE-sc (b) TrFE_BT35v-sc bottom surface (c) TrFE_BT35v-sc top surface Figure 4.10: FESEM images of TrFE-BT composites surfaces. PMMA composites, particles results in aggregates even for remelted samples, demonstrating a poor surface affinity between this polymer and barium titanate Matrices phase identification Phase identification of the different PVDF matrix was obtained through ATR on the samples. As discussed previously this technique is so far the most reliable in order to discriminate the two polar phase, namely β and γ, that have very similar signals in almost all the identification techniques. In Figure 4.12 is reported a comparison among the ATR absorbance spectra of PVDF and its copolymers. As already discussed in Section 4.2 PVDF crystallizes in α-phase when cast from the melt and in γ-phase when cast from solution of most of the polar solvents. Very similar crystallization behavior is found in copolymer with hexa-fluoropropilene. On the other hand, PVDF-TrFE crystallizes in polar β-phase. Concerning PVDF, the fundamental peak for β identification is reported in literature at 1279 cm 1 whereas for trifluorethylene copolymer is recorded at 1288 cm 1. The band at 840 cm 1 results shifted, as well, at about 850 cm 1. The first two signals belong to the CF 2 symmetric stretching with the dipole moments parallel to the polar axis. The 1400 cm 1 band is assigned to the methyl groups wagging vibration with the dipole moment along the polymer chain. To our purpose, being interested in piezoelectric d 33 coefficient, a strong absorption bands at 1288 cm 1 and 850 cm 1 is highly desired. It indicates that the polar axis of the PVDF-TrFE copolymer chain is perpendicular to the substrate and the planar zigzag chains are aligned parallel to the substrate. On the contrary, a strong signal at 1400 cm 1 indicates that 51
 PMMA_BT20v-sc (b) PMMA_BT20v-sc (c) PMMA_BT20v-sc bottom surface (d) PMMA_BT20v-sc top")

![is undesirable for vertical polarization [18].](/docs-images/72/66823441/images/58-2.jpg "In our case it seems that the two different processes did not affect the texture of the polymers. Figure 4.")

58 CHAPTER 4. RESULTS AND DISCUSSION (a) PMMA_BT20v-sc (b) PMMA_BT20v-sc (c) PMMA_BT20v-sc bottom surface (d) PMMA_BT20v-sc top surface Figure 4.11: FESEM images of PMMA-BT composites. the polymer chain is tilted, and a significant number of the molecules are aligned normal to the substrate, which is undesirable for vertical polarization [18]. In our case it seems that the two different processes did not affect the texture of the polymers. Figure 4.12: ATR spectra of PVDF and copolymer. Solid lines represent samples crystallized via solvent casting, while dotted lines represent remelted sample. The presence of barium titanate fillers substantially did not alter the phase of PVDF whatever the preparation technique, as can be observed in the spectra in Figure Signal from 700 cm 1 is due to absorption bands of barium titanate. The only element that need to be outlined is that by increasing the 52
59 4.3. CHARACTERIZATION OF 0-3 COMPOSITES filler content, the shoulder at about 1280 cm 1 increases as well. This signal is attributed to β-phase, so in principle it is possible to assert that the presence of barium titanate particles acts as a nucleant for this phase. Despite it is well known that planar polar structures (such as clays) favour the crystallization in β form [38 42,105,106], the situation can be far more complicated, and the standard characterization that has been performed is not enough to support such an opinion, first of all because ATR technique is a surface characterization technique. (a) PVDF composites prepared via solvent casting. (b) PVDF composites prepared via hot press. Figure 4.13: ATR spectra of PVDF composites prepared with increasing amount of ceramic filler. Figure 4.14, 4.15 show the spectra for copolymers composites. In this case the presence of particles did not modify the profile of absorption spectra concerning the polymer phase. (a) HeFP composites prepared via solvent casting. (b) HeFP composites prepared via hot press. Figure 4.14: ATR spectra of HeFP composites prepared with increasing amount of ceramic filler Thermal behavior of polymeric matrices Thermal behavior of PVDF composites is illustrated in Figure The main difference from the solvent cast to the remelted samples is a slight shift of the melting peak towards lower temperatures. A very small signal can be distinguished at about 130 C corresponding to the Curie temperature of BaTiO 3 (phase transition from paraelectric cubic, stable at high temperature, 53
60 CHAPTER 4. RESULTS AND DISCUSSION (a) TrFE composites prepared via solvent casting. (b) TrFE composites prepared via hot press. Figure 4.15: ATR spectra of TrFE composites prepared with increasing amount of ceramic filler. to ferroelectric tetragonal stable at room temperature). The addition of ceramic powders favour the crystallization of the polymeric matrix against the amorphous fraction, as reported in Table 4.4. PVDF sc hp Pristine 30% 30% 20 vol% 42% 41% 35 vol% 42% 38% 50 vol% 39% 37% Table 4.4: Cristalline fraction in PVDF composites solvent cast at 100 C from DMSO and remelted via hot press. Figure 4.16: DSC heating step of PVDF composites. Solid lines are intended for solvent cast sample, while dotted lines for remelted sample. The samples prepared with HeFP matrix have surprisingly complex DSC curves. The first encountered peak (at about 50 C) vanishes for remelted sample so that it is possible to relate its to the phenomenon of a secondary crystallization, as seen for PVDF. The main melting peak appears, for all the 54
61 4.3. CHARACTERIZATION OF 0-3 COMPOSITES solvent cast sample, doubled. For the remelted material only one peak is found, which in the case of pristine matrix, is clearly correspondent with the first signal of the solvent cast sample. Two interpretation can be proposed: The peaks at lower temperature can be interpreted as a Curie transition, but according to ATR analysis cast samples result to be in fully γ-phase, whereas the melt cast ones result in α-phase so that no Curie transition should be observed. The first peak in solvent cast HeFP can be assigned to a secondary crystallization of polymer (as the peak at 50 C), related to the long solvent casting thermal treatment. For PVDF it has been found that two recrystallization signals can be found if materials were subjected to two different isothermal treatment [99]. Despite this behavior has been found only in this copolymer this is the more reasonable explanation. As a consequence the second peak is due to the melting of γ-phase and is higher than the melting signal found for the hot pressed sample that is related to the α-phase. It is important to outline that this copolymer has lower melting temperature than PVDF. Being around 130 C the melting signal hides the small peak of the Curie temperature of barium titanate. In addition PVDF-HeFP results to have lower degree of crystallinity: from about 15 % for solvent cast to about 10 % hot pressed. Figure 4.17: DSC heating step of HeFP composites. Solid lines are intended for solvent cast sample, while dashed lines for remelted sample. PVDF-TrFE thermograms show clearly two endothermic signals (Figure 4.18). The peak at higher temperature is a melting peak while the other is related to the Curie temperature. In this copolymer the transition para- to ferro-electric phase, by cooling, is below the melting temperature, while in PVDF it has been evaluated to be at around 205 C [107], above the melting temperature. If the copolymer contains a sufficiently high fraction of TrFE, the chain rotation is quite hindered because of electro-steric reasons. Molecular chains cannot accommodate in α-phase TGTG conformation and the polymer crystallizes always in ferroelectric phase from the melt. The crystalline fraction of the polymer is around 20 %, decreasing slightly for remelted samples. 55
62 CHAPTER 4. RESULTS AND DISCUSSION Figure 4.18: DSC heating step of TrFE composites. Solid lines are intended for solvent cast sample, while dashed lines for remelted sample. 4.4 Piezoelectric and dielectric characterization Permittivity measurements Considering the integration of a piezoelectric element in a device, characterization of the dielectric properties is fundamental. In particular piezoelectric coefficient and permittivity are used to determine the piezoelectric voltage coefficient. (a) PVDF-BT composites (b) HeFP-BT composites (c) TrFE-BT composites (d) PMMA-BT composites Figure 4.19: Comparison of the effect of processing on the relative permittivity of pristine matrices and composites. Dashed lines correspond to solvent cast samples, solid lines to hot pressed samples. 56
63 4.4. PIEZOELECTRIC AND DIELECTRIC CHARACTERIZATION In Figure 4.14 relative permittivity ε r is shown for the four different matrices along with their composites. By observing all the cases a trend can be inferred concerning the processing. In fact, solvent cast samples show higher permittivity than the hot pressed ones. Apparently this result is in contrast with previous papers where lower permittivity is found in solvent cast materials [79,108]. This trend can be imputable to the presence of pores and defects, that allows to consider the solvent cast materials as composites with low permittivity inclusions (ε air 1). Also residual solvent has to be considered. DMSO, in particular, has a high boiling point (T b =189 C) so that a considerable quantity is expected to remain in the polymeric matrices. Having a pretty high relative permittivity it is possible for its participation to the overall response. Thermogravimetric analysis could be useful in order to evaluate the presence of residual solvent. Moreover this analyses show that the introduction of barium titanate leads, in all the cases, to an increase in permittivity. The profile of the dependence of permittivity from the frequency is substantially not altered except for an increasing of the slope at lower frequency, as already observed in literature [100]. In a system of such a complexity (solvent cast material involves matrix, filler, solvent, pores) it is extremely difficult to understand a behavior like this, and in literature no systematic studies have been found so far. Based on the observation of FESEM images, it can be stated that there could be a correlation between this anomalous slope and the distribution of filler along the thickness. In fact, the samples showing this peculiar permittivity profile are those with worse particles distribution. This is typical for higher ceramic loads, but also for PMMA based materials which, due to density and/or surface interaction, has a lower capability to disperse BaTiO 3 particles. In fact, for such a matrix, this phenomenon occurs for lower ceramic load (PMMA-BT20vol%-sc) and for hot pressed sample (PMMA-BT35vol%-hp) respect to PVDF and copolymers. As just stated, the system is far to complex and several studies should be perform to understand the phenomenon. Permittivity, along with the loss tangent, was measured as a function of the time after poling. The complete collection of the data is reported in Appendix D. Some interesting behaviors can be outlined: In almost all the cases the poling step leads to a general decrease of permittivity. After some time it seems like it comes back to the unpoled values. The previously noticed anomalous slope of bad dispersed samples is strongly affected both on its relative permittivity and loss factor (see Figures D.1c, D.2g, D.3e, D.3g, D.4c, D.4e, D.4f) PVDF and its composites show a signal at the upper edge of the range of measurement for dielectric loss which is typical for PVDF α a relaxation. It is related to the micro-brownian cooperative motions of the main chain backbone and it is the dielectric manifestation of the glass transition temperature [100] Piezoelectric coefficient Measurements of d 33 coefficient were performed at different times after poling in order to evaluate the ageing of this property. The complete collection of the 57
64 CHAPTER 4. RESULTS AND DISCUSSION measures is reported in Appendix E. (a) As poled (b) 48 hours after poling Figure 4.20: Piezoelectric coefficient as a function of the volume fraction of barium titanate. In Figure 4.20a the piezoelectric response is displayed as a function of the ceramic content. As expected, the coefficient increases with increasing barium titanate content. Pristine TrFE has a negative coefficient subtracting to powder contribution. The interaction between two opposite polarizations was investigated in various papers [ ] where piezoelectric properties was measured from PVDF-TrFE/PZT composites. By varying the poling conditions it is possible to obtain poling of the matrix alone, or parallel and anti-parallel polarization of the system matrix-filler. Since the piezoelectric coefficients of the filler and PVDF- TrFE have opposite signs, the piezoelectric activities of the two phases partially cancel each other when they are polarized in the same direction, as obtained also in this thesis. When the polarizations are parallel the piezoelectric response is enhanced but the there is no more an increase as the ceramic load is increased. Thus this kind of poling is effective for obtaining enhanced piezoelectric response in low ceramic concentration composites. A proposed hypothesis is that after the poling process of the copolymer phase, in opposite direction respect to the filler, charges accumulated at the interfaces are redistributed [109]. In literature solvent cast samples show significantly lower piezoelectric coeffi- 58
65 4.4. PIEZOELECTRIC AND DIELECTRIC CHARACTERIZATION cient [79]. On the contrary, in the present work it has been found values that are at least comparable or, for some samples, even higher. Generally speaking, the obtained values appear to be comparable with those of literature [79,113], even for composites where PZT was used as a filler [108]. A more "quantitative" comparison can hardly be done because of the involved variables are too much, even for raw materials which are chemically equal: Characteristics of the raw polymeric matrix (percentage of the copolymer, branching, molecular weight) Preparation technique and thermal history of the polymer Particle size Particle dispersion Percentage of tetragonality (or whatever active phase) Poling technique and conditions Ageing is an important effect verified in almost all the samples. The value of piezoelectric coefficient, one hour after poling, is significantly lower. In polymeric based composites the viscoelastic behavior of the polymer matrix can be one explanation for the degradation of properties: the aligned domains are literally moved when the stress release occurs in the matrix. Poling reorient the polymeric chains through a field-temperature action. This process can store internal stress in the material that releases it in time leading to a loss of alignment. This theory is not fully convincing. The most evident proof against this hypothesis is the behavior of composites made with TrFE copolymer, that show an almost constant coefficient. The coefficient s values are almost stable after one hour for solvent cast samples and 24 hour for hot press samples (as can be observed in the slopes of ageing curves for PVDF, HeFP, TrFE). The main differences between the two kinds of samples are the presence of solvent and the uniformity of particles distribution. Again, TrFE is useful to exclude one of the options, because of solvent cast pristine TrFE does not show significant ageing, so it is possible to state that solvent has not a significant effect on this behavior. Unfortunately, in literature ageing of the composites is rarely considered and, so far, no systematic studies have been carried out. The presence of defects and interfaces and, generally speaking, the complexity of this kind of system, make this topic changeling from the experimental point of view. As concerning the d 33 coefficient, PMMA performances are really low, but the voltage coefficient is comparable with that of other composites. The reason is the dramatic effect of poling on the relative permittivity (see Appendix D). Inverse piezoelectric characterization was tried on some samples, but not reported. In this case results was not satisfactory. No literature has be found, so far, concerning this kind of characterization applied on 0-3 composite materials. Indeed no butterfly loop was collected. A possible explanation lays on the extremely high compliance of the polymeric matrix. The small deformations on the barium titanate particles are "absorbed" locally by the polymer compliance so that macroscopically the sample does not vary its shape, unless for electrostriction phenomenon. Another reason could be that butterfly loop cannot be observed 59
66 CHAPTER 4. RESULTS AND DISCUSSION because the composite does not undergoes switching of the domains. In this case ferroelectric butterfly cannot be observed. This does not mean that the material is not ferroelectric (as pointed out in a famous critical paper [114]), but simply that the applied field is not enough for the domain switching. A ferroelectric material, theoretically, can have a switching field above the breakdown voltage. Composites studied in this project might belong to this category. 60
67 Chapter 5 Conclusions This thesis has dealt with the preparation and the characterization of piezoelectric 0-3 composite materials. The technological aim is to evaluate a material potentially suitable for the development of a sensitive skin for human robotics. As secondary objectives this material should be cheap (relatively) and easy processable in order to make it possibly adaptable for industrial production. For these reasons, 0-3 composites were prepared and characterized. Raw materials were selected among the most commonly used for piezoelectric applications. PVDF is the most widely used ferroelectric polymer. It was used along with two of its copolymers: PVDF-HeFP, developed to have improved flexibility but no piezoelectricity and PVDF-TrFE, developed to obtain the crystalline piezoelectric phase whatever the process. PMMA was also studied. Barium titanate submicron-powder was chosen as piezo-active filler. Composites were prepared with increasing volume percentages of fillers. Two different processing methods were explored in order to evaluate their effect on the microstructure and the piezoelectric response. Solvent casting is an effective tool for polymers and composites processing allowing, in some cases, a certain control on the crystallization of the polymeric matrix. In fact, in the case of PVDF casting from a polar solvent should favour the crystallization of the piezoelectric β-phase. The main drawback of this technique is the formation of defects and dishomogeneity in powder distribution along with a residual presence of solvent. The second process consists in remelting the material under pressure; this in principle should lead to an almost ideal 0-3 composite. Crystallization of PVDF was studied. Because of literature concerning this material is confused, an extensive bibliographic research was necessary in order to properly characterize this matrix. Piezoelectricic properties was measured via Belincourt press. Poling was performed at a temperature below the melting point of the matrices using conditions similar to those reported in literature. An increase in piezoelectric coefficient was observed as the barium titanate amount increased. Nevertheless all the samples showed a dramatic ageing of this property so that the d 33 coefficient was already reduced one hour after poling. The only exception was obeserved in material prepared with PVDF-TrFE copolymer. For sensitive skin application the studied materials, accordingly to what obtained, are not the best choice. The two main drawbacks affecting the applicability are: 61
68 CHAPTER 5. CONCLUSIONS Ageing in order to integrate a material in a device the properties must be well known and constant in time. According to our experiment in the first 24 hours the material looses the greatest part of the piezoelectric response. Longer ageing time should be evaluated in order to understand the decrease in properties after 48 hours. Fragility Increasing the solid load all the films became fragile. Of course an extreme flexibility is required in order to perform as a skin. From this point of view the best matrix is PVDF-HeFP. Nevertheless from the scientific point of view these materials open a series of questions for future developments. From the technological point of view 0-3 composites are among the most simple materials. FAs concerns the piezoelectric behavior, they are one of the most complex system that can be studied. Summarizing, in a piezoelectric composites prepared via solvent casting, several elements contribute to the overall functional response: Either active or passive matrix contributes for mechanical coupling with particles In the case of semicrystalline polymer, possible different behaviors of the amorphous/crystalline fraction Piezoelectric particles Interfaces Residual solvent Pores Micrustructural defects (aggregates) So far, the physics of such composites in literature has not been explored extensively. The models are empirical and the contribution of the various elements has not been deeply clarified. 62
69 Appendix A Voigt notation In Voigt notation a pair of spatial indices are replaced by a single index. The origin of this notation lays in the symmetry of the Cauchy stress tensor σ ij and the strain tensor x kl. The four rank elastic stiffness tensor c ijkl which bound the two quantities accordingly to Hooke s law is also a symmetric tensor such that σ ij = c ijkl x kl (A.1) c ijkl = c jikl = c ijlk = c jilk (A.2) and for thermodynamic argument there is an additional symmetry for interchange of the indices pairs ij and kl c ijkl = c klij (A.3) This symmetric tensor at least possesses 21 independent coordinates in the case of triclinic crystal system. Considering the point group symmetry, this number is further reduced. For a cubic crystal the number of elastic constants to fully describe the elastic properties is three, while for isotropic bodies two is sufficient [3]. So the symmetry in these tensors and reduction in the number of coordinates have given rise to an abbreviate notation useful to represent this quantities in a matrices. The notation is typical only for piezoelectric and engineering literature. Table A.1: Voigt notation contracted indices ij or kl m or n In Figure A.1 is reported a graphical description of the role of the indices in the most conventional use. 63
70 APPENDIX A. VOIGT NOTATION Figure A.1: Conventional tensor directions for defining the constitutive relations [4]. 64
71 Appendix B Models for permittivity in 0-3 composite materials In this Appendix the expressions of some models for the prediction of dielectric behavior of 0-3 composites are reported. The first are the well known models for series and parallel composites. Rayleigh was developed for a dispersion of homogeneous spheres in a continuum medium. Maxwell-Garnett is suitable for a composite where particles with different sizes are immersed in a isotropic matrix. Both Lichtenecker and Sillars are for spherical dielectric inclusions embedded in an isotropic dielectric medium. Furukawa expression is simply the approximation of Equation B.3 considering that permittivity of a ceramic filler is much higher than the polymeric matrix one. Concerning the second group of models, Bruggeman developed a symmetrical expression so that interchanging the two phases the results of the permittivity remains unvaried. The variation of Maxwell-Garnett was proposed to take into account interaction between inclusions. Böttcher model can be applied for interacting domains but can be applied only for well dispersed particles so that there are no continuous paths of filler trough the material. Kerner model move from the ratio of average electric fields inside each phase, along the direction of the external electric field. Looyenga derived his equation considering an almost random distribution of spherical particles in a medium and the interactions between the spheres. Tinga presented a self-consistent solution for dielectric constant of multiphase mixtures, considering first order interactions between inclusions with an arbitrary shape; Equation B.13 is the particular case of a binary system with spherical inclusions, while Equation B.17 is for ellipsoidal inclusions. Van Beek proposed an extension of Sillars equation taking into account the contribution of depoling field. Bergman derived an expression by calculating the electric field inside and around an ellipsoid embedded in a homogeneous medium, with the applied field being distorted by the inclusion. Rother equation is an upgrade of Lichtenecker s. Jayasundere, Poon and Yamada models have been already discussed in ε = φ (f) ε + (1 φ) (m) ε Series (B.1) ε = φ (f) ε+(1 φ) (m) ε Parallel (B.2) 65
72 APPENDIX B. MODELS FOR PERMITTIVITY IN 0-3 COMPOSITE MATERIALS ε = 2(m) ε+ (f) ε 2φ( (m) ε (f) ε) (m) ε Rayleigh (B.3) 2 (m) ε+ (f) ε+φ( (m) ε (f) ε) [ ε = (m) ε 1+ 3φγ ] M axwell Garnett (B.4) 1 φγ γ = (f) ε (m) ε (f) ε+2 (m) ε ln(ε) = (1 φ)ln( (m) ε)+φln( (f) ε) Lichtenecker (B.5) [ ε = (m) ε 1+ 3φ((f) ε (m) ] ε) 2 (m) ε+ (f) ε Sillars (B.6) ε = 1 2φ 1 φ (m) ε Furukawa (B.7) ε = (f) ε 3(m) ε+2φ( (f) ε (m) ε) 3 (f) ε φ( (f) ε (m) ε) Bruggeman (B.8) ε = (m) ε 1+ 3φγ 1 φγ 2 3 φγln ( 8+γ 8 2γ ) M axwell Garnett (B.9) 3ε (m) ε+2ε (1 φ)+ 3ε φ = 1 Böttcher (B.10) (f) ε+2ε ε = (m) ε(1 φ)+φ (f) εξ (1 φ)+φξ ξ = 3 (m) ε 2 (m) ε+ (f) ε Kerner (B.11) (ε) 1/3 = ( (m) ε) 1/3 (1 φ)+( (m) ε) 1/3 φ Looyenga (B.12) ε (m) ε (m) ε 3( (m) ε (f) ε) = φ 2 (m) ε+ (f) ε φ( (f) ε (m) ε) T inga (B.13) (m) ε(1 φ)+ (f) εγ ε = Jayasundere (1 φ)+γ ( γ = 3(m) εφ (f) ε (m) ) ε 1+3φ 2 (m) ε+ (f) ε 2 (m) ε+ (f) ε (B.14) ε = (m) ε+ φ( (f) ε (m) ε) (f) ε+2 (m) ε φ( (f) ε (f) ε) φ+(1 φ) 3 (m) ε Poon (B.15) 66
73 ε = (m) (m) ε+[n(1 φ)+φ]( (f) ε (m) ε) ε (m) ε+n(1 φ)( (f) ε (m) ε) V an Beek (B.16) ε (m) ε (m) ε (m) ε (f) ε = φ (m) ε+ (f) n( (f) ε (m) ε (m) εφ( (f) ε (m) ε) T inga (B.17) ε = (m) ε+φ (f) (m) ε (f) ε ε (f) ε+n( (m) ε (f) ε) [ ε = (m) n φ( (f) ε (m) ] ε) ε 1+ n (m) ε+( (f) ε (m) ε)(1 φ) ln(ε) = ln( (m) ε)+φ(1 n )ln ( (f) ) ε (m) ε Bergman Y amada Rother (B.18) (B.19) (B.20) 67
74 Appendix C FESEM images In the following the FESEM micrographs for all matrices and composites prepared for this thesis project are reported. This is intended as a complete morphological screening of all the samples prepared. The discussion of the most salient images has been dealt with in the Section
 PVDF-hp")

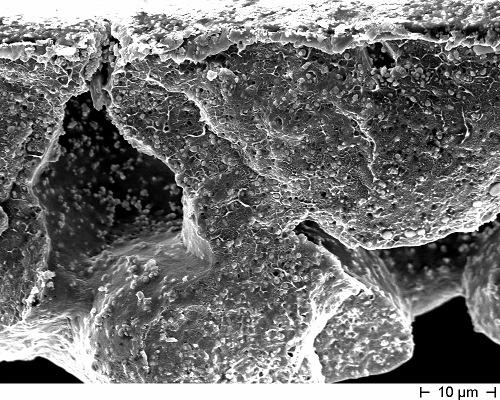
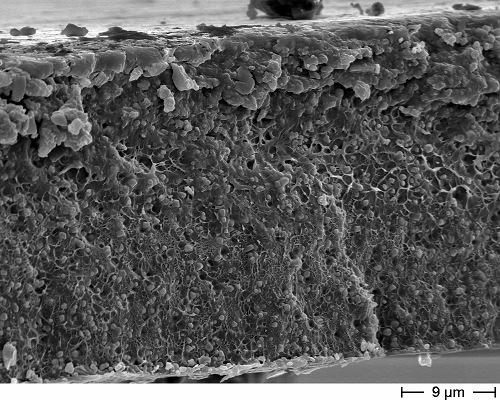


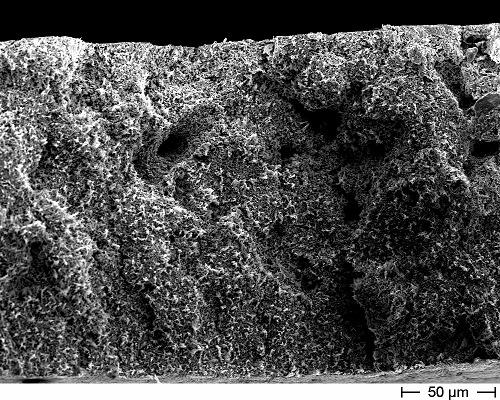
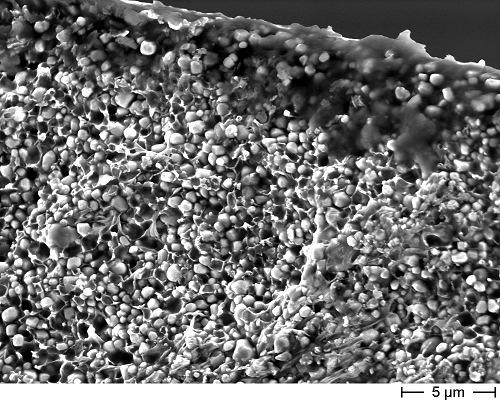
75 (a) PVDF-sc (b) PVDF-hp (c) PVDF_BT(20v)-sc (d) PVDF_BT(20v)-hp (e) PVDF_BT(35v)-sc (f) PVDF_BT(35v)-hp (g) PVDF_BT(50v)-sc (h) PVDF_BT(50v)-hp Figure C.1: PVDF-BT composites: FESEM images of the cross sections. 69

 HeFP-hp")


76 APPENDIX C. FESEM IMAGES (a) HeFP-sc (b) HeFP-hp (c) HeFP_BT(20v)-sc (d) HeFP_BT(20v)-hp (e) HeFP_BT(35v)-sc (f) HeFP_BT(35v)-hp (g) HeFP_BT(50v)-sc (h) HeFP_BT(50v)-hp Figure C.2: HeFP-BT composites: FESEM images of the cross sections. 70
 TrFE-hp")


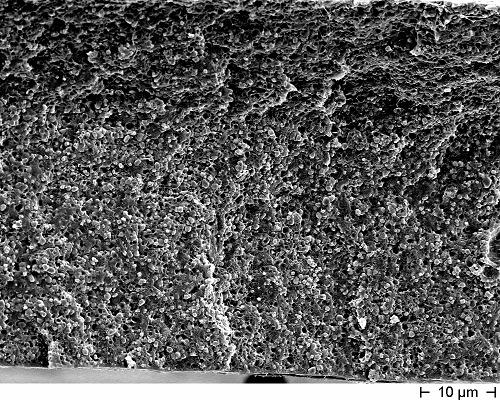


77 (a) TrFE-sc (b) TrFE-hp (c) TrFE_BT(20v)-sc (d) TrFE_BT(20v)-hp (e) TrFE_BT(35v)-sc (f) TrFE_BT(35v)-hp (g) TrFE_BT(50v)-sc (h) TrFE_BT(50v)-hp Figure C.3: TrFE-BT composites: FESEM images of the cross sections. 71
")
")
")
")
")

78 APPENDIX C. FESEM IMAGES (a) PMMA-sc (b) PMMA-hp (c) PMMA_BT(20v)-sc (d) PMMA_BT(20v)-hp (e) PMMA_BT(35v)-sc (f) PMMA_BT(35v)-hp Figure C.4: PMMA-BT composites: FESEM images of the cross sections. 72
Transduction Based on Changes in the Energy Stored in an Electrical Field
 Lecture 7-1 Transduction Based on Changes in the Energy Stored in an Electrical Field - Electrostriction The electrostrictive effect is a quadratic dependence of strain or stress on the polarization P
Classification of Dielectrics & Applications
 Classification of Dielectrics & Applications DIELECTRICS Non-Centro- Symmetric Piezoelectric Centro- Symmetric Pyroelectric Non- Pyroelectric Ferroelectrics Non-Ferroelectric Piezoelectric Effect When
Piezo materials. Actuators Sensors Generators Transducers. Piezoelectric materials may be used to produce e.g.: Piezo materials Ver1404
 Noliac Group develops and manufactures piezoelectric materials based on modified lead zirconate titanate (PZT) of high quality and tailored for custom specifications. Piezoelectric materials may be used
COURSE OUTLINE. Introduction Signals and Noise Filtering Sensors: Piezoelectric Force Sensors. Sensors, Signals and Noise 1
 Sensors, Signals and Noise 1 COURSE OUTLINE Introduction Signals and Noise Filtering Sensors: Piezoelectric Force Sensors Piezoelectric Force Sensors 2 Piezoelectric Effect and Materials Piezoelectric
Ferroelectric materials contain one or more polar axes along which a spontaneous
 Chapter 3 Ferroelectrics 3.1 Definition and properties Ferroelectric materials contain one or more polar axes along which a spontaneous polarization can be developed below the material s Curie temperature.
Roger Johnson Structure and Dynamics: Displacive phase transition Lecture 9
 9.1. Summary In this Lecture we will consider structural phase transitions characterised by atomic displacements, which result in a low temperature structure that is distorted compared to a higher temperature,
Introduction to solid state physics
 PHYS 342/555 Introduction to solid state physics Instructor: Dr. Pengcheng Dai Professor of Physics The University of Tennessee (Room 407A, Nielsen, 974-1509) Chapter 13: Dielectrics and ferroelectrics
I. INTRODUCTION II. SAMPLE PREPARATION JOURNAL OF APPLIED PHYSICS VOLUME 92, NUMBER 5 1 SEPTEMBER
 JOURNAL OF APPLIED PHYSICS VOLUME 92, NUMBER 5 1 SEPTEMBER 2002 Longitudinal and transverse piezoelectric coefficients of lead zirconate titanateõvinylidene fluoride-trifluoroethylene composites with different
Dielectric Properties of Solids
 Dielectric Properties of Solids Electric polarization In an insulator the electrons are so tightly bound that at ordinary temperatures they cannot be dislodged either by thermal vibrations or with ordinary
Dielectric Materials: Properties and Applications
 Dielectric Materials: Properties and Applications Content 1. Dielectrics : Properties 2. Fundamental definitions and Properties of electric dipole 3. Various polarization mechanisms involved in dielectric
Addition 1. Shear Stack Piezoelectric Elements and Shear Effect Basics
 120 Addition 1 Shear Stack Piezoelectric Elements and Shear Effect Basics Introduction The STM scanner built up in this work is a Besocke type scanner (see room temperature STM instrumental chapter). The
Smart elastomers a touch of robotics
 Smart elastomers a touch of robotics Chris Bowen, Vince Coveney, Hamideh Khanbareh, Mengying Xie Department of Mechanical Engineering, University of Bath 30 June 2017 BRL Introduction 1. Fundamentals of
F 10 Electrical Poling of Polymers
 University of Potsdam, Institute of Physics Advanced lab experiments May 28, 2002 F 10 Electrical Poling of Polymers Tutor: Dr. Michael Wegener * Contents 1 Introduction 2 2 Tasks 3 3 Theoretical background
Principles of Active Vibration Control: Piezoelectric materials
 Principles of Active Vibration Control: Piezoelectric materials Introduction: Piezoelectric materials are materials that produce a voltage when stress is applied. Since, this effect also applies in the
ESO 205 Nature and Properties of Materials
 Dielectric Materials Topics to discuss Principles of dielectrics Dielectrics Loss and Breakdown Polarizations Frequency dependence Ferro-, Piezo- and Pyro- electrics ESO 205 Nature and Properties of Materials
The electric field induced strain behavior of single. PZT piezoelectric ceramic fiber
 The electric field induced strain behavior of single PZT piezoelectric ceramic fiber Xiong Yang a, Jing Zhou a,*, Sen Zhang a, Jie Shen b, Jing Tian a, Wen Chen a, Qi Zhang ac a State Key Laboratory of
Materials 218/UCSB: Phase transitions and polar materials
 Materials 218/UCSB: Phase transitions and polar materials Ram Seshadri (seshadri@mrl.ucsb.edu) Background: Intrinsic stability of thermodynamic systems (after H. B. Callen, Thermodynamics and an introduction
Ferroelectrics investigation
 Ferroelectrics investigation. Introduction A dielectric is understood as a material where the electric field induces an electric momentum. Let s consider a vacuum capacitor made of two planar metallic
Structural evolutions in electroactive poly(vdf-co-trfe) copolymers for organic electronics
 copolymers for organic electronics") 10/03/16 New-Orleans-USA Structural evolutions in electroactive poly(vdf-co-tr) copolymers for organic electronics François Bargain, Sylvie Tencé-Girault, Fabrice Domingues Dos Santos, Michel Cloitre Soft
10/03/16 New-Orleans-USA Structural evolutions in electroactive poly(vdf-co-tr) copolymers for organic electronics François Bargain, Sylvie Tencé-Girault, Fabrice Domingues Dos Santos, Michel Cloitre Soft
MSE 201A Thermodynamics and Phase Transformations Fall, 2008 Problem Set No. 7
 MSE 21A Thermodynamics and Phase Transformations Fall, 28 Problem Set No. 7 Problem 1: (a) Show that if the point group of a material contains 2 perpendicular 2-fold axes then a second-order tensor property
PIEZOELECTRIC TECHNOLOGY PRIMER
 PIEZOELECTRIC TECHNOLOGY PRIMER James R. Phillips Sr. Member of Technical Staff CTS Wireless Components 4800 Alameda Blvd. N.E. Albuquerque, New Mexico 87113 Piezoelectricity The piezoelectric effect is
MME 467: Ceramics for Advanced Applications
 MME 467: Ceramics for Advanced Applications Lecture 26 Dielectric Properties of Ceramic Materials 2 1. Barsoum, Fundamental Ceramics, McGraw-Hill, 2000, pp.513 543 2. Richerson, Modern Ceramic Engineering,
Electrical Properties
 Electrical Properties Electrical Conduction R Ohm s law V = IR I l Area, A V where I is current (Ampere), V is voltage (Volts) and R is the resistance (Ohms or ) of the conductor Resistivity Resistivity,
Condensed Matter A Week 2: Crystal structure (II)
") QUEEN MARY, UNIVERSITY OF LONDON SCHOOL OF PHYSICS AND ASTRONOMY Condensed Matter A Week : Crystal structure (II) References for crystal structure: Dove chapters 3; Sidebottom chapter. Last week we learnt
QUEEN MARY, UNIVERSITY OF LONDON SCHOOL OF PHYSICS AND ASTRONOMY Condensed Matter A Week : Crystal structure (II) References for crystal structure: Dove chapters 3; Sidebottom chapter. Last week we learnt
ELECTRONICS DEVICES AND MATERIALS
 2-2-2 ELECTRONICS DEVICES AND MATERIALS Atsunori KAMEGAWA SYLLABUS! Introduction to materials structure and dielectric physics (04/27)! Ferroelectricity involved in structural phase transitions (05/25)
ME 515 Mechatronics. Overview of Computer based Control System
 ME 515 Mechatronics Introduction to Sensors I Asanga Ratnaweera Department of Faculty of Engineering University of Peradeniya Tel: 081239 (3627) Email: asangar@pdn.ac.lk Overview of Computer based Control
The Pennsylvania State University. The Graduate School. College of Engineering ON THE IMPACT OF ELECTRODE GEOMETRY ON THE PIEZOELECTRIC
 The Pennsylvania State University The Graduate School College of Engineering ON THE IMPACT OF ELECTRODE GEOMETRY ON THE PIEZOELECTRIC PROPERTIES OF PZT 5A FIBERS A Thesis in Mechanical Engineering by Travis
Micromechanical modeling and simulation of piezoceramic materials
 Micromechanical modeling and simulation of piezoceramic materials B. Delibas 1, A. Arockia Rajan 1 & W. Seemann 2 1 Workgroup for Machine Dynamics, Technical University of Kaiserslautern, Germany 2 Institut
CHAPTER-4 Dielectric Study
 CHAPTER-4 Dielectric Study Dielectric Study 4.1 Introduction The characterization of dielectric ceramics has received considerable scientific interest because of their enormous applications in electronic
Highly piezoelectric, thermal stable ferroelectrets from cyclic olefin copolymer. Yan Li, Hui Wang, Changchun Zeng ANTEC 2015, Orlando
 Highly piezoelectric, thermal stable ferroelectrets from cyclic olefin copolymer Yan Li, Hui Wang, Changchun Zeng ANTEC 2015, Orlando Content 1. Introduction 2. COC ferroelectret 3. Hybrid COC-PDMS ferroelectret
Ferroelectric Ceramic Technology for Sensors. Jim McIntosh Ceramic Operations Manager PCB Piezotronics
 Ferroelectric Ceramic Technology for Sensors Jim McIntosh Ceramic Operations Manager PCB Piezotronics Overview Ferroelectricity versus Piezoelectricity Historical Background Ferroelectric Ceramic Composition
Chap. 7. Dielectric Materials and Insulation
 Chap. 7. Dielectric Materials and Insulation - The parallel plate capacitor with free space as an insulator: - The electric dipole moment for a pair of opposite changes +Q and -Q separated by a finite
Ferroelectrics and ferroelectric domains
 Ferroelectrics and ferroelectric domains MatjažPanjan mentor: dr. Peter Prelovšek. April 003 Abstract This seminar gives introduction to ferroelectricity, ferroelectric domains and domain walls. There
Ferroelectric Materials
 Ferroelectric Materials The permanent electric dipole moment possessed by all pyroelectric [polar] materials may, in certain cases, be reoriented by the application of an electric field. Such crystals
Piezoelectricity: Basics and applications. Friday Morning Meeting, Technical Talk Petar Jurcevic
 Piezoelectricity: Basics and applications Friday Morning Meeting, 30.07.2010 Technical Talk Petar Jurcevic 1 Overview -A simple molecular model -Mathematical modelling -Some general notes -Overview Motors
5. Building Blocks I: Ferroelectric inorganic micro- and nano(shell) tubes
 tubes") 5. Building Blocks I: Ferroelectric inorganic micro- and nano(shell) tubes 5.1 New candidates for nanoelectronics: ferroelectric nanotubes In this chapter, one of the core elements for a complex building
5. Building Blocks I: Ferroelectric inorganic micro- and nano(shell) tubes 5.1 New candidates for nanoelectronics: ferroelectric nanotubes In this chapter, one of the core elements for a complex building
Phase Transitions in Relaxor Ferroelectrics
 Phase Transitions in Relaxor Ferroelectrics Matthew Delgado December 13, 2005 Abstract This paper covers the properties of relaxor ferroelectrics and considers the transition from the paraelectric state
Modeling Polarization and Capacitance Hysteresis of Ferroelectric Capacitors
 University of Texas at Tyler Scholar Works at UT Tyler Electrical Engineering Theses Electrical Engineering Spring 4-30-2012 Modeling Polarization and Capacitance Hysteresis of Ferroelectric Capacitors
Structure and Dynamics : An Atomic View of Materials
 Structure and Dynamics : An Atomic View of Materials MARTIN T. DOVE Department ofearth Sciences University of Cambridge OXFORD UNIVERSITY PRESS Contents 1 Introduction 1 1.1 Observations 1 1.1.1 Microscopic
Thin Film Bi-based Perovskites for High Energy Density Capacitor Applications
 ..SKELETON.. Thin Film Bi-based Perovskites for High Energy Density Capacitor Applications Colin Shear Advisor: Dr. Brady Gibbons 2010 Table of Contents Chapter 1 Introduction... 1 1.1 Motivation and Objective...
Materials and Devices in Electrical Engineering
 Examination WS 02/03 Materials and Devices in Electrical Engineering Monday 17 th of March, 9:00 11:00, International Department, SR. 203 Notice 1. It is allowed to use any kind of aids (books, scripts,
EAP - ElectroActive Polymers
 A Short Introduction to Robotics Applications AIRLab - Artificial Intelligence and Robotics Lab Politecnico di Milano http://www.airlab.elet.polimi.it/ February 2007 Introduction to EAP Focus: Emulate
User s Manual. STUDY OF DIELECTRIC CONSTANT Model: DEC-01
 User s Manual STUDY OF DIELECTRIC CONSTANT Model: DEC-01 Manufactured by.. Scientific Equipment & Services 358/1, New Adarsh Nagar, Roorkee - 247 667, UA, INDIA Ph.: +91-1332-272852, 277118 Fax: +91-1332-274831
Chapter 3 Chapter 4 Chapter 5
 Preamble In recent years bismuth-based, layer-structured perovskites such as SrBi 2 Nb 2 O 9 (SBN) and SrBi 2 Ta 2 O 9 (SBT) have been investigated extensively, because of their potential use in ferroelectric
INF5490 RF MEMS. LN03: Modeling, design and analysis. Spring 2008, Oddvar Søråsen Department of Informatics, UoO
 INF5490 RF MEMS LN03: Modeling, design and analysis Spring 2008, Oddvar Søråsen Department of Informatics, UoO 1 Today s lecture MEMS functional operation Transducer principles Sensor principles Methods
Synthesis and Ferroelectric Properties of KNO 3 films
 Synthesis and Ferroelectric Properties of KNO 3 films Shahid Ramay and Muhammad Sabieh Anwar LUMS School of Science and Engineering Friday, August, 20, 2010 Potassium nitrate (KNO 3 ) shows ferroelectric
VIBRATION CONTROL OF RECTANGULAR CROSS-PLY FRP PLATES USING PZT MATERIALS
 Journal of Engineering Science and Technology Vol. 12, No. 12 (217) 3398-3411 School of Engineering, Taylor s University VIBRATION CONTROL OF RECTANGULAR CROSS-PLY FRP PLATES USING PZT MATERIALS DILEEP
Electrical material properties
 Electrical material properties U = I R Ohm s law R = ρ (l/a) ρ resistivity l length σ = 1/ρ σ conductivity A area σ = n q μ n conc. of charge carriers q their charge μ their mobility μ depends on T, defects,
Piezoelectric Materials and Devices
 Piezoelectric Materials and Devices Applications in Engineering and Medical Sciences M. S. VIJAYA CRC Press Taylor & Francis Croup Boca Raton London NewYork CRC Press is an imprint of the Taylor & Francis
Joshua Cody Frederick Iowa State University. Iowa State University Capstones, Theses and Dissertations. Graduate Theses and Dissertations
 Graduate Theses and Dissertations Iowa State University Capstones, Theses and Dissertations 2010 Strains and polarization developed during electric field-induced antiferroelectric to ferroelectric phase
ACOUSTIC EMISSION MEASUREMENTS ON PIEZOELECTRIC/ FERROELECTRIC MATERIALS
 ACOUSTIC EMISSION MEASUREMENTS ON PIEZOELECTRIC/ FERROELECTRIC MATERIALS HIDEAKI ABURATANI Kitakyushu National College of Technology, Kokura-minami, Kitakyushu, Fukuoka, Japan Abstract Ferroelectric materials
Institute for Electron Microscopy and Nanoanalysis Graz Centre for Electron Microscopy
 Institute for Electron Microscopy and Nanoanalysis Graz Centre for Electron Microscopy Micromechanics Ass.Prof. Priv.-Doz. DI Dr. Harald Plank a,b a Institute of Electron Microscopy and Nanoanalysis, Graz
Solids / Crystal Structure
 The first crystal analysis proved that in the typical inorganic salt, NaCl, there is no molecular grouping. The inference that the structure consists of alternate ions of sodium and chlorine was an obvious
Piezo Theory: Chapter 1 - Physics & Design
 Piezoelectric effect inverse piezoelectric effect The result of external forces to a piezoelectric material is positive and negative electrical charges at the surface of the material. If electrodes are
Creation of DIPOLE (two poles) (distortion of crystal structure by the small displacement of the ion in direction of electric field)
 (distortion of crystal structure by the small displacement of the ion in direction of electric field)") Dielectricity Dielectric materials: Materials which is generally insulators. Under applied electric field, there is a tiny movement of charge inside the material. Electric field Creation of DIPOLE (two
Dielectricity Dielectric materials: Materials which is generally insulators. Under applied electric field, there is a tiny movement of charge inside the material. Electric field Creation of DIPOLE (two
1. Chapter 1: Introduction
 1. Chapter 1: Introduction Non-volatile memories with ferroelectric capacitor materials are also known as ferroelectric random access memories (FRAMs). Present research focuses on integration of ferroelectric
ELECTROMECHANICAL RESPONSE OF PIEZOELECTRIC FOAMS
 18 TH INTRNATIONAL CONFRNC ON COMPOSIT MATRIALS LCTROMCHANICAL RSPONS OF PIZOLCTRIC FOAMS K.S. Challagulla 1 *, T.A. Venkatesh 1 School of ngineering, Laurentian University, Sudbury, Canada, Department
Intelligent Materials and their applications. Autors: Jana Pintea, Ionut Balan INCDIE ICPE-CA Bucharest, ROMANIA
 Intelligent Materials and their applications Autors: Jana Pintea, Ionut Balan INCDIE ICPE-CA Bucharest, ROMANIA What are intelligent materials? The intelligence of a material is a characteristic difficult
e453.eps 1 Change (or the absolute value) in the measured physical variable 2 Change in the sensor property is translated into low-power-level
 in the measured physical variable 2 Change in the sensor property is translated into low-power-level") 3 Basic Phenomenon in Effect in Sensor Operation Sensors Prof. Dr. M. Zahurul Haq zahurul@me.buet.ac.bd http://teacher.buet.ac.bd/zahurul/ Department of Mechanical Engineering Bangladesh University of
3 Basic Phenomenon in Effect in Sensor Operation Sensors Prof. Dr. M. Zahurul Haq zahurul@me.buet.ac.bd http://teacher.buet.ac.bd/zahurul/ Department of Mechanical Engineering Bangladesh University of
Materials and Devices in Electrical Engineering
 Examination WS 01/02 Materials and Devices in Electrical Engineering Monday 11 th of March, 9:00 to 11:00, SR 203, International Department building It is allowed to use any kind of media (books, scripts,
Outline. 4 Mechanical Sensors Introduction General Mechanical properties Piezoresistivity Piezoresistive Sensors Capacitive sensors Applications
 Sensor devices Outline 4 Mechanical Sensors Introduction General Mechanical properties Piezoresistivity Piezoresistive Sensors Capacitive sensors Applications Introduction Two Major classes of mechanical
ANALYSIS AND NUMERICAL MODELLING OF CERAMIC PIEZOELECTRIC BEAM BEHAVIOR UNDER THE EFFECT OF EXTERNAL SOLICITATIONS
 Third International Conference on Energy, Materials, Applied Energetics and Pollution. ICEMAEP016, October 30-31, 016, Constantine,Algeria. ANALYSIS AND NUMERICAL MODELLING OF CERAMIC PIEZOELECTRIC BEAM
PHASE-FIELD SIMULATION OF DOMAIN STRUCTURE EVOLUTION IN FERROELECTRIC THIN FILMS
 Mat. Res. Soc. Symp. Proc. Vol. 652 2001 Materials Research Society PHASE-FIELD SIMULATION OF DOMAIN STRUCTURE EVOLUTION IN FERROELECTRIC THIN FILMS Y. L. Li, S. Y. Hu, Z. K. Liu, and L. Q. Chen Department
Slide 1. Temperatures Light (Optoelectronics) Magnetic Fields Strain Pressure Displacement and Rotation Acceleration Electronic Sensors
 Magnetic Fields Strain Pressure Displacement and Rotation Acceleration Electronic Sensors") Slide 1 Electronic Sensors Electronic sensors can be designed to detect a variety of quantitative aspects of a given physical system. Such quantities include: Temperatures Light (Optoelectronics) Magnetic
Slide 1 Electronic Sensors Electronic sensors can be designed to detect a variety of quantitative aspects of a given physical system. Such quantities include: Temperatures Light (Optoelectronics) Magnetic
Supplementary Information
 Supplementary Information Large Electrocaloric Effect in Relaxor Ferroelectric and Antiferroelectric Lanthanum Doped Lead Zirconate Titanate Ceramics Biao Lu, Peilian Li, Zhenghua Tang, Yingbang Yao, Xingsen
Mechanical properties of polymers: an overview. Suryasarathi Bose Dept. of Materials Engineering, IISc, Bangalore
 Mechanical properties of polymers: an overview Suryasarathi Bose Dept. of Materials Engineering, IISc, Bangalore UGC-NRCM Summer School on Mechanical Property Characterization- June 2012 Overview of polymer
Electro-shape-memory effect in Mn-doped BaTiO 3 single crystals and in situ observation of the reversible domain switching
 Materials Science and Engineering A 438 440 (2006) 354 359 Electro-shape-memory effect in Mn-doped BaTiO 3 single crystals and in situ observation of the reversible domain switching L.X. Zhang a,b,c,,x.ren
CHAPTER 6 DIELECTRIC AND CONDUCTIVITY STUDIES OF ZIRCONIUM TIN TITANATE (ZST)
") 123 CHAPTER 6 DIELECTRIC AND CONDUCTIVITY STUDIES OF ZIRCONIUM TIN TITANATE (ZST) 6.1 INTRODUCTION We know that zirconium tin titanate ceramics are mostly used in microwave frequency applications. Previous
123 CHAPTER 6 DIELECTRIC AND CONDUCTIVITY STUDIES OF ZIRCONIUM TIN TITANATE (ZST) 6.1 INTRODUCTION We know that zirconium tin titanate ceramics are mostly used in microwave frequency applications. Previous
NDT&E Methods: UT Ultrasound Generation
 CAVITY INSPECTION NDT&E Methods: UT Ultrasound Generation VJ Technologies NDT&E Methods: UT 6. NDT&E: Introduction to Methods 6.1. Ultrasonic Testing: Basics of Elasto-Dynamics 6.2. Ultrasonic Testing:
Piezo Engineering Primer
 . The Direct and Inverse Piezoelectric Effect In 88, while performing experiments with tourmaline, quartz, topaz, cane sugar and Rochelle salt crystals, Pierre and Jacques Curie discovered that when mechanical
Lecture 05 Structure of Ceramics 2 Ref: Barsoum, Fundamentals of Ceramics, Ch03, McGraw-Hill, 2000.
 MME 467 Ceramics for Advanced Applications Lecture 05 Structure of Ceramics 2 Ref: Barsoum, Fundamentals of Ceramics, Ch03, McGraw-Hill, 2000. Prof. A. K. M. Bazlur Rashid Department of MME, BUET, Dhaka
properties Michele Catti Dipartimento di Scienza dei Materiali Università di Milano Bicocca, Italy
 Elastic and piezoelectric tensorial properties Michele Catti Dipartimento di Scienza dei Materiali Università di Milano Bicocca, Italy (catti@mater.unimib.it) 1 Tensorial physical properties of crystals
Active elastomer components based on dielectric elastomers
 Gummi Fasern Kunststoffe, 68, No. 6, 2015, pp. 412 415 Active elastomer components based on dielectric elastomers W. Kaal and S. Herold Fraunhofer Institute for Structural Durability and System Reliability
An Introduction to Polymer Physics
 An Introduction to Polymer Physics David I. Bower Formerly at the University of Leeds (CAMBRIDGE UNIVERSITY PRESS Preface Acknowledgements xii xv 1 Introduction 1 1.1 Polymers and the scope of the book
Polarization. D =e i E=k i e o E =e o E+ P
 Dielectrics Polarization a perfect insulator or a dielectric is the material with no free charge carriers. if an electric field, E, is applied to the insulator no charge flow. However in the presence of
Ferroelectric Materials and Their Applications
 Ferroelectric Materials and Their Applications Yuhuan Xu University of California Los Angeles, CA, USA J» m 1991 NORTH-HOLLAND AMSTERDAM LONDON NEW YORK TOKYO Foreword by L.E. Cross Foreword by S.B. Lang
Piezoelectric Resonators ME 2082
 Piezoelectric Resonators ME 2082 Introduction K T : relative dielectric constant of the material ε o : relative permittivity of free space (8.854*10-12 F/m) h: distance between electrodes (m - material
Modelling of Different MEMS Pressure Sensors using COMSOL Multiphysics
 International Journal of Current Engineering and Technology E-ISSN 2277 4106, P-ISSN 2347 5161 2017 INPRESSCO, All Rights Reserved Available at http://inpressco.com/category/ijcet Research Article Modelling
Physics 9e/Cutnell. correlated to the. College Board AP Physics 2 Course Objectives
 correlated to the College Board AP Physics 2 Course Objectives Big Idea 1: Objects and systems have properties such as mass and charge. Systems may have internal structure. Enduring Understanding 1.A:
PHYSICAL PROPERTIES OF CRYSTALS
 PHYSICAL PROPERTIES OF CRYSTALS THEIR REPRESENTATION TENSORS AND MATRICES BY By J. F. NYE, F.R.S. CLARENDON PRESS OXFORD NOTATION INTRODUCTION xiii xv PART 1. GENERAL PRINCIPLES I. THE GROUNDWORK OF CRYSTAL
Ferroelectricity. Phase transition. Material properties. 4/12/2011 Physics 403 Spring
 Ferroelectricity. Phase transition. Material properties 4/12/211 Physics 43 Spring 211 1 Ferroelectricity. outline Ferroelectricity. Definition Discovery Main properties Phenomenological theory Some materials
SENSOR DEVICES MECHANICAL SENSORS
 SENSOR DEVICES MECHANICAL SENSORS OUTLINE 4 Mechanical Sensors Introduction General mechanical properties Piezoresistivity Piezoresistive sensors Capacitive sensors Applications INTRODUCTION MECHANICAL
Dae Won Ji and Sang-Joo Kim
 Journal of the Korean Ceramic Society Vol. 55, No. 1, pp. 7~73, 2018. https://doi.org/10.4191/kcers.2018.55.1.03 Communication Construction and Application of Experimental Formula for Nonlinear Behavior
Thickness Optimization of a Piezoelectric Converter for Energy Harvesting
 Excerpt from the Proceedings of the COMSOL Conference 29 Milan Thickness Optimization of a Piezoelectric Converter for Energy Harvesting M. Guizzetti* 1, V. Ferrari 1, D. Marioli 1 and T. Zawada 2 1 Dept.
Solids. properties & structure
 Solids properties & structure Determining Crystal Structure crystalline solids have a very regular geometric arrangement of their particles the arrangement of the particles and distances between them is
Chapter 2. Dielectric Theories
 Chapter Dielectric Theories . Dielectric Theories 1.1. Introduction Measurements of dielectric properties of materials is very important because it provide vital information regarding the material characteristics,
Dielectrics 9.1 INTRODUCTION 9.2 DIELECTRIC CONSTANT
 9 Dielectrics 9.1 INTRODUCTION A dielectric is an insulating material in which all the electrons are tightly bound to the nuclei of the atoms and there are no free electrons available for the conduction
NUMERICAL EVALUATION OF A TEFLON BASED PIEZOELECTRIC SENSOR EFFECTIVITY FOR THE MONITORING OF EARLY AGE COCRETE STRENGTHING
 NUMERICAL EVALUATION OF A TEFLON BASED PIEZOELECTRIC SENSOR EFFECTIVITY FOR THE MONITORING OF EARLY AGE COCRETE STRENGTHING Evangelos V. Liarakos Postdoctoral researcher School of Architecture, Technical
Material parameters for electrostriction
 Material parameters for electrostriction Yuri M. Shkel and Daniel J. Klingenberg a) Department of Chemical Engineering and Rheology Research Center, University of Wisconsin, Madison, Wisconsin 53706 Received
Materials and Devices in Electrical Engineering
 Solution for Examination WS 0/0 Materials and Devices in Electrical Engineering Monday 17 th of March, 9:00 11:00, International Department, SR. 0 Notice 1. It is allowed to use any kind of aids (books,
Electrostriction of lead zirconate titanate/polyurethane composites
 JOURNAL OF APPLIED PHYSICS 97, 104112 2005 Electrostriction of lead zirconate titanate/polyurethane composites K. S. Lam, Y. Zhou, Y. W. Wong, a and F. G. Shin Department of Applied Physics, The Hong Kong
SENSORS and TRANSDUCERS
 SENSORS and TRANSDUCERS Tadeusz Stepinski, Signaler och system The Mechanical Energy Domain Physics Surface acoustic waves Silicon microresonators Variable resistance sensors Piezoelectric sensors Capacitive
AP PHYSICS 2 FRAMEWORKS
 1 AP PHYSICS 2 FRAMEWORKS Big Ideas Essential Knowledge Science Practices Enduring Knowledge Learning Objectives ELECTRIC FORCE, FIELD AND POTENTIAL Static Electricity; Electric Charge and its Conservation
Piezoactuators. Jiří Tůma
 Piezoactuators Jiří Tůma 1 Domain Piezoelectric effect Direct piezoelectric effect discovered the brothers Pierre and Jacques Curie. They found that certain crystalline materials (ceramics) having the
Monte Carlo Simulation of Ferroelectric Domain Structure: Electrostatic and Elastic Strain Energy Contributions
 Monte Carlo Simulation of Ferroelectric Domain Structure: Electrostatic and Elastic Strain Energy Contributions B.G. Potter, Jr., B.A. Tuttle, and V. Tikare Sandia National Laboratories Albuquerque, NM
NON-CONVENTIONAL ENERGY SOURCE USING PIEZOELECTRIC MATERIALS
 NON-CONVENTIONAL ENERGY SOURCE USING PIEZOELECTRIC MATERIALS Chetan Kumbhar 1,Vishal Lonkar 2, Suhas Labade 3, Abhijeet Khaire 4, Ass.Prof.Swapnil S. Patil 5 1,2,3,4,5 Deparment of Mechanical Engineering,
Magneto-Mechanical Modeling and Simulation of MEMS Sensors Based on Electroactive Polymers
 Magneto-Mechanical Modeling and Simulation of MEMS Sensors Based on Electroactive Polymers F.J.O. RODRIGUES, L.M. GONÇALVES, J.H. CORREIA, P.M. MENDES University of Minho, Dept. Industrial Electronics,
FINITE ELEMENT MODELLING OF COMPOSITES USING PIEZOELECTRIC MATERIAL
 International Journal of Engineering Research and General Science Volume 3, Issue 4, July-August, 2015 FINITE ELEMENT MODELLING OF COMPOSITES USING PIEZOELECTRIC MATERIAL K.TEJASWINI, tejaswinikota11@gmail.com.,
AP PHYSICS 2 Essential Knowledge and Learning Objectives Arranged Topically
 with AP PHYSICS 2 Essential Knowledge and Learning Objectives Arranged Topically o Big Ideas o Enduring Understandings o Essential Knowledges o Learning Objectives o Science Practices o Correlation to
Finite Element Modeling of Ultrasonic Transducers for Polymer Characterization
 Excerpt from the Proceedings of the COMSOL Conference 2009 Milan Finite Element Modeling of Ultrasonic Transducers for Polymer Characterization Serena De Paolis *, Francesca Lionetto and Alfonso Maffezzoli