Sections OPIM 303, Managerial Statistics H Guy Williams, 2006
|
|
|
- Erik Cobb
- 5 years ago
- Views:
Transcription


1 Sections The three major properties which describe a set of data: Central Tendency Variation Shape OPIM 303 Lecture 3 Page 1
2 Most sets of data show a distinct tendency to group or cluster around a central point. Thus, for any particular set of data, a single typical value can be used to describe the entire data set. Three measures of central tendency include arithmetic mean, median, and mode. We will not be using the mode or geometric mean. Mode The mode is the value in a set of data which appears most frequently. The mode is unaffected by extreme values (outliers). The mode is only used for descriptive purposes because it is more variable than other measures of central tendency. Some data sets will not contain a mode. The property n ( Xi - X) = 0 is one of the important reasons that the arithmetic mean is used as i 1 the most common measure of central tendency. Here we are looking at numerical data. These tools are not useful for categorical data which is typically limited to percentage of total. Central tendency is asking what is the typical value. OPIM 303 Lecture 3 Page 2
.")
3 Mean Sum the observed numerical values of the variable in the data set and divide by the total number of observations. The calculation of the mean is based on all observations in the set of data. No other measure of central tendency has this feature. However, this can also be a problem when the data contains an extreme value of values (outliers). When summarizing data which contains extreme values report the median or the median and the mean. (n = number of observations) n Xi X1 X2 X i=1 X = n = n n OPIM 303 Lecture 3 Page 3

4 Outlier shifts the mean Mean has the problem of being sensitive to outliers. OPIM 303 Lecture 3 Page 4
.")
5 Median The median is the middle value in an ordered array of data. When there are an odd number of data points half the observations will be larger in value than the median and half will be smaller. For data sets where the total number of observations is even the median will be the point midway between the two middle data points. (The median is the value in the center of the ordered data set). The Median is not sensitive to outliers and is therefore a more useful, and more robust, measure. OPIM 303 Lecture 3 Page 5

6 Of these measures interquartile range and standard deviation are most useful for our purposes. OPIM 303 Lecture 3 Page 6


7 #1 #2 These two sets above have the same x axis scale. We can see that set 2 varies more. #3 #4 Sets 3 & 4 contain the same data but are shifted on the x axis. This does not effect the variance OPIM 303 Lecture 3 Page 7

8 Greater spread on this end but both sets have the same range. Range: the numerical difference between the largest value and the smallest value in a data set. Range is not a very good measure of variance. It ignores how the data is distributed. It s simple, but not very useful. Fund 5-Yr Return Putnam OTC Emerging Growth A -6.1 Amer. Century GiftTrust Inv PBHG Growth -1.2 Invesco Growth Inv -0.7 Consulting Group Small Cap Growth 4.3 AXP Stategy Aggressive A 5.5 Fidelity Aggressive Growth 5.9 Janus Enterprise 6.5 John Hancock Small Cap Growth A 7.6 Berger Small Company Growth Inv 8.3 MS Mid Cap Equity Tr. B 9.6 Janus Venture 9.8 Van Kampen Aggressive Growth A 12.9 Rydex OTC Inv 13.1 RS Emerging Growth A 18.5 Mean = 6.08 Median = 6.5 Mode = #N/A Very High Risk Funds Dot Scale Diagram Values Mean Median 1st Quartile 3rd Quartile +/- 1 Std. Dev. +/- 2 Std. Dev. +/- 3 Std. Dev. OPIM 303 Lecture 3 Page 8

9 Q 0 Q 4 Excel adds a Q0 and a Q4. Quartiles Quartiles are the most widely used measures of noncentral location and are used to describe properties of large sets of numerical data. The quartiles are descriptive measures which split the ordered data into four quarters. First Quartile, Q 1 The first quartile is a value for which 25% of the observations are smaller and 75% are larger. (n is the total number of observations) n + 1 Q 1 = ordered observations 4 Third Quartile, Q3 The third quartile is a value for which 75% of the observations are smaller and 25% are larger. 3(n + 1) Q 3 = ordered observation 4 Rules for Quartiles: 1. If positioning point is an integer, the value at that positioning point is included in the quartile. 2. If positioning point is half way between two integers, the average of the corresponding observation is selected. 3. If the positioning point is neither an integer or half way between two integers, a simple rule is to round off to the nearest integer and select the numerical value of the corresponding observation. OPIM 303 Lecture 3 Page 9

10 Interquartile Range (aka: midspread, middle fifty) Interquartile Range = Q 3 Q 1 Interquartile range is a resistance measure, i.e., cannot be influenced by outliers. Tells us how spread out the middle 50% of data are. Outliers are not considered, Very robust. OPIM 303 Lecture 3 Page 10
 2 i=1 S = n 1 Variance is very sensitive to outliers because the magnitude of the deviation from the mean is squared! Remember also that the units are squared.")
11 Variance and Standard Deviation take into account how all the values in the data are distributed. These measures evaluate how the values fluctuate about the mean. Sample Variance n 2 (X i - X ) 2 i=1 S = n 1 Variance is very sensitive to outliers because the magnitude of the deviation from the mean is squared! Remember also that the units are squared. If the x axis were dollars the units of the variance would be dollars squared. Sample Standard Deviation S = n i=1 (X - X ) i n 1 2 The variance and standard deviation measure the average scatter about the mean. For almost all sets of data, the majority of the observed values lie within an interval of plus and minus one standard deviation above and below the arithmetic mean. Knowledge of the mean and standard deviation usually helps define where at least the majority of the data values are clustering. In the standard deviation the units are back to normal, more intuitive. n-1 refers to the degrees of freedom. In this case one degree has been used when we calculated the mean. OPIM 303 Lecture 3 Page 11


12 These three data sets all have the same mean. They all have different standard deviations because the data are distributed differently. Sets A and C have pretty much the same range but in the case of set C the clumped data at the end points increases the standard deviation further. OPIM 303 Lecture 3 Page 12
 CV S = *100% X Coefficient of Variance can be useful for comparing two sets of data which have different units or all together different ranges.")
13 Coefficient of Variance The coefficient of variance measures the scatter in the data relative to the mean. It is a relative measure and is always expressed in percentage. (No Units) CV S = *100% X Coefficient of Variance can be useful for comparing two sets of data which have different units or all together different ranges. For instance, if comparing the variation in height among humans to the variation in height among squirrels it will be easier to compare the coefficients of variance. OPIM 303 Lecture 3 Page 13
14 Coefficient of Variation Example OPIM 303 Lecture 3 Page 14
15 OPIM 303 Lecture 3 Page 15
16 (The 5 Measures) The vertical line drawn within the box represents the median. The box contains the middle 50% of observations in the distribution. The whiskers enclose the upper and lower remaining 50% of the data. The box-and-whisker plot is a good tool to graphically display the characteristics of a data set. Left-Skewed Mean < Median Symmetric Mean = Median Right-Skewed Median < Mean Left-Skewed Symmetric Right-Skewed Q1 Q2 Q3 Q1 Q2 Q3 Q1 Q2 Q3 OPIM 303 Lecture 3 Page 16

17 Five-Number Summary X smallest Q 1 Median Q 3 Xlargest Symmetrical Data If the data are perfectly symmetrical, the relationship among the various measures in the fivenumber summary is expressed as: The distance from X smallest to the median equals the distance from the median to X largest. The distance from X smallest to the Q 1 equals the distance from the Q 3 to X largest. The diatance from Q 1 to the median equals the distance from the median to Q 3. Asymmetrical Data In Right skewed data the distance from the median to X largest is greater than the distance from X smallest to the median. In Right skewed distributions the distance from Q3 to X largest is greater than the distance from X smallest to the Q1. In Left skewed distributions the distance from X smallest to the median is greater than the distance from the median to X largest. In Left skewed distributions the distance from X smallest to Q1 is greater than the distance from Q3 to X largest. Naming conventions for left and right skewed are counter intuitive. Right Skewed distributions contain most of their data points to the left (long right whisker) and Left Skewed distributions contain most of their data points to the right (long left whisker). Median X minimum Q1 (Q2) Q3 25% 25% 25% 25% X maximum Interquartile range = = 27 OPIM 303 Lecture 3 Page 17

18 The covariance measure is unable to measure the relative strength of the linear relationship between the two variables. To do this we use the coefficient of correlation. OPIM 303 Lecture 3 Page 18

19 aka: Little r No Units The covariance and coefficient of correlation are two numerical descriptive measures for measuring the strength of the linear relationship between two variables. The values of the coefficient of correlation range from -1 for perfect negative correlation to +1 for perfect positive correlation. When the coefficient of correlation equals 0 there is no tendency for one variable to vary in relation to the other variable. Perfect means that if all points where plotted on a scatter diagram the points could all be connected with a straight line. Coefficient of Correlation is denoted by Y Y Y Y X X r = -1 r = -.6 r = 0 Y Y X r = +1 X r = +.3 X r = 0 X OPIM 303 Lecture 3 Page 19

 3.5 3 2.5 2 1.5 1 0.")
20 Graphic on previous page Correlation relationships are described as tendencies and not as cause-and-effect. Correlation alone cannot prove that there is a causation effect. Correlation Coefficient only measures the strength of the linear relationship. EXCEL: CORREL(X values cell range, Y values cell range) Non Linear Relationship Calculating a Correlation Coefficient on this data would give something close to zero. OPIM 303 Lecture 3 Page 20

21 OPIM 303 Lecture 3 Page 21

22 One or the other. Collectively Exhaustive: the set includes all possible outcomes. OPIM 303 Lecture 3 Page 22

23 a priori classical probability: the probability of success is based on prior knowledge of the process involved. We will use this method. empirical classical probability: the outcomes are based on observed data, not on prior knowledge of a process. Subjective probability: refers to the chance of occurrence assigned to an event by a particular individual. This is a meaningless measure. Examples: P(coin toss is heads) = 1/2 P(die roll is 6) = 1/6 P(2 kids with 1 boy and 1 girl) We are not looking at birth order so some outcomes are more likely then others. These events are not equally likely. 1st Kid 2nd Kid First birth has 50/50 chance: Boy Boy/Boy or Boy/Girl P(boy) = ½ P(girl)=1/2 Girl Girl/Boy or Girl/Girl Every birth probability is 50%. This is a-priori because we know the probabilities of boy or girl beforehand. From the 2-kid table we can calculate the probability (any birth order): P(1 Boy and 1 Girl) = 2/4 OPIM 303 Lecture 3 Page 23

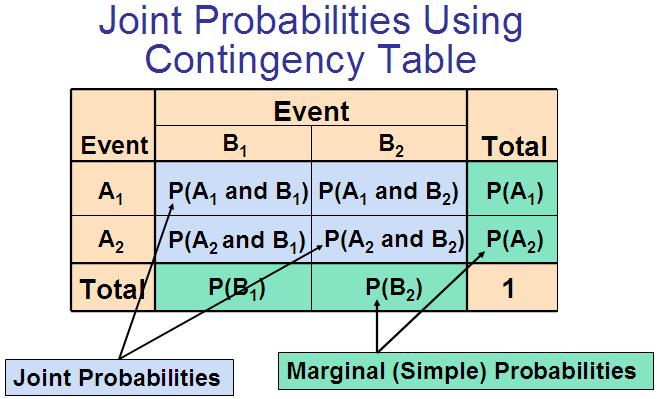
24 Sample Space: the set of all possible outcomes. The manner in which the sample space is subdivided depends on the types of probabilities that are to be determined. Complement: the complement of event A includes all events that are not part of event A. Joint Event: a joint event is an event which has two or more characteristics. Simple Probability: refers to the probability of occurrence of a simple event. Marginal Probability: the total number of successes can be obtained from the appropriate margin of the contingency table. The marginal probability of an event consist of a set of joint probabilities. Joint Probability: refers to a probability involving two or more events. Example: given the below table compute the probability that a randomly selected household purchased a HDTV and a DVD player. Purchased DVD Purchased TV Yes No Total HDTV Not HDTV Total Table 4.2 P(HDTV) = Number HDTV sets purchased Total number TV's purchased 38 = = 12.7% 300 OPIM 303 Lecture 3 Page 24

25 Empirical Probability: the two events are not equally likely. Subjective Estimate: the probability is assigned subjectively by a person. Of no value. OPIM 303 Lecture 3 Page 25

26 OPIM 303 Lecture 3 Page 26
 + P(<=2) P(odd AND <= 2) 3/6 + 2/6-1/6 = 4/6 = 2/3 Key is that you have to subtract off the AND probability of you will be counting the possibility of that occurrence twice.")
27 Must subtract the probability of both events or we will have counted twice. Example: Probability a roll of a dice is odd OR <= 2? P(odd) + P(<=2) P(odd AND <= 2) 3/6 + 2/6-1/6 = 4/6 = 2/3 Key is that you have to subtract off the AND probability of you will be counting the possibility of that occurrence twice. Example: P(die roll is 1) = 1/6 P(die roll is odd) = 3/6 P(die roll is 1 OR odd) = 3/6 Not just the sum of 1/6 and 3/6, that would double count the probability that the roll is 1. Solution: P(roll is 1 OR odd) = 1/6 + 3/6-1/6 = 3/6 = 1/2 OPIM 303 Lecture 3 Page 27
 has multiple ways of being realized. We must look at all possible outcomes of a two (fair) dice roll.")
 = 3/36 Example: Roll two die, what is the probability that the sum is 7?")
28 Example: Roll two die, what is the probability that the sum is 10? Possible outcomes: 2, 3, 4, 5, 6, 7, 8, 9, 10, 11, 12. THIS IS WRONG! The probability is not 1/11 because these events are not equally likely. Each sum (except 2) has multiple ways of being realized. We must look at all possible outcomes of a two (fair) dice roll. Then we calculate how many of the possible outcomes sum to 10. There are 36 possible outcomes, 3 combinations sum to 10. P(2 rolls AND sum is 10) = 3/36 Example: Roll two die, what is the probability that the sum is 7? P(2 rolls AND sum is 7) = 6/36 = 1/6 Example: P(a roll of a dice is <= 2 OR => 4) = 2/6 + 3/6 = 5/6 This case is mutually exclusive, both cannot happen in the same event. Example: Event A; outcome is <= 5, P(A) = 5/6 Event B; outcome is even, P(B) = 3/6 These two events are collectively exhaustive, one or the other must occur in a given trial. They are NOT mutually exclusive because both can occur in the same trial. P(A or B) = P(A) + P(B) P(A and B) = 5/6 + 3/6-2/6 = 6/6 = 1 Must know the difference between Collectively Exhaustive and Mutually Exclusive and be able to test the problem for these conditions. OPIM 303 Lecture 3 Page 28

29 Sample Space, all possible outcomes Do not count this region twice. Mutually Exclusive: both events cannot occur in the same trial, one or the other only. Plan To Actually Purchased Purchase Yes No Total Yes No Total Table 4.1 P(planned to purchase OR actually purchased) = P(planned to purchase) + P(actually purchased) - P(planned to purchase AND actually purchased) In the Mutually Exclusive case the joint probability is zero. Example: Type of = % Number of Purchase Respondents In store 183 Internet 87 Mail Order 30 Total 300 Table 4.3 P(Internet OR mail order) = P(Internet) + P(mail order) - P(Internet AND mail order) = % OPIM 303 Lecture 3 Page 29
 = = P(red and not ace) 26-2 24 1 = = P(not ace) 52-4 48 2 Using independent form of equation.")
, probability of A given B, we know that event B has occurred and we are asking how it will effect the probability of A happening.")
30 This information does not change the outcome of the trial so these events are independent. Example: P(red card card is not an ace) = = P(red and not ace) = = P(not ace) Using independent form of equation. Here we examine how various probabilities are determined if certain information about the events involved is already known. In the standard notation, P(A B), probability of A given B, we know that event B has occurred and we are asking how it will effect the probability of A happening. 4 Possible Outcomes Example: 2 children in the family. Event of interest is having all boys. B G P(all boys) = ¼ from the chart of possible outcomes at left. B B But if we are told the sex of the first child the probability of ending up G B with two boys changes. If we are told the first child is a girl the G G probability of all boys goes to zero. P(all boys 1 st is girl) = 0 P(all boys 1 st is boy) = 1/2 Here we see that the probability changes given some dependent information. OPIM 303 Lecture 3 Page 30
31 Contingency Table 1.00 A set is Collectively Exhaustive if at least one event in the set must occur during a given trial. Example: There is a 70% chance that a person chosen at random is American. Having been given some information about the first event the probability of being American changed. P(american and women) =.45 P(random pick is woman) =.60 Using the conditional probability equation: P(american AND woman) 0.45 P(american woman) = = P(woman) 0.6 = 75% Create a Contingency Table to help solve a problem! OPIM 303 Lecture 3 Page 31
32 A and B do not have to be independent. This is called the General Multiplication Rule. Example: Using the all boys example P(all boys) = P(all boys 1 st is boy) * P(1 st is boy) = ½ * ½ = 1/4 OPIM 303 Lecture 3 Page 32
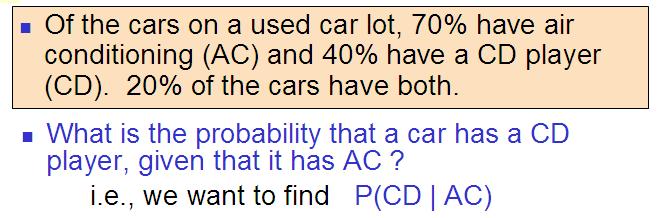
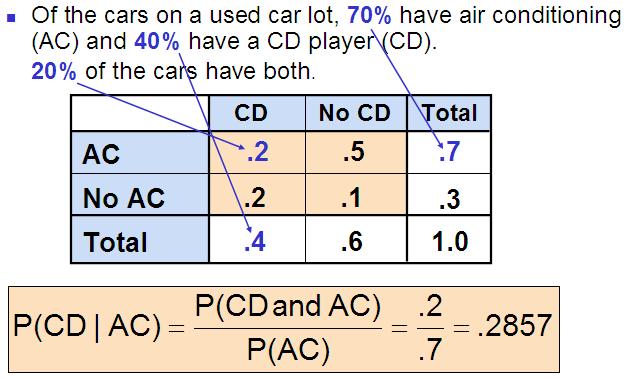
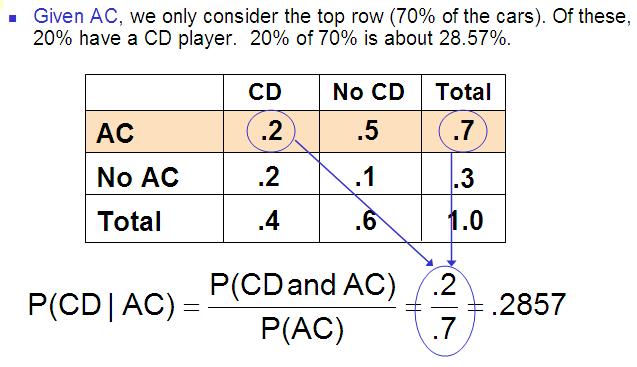
33 Conditional Probability Example: OPIM 303 Lecture 3 Page 33

 = P(A). 2) Events A and B are statistically independent if and only if P(A and B) = P(A)P(B).")
34 This is called the Multiplication Rule for Independent Events. If this rule holds for two events, A and B, then A and B are Statistically Independent. Therefore, there are two ways to determine statistical independence: 1) Events A and B are statistically independent if and only if P(A B) = P(A). 2) Events A and B are statistically independent if and only if P(A and B) = P(A)P(B). Example: P(card is red AND an ace) = P(card is red) * P(ace) = 1/2 * 4/52 = 1/26 These events are Independent. OPIM 303 Lecture 3 Page 34
35 Problem 4.13, page 167 P(warranty repair) =.04 P(US company) =.6 P(w.r. and US company) =.025 This type of problem is best solved using a contingency table. Some of the entries are given in the problem, the rest are solved for. Repair Type Manufacturer Warranty Not Warranty Total US Company not US Company Total % Now we can pick a lot of the probabilities out of the table: e) P(new car selected at random needs w.r.) = 0.04 f) P(car selected at random not US company) =.4 In the category Manufacturer, US company and not US company form a Mutually Exclusive and Collectively Exhaustive set. This being the case we can also solve for this probability using 1 P(random car is US company) = =.4 g) P(w.r. and US company) =.025 h) P(w.r. and US company) =.385 Another thing we can do is use the conditional probability to test for Independence. If the variables are independent then P(w.r. US company) = P(w.r.) =.025 P(w.r. and US company).025 Now solve P(w.r. US company) = P(US company).6 So the variables are NOT INDEPENDENT. If the variables are not independent you cannot just multiply events from table to solve a conditional probability. i) P(w.r. or US company) = P(w.r.) + P(US company) P(w.r. and US company) = =.615 (from table) j) P(w.r. or US company) = P(w.r.) + P(US company) P(w.r. and US company) = =.425 k) P(w.r. or w.r.) = P(w.r.) + P(w.r.) = = 1 Because these events are Mutually Exclusive and Collectively Exhaustive. OPIM 303 Lecture 3 Page 35
Sets and Set notation. Algebra 2 Unit 8 Notes
 Sets and Set notation Section 11-2 Probability Experimental Probability experimental probability of an event: Theoretical Probability number of time the event occurs P(event) = number of trials Sample
Statistics for Managers using Microsoft Excel 6 th Edition
 Statistics for Managers using Microsoft Excel 6 th Edition Chapter 3 Numerical Descriptive Measures 3-1 Learning Objectives In this chapter, you learn: To describe the properties of central tendency, variation,
Econ 325: Introduction to Empirical Economics
 Econ 325: Introduction to Empirical Economics Lecture 2 Probability Copyright 2010 Pearson Education, Inc. Publishing as Prentice Hall Ch. 3-1 3.1 Definition Random Experiment a process leading to an uncertain
TOPIC: Descriptive Statistics Single Variable
 TOPIC: Descriptive Statistics Single Variable I. Numerical data summary measurements A. Measures of Location. Measures of central tendency Mean; Median; Mode. Quantiles - measures of noncentral tendency
Unit 2. Describing Data: Numerical
 Unit 2 Describing Data: Numerical Describing Data Numerically Describing Data Numerically Central Tendency Arithmetic Mean Median Mode Variation Range Interquartile Range Variance Standard Deviation Coefficient
Statistics for Business and Economics
 Statistics for Business and Economics Basic Probability Learning Objectives In this lecture(s), you learn: Basic probability concepts Conditional probability To use Bayes Theorem to revise probabilities
Dept. of Linguistics, Indiana University Fall 2015
 L645 Dept. of Linguistics, Indiana University Fall 2015 1 / 34 To start out the course, we need to know something about statistics and This is only an introduction; for a fuller understanding, you would
Review of Statistics
 Review of Statistics Topics Descriptive Statistics Mean, Variance Probability Union event, joint event Random Variables Discrete and Continuous Distributions, Moments Two Random Variables Covariance and
Basic Concepts of Probability
 Probability Probability theory is the branch of math that deals with random events Probability is used to describe how likely a particular outcome is in a random event the probability of obtaining heads
Statistics 1. Edexcel Notes S1. Mathematical Model. A mathematical model is a simplification of a real world problem.
 Statistics 1 Mathematical Model A mathematical model is a simplification of a real world problem. 1. A real world problem is observed. 2. A mathematical model is thought up. 3. The model is used to make
Instrumentation (cont.) Statistics vs. Parameters. Descriptive Statistics. Types of Numerical Data
 Statistics vs. Parameters. Descriptive Statistics. Types of Numerical Data") Norm-Referenced vs. Criterion- Referenced Instruments Instrumentation (cont.) October 1, 2007 Note: Measurement Plan Due Next Week All derived scores give meaning to individual scores by comparing them
Norm-Referenced vs. Criterion- Referenced Instruments Instrumentation (cont.) October 1, 2007 Note: Measurement Plan Due Next Week All derived scores give meaning to individual scores by comparing them
I - Probability. What is Probability? the chance of an event occuring. 1classical probability. 2empirical probability. 3subjective probability
 What is Probability? the chance of an event occuring eg 1classical probability 2empirical probability 3subjective probability Section 2 - Probability (1) Probability - Terminology random (probability)
Probability Year 10. Terminology
 Probability Year 10 Terminology Probability measures the chance something happens. Formally, we say it measures how likely is the outcome of an event. We write P(result) as a shorthand. An event is some
STATISTICS 1 REVISION NOTES
 STATISTICS 1 REVISION NOTES Statistical Model Representing and summarising Sample Data Key words: Quantitative Data This is data in NUMERICAL FORM such as shoe size, height etc. Qualitative Data This is
Descriptive Statistics-I. Dr Mahmoud Alhussami
 Descriptive Statistics-I Dr Mahmoud Alhussami Biostatistics What is the biostatistics? A branch of applied math. that deals with collecting, organizing and interpreting data using well-defined procedures.
Preliminary Statistics course. Lecture 1: Descriptive Statistics
 Preliminary Statistics course Lecture 1: Descriptive Statistics Rory Macqueen (rm43@soas.ac.uk), September 2015 Organisational Sessions: 16-21 Sep. 10.00-13.00, V111 22-23 Sep. 15.00-18.00, V111 24 Sep.
Introduction to probability
 Introduction to probability 4.1 The Basics of Probability Probability The chance that a particular event will occur The probability value will be in the range 0 to 1 Experiment A process that produces
Bioeng 3070/5070. App Math/Stats for Bioengineer Lecture 3
 Bioeng 3070/5070 App Math/Stats for Bioengineer Lecture 3 Five number summary Five-number summary of a data set consists of: the minimum (smallest observation) the first quartile (which cuts off the lowest
Review Basic Probability Concept
 Economic Risk and Decision Analysis for Oil and Gas Industry CE81.9008 School of Engineering and Technology Asian Institute of Technology January Semester Presented by Dr. Thitisak Boonpramote Department
Outline. Probability. Math 143. Department of Mathematics and Statistics Calvin College. Spring 2010
 Outline Math 143 Department of Mathematics and Statistics Calvin College Spring 2010 Outline Outline 1 Review Basics Random Variables Mean, Variance and Standard Deviation of Random Variables 2 More Review
Probability Year 9. Terminology
 Probability Year 9 Terminology Probability measures the chance something happens. Formally, we say it measures how likely is the outcome of an event. We write P(result) as a shorthand. An event is some
Semester 2 Final Exam Review Guide for AMS I
 Name: Semester 2 Final Exam Review Guide for AMS I Unit 4: Exponential Properties & Functions Lesson 1 Exponent Properties & Simplifying Radicals Products of Powers: when two powers with the same base
Unit 7 Probability M2 13.1,2,4, 5,6
 + Unit 7 Probability M2 13.1,2,4, 5,6 7.1 Probability n Obj.: I will be able to determine the experimental and theoretical probabilities of an event, or its complement, occurring. n Vocabulary o Outcome
University of Jordan Fall 2009/2010 Department of Mathematics
 handouts Part 1 (Chapter 1 - Chapter 5) University of Jordan Fall 009/010 Department of Mathematics Chapter 1 Introduction to Introduction; Some Basic Concepts Statistics is a science related to making
Chapter 2 Solutions Page 15 of 28
 Chapter Solutions Page 15 of 8.50 a. The median is 55. The mean is about 105. b. The median is a more representative average" than the median here. Notice in the stem-and-leaf plot on p.3 of the text that
Lecture 2 and Lecture 3
 Lecture 2 and Lecture 3 1 Lecture 2 and Lecture 3 We can describe distributions using 3 characteristics: shape, center and spread. These characteristics have been discussed since the foundation of statistics.
Statistics for Engineers
 Statistics for Engineers Antony Lewis http://cosmologist.info/teaching/stat/ Starter question Have you previously done any statistics? 1. Yes 2. No 54% 46% 1 2 BOOKS Chatfield C, 1989. Statistics for
ECE 340 Probabilistic Methods in Engineering M/W 3-4:15. Lecture 2: Random Experiments. Prof. Vince Calhoun
 ECE 340 Probabilistic Methods in Engineering M/W 3-4:15 Lecture 2: Random Experiments Prof. Vince Calhoun Reading This class: Section 2.1-2.2 Next class: Section 2.3-2.4 Homework: Assignment 1: From the
Marquette University MATH 1700 Class 5 Copyright 2017 by D.B. Rowe
 Class 5 Daniel B. Rowe, Ph.D. Department of Mathematics, Statistics, and Computer Science Copyright 2017 by D.B. Rowe 1 Agenda: Recap Chapter 3.2-3.3 Lecture Chapter 4.1-4.2 Review Chapter 1 3.1 (Exam
Statistics Primer. A Brief Overview of Basic Statistical and Probability Principles. Essential Statistics for Data Analysts Using Excel
 Statistics Primer A Brief Overview of Basic Statistical and Probability Principles Liberty J. Munson, PhD 9/19/16 Essential Statistics for Data Analysts Using Excel Table of Contents What is a Variable?...
Statistics for Managers Using Microsoft Excel (3 rd Edition)
") Statistics for Managers Using Microsoft Excel (3 rd Edition) Chapter 4 Basic Probability and Discrete Probability Distributions 2002 Prentice-Hall, Inc. Chap 4-1 Chapter Topics Basic probability concepts
Statistics for Managers Using Microsoft Excel (3 rd Edition) Chapter 4 Basic Probability and Discrete Probability Distributions 2002 Prentice-Hall, Inc. Chap 4-1 Chapter Topics Basic probability concepts
Essentials of Statistics and Probability
 May 22, 2007 Department of Statistics, NC State University dbsharma@ncsu.edu SAMSI Undergrad Workshop Overview Practical Statistical Thinking Introduction Data and Distributions Variables and Distributions
Random processes. Lecture 17: Probability, Part 1. Probability. Law of large numbers
 Random processes Lecture 17: Probability, Part 1 Statistics 10 Colin Rundel March 26, 2012 A random process is a situation in which we know what outcomes could happen, but we don t know which particular
UNIT 5 ~ Probability: What Are the Chances? 1
 UNIT 5 ~ Probability: What Are the Chances? 1 6.1: Simulation Simulation: The of chance behavior, based on a that accurately reflects the phenomenon under consideration. (ex 1) Suppose we are interested
1. Consider the independent events A and B. Given that P(B) = 2P(A), and P(A B) = 0.52, find P(B). (Total 7 marks)
 = 2P(A), and P(A B) = 0.52, find P(B). (Total 7 marks)") 1. Consider the independent events A and B. Given that P(B) = 2P(A), and P(A B) = 0.52, find P(B). (Total 7 marks) 2. In a school of 88 boys, 32 study economics (E), 28 study history (H) and 39 do not
1. Consider the independent events A and B. Given that P(B) = 2P(A), and P(A B) = 0.52, find P(B). (Total 7 marks) 2. In a school of 88 boys, 32 study economics (E), 28 study history (H) and 39 do not
3 Lecture 3 Notes: Measures of Variation. The Boxplot. Definition of Probability
 3 Lecture 3 Notes: Measures of Variation. The Boxplot. Definition of Probability 3.1 Week 1 Review Creativity is more than just being different. Anybody can plan weird; that s easy. What s hard is to be
QUIZ 1 (CHAPTERS 1-4) SOLUTIONS MATH 119 SPRING 2013 KUNIYUKI 105 POINTS TOTAL, BUT 100 POINTS = 100%
 SOLUTIONS MATH 119 SPRING 2013 KUNIYUKI 105 POINTS TOTAL, BUT 100 POINTS = 100%") QUIZ 1 (CHAPTERS 1-4) SOLUTIONS MATH 119 SPRING 2013 KUNIYUKI 105 POINTS TOTAL, BUT 100 POINTS = 100% 1) (6 points). A college has 32 course sections in math. A frequency table for the numbers of students
QUIZ 1 (CHAPTERS 1-4) SOLUTIONS MATH 119 SPRING 2013 KUNIYUKI 105 POINTS TOTAL, BUT 100 POINTS = 100% 1) (6 points). A college has 32 course sections in math. A frequency table for the numbers of students
Elementary Statistics
 Elementary Statistics Q: What is data? Q: What does the data look like? Q: What conclusions can we draw from the data? Q: Where is the middle of the data? Q: Why is the spread of the data important? Q:
Unit Two Descriptive Biostatistics. Dr Mahmoud Alhussami
 Unit Two Descriptive Biostatistics Dr Mahmoud Alhussami Descriptive Biostatistics The best way to work with data is to summarize and organize them. Numbers that have not been summarized and organized are
Announcements. Topics: To Do:
 Announcements Topics: In the Probability and Statistics module: - Sections 1 + 2: Introduction to Stochastic Models - Section 3: Basics of Probability Theory - Section 4: Conditional Probability; Law of
Lecture 10: Probability distributions TUESDAY, FEBRUARY 19, 2019
 Lecture 10: Probability distributions DANIEL WELLER TUESDAY, FEBRUARY 19, 2019 Agenda What is probability? (again) Describing probabilities (distributions) Understanding probabilities (expectation) Partial
QUIZ 1 (CHAPTERS 1-4) SOLUTIONS MATH 119 FALL 2012 KUNIYUKI 105 POINTS TOTAL, BUT 100 POINTS
 SOLUTIONS MATH 119 FALL 2012 KUNIYUKI 105 POINTS TOTAL, BUT 100 POINTS") QUIZ 1 (CHAPTERS 1-4) SOLUTIONS MATH 119 FALL 2012 KUNIYUKI 105 POINTS TOTAL, BUT 100 POINTS = 100% Show all work, simplify as appropriate, and use good form and procedure (as in class). Box in your final
QUIZ 1 (CHAPTERS 1-4) SOLUTIONS MATH 119 FALL 2012 KUNIYUKI 105 POINTS TOTAL, BUT 100 POINTS = 100% Show all work, simplify as appropriate, and use good form and procedure (as in class). Box in your final
 MIDTERM EXAMINATION STA301- Statistics and Probability (Session - 4) Question No: 1 (Marks: 1) - Please choose one 10! =. 362880 3628800 362280 362800 Question No: 2 (Marks: 1) - Please choose one If a
Objective A: Mean, Median and Mode Three measures of central of tendency: the mean, the median, and the mode.
 Chapter 3 Numerically Summarizing Data Chapter 3.1 Measures of Central Tendency Objective A: Mean, Median and Mode Three measures of central of tendency: the mean, the median, and the mode. A1. Mean The
Ch 14 Randomness and Probability
 Ch 14 Randomness and Probability We ll begin a new part: randomness and probability. This part contain 4 chapters: 14-17. Why we need to learn this part? Probability is not a portion of statistics. Instead
ACCESS TO SCIENCE, ENGINEERING AND AGRICULTURE: MATHEMATICS 2 MATH00040 SEMESTER / Probability
 ACCESS TO SCIENCE, ENGINEERING AND AGRICULTURE: MATHEMATICS 2 MATH00040 SEMESTER 2 2017/2018 DR. ANTHONY BROWN 5.1. Introduction to Probability. 5. Probability You are probably familiar with the elementary
STA 2023 EXAM-2 Practice Problems. Ven Mudunuru. From Chapters 4, 5, & Partly 6. With SOLUTIONS
 STA 2023 EXAM-2 Practice Problems From Chapters 4, 5, & Partly 6 With SOLUTIONS Mudunuru, Venkateswara Rao STA 2023 Spring 2016 1 1. A committee of 5 persons is to be formed from 6 men and 4 women. What
Event A: at least one tail observed A:
 Chapter 3 Probability 3.1 Events, sample space, and probability Basic definitions: An is an act of observation that leads to a single outcome that cannot be predicted with certainty. A (or simple event)
P(A) = Definitions. Overview. P - denotes a probability. A, B, and C - denote specific events. P (A) - Chapter 3 Probability
 = Definitions. Overview. P - denotes a probability. A, B, and C - denote specific events. P (A) - Chapter 3 Probability") Chapter 3 Probability Slide 1 Slide 2 3-1 Overview 3-2 Fundamentals 3-3 Addition Rule 3-4 Multiplication Rule: Basics 3-5 Multiplication Rule: Complements and Conditional Probability 3-6 Probabilities
Chapter 3 Probability Slide 1 Slide 2 3-1 Overview 3-2 Fundamentals 3-3 Addition Rule 3-4 Multiplication Rule: Basics 3-5 Multiplication Rule: Complements and Conditional Probability 3-6 Probabilities
4 Lecture 4 Notes: Introduction to Probability. Probability Rules. Independence and Conditional Probability. Bayes Theorem. Risk and Odds Ratio
 4 Lecture 4 Notes: Introduction to Probability. Probability Rules. Independence and Conditional Probability. Bayes Theorem. Risk and Odds Ratio Wrong is right. Thelonious Monk 4.1 Three Definitions of
Basic Concepts of Probability
 Probability Probability theory is the branch of math that deals with unpredictable or random events Probability is used to describe how likely a particular outcome is in a random event the probability
Useful for Multiplication Rule: When two events, A and B, are independent, P(A and B) = P(A) P(B).
 = P(A) P(B).") Probability Independence Last time: Two events are indpt if knowing that one did or did not happen tells you nothing about whether the other will or will not. It doesn't change the probability. Example:
Probability Independence Last time: Two events are indpt if knowing that one did or did not happen tells you nothing about whether the other will or will not. It doesn't change the probability. Example:
Chapter. Probability
 Chapter 3 Probability Section 3.1 Basic Concepts of Probability Section 3.1 Objectives Identify the sample space of a probability experiment Identify simple events Use the Fundamental Counting Principle
2011 Pearson Education, Inc
 Statistics for Business and Economics Chapter 2 Methods for Describing Sets of Data Summary of Central Tendency Measures Measure Formula Description Mean x i / n Balance Point Median ( n +1) Middle Value
Glossary Common Core Curriculum Maps Math/Grade 9 Grade 12
 Glossary Common Core Curriculum Maps Math/Grade 9 Grade 12 Grade 9 Grade 12 AA similarity Angle-angle similarity. When twotriangles have corresponding angles that are congruent, the triangles are similar.
Nuevo examen - 02 de Febrero de 2017 [280 marks]
![Nuevo examen - 02 de Febrero de 2017 [280 marks]](/thumbs/84/89159695.jpg "Nuevo examen - 02 de Febrero de 2017 [280 marks]") Nuevo examen - 0 de Febrero de 0 [0 marks] Jar A contains three red marbles and five green marbles. Two marbles are drawn from the jar, one after the other, without replacement. a. Find the probability
Nuevo examen - 0 de Febrero de 0 [0 marks] Jar A contains three red marbles and five green marbles. Two marbles are drawn from the jar, one after the other, without replacement. a. Find the probability
3.1 Measures of Central Tendency: Mode, Median and Mean. Average a single number that is used to describe the entire sample or population
 . Measures of Central Tendency: Mode, Median and Mean Average a single number that is used to describe the entire sample or population. Mode a. Easiest to compute, but not too stable i. Changing just one
Probability and Probability Distributions. Dr. Mohammed Alahmed
 Probability and Probability Distributions 1 Probability and Probability Distributions Usually we want to do more with data than just describing them! We might want to test certain specific inferences about
AIM HIGH SCHOOL. Curriculum Map W. 12 Mile Road Farmington Hills, MI (248)
") AIM HIGH SCHOOL Curriculum Map 2923 W. 12 Mile Road Farmington Hills, MI 48334 (248) 702-6922 www.aimhighschool.com COURSE TITLE: Statistics DESCRIPTION OF COURSE: PREREQUISITES: Algebra 2 Students will
AIM HIGH SCHOOL Curriculum Map 2923 W. 12 Mile Road Farmington Hills, MI 48334 (248) 702-6922 www.aimhighschool.com COURSE TITLE: Statistics DESCRIPTION OF COURSE: PREREQUISITES: Algebra 2 Students will
ST Presenting & Summarising Data Descriptive Statistics. Frequency Distribution, Histogram & Bar Chart
 ST2001 2. Presenting & Summarising Data Descriptive Statistics Frequency Distribution, Histogram & Bar Chart Summary of Previous Lecture u A study often involves taking a sample from a population that
STA 2023 EXAM-2 Practice Problems From Chapters 4, 5, & Partly 6. With SOLUTIONS
 STA 2023 EXAM-2 Practice Problems From Chapters 4, 5, & Partly 6 With SOLUTIONS Mudunuru Venkateswara Rao, Ph.D. STA 2023 Fall 2016 Venkat Mu ALL THE CONTENT IN THESE SOLUTIONS PRESENTED IN BLUE AND BLACK
MATH 1150 Chapter 2 Notation and Terminology
 MATH 1150 Chapter 2 Notation and Terminology Categorical Data The following is a dataset for 30 randomly selected adults in the U.S., showing the values of two categorical variables: whether or not the
Determining Probabilities. Product Rule for Ordered Pairs/k-Tuples:
 Determining Probabilities Product Rule for Ordered Pairs/k-Tuples: Determining Probabilities Product Rule for Ordered Pairs/k-Tuples: Proposition If the first element of object of an ordered pair can be
Chapter2 Description of samples and populations. 2.1 Introduction.
 Chapter2 Description of samples and populations. 2.1 Introduction. Statistics=science of analyzing data. Information collected (data) is gathered in terms of variables (characteristics of a subject that
Announcements. Lecture 5: Probability. Dangling threads from last week: Mean vs. median. Dangling threads from last week: Sampling bias
 Recap Announcements Lecture 5: Statistics 101 Mine Çetinkaya-Rundel September 13, 2011 HW1 due TA hours Thursday - Sunday 4pm - 9pm at Old Chem 211A If you added the class last week please make sure to
dates given in your syllabus.
 Slide 2-1 For exams (MD1, MD2, and Final): You may bring one 8.5 by 11 sheet of paper with formulas and notes written or typed on both sides to each exam. For the rest of the quizzes, you will take your
AMS7: WEEK 2. CLASS 2
 AMS7: WEEK 2. CLASS 2 Introduction to Probability. Probability Rules. Independence and Conditional Probability. Bayes Theorem. Risk and Odds Ratio Friday April 10, 2015 Probability: Introduction Probability:
Chapter 01 : What is Statistics?
 Chapter 01 : What is Statistics? Feras Awad Data: The information coming from observations, counts, measurements, and responses. Statistics: The science of collecting, organizing, analyzing, and interpreting
Lecture 1. Chapter 1. (Part I) Material Covered in This Lecture: Chapter 1, Chapter 2 ( ). 1. What is Statistics?
 Material Covered in This Lecture: Chapter 1, Chapter 2 ( ). 1. What is Statistics?") Lecture 1 (Part I) Material Covered in This Lecture: Chapter 1, Chapter 2 (2.1 --- 2.6). Chapter 1 1. What is Statistics? 2. Two definitions. (1). Population (2). Sample 3. The objective of statistics.
Lecture 1 (Part I) Material Covered in This Lecture: Chapter 1, Chapter 2 (2.1 --- 2.6). Chapter 1 1. What is Statistics? 2. Two definitions. (1). Population (2). Sample 3. The objective of statistics.
Glossary. The ISI glossary of statistical terms provides definitions in a number of different languages:
 Glossary The ISI glossary of statistical terms provides definitions in a number of different languages: http://isi.cbs.nl/glossary/index.htm Adjusted r 2 Adjusted R squared measures the proportion of the
MIDTERM EXAMINATION (Spring 2011) STA301- Statistics and Probability
 STA301- Statistics and Probability") STA301- Statistics and Probability Solved MCQS From Midterm Papers March 19,2012 MC100401285 Moaaz.pk@gmail.com Mc100401285@gmail.com PSMD01 MIDTERM EXAMINATION (Spring 2011) STA301- Statistics and Probability
STA301- Statistics and Probability Solved MCQS From Midterm Papers March 19,2012 MC100401285 Moaaz.pk@gmail.com Mc100401285@gmail.com PSMD01 MIDTERM EXAMINATION (Spring 2011) STA301- Statistics and Probability
20 Hypothesis Testing, Part I
 20 Hypothesis Testing, Part I Bob has told Alice that the average hourly rate for a lawyer in Virginia is $200 with a standard deviation of $50, but Alice wants to test this claim. If Bob is right, she
Section 13.3 Probability
 288 Section 13.3 Probability Probability is a measure of how likely an event will occur. When the weather forecaster says that there will be a 50% chance of rain this afternoon, the probability that it
With Question/Answer Animations. Chapter 7
 With Question/Answer Animations Chapter 7 Chapter Summary Introduction to Discrete Probability Probability Theory Bayes Theorem Section 7.1 Section Summary Finite Probability Probabilities of Complements
CHAPTER 2: Describing Distributions with Numbers
 CHAPTER 2: Describing Distributions with Numbers The Basic Practice of Statistics 6 th Edition Moore / Notz / Fligner Lecture PowerPoint Slides Chapter 2 Concepts 2 Measuring Center: Mean and Median Measuring
MTH302 Quiz # 4. Solved By When a coin is tossed once, the probability of getting head is. Select correct option:
 MTH302 Quiz # 4 Solved By konenuchiha@gmail.com When a coin is tossed once, the probability of getting head is. 0.55 0.52 0.50 (1/2) 0.51 Suppose the slope of regression line is 20 and the intercept is
Chapter 7 Wednesday, May 26th
 Chapter 7 Wednesday, May 26 th Random event A random event is an event that the outcome is unpredictable. Example: There are 45 students in this class. What is the probability that if I select one student,
IAM 530 ELEMENTS OF PROBABILITY AND STATISTICS LECTURE 3-RANDOM VARIABLES
 IAM 530 ELEMENTS OF PROBABILITY AND STATISTICS LECTURE 3-RANDOM VARIABLES VARIABLE Studying the behavior of random variables, and more importantly functions of random variables is essential for both the
STT 315 This lecture is based on Chapter 2 of the textbook.
 STT 315 This lecture is based on Chapter 2 of the textbook. Acknowledgement: Author is thankful to Dr. Ashok Sinha, Dr. Jennifer Kaplan and Dr. Parthanil Roy for allowing him to use/edit some of their
Keystone Exams: Algebra
 KeystoneExams:Algebra TheKeystoneGlossaryincludestermsanddefinitionsassociatedwiththeKeystoneAssessmentAnchorsand Eligible Content. The terms and definitions included in the glossary are intended to assist
Presentation on Theo e ry r y o f P r P o r bab a il i i l t i y
 Presentation on Theory of Probability Meaning of Probability: Chance of occurrence of any event In practical life we come across situation where the result are uncertain Theory of probability was originated
Probability the chance that an uncertain event will occur (always between 0 and 1)
") Quantitative Methods 2013 1 Probability as a Numerical Measure of the Likelihood of Occurrence Probability the chance that an uncertain event will occur (always between 0 and 1) Increasing Likelihood of
Quantitative Methods 2013 1 Probability as a Numerical Measure of the Likelihood of Occurrence Probability the chance that an uncertain event will occur (always between 0 and 1) Increasing Likelihood of
Chapter 2. Mean and Standard Deviation
 Chapter 2. Mean and Standard Deviation The median is known as a measure of location; that is, it tells us where the data are. As stated in, we do not need to know all the exact values to calculate the
Math 10 - Compilation of Sample Exam Questions + Answers
 Math 10 - Compilation of Sample Exam Questions + Sample Exam Question 1 We have a population of size N. Let p be the independent probability of a person in the population developing a disease. Answer the
STA Module 4 Probability Concepts. Rev.F08 1
 STA 2023 Module 4 Probability Concepts Rev.F08 1 Learning Objectives Upon completing this module, you should be able to: 1. Compute probabilities for experiments having equally likely outcomes. 2. Interpret
AP Final Review II Exploring Data (20% 30%)
") AP Final Review II Exploring Data (20% 30%) Quantitative vs Categorical Variables Quantitative variables are numerical values for which arithmetic operations such as means make sense. It is usually a measure
AP Final Review II Exploring Data (20% 30%) Quantitative vs Categorical Variables Quantitative variables are numerical values for which arithmetic operations such as means make sense. It is usually a measure
LECTURE NOTES by DR. J.S.V.R. KRISHNA PRASAD
 .0 Introduction: The theory of probability has its origin in the games of chance related to gambling such as tossing of a coin, throwing of a die, drawing cards from a pack of cards etc. Jerame Cardon,
Statistics for Managers Using Microsoft Excel/SPSS Chapter 4 Basic Probability And Discrete Probability Distributions
 Statistics for Managers Using Microsoft Excel/SPSS Chapter 4 Basic Probability And Discrete Probability Distributions 1999 Prentice-Hall, Inc. Chap. 4-1 Chapter Topics Basic Probability Concepts: Sample
STA 218: Statistics for Management
 Al Nosedal. University of Toronto. Fall 2017 My momma always said: Life was like a box of chocolates. You never know what you re gonna get. Forrest Gump. Problem How much do people with a bachelor s degree
Lecture 3. Measures of Relative Standing and. Exploratory Data Analysis (EDA)
") Lecture 3. Measures of Relative Standing and Exploratory Data Analysis (EDA) Problem: The average weekly sales of a small company are $10,000 with a standard deviation of $450. This week their sales were
Lecture 3. Measures of Relative Standing and Exploratory Data Analysis (EDA) Problem: The average weekly sales of a small company are $10,000 with a standard deviation of $450. This week their sales were
ADMS2320.com. We Make Stats Easy. Chapter 4. ADMS2320.com Tutorials Past Tests. Tutorial Length 1 Hour 45 Minutes
 We Make Stats Easy. Chapter 4 Tutorial Length 1 Hour 45 Minutes Tutorials Past Tests Chapter 4 Page 1 Chapter 4 Note The following topics will be covered in this chapter: Measures of central location Measures
Chapter 5 : Probability. Exercise Sheet. SHilal. 1 P a g e
 1 P a g e experiment ( observing / measuring ) outcomes = results sample space = set of all outcomes events = subset of outcomes If we collect all outcomes we are forming a sample space If we collect some
What is Probability? Probability. Sample Spaces and Events. Simple Event
 What is Probability? Probability Peter Lo Probability is the numerical measure of likelihood that the event will occur. Simple Event Joint Event Compound Event Lies between 0 & 1 Sum of events is 1 1.5
MgtOp 215 Chapter 3 Dr. Ahn
 MgtOp 215 Chapter 3 Dr. Ahn Measures of central tendency (center, location): measures the middle point of a distribution or data; these include mean and median. Measures of dispersion (variability, spread):
Business Statistics. Lecture 3: Random Variables and the Normal Distribution
 Business Statistics Lecture 3: Random Variables and the Normal Distribution 1 Goals for this Lecture A little bit of probability Random variables The normal distribution 2 Probability vs. Statistics Probability:
Lecture 3. The Population Variance. The population variance, denoted σ 2, is the sum. of the squared deviations about the population
 Lecture 5 1 Lecture 3 The Population Variance The population variance, denoted σ 2, is the sum of the squared deviations about the population mean divided by the number of observations in the population,
Last Lecture. Distinguish Populations from Samples. Knowing different Sampling Techniques. Distinguish Parameters from Statistics
 Last Lecture Distinguish Populations from Samples Importance of identifying a population and well chosen sample Knowing different Sampling Techniques Distinguish Parameters from Statistics Knowing different
Topic 5 Part 3 [257 marks]
![Topic 5 Part 3 [257 marks]](/thumbs/89/98286032.jpg "Topic 5 Part 3 [257 marks]") Topic 5 Part 3 [257 marks] Let 0 3 A = ( ) and 2 4 4 0 B = ( ). 5 1 1a. AB. 1b. Given that X 2A = B, find X. The following table shows the probability distribution of a discrete random variable X. 2a.
Topic 5 Part 3 [257 marks] Let 0 3 A = ( ) and 2 4 4 0 B = ( ). 5 1 1a. AB. 1b. Given that X 2A = B, find X. The following table shows the probability distribution of a discrete random variable X. 2a.
6.2 Introduction to Probability. The Deal. Possible outcomes: STAT1010 Intro to probability. Definitions. Terms: What are the chances of?
 6.2 Introduction to Probability Terms: What are the chances of?! Personal probability (subjective) " Based on feeling or opinion. " Gut reaction.! Empirical probability (evidence based) " Based on experience
Probability Rules. MATH 130, Elements of Statistics I. J. Robert Buchanan. Fall Department of Mathematics
 Probability Rules MATH 130, Elements of Statistics I J. Robert Buchanan Department of Mathematics Fall 2018 Introduction Probability is a measure of the likelihood of the occurrence of a certain behavior