Superresolution with Seismic Arrays using Empirical Matched Field Processing
|
|
|
- Kimberly Phelps
- 5 years ago
- Views:
Transcription
1 LLNL-JRNL Superresolution with Seismic Arrays using Empirical Matched Field Processing D. B. Harris, T. Kvaerna March 31, 2010 Geophysical Journal International
2 Disclaimer This document was prepared as an account of work sponsored by an agency of the United States government. Neither the United States government nor Lawrence Livermore National Security, LLC, nor any of their employees makes any warranty, expressed or implied, or assumes any legal liability or responsibility for the accuracy, completeness, or usefulness of any information, apparatus, product, or process disclosed, or represents that its use would not infringe privately owned rights. Reference herein to any specific commercial product, process, or service by trade name, trademark, manufacturer, or otherwise does not necessarily constitute or imply its endorsement, recommendation, or favoring by the United States government or Lawrence Livermore National Security, LLC. The views and opinions of authors expressed herein do not necessarily state or reflect those of the United States government or Lawrence Livermore National Security, LLC, and shall not be used for advertising or product endorsement purposes.
3 Superresolution with Seismic Arrays using Empirical Matched Field Processing David B. Harris 1, Tormod Kvaerna 2 1 Lawrence Livermore National Laboratory, 2 NORSAR Accepted: <date> Received: <date>; in original form <date> Suggested abbreviated title: Supperresolution with Matched Field Processing Corresponding author: David B. Harris P. O. Box 231 Maupin, 0R USA oregondsp@gmail.com
4 Summary Scattering and refraction of seismic waves can be exploited with empirical matched field processing of array observations to distinguish sources separated by much less than the classical resolution limit. To describe this effect, we use the term superresolution, a term widely used in the optics and signal processing literature to denote systems that break the diffraction limit. We illustrate superresolution with Pn signals recorded by the ARCES array in northern Norway, using them to identify the origins with 98.2% accuracy of 549 explosions conducted by closelyspaced mines in northwest Russia. The mines are observed at kilometers range and are separated by as little as 3 kilometers. When viewed from ARCES many are separated by just tenths of a degree in azimuth. This classification performance results from an adaptation to transient seismic signals of techniques developed in underwater acoustics for localization of continuous sound sources. Matched field processing is a potential competitor to frequencywavenumber and waveform correlation methods currently used for event detection, classification and location. It operates by capturing the spatial structure of wavefields incident from a particular source in a series of narrow frequency bands. In the rich seismic scattering environment, closely-spaced sources far from the observing array nonetheless produce distinct wavefield amplitude and phase patterns across the small array aperture. With observations of repeating events, these patterns can be calibrated over a wide band of frequencies (e.g Hertz) for use in a power estimation technique similar to frequency-wavenumber analysis. The calibrations enable coherent processing at high frequencies at which wavefields normally are considered incoherent under a plane wave model.
5 Introduction Permanent seismic arrays are part of the verification regime for nuclear test ban treaties, especially the Comprehensive Test Ban Treaty (CTBT). Interest in smaller explosions is pushing the monitoring threshold to increasingly lower levels. Since the number of events grows exponentially with decreases in magnitude, reliable methods of screening large numbers of small events are required if analysis resources are not to be overwhelmed. With the capacity to estimate the direction and speed of observed waves and to detect small signals, arrays are essential assets in screening smaller events, especially explosions, by attributing them to known sources. However, the performance of seismic arrays in resolving sources is fundamentally limited by signal processing algorithms that employ plane-wave assumptions. The propagation environment is so strongly heterogeneous, and scattering so pronounced, that the wavefields of regional events can be modeled as planar only over apertures of one to two wavelengths, constraining array geometries and limiting resolution (Mykkeltveit et al., 1983). The performance of, specifically, frequency-wavenumber (FK) analysis (Capon, 1969), and beamforming (Johnson and Dudgeon, 1993) are limited by scattering effects. FK analysis decomposes the incident wavefield in the frequency domain as a superposition of complex exponential plane waves and provides a map (spectrum) of power or energy incident on the array as a function of wavenumber. It is the principal tool for ascertaining the directions and velocities of waves incident on a seismic array. These parameters are obtained by extracting the vector wavenumber corresponding to peaks in the FK spectrum. Since seismic arrays operate in an inhomogeneous propagation environment, peaks in the FK spectrum often are not well defined. The problem is acute at higher frequencies.
6 Work on correlation detection and classification using array and network waveforms indicates that problems associated with scattering can be overcome by calibration of signal characteristics at the array aperture (Gibbons and Ringdal, 2006; Gibbons, et al., 2007; Harris, 1991). Waveform correlation methods obviate loss of coherence across an aperture by calibrating simultaneously the temporal and spatial structure of signals from specific repeating sources. Discoveries that large subpopulations of explosions and earthquakes produce nearly identical repeating waveforms (Israelsson, 1990; Schaff and Richards, 2004; Schaff and Waldhauser, 2005) motivate large-scale application of waveform correlation techniques for high precision location (see e.g. Waldhauser and Ellsworth, 2000; Hauksson and Shearer, 2005), classification, and detection. However, the applicability of correlation methods is limited by variations in source characteristics (time history, mechanism and physical dimension) which change the observed waveform. This problem motivates a search for invariants in the array waveform for a particular source, unaffected by source variations. For sources that vary principally through changes in time history, and not mechanism, the collection of Greens functions that characterize propagation from the source to the array stations are the relevant invariant. At the array aperture, and in narrow frequency bands, collections of Greens functions determine the spatial structure of the signal. In the underwater sound community, matched field processing (Bucker, 1976; Baggeroer et al., 1993) extends coherent array processing methods to heterogeneous environments by characterizing the spatial structure of the signal under more realistic propagation conditions. The essence of matched field processing (MFP), as practiced in underwater sound, is to calculate the Greens functions describing propagation from source to array receivers using an accurate model
7 of sound velocity in the oceanic waveguide. MFP steers the array with the more accurate (nonplanar) signal representation that results to focus incident signal energy emanating from a particular source point in a manner directly analogous to FK analysis and beamforming. Recall that beamforming methods steer an array by applying time delays to align waveforms recorded by the array elements. The time delays are projections of the slowness vector of a presumed incident plane wave onto the array sensor positions. In the frequency domain this operation corresponds to multiplying the Fourier representations of the sensor waveforms by corresponding complex phase factors. MFP, by contrast, steers the array explicitly in the frequency domain using the complex phase and amplitude factors obtained by solving the wave equation through the propagation model. Because the sources of interest in underwater sound investigations usually are ships with rotating machinery, the signals often are narrowband or are comprised of a series of narrowband components. Consequently, Greens functions typically are calculated for a single frequency by solving the Helmholtz equation (Baggeroer et al., 1993). MFP offers the prospect of much better detection and estimation performance than beamforming or FK analysis because the representation of the signal can be much more realistic. In the underwater sound problem, superior performance often is achieved by matched field methods, especially in deep water applications. However, MFP has not found significant application in seismology due to the difficulty of developing realistic earth models to predict the structure of seismic wave fields at frequencies much above a tenth of a Hertz. An alternative to calculating the wavefield structure across an array is to estimate that structure directly from field calibration data (Fialkowski et al., 2000). We refer to this strategy as empirical matched field processing. Attempts at empirical MFP in underwater acoustics have achieved mixed success due to the dynamic nature of the medium and underwater sound sources.
8 The principal issue is that stable estimates of the vector of amplitude-phase steering factors (i.e. the matching field, also called the steering vector) are difficult to obtain for non-stationary sources. In the classic MFP approach, the steering vector is obtained as the principal eigenvector of a sample covariance matrix estimated from calibration data over the collection of array sensors. Stationarity is assumed, and using ergodic properties, the sample covariance is averaged over a long time window to achieve statistical stability. Typically, the continuous data are segmented into a series of contiguous snapshots, a sample covariance matrix for the array is estimated for each snapshot and the final estimate is the average of sample covariance matrices over all snapshots. However, in the empirical MFP application, the calibration source moves to cover a source region of interest. This motion limits the source dwell time in a particular location and the corresponding covariance integration time. Of course, the seismic medium is fixed as are many seismic sources, such as mines. This fact provides the opportunity for empirical MFP to succeed in seismic applications by averaging covariance matrix estimates over ensembles of events in a particular source region. In this paper we describe an adaptation of empirical MFP to operate on transient seismic signals. The application we present in detail most closely resembles FK analysis. Consequently, we will test MFP and contrast its performance to that of FK analysis in the context of classifying events by their origins at a set of discrete locations. Our principal result is that MFP performs much better as an event classifier than FK methods, even than FK methods with the sort of empirical corrections for refraction that are improving array operations (Schweitzer, 2001). Indeed, we show that we can reliably distinguish events from mines that are separated by much less than the classical (Rayleigh) resolution limit as viewed from a distant, regional array. This
9 performance appears to be obtained with less sensitivity to source time history variations that are problematic for waveform correlation classifiers. The principal hurdle to be overcome in adapting MFP to the seismic application is that matched field processing, as practiced in underwater sound, naturally applies to long observations of monochromatic sources. The seismic signal, on the other hand, typically is relatively wideband and transient. In our adaptation, the method uses repeating events at a known source to calibrate the complex spatial structure of the wavefield incident upon the array in a series of narrow frequency bands. Decomposing the array signal into narrow frequency bands effectively separates spatial and temporal structures of the signal allowing independent exploitation of the spatial structure. The seismic waveform from a discrete source is a heavily multipathed signal with many phase arrivals representing distinct branches of propagation. The seismic signal is profoundly non-stationary, as each phase has a distinct propagation path and scattering environment. Consequently, the spatial structure of the seismic waveform changes rapidly as phases come and go throughout the seismogram. To simplify analysis in this first application of MFP to seismic data, we restrict our analysis to a single branch of propagation, the first-arriving Pn phase of regional observations. However, in the conclusions, we will comment upon a general structure for MFP that extends to the entire waveform, which we expect will provide opportunities in detection. Since the Pn temporal window is too short to permit significant snapshot averaging with a single event observation, we obtain stable covariance matrix estimates by averaging the covariance over event ensembles, This approach leads us to reconsider the stochastic
10 representation of seismic observations commonly assumed in FK analysis. The FK spectrum, as classically defined, describes the power density in frequency-wavenumber space of a process which is a temporally stationary and spatially homogeneous random field (Capon, 1969). However, over time FK analysis has come to be applied to signals from individual events with very short temporal windows. Consequently, the FK spectrum, as commonly used, is the energy density spectrum (the squared magnitude of a Fourier transform) of a transient, implicitly deterministic signal. In this paper, we introduce a probability model for the seismic waveform which is temporally non-stationary and spatially inhomogeneous, resulting from the convolution of transient random forces in the source region with deterministic, but unknown Greens functions. As a concrete example, we study the European arctic region (Figure 1) where the ARCES array, an important CTBT monitoring station, is kilometers from two groups of mines in the Kola peninsula, Russia: the Olenegorsk (O1-O5) and Khibiny (K1-K5) groups. In monitoring for signals from distant nuclear events, the array observes thousands of mining explosions annually, which can be screened if attributed to their originating mines. However, the array, with a 3 kilometer aperture, is too small to resolve many individual mines grouped within some mining regions. Array resolution (by the Rayleigh criterion) is determined by the separation of half-power (3 db) points of the main lobe of the array wavenumber response. In Figure 1, the 3 db points of the array response at 4, 8 and 12 Hz for Pn waves are projected onto the arrays geographic field of view. The array has been steered to one particular mine (K2). All ten mines fall within the 3 db contours even at 12 Hz. Consequently, the array should not, and we will show, does not, reliably distinguish events among these mines using plane-wave methods applied to Pn observations. However, we show that matched field processing methods
11 do distinguish these events with a high degree of reliability. This performance is an indication that the rich scattering environment imprints characteristic spatial structure on the signals that may be captured and exploited empirically. Although we characterize this study as examining issues of resolution, we demonstrate improved resolution through solution of a proxy classification problem. In situations where there are a finite number of discrete sources, estimation of location and backazimuth, normally problems of estimating the values of continuous parameters, become classification problems. We discretize the estimation problem. In the limit, as the number of sources grows indefinitely, classification and continuous parameter estimation converge. The paper is organized in three additional sections. We devote the first to mathematical background describing our adaptation of matched field methods to process transient seismic signals. The second section describes the data and analytical methods we use to test and contrast the performance of FK and MFP methods. We pay particular attention to the spatial characteristics of matched field calibrations and show how these differ from the plane wave model used in FK algorithms. The matched field calibrations show interesting structure imprinted by propagation in a strongly heterogeneous medium. The structure is responsible for the ability of matched field methods to distinguish closely-spaced sources at considerable range. The short third section presents classification results. The last section discusses the implications of these results for extending coherent seismic array processing techniques to larger apertures and higher frequencies, and briefly describes methods for generalizing MFP to use the entire waveform.
12 Mathematical Background In this study our objective is to identify the source of an event from waveforms observed at an array. We define to index the source among a set Θ of possible sources, in our case the 10 mines of the Kola peninsula. Nomenclature for the observed signals We describe the wavefield incident upon an array aperture as,,,, where the vector 1 indicates the position of a sensor observing the wavefield and denotes time. The function denotes the signal from an event at source and denotes additive noise, considered to be stationary and independent from the signal. For simplicity we are considering a scalar wavefield (for example the vertical component of motion across the array aperture). Extension to vector (three-component) wavefields is straightforward. Since we are considering arrays, the incident wavefield is measured on an aperture sampled at discrete locations ; 1,,. It is convenient to collect the observed waveforms into a vector:,,,,,,,,, (1) For purposes of exposition, we make the assumption that each of the sources,, is a point source, with a single repeating mechanism. Under this assumption,, can be represented by the simple convolution integral [see, for example, Aki and Richards, 1980] 1 Note to the editor: because we could not coax Word into implementing GRL standards for matrices and vectors, we are using italics to represent scalars, bold lower case characters to represent vectors and bold upper case characters to represent matrices.
13 (2) where is the vector of Greens functions describing propagation from the source to the observing sensors and the function represents the forcing function of the source, which we also refer to as the source time history. For more complex distributed sources or sources exhibiting multiple mechanisms an approximation involving multiple point sources is possible. We do not pursue that approximation in this study, but comment upon the complexities that assumption entails in the conclusions. Matched field processing in underwater sound In underwater sound applications [Baggeroer, 1993] it is common to use a complex analytic signal representation [see e.g. Franks, 1981] and approximate the forcing function as a slowly-varying complex envelope modulated by a complex exponential: (3) In fact, the forcing function is the real part of the complex analytic function. For simplicity of notation, we will work with the complex analytic representation of all signals throughout the discussion and treat the extraction of real components as implied. The forcing function is considered to be stationary over the observation interval, which means that its statistics (moments) are constant. Provided the envelope function is approximately constant over the duration of the Greens functions, the observed array signal has the form: (4)
14 where is the vector of Fourier transforms of the Greens functions. Matched field processing performs a type of beamforming operation by steering the array with a vector of complex weights: (5) Here the superscript denotes complex transpose. In the absence of noise, and the average power of the resulting beam is. (6) is called the steering vector and usually is normalized to have unit length, i.e. 1. The average power is maximized when the steering vector is proportional to. In the usual localization problem, source location is estimated by maximizing the average power of the beam over a range of possible origins : max max max (7) The major components of the process are (1) to compute the covariance matrix of the received signals, (2) to compute steering vectors as normalized Greens function vectors over a range of possible source locations, and (3) to estimate the source location by maximizing the quadratic form (power) over source location. The covariance matrix is the sum of the covariance matrix of the signal and the covariance matrix of the noise, due to the assumed independence of signal and noise. In
15 addition, is stationary (implying is constant) due to the assumptions of stationarity for and. With the assumption of stationarity, ergodic properties are invoked to estimate. In the underwater sound problem, the available continuous stream of data is broken into (ideally many) segments, a sample covariance matrix is estimated from each segment, and the resulting sample matrices are averaged to provide a stable estimate of. The steering vectors usually are obtained numerically by solving the Helmholtz equation for all the possible source locations to the observing array through a model of the propagation medium. We seek to adapt this processing scheme to locate events with a seismic array. Two factors bar simple emulation of the scheme. The first is that models of the seismic propagation environment are inadequate for estimating the Greens functions, except at very low frequencies far below the band where we will demonstrate processing gain. The second is that the seismic source,, though possibly still treatable as a random process, has a duration that is very short compared to the duration of the Greens functions observed at regional distances. This is especially true for the smaller events that are of increasing importance in current monitoring applications. Consequently the observations of a seismic signal are strongly non-stationary. Arguments based on ergodic notions cannot be invoked to obtain stable estimates of covariance matrices. We discuss these two factors in turn. As mentioned in the introduction, one remedy for the problem of inadequate models is to obtain estimates of steering vectors empirically, i.e. from field calibration data [Fialkowski et al., 2000]. In the underwater sound problem, this approach is motivated by the structure of the ideal covariance matrix when noise is absent and when the array is observing a signal emanating from a known source. From equation (4):
16 (8) we see that the covariance matrix has a single eigenvalue and corresponding eigenvector proportional to. Consequently, a suitable steering vector can be obtained as the principal eigenvector of the covariance matrix estimated from ground-truth training data. However, in the seismic context, the second factor the short source time history prevents estimation of signal covariance by averaging over time. Our solution to this problem involves substituting averages over ensembles of events for time averages. In addition, the short time history complicates obtaining the separable signal model (equation 4) that underpins matched field processing. Our solution is to break the signal into a large number of narrow frequency bands efficiently [see e.g. Portnoff, 1980], choose processing parameters that make signals in the narrow bands approximately independent, pursue matched field processing band by band and combine results incoherently across bands. Narrowband signal representation Figure 2 illustrates the type of seismic transient signals we consider, consisting of short forcing functions convolved with much longer Greens functions. To adapt matched field processing to transients of this sort, we break the received signal into a large number of narrowband components, an integer band index,,. Each component is represented by the filtering operation: (9) We require that the bank of filters, represented by the collection of impulse responses, allow perfect reconstruction of the (bandlimited) signal from its narrowband components (a fidelity constraint):
17 (10) One filterbank that satisfies this requirement is obtained by frequency translations of an ideal lowpass filter with impulse response [Portnoff, 1980]: ; 2 Φ (11) In appendix A, we comment on constructing such a bank of bandpass filters from a lowpass prototype filter. Figure 3 depicts impulse responses and corresponding frequency responses for the realizable digital filters we use to approximate this choice. The filterbank divides the frequency axis into disjoint bands of width ( 2 ). We choose the bandwidth to be small enough that the Fourier transform of the transient seismic source is approximately constant within any individual band. In the time domain this assumption corresponds to a requirement that the impulse response of the filters be large compared to the duration of the source. Our choice of bandwidth is 40/ Hz. The duration of the impulse response, then, is 3 to 4 seconds, which is usually long compared to the durations of the explosions in Figure 2. In the figure, the signals are observed at a distance of about one kilometer. The source durations consequently are shorter than these observations. The narrowband signal components are complex waveforms that consist of relatively slowly-varying complex envelope functions modulated by a complex exponential function [Franks, 1981]. This fact is readily apparent by substituting the impulse response of equation (11) into equation (9):
18 , (12) which resembles equation (3). The signal component of the observations, the source time history and Greens functions also have representations in terms of narrowband complex envelopes,, and respectively. Since the bands are approximately disjoint, the convolution of equation (2) can be shown to obtain in each band individually: (13) Equation (13) is an approximation, because realizable digital filters cannot achieve the infinitely sharp transition from passband to stopband indicated by the specifications of equation (11). The particular digital filters we use are described in Appendix A. As is anticipated from Figure 3 (bottom) where it is apparent that the filters defining the bands overlap, this approximation adds a bias in the form of some cross-talk between adjacent frequency bands. While the bias is difficult to quantify, it can be minimized by increasing the length of the digital filters used to perform the narrowband decomposition of the data (see Appendix A). It is, in any case, a bias shared by all algorithms (in particular, FK methods) that attempt to process data in disjoint frequency bands from a finite observation window. To support matched field processing, we seek a signal representation analogous to equation (4). This objective is aided by the short duration of the source. Since the complex envelopes are band-limited, we can invoke the sampling theorem [Oppenheim and Schafer,
19 1975] to represent the slowly-varying complex envelopes with discrete samples taken every seconds. For example: (14) Equation (14) represents the complex envelope as a series expansion in terms of sinc functions, where the coefficients in the expansion are the samples of the envelope. This is the usual representation for continuous bandlimited analog waveforms in terms of their discrete samples (i.e. the basis for all digital recording). This expansion has the desirable property that convolution among waveforms maps to convolution among their discrete-time representations [Oppenheim and Schafer, 1975]: (15) Now, since the source time function has a short duration, it is approximately true that the expansion for the envelope of the source (14) is dominated by a single sample, chosen for convenience at 0: 0; 0 (16) We emphasize that this approximation does not represent the source waveform as an impulse. Although we argue that the complex envelopes can be represented by single samples, the source waveform is a summation of complex envelopes modulated by complex exponentials (seen by
20 combining equations (10) and (12) ). As shown in Appendix B, arbitrary signals of duration less than approximately 2 seconds can be approximated with equation (16). Substituting 16 into 15: 0 (17) consequently: 0 (18) which is the result we seek. We have expressed the signal in each narrow band as a separable product of the source time history and the Greens function. This approximation allows us to propose a probability model for the observations in which the second moment is structured in a manner similar to the outer product of equation (8). The principal difference between the seismic and underwater sound situations is that now the forcing functions appear as constants and the Greens functions are time-varying. This approximation may be appropriate even for somewhat longer source durations, provided the spatial structures of the narrowband Green s function envelope vectors are approximately constant over the duration of the source (i.e. for scalar, a vector representing the spatial structure of the propagation branch present at time, and small in equation (15)). Probability model for the data Assuming the source time histories are zero mean and normally distributed, the signals are zero-mean, non-stationary, Gaussian random processes, as are the complex envelopes
21 [Van Trees, 1968]. The probability distributions of the complex envelopes are characterized by their second moments:, 0 0 (19) In contrast to the underwater sound case, these covariance functions depend on observation times, consistent with the non-stationary nature of the seismic signals. However, we concern ourselves with just the first P arrival (Pn) in this paper, so the covariance matrix of interest is limited to the quantity of equation (19) sampled at the P arrival time, i.e. at. We simplify the description of covariance by defining 0 0 and suppressing the dependence on :, (20) The matched field processing algorithm is considerably simplified if the narrowband signal components can be considered statistically independent, i.e. if, then: ; (21) where is the Kronecker delta function. We have found this condition to hold approximately for mining explosions where there is significant variation in the source time history, as we will demonstrate in the next section. We summarize the observed data with the vector (23)
22 which is understood to consist of the array complex envelope functions in the bands ranging from to sampled at time. The probability density function for these data we take to be the complex multivariate normal density where (24) (25) is the covariance contributed by the ambient noise, still considered to be stationary. The assumption of independence among bands leads to a joint pdf which is the product of individual densities for the observations in each band. Matched field processing algorithm We use a matched field processing algorithm developed under simplifying assumptions of a high signal-to-noise ratio, signals with independent narrowband components (equations 24 and 25) and noise which is statistically independent among frequency bands and channels of the array. The problem is to determine which of several possible (equally-likely) sources Θ is responsible for the observed signals. If there are possible sources, this problem can be treated as an M-ary hypothesis test and is solved by maximizing the log likelihood function [Van Trees, 1968]: (26)
23 over source. The solution to this problem is found by choosing the source which maximizes the energy in the Pn window of a beam similar to the average power expressed in equation (7): max (27) We normalize the statistic in (27) to range between 0 and 1, by dividing the beam energy by the total energy incident on the array aperture: (28) This normalization does not affect the maximization operation. The modified statistic represents the fraction of the energy in the Pn window which may be represented or captured by the matched field steering vectors. We refer to (28) as the energy capture of the algorithm. Calibration The matched field processing algorithm of equation (27) requires knowledge of the vector of Greens functions in each frequency band for each source within a multiplicative constant. As in the underwater sound case, an estimate of can be obtained empirically from an estimate of the signal covariance. This we obtain in practice from an estimate of (equation 25) made from an ensemble of events from a particular source as described in the next section. The events are chosen to have sufficient high signal-to-noise ratio that the noise
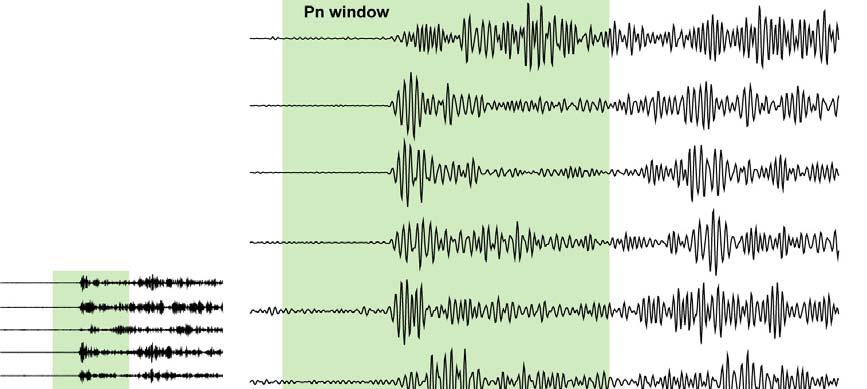
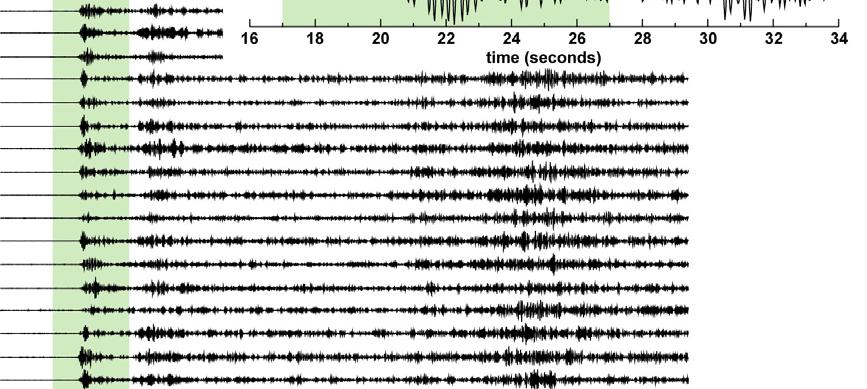
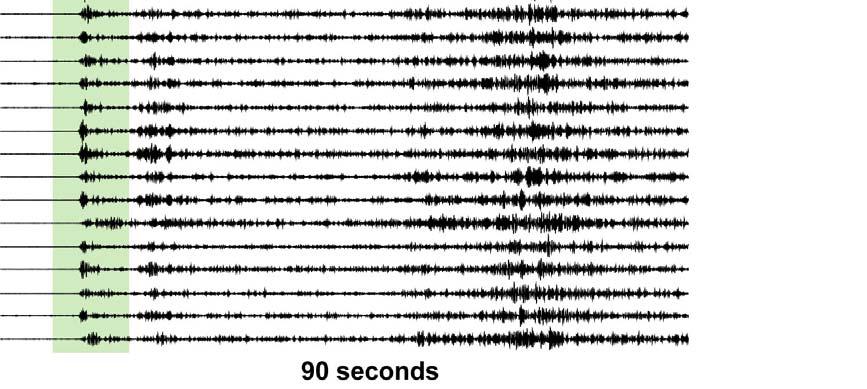
24 contribution in equation (25) is negligible. The estimate of is obtained as the principal eigenvector of. Data and Analytical Methods As described in the introduction, we test the concepts of matched field processing and contrast it with conventional FK analysis using ARCES array observations of explosions in the Kola Peninsula region of northwest Russia (Figure 1). For our analysis, we selected 549 events attributed to the specific mines shown in Table 1 by reports from the mine operators, validated with data from stations (APA, LVZ) local to the mines. For each event, we acquired 200 seconds of waveform data (Figure 2) for the 17 ARCES elements comprising the center and the outer two rings of the ARCES array (aperture approximately 3 kilometers), and manually picked the Pn onsets. We note that at this range, the Pn phase is well separated from Pg and the later phases, so that we can consider processing Pn as a temporally isolated branch of propagation, even in the narrow frequency bands that we choose for our analysis. Estimation of covariance matrices The principal data reduction we performed was to compute estimates of covariance matrices in each band,,. There were two types of covariance matrix estimates: those for single events and ensemble averages (Table 1, Figure 4) for each mine. To estimate these covariance matrices, we assembled the event observations ; 1,, from a particular source, aligned the waveforms to the first P arrival, filtered them into their constituent narrow bands, then computed
25 1 (29) for the individual covariance matrices, where was the pick time, seconds, 32. We averaged over 4-second windows of the complex envelopes in equation (29), to ensure that the sampling of Pn correlation characteristics was representative of the bulk of Pn energy. The arrival time of the energy varies somewhat from event to event. However, even with such averaging, we anticipate that since the window selected contained only the Pn phase in all cases (Figure 4). To obtain a stable estimate of the covariance structure for a given mine, we performed an ensemble average:. (30) The individual event contributions to the ensemble average in equation (30) were normalized by the total energy (the trace in the denominator of the summand) to prevent a few large events from dominating the average. We also required a signal-to-noise ratio greater than 2 in each band, so that the ensemble covariance would be dominated by signal characteristics, i.e.. The range of frequencies used was chosen for good signal-to-noise ratio over the collection of 549 events. The processing band ranged from 2.5 Hz ( = 8) to 12.5 Hz = 40). Consequently, the data were processed in the 33 bands shown in Figure 3. Assumption of independence among frequency bands
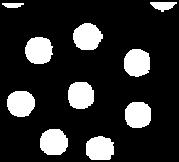
26 We performed a separate calculation of the covariance among signals in different frequency bands as a check of assumed independence. Equations (29) and (30) were modified to correlate and, envelopes in different frequency bands, to estimate for, 8,,40. We then constructed the matrix (31) and normalized the rows and columns of the matrix by the square root of the product of the diagonal elements they contain. This normalization leaves a diagonal consisting of all ones; the off-diagonal elements represent the coherences between the signals observed by individual array sensors in frequency bands and. The resulting matrix is shown in Figure 5 and is approximately block diagonal, where each block is a submatrix representing the coherence among the 17 ARCES elements used in the calculation. Since the off-diagonal elements are complex, the magnitude of the elements is rendered as an image, with bright pixels representing high coherence (approaching 1) and dark pixels representing low coherence (approaching 0). The low coherence indicated by the off-diagonal blocks suggests that the frequency bands are approximately uncorrelated, supporting the approximation of equation (21). In exception to this general behavior, we note that the principal off-diagonals (adjacent to the diagonal) of the matrix show significant correlation. This effect is a consequence of the crosstalk mentioned earlier between adjacent frequency bands caused by the use of realizable digital filters with overlapping frequency responses.
27 Characteristics of steering vectors The successful and routine use of FK analysis motivates a comparison of matched field processing to FK methods. The frequency-wavenumber spectrum has the same mathematical structure as the matched field processing statistic, but with steering vectors defined by a plane wave model (see e.g. Aki and Richards, 1980, section 11.4). The FK spectrum, maps power (or energy) incident upon an array as a function of frequency and wavenumber, and this spectrum is estimated by:, (32) where is the estimated spectral covariance matrix of the observations evaluated at frequency, and the steering vectors have the form: 1 (33) The FK equivalent of equation (27) is: max (34) where is the slowness vector defined by the nominal Pn velocity in the region and the great circle back-azimuth from the array to the source. We note that the statistic in equation (34) is a wideband extension of the single-frequency FK definition that assumes uncorrelated frequency components and is frequently used in practical array operations [Kvaerna and Doornbos, 1986;
28 Kennett, 2002]. Thus, this wideband FK algorithm makes the same assumptions about independence of distinct frequency bands that we have made in defining our matched field processing algorithm. It is common to calibrate FK analysis by introducing corrections for vector slowness estimated from (34) over the observation band using collections of ground truth events (see e.g. Schweitzer, 2001; Gibbons et al., 2009). Gibbons et al. (2009) in particular demonstrate that calibrations of refraction can improve the ability of small-aperture arrays to distinguish events from closely-spaced mines. A fair comparison of FK analysis and matched field processing should include FK slowness corrections. We estimate slowness corrections in our analysis by selecting the slowness to maximize the FK energy estimate for a particular source using the ensemble covariance matrices estimated for that source: max (35) Subsequently we use s instead of the slowness vector predicted by the great circle path to generate plane wave steering vectors, when we speak of calibrated FK analysis. It is instructive to visualize the plane wave steering vector and its empirical matched field counterparts to understand why matched field processing performs so well. It is reasonable to expect that, since FK analysis generally is successful at low frequencies, the empirically-derived steering vectors should reproduce their plane-wave counterparts in the frequency band where arrays are considered coherent. This expectation is largely fulfilled, as we will show. However, the empirical steering vectors depart dramatically from their plane wave counterparts as frequency increases.
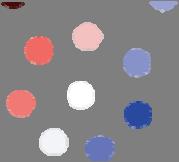
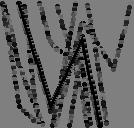
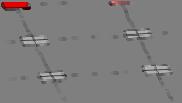
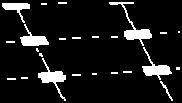
29 Figure 6 introduces our visualization approach. The elements of the steering vectors are complex numbers characterized by a magnitude and a phase. In the figure, each element is rendered as a circular symbol at the map position of the corresponding physical array element, with symbol size proportional to the steering vector element magnitude and color keyed to the phase. In the plane wave model, these elements have uniform magnitude and the phase is obtained by projecting the vector representing the array element location onto the slowness vector (Figure 6 left). In the plane wave case phase is constant in planes perpendicular to the direction of wave travel (Figure 6 right). Figure 7 presents a panel of plane-wave steering vectors rendered as described in Figure 6. This panel compares the steering vectors for each of the ten mines in each of seven different frequency bands ( [10, 15, 20, 25, 30, 35, 40] ), which are the bands highlighted in blue in Figure 3. The steering vectors have been optimized by the slowness calibration of equation (35). The principal lesson of Figure 7 is that, even with slowness corrections, the steering vectors do not vary significantly among the mines. Variation among the steering vectors is negligible for the lowest frequency (3.125 Hz) displayed, but does not increase very much as frequency increases even to 12.5 Hz. At 12.5 Hz there is noticeable variation between the Olenegorsk and Khibiny groups but minor variations among individual mines within those two groups. This observation suggests that FK analysis of the Pn phase, even with calibrations, will not provide a reliable means to distinguish events from these ten sources. The empirical steering vectors are estimated as the principal eigenvectors of ensemble covariance matrices (equations 29 and 30) for each of the mines. This calibration approach assumes that the eigenspectra of the covariance matrices are dominated by a single eigenvalue, so that the covariance matrix is well approximated by the outer product of the associated
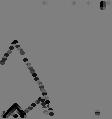
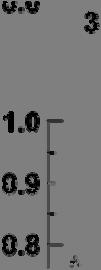
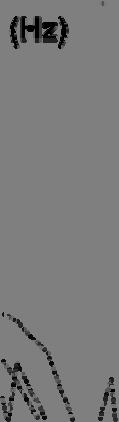
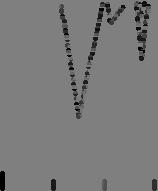
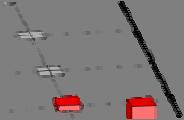
30 principal eigenvector with itself (equation 19). Figure 8 shows the proportion of energy in the eigenspectrum concentrated in the largest eigenvalue for each of the ten mines as a function of frequency band. Below 7 or 8 Hz a single eigenvalue does dominate. For the Olenegorsk group of mines, the largest eigenvalue accounts for at least 60% of the energy even to 12.5 Hz. The Khibiny group shows a different behavior, with a sharp drop in concentration of energy in the largest eigenvalue above 7 Hz. But the largest eigenvalue still accounts for at least 40% of the energy at 12.5 Hz. Steering vectors comparable to those displayed in Figure 7, but obtained empirically from the estimated ensemble covariance matrices are displayed in Figure 9. Two features of these data are notable: there is a great deal more variability among the empirical steering vectors than among their theoretical plane wave counterparts and the amplitudes of elements comprising the vectors are significantly non-uniform. At Hz, the steering vectors are largely homogeneous among all of the mines, indicating a desirable reproducibility of our data reduction techniques and the consistency one would anticipate at low frequencies where the effects of scattering are less pronounced. As the frequency increases, the variation among the mines increases dramatically. In the next two higher bands displayed ( and 6.25 Hz) the two mine groups are individually homogenous, but variations between groups are significant. As the frequency increases above 7 Hz, variations among the mines within each group become increasingly significant until the phase patterns appear almost random at 12.5 Hz. The high degree of heterogeneity in these steering vectors suggests that empirical matched field processing should perform well to resolve events originating at these mines. The degree of variation in magnitude from sensor to sensor is notable, suggesting focusing effects in wave propagation.
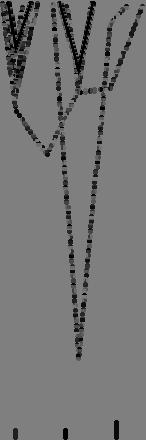
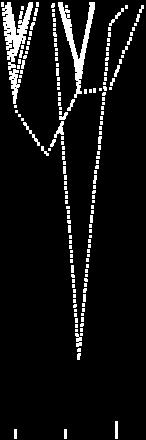
31 We interpret these results as the effects of scattering, which become more pronounced as frequency increases. We speculate that the scale length of heterogeneities affecting scattering becomes significantly less than the separations between mines in the two groups at the higher frequencies analyzed. Ultimately variations between mines within one of the two groups can become as large as variations between (the more distant) groups. One way to determine whether empirical steering vectors reproduce plane wave steering vectors is to examine the inner product between empirical and plane wave (theoretical) vectors: (36) Since both empirical and theoretical steering vectors have been normalized to unit length, the magnitude of the inner product must range between 0 and 1, approaching 1 if the vectors are similar. Figure 10 shows this comparison for the ten mines, with generally high similarity between theoretical and empirical steering vectors below 7 Hz, and low similarity above that frequency. The two groups of mines behave quite differently. The variability in the inner product is remarkably small among the Khibiny mines below 7 Hz but large among the Olenegorsk group. In general, however, the calibration process for steering vectors does tend to reproduce plane wave vectors at low frequencies where regional arrays are considered to operate coherently and where FK analysis typically is employed successfully. It is instructive to examine another measure of geographic resolution offered by the processing techniques. The ambiguity function [Baggeroer et al. 1993], (37)
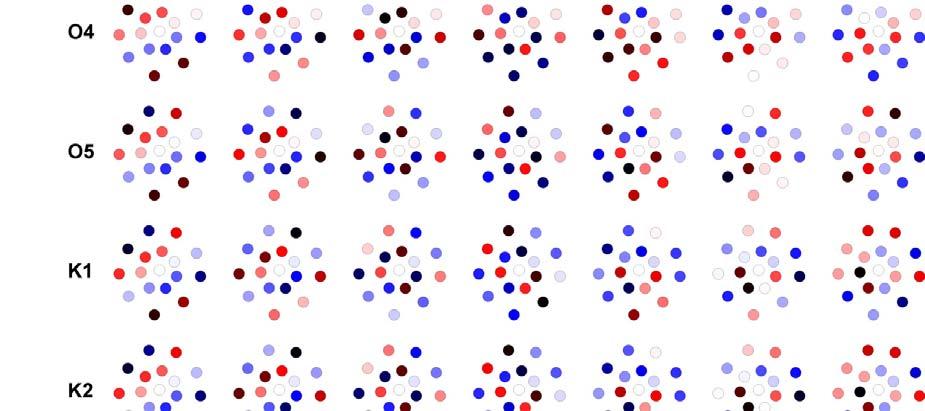
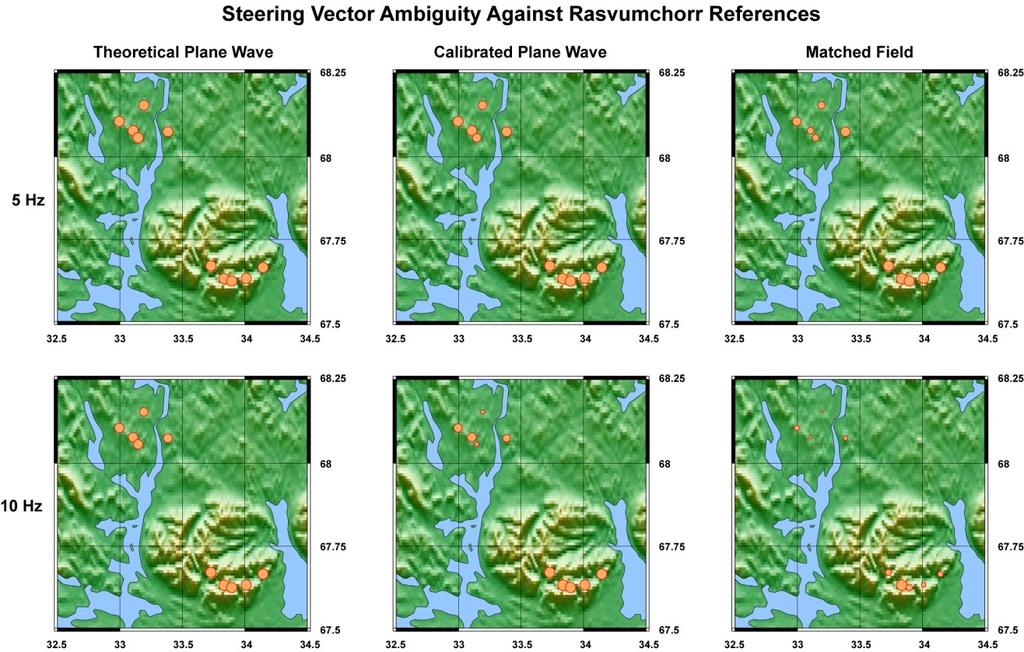
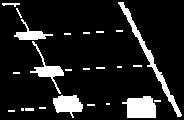
32 measures the degree of similarity between steering vectors. For perfectly resolved sources, the ambiguity function is a Dirac delta function:,. To obtain a sense of geographic resolution, a reference point can be selected, for example and the ambiguity function can be mapped against other geographic points. The theoretical ambiguity function assuming plane wave propagation is contoured at three different frequencies in Figure 1 using Rasvumchorr as the reference. Figure 11 plots the ambiguity functions evaluated at each of the ten mines again using Rasvumchorr as the reference. The value of the ambiguity function is represented as a symbol at the geographic locations of the mines: symbol size is proportional to the ambiguity value. A matrix of six cases is shown: 2 different frequencies (5 and 10 Hz) and three different types of steering vectors. The first type (left) is the theoretical plane wave steering vector assuming slowness vectors determined from the great circle path from mine to the array and a nominal Pn velocity (8.0 km/sec) for the region. The second type (middle) is the plane wave steering vector with slowness corrections calibrated by the method of equation (35). The third type (right) is the matched field steering vector. At 5 Hz, only the matched field steering vectors appear to reject the Olenegorsk mines very well and none of the methods provides very unambiguous separation of Rasvumchorr from the other Khibiny mines. At 10 Hz, only the matched field method clearly rejects the other Khibiny mines.
33 Event classification results Our principal objective is to use matched field processing (equation 27) to determine the origins of events from the Olenegorsk and Khibiny mining regions using observations of the Pn phase with the ARCES array. We contrast the performance of this method with FK analysis (equation 35) with and without slowness corrections. For the two methods that require calibrations, we used a cross validation approach to avoid problems of circularity. We held one of the 549 events out, calibrated steering vectors using the remaining 548 events then used the calibrated steering vectors to classify the one reserved event. We iterated this procedure 549 times using each event in turn as the reserved event. In addition, since we make the claim that matched field processing should perform better than waveform correlation as a classifier (due to suppression of source time history variation), we also present the results of classification based upon correlation against reference waveforms for each of the mines. It is instructive to examine histograms of the classification statistics, i.e. the matched field or FK energy computed in the 33 bands ranging from 2.5 to 12.5 Hz. These statistics are normalized in the manner of equation (28) to represent energy capture for each of the processing methods. Figure 12 summarizes these histograms for the 52 explosions of the Olenegorsk mine (O2). The figure shows 10 histograms for each of the three processing options. Each of the 10 histograms corresponds to a particular hypothesis about the mine of origin. The leftmost column of the figure shows the energy capture distributions for FK analysis using plane wave steering vectors constructed from theoretical (great circle) back azimuths. There is very little difference among the distributions, which are clustered around energy capture, except that the distributions for the 5 Olenegorsk mine hypotheses are shifted to slightly higher values than those of the corresponding 5 Khibiny hypotheses.
34 The center column of the figure presents the results for the FK algorithm with slowness corrections. The corrections clearly improve the separation of the distributions under the Olenegorsk hypotheses from the Khibiny distributions. However, the distribution under the O2 hypothesis is not significantly distinct from the O1 and O3-O5 distributions. The matched field processing results are summarized in the third column. With matched field calibrations the separation of the O2 distribution from the other distributions is dramatic. It is apparent that a value of a matched field statistic above 0.5 is a clear indication that the event in question originates at O2, and a value in the range below 0.4 (assuming origination at the other mines) indicates that the event occurred elsewhere. In contrast, for the two FK methods, the energy capture statistic under hypothesis of origination at one mine, considered in isolation, does not impart much information about the source. The FK statistics have means that are separated by less than a standard deviation. However, since the FK statistics are used in a multiple hypothesis test, classification performance generally is better than might be expected when considering the behavior of a single statistic. The FK statistic under the correct hypothesis, though low, need only be larger than the other nine statistics. The distributions of these statistics are functions of the number of observing sensors and the bandwidth of the signals. Generally, the statistics will shift to the right as the number of sensors or the bandwidth decreases, increasing the probability of misclassifications. Indeed, the matched field and FK statistics are identically one in the extreme case of a single sensor, demonstrating, trivially, that these methods require an array or network for application.
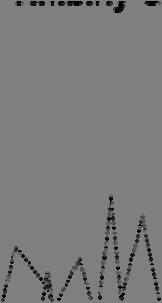
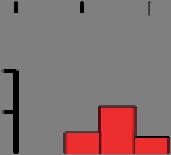
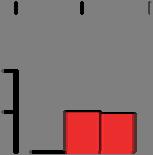
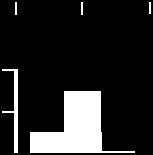
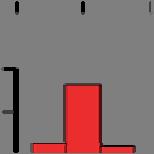
35 The results of classifying the 549 events from all mines are summarized in Figure 13. This figure has three parts, one for each processing approach. The top part summarizes the classification results for the FK method with no corrections. It consists of 10 histograms, one stacked behind the other showing the frequency of classification for the events of each mine under each of the 10 hypotheses about event origin. A perfect result would show a diagonal of filled bins containing all of the events correctly attributed to their origins. For this method (labeled theoretical plane wave ), the majority of events are incorrectly assigned to one mine, the Rasvumchorr mine (K2). We attribute this behavior to the fact that observed Pn backazimuths are biased clockwise (to the south) and the K2 mine is the southernmost of all the mines. Consequently, the steering vectors for this mine present the best fit to the refracted wavefields. The middle part (labeled empirical plane wave ) summarizes results for the FK method with slowness corrections. The slowness corrections presumably remove gross biases in azimuth and the classification performance is significantly better. Few errors are made between the two mining groups, which is consistent with other results obtained with wideband FK analysis [Gibbons et al., 2009]. Within the Olenegorsk group, classification results are correct more often than not. But classification performance for mines within the more distant Khibiny group is not good, representing a more nearly uniform (random) assignment of events to originating mines. We interpret this result to indicate that the separations of these mines are below the resolution limit of the array, even at 12.5 Hz, and that coherent processing based on a plane wave model is not possible in the higher frequency bands.
36 The bottom part (labeled matched field ) summarizes the matched field processing classification results. Matched field processing identifies the sources of the explosions with a high degree of reliability (98.2%, 539 of 549 events correctly identified). We have suggested that matched field processing should perform better than waveform correlation in distinguishing closely spaced sources due to the dependence of the latter method on the repeatability of the fine temporal structure of the waveforms. This latter condition requires that everything be the same from event to event the source location, the source mechanism (in the sense of moment tensor) and the source time history. We anticipate that matched field processing would reduce the dependence on the last of these three requirements (but still be sensitive to source mechanism). We test this hypothesis by performing a last classification of the event ensembles by waveform correlation against reference signals for each of the mines. Our approach was to select one event at random from each of the mines as the reference providing the classification template. Each of the other 539 events from the ensembles was then correlated against the ten reference events representing the sources 1,,10 and the classified by maximizing the correlation. Because the observed waveforms are array records, the relevant measurement was the vector correlation: max (38) Here represents the vector signal for the unknown event and the are the reference event waveforms. We maximize the absolute value of the correlation so as to allow sign differences and over a large range of time delays to account for any errors of registration (time
37 alignment) among the events. We used an 8 second window around the Pn phase, consistent with the latter 8 seconds of the window shown in Figure 4 and filtered the data into the Hz band to make the bandwidth of the measurement consistent with the FK and matched field results. Because the results might be biased by a chance poor selection of reference events, we performed 10 trials with different reference events and averaged the results. The results of this classification technique are shown in Figure 14. We see that it performs well in separating the Olenegorsk mines from each other and from the Khibiny group, but not well in separating the mines of the Khibiny group. This pattern is consistent with the calibrated FK method and matched field processing, which also have the bulk of their errors in the Khibiny group (which is more distant and in which the mines are somewhat closer together). The performance of this correlation classifier is better than either of the FK methods but not as good as matched field processing. Since the principal difference between waveform correlation on an array and matched field processing is the independent treatment of frequency bands (equations 24-26), we infer that matched field processing is more successful because it does not depend on the fine temporal structure of the signals, but rather the spatial structure of the signals in each frequency band. Array waveform correlation exploits both temporal and spatial structure of the signals and is subject to model mismatch when temporal structure is not calibrated. Discussion and Conclusions Matched field processing with empirically-calibrated steering vectors reliably identifies the origins of explosions in the Khibiny and Olenegorsk mines using just observations of the Pn phase made with the ARCES array. This result is remarkable because conventional considerations of array resolution (Rayleigh limit) suggest that poor performance should be
38 expected. Indeed our comparison with a conventional broadband FK algorithm, even with slowness corrections, indicates that algorithms that rely upon a plane wave model perform in a manner consistent with expectations. The matched field results appear to be a consequence of the rich scattering environment for wave propagation in the crust and upper mantle. The mines are too closely spaced (just tenths of a degree apart in azimuth) to be resolved under free space propagation conditions, which would offer only direct-path propagation. The highly heterogeneous environment creates multipath propagation, which produces an apparently disorganized phase and amplitude structure across the array aperture (Figure 9) that may be calibrated with observations of previously-recorded events. This structure appears to be sufficiently repeatable from event to event to allow an algorithm which exploits that structure to identify closely-spaced sources reliably. We speculate that the explosions in the Kola peninsula may illuminate a field of scatters over a much larger angle, when observed by ARCES, than that subtended by the mining region itself (~ 5 degrees), and perhaps larger than the classical resolution limit. We suggest that explosions at the 10 mines illuminate the field of scatterers in unique patterns, depending on their positions within that field, and that the seismic wavefields scattered toward the array across the broad scattering aperture differ significantly among the mines. This interpretation is consistent with techniques in cellular telephony widely used to increase channel capacity with antenna arrays in a rich scattering environment [Foschini and Gans, 1998; Simon et al., 2001; Moustakas et al., 2000]. In this view, empirical matched field processing operates by calibrating the detail of refracted and scattered wavefield structure across the array aperture, leading to superior performance in distinguishing the sources.
39 In our development and analysis of results, we have presumed that each mine can be characterized as a point source dominated by one particular (moment tensor) mechanism, but with significant variation in source time histories (for example, caused by timing variations in shot patterns). This view appears consistent with the concentration of eigenspectrum energy in a single eigenvalue below 7-8 Hz (Figure 8). The rapid decline in concentration of the eigenspectrum above this frequency among the Khibiny mines suggests that the sources are more complicated. A more realistic interpretation may be that the sources are heterogeneous (distributed, with varying mechanisms) on a scale that is not resolvable at long wavelengths, but becomes increasingly apparent as frequencies increase and wavelengths become shorter. The significant difference in behavior between the Khibiny and Olenegorsk groups may relate to the very different topography surrounding the two mining groups. The Khibiny group is in a mountain range with significant topography. By contrast, the Olenegorsk group is in a region with much less vertical relief. It seems possible that scattering from surface topography is much greater around the Khibiny mines, and which tends to make the heterogeneity of these sources visible when the wavelength becomes short compared to the dimensions of the mines. At 7-8 Hz, the Pn wavelength is approximately 1 kilometer, which is consistent with the dimensions of the mines and the scale of topographic variations in the Khibiny Massif. In this view, the Olenegorsk mines may actually be more heterogeneous sources than the Khibiny mines (the concentration of their eigenspectra is lower at low frequencies), but they do not experience the same spread in the eigenspectrum at high frequencies because their flatter, more homogeneous environment scatters the wavefield less. In this paper we have emphasized that matched field processing appears to be relatively insensitive to source time history variations when compared with waveform correlation, and that
40 both methods are sensitive to source mechanism variations. However, it may be that matched field processing is not very sensitive to variations in the moment tensor as well. If variations in source mechanism principally affect the amplitude radiation pattern, they may change the degree of illumination, but not the timing of reflections from the field of scatterers. Although the amplitude ratios between the direct and the scattered waves vary, the consistent timing of reflections would contribute to a stable phase structure of the incident wavefield across the array aperture. We expect that the matched field statistic is most sensitive to this phase structure. Since both matched field processing and waveform correlation methods calibrate the spatial structure of the signal, these methods may enable coherent processing at frequencies or station separations considered too large for coherent methods under a plane wave model. This observation suggests that there may be no limit to the size of the aperture over which coherent processing may be attempted. With empirical calibration, observing networks that were deployed with only incoherent processing methods in mind might be used in a coherent processing framework. The basic technique we describe in this paper can be extended in several useful ways. The idealization of the source as a single point force can be relaxed to allow more heterogeneous sources modeled by a number of independent point forces. Changing the signal model to acknowledge source heterogeneity requires the signal covariance matrices to have ranks greater than one. The empirical matched field calibration can be extended to use a collection of steering vectors extracted as the (now multiple) principal eigenvectors of the ensemble covariance matrix. The classification algorithm must be modified to maximize power over a subspace of steering vectors spanned by the collection of principal eigenvectors. This observation provides additional justification for the use of event ensembles to estimate
41 covariance matrices, as the rank of an estimated matrix cannot exceed the number of events used in the estimate. The number of effective point sources comprising a heterogeneous source may be estimated as the number of significant (nonzero) eigenvalues of the ensemble covariance matrix. A second useful extension is to modify matched field processing to use more of the waveform than just the first arriving P phase, extending perhaps to the entire seismogram. This modification would entail use of the entire covariance function, and its eigendecomposition in a Kahunen-Loeve (KL) expansion [Van Trees, 1968] to develop matching fields that capture and use the time evolution of spatial structure. The narrowband decomposition still would be required to suppress the effects of a short, variable source time history, though it may not be desirable to treat distinct frequency bands as necessarily statistically independent. Sources that have more repeatable source time histories will have significant correlation among distinct frequency bands that can be characterized and exploited with a KL decomposition. Finally, though we have posed empirical matched field processing as a classification algorithm in this paper, the calibrations that it provides can equally well be used to improve beamforming operations for event detection. If successful, such a use of these calibrations may extend array beamforming operations to higher frequencies and larger apertures than are normally considered coherent under a plane wave assumption. This use of empirical matched field processing concepts and the KL decomposition to represent the entire seismogram are subjects of current research.
42 References Aki, K. and P. G. Richards, 1980, Quantitative Seismology, Vol. 2, W. H. Freeman and Co., San Francisco. Baggeroer, A. B., Kuperman, W. A., and Mikhalevsky, P. N., 1993, An overview of matched field methods in ocean acoustics, IEEE Journal of Oceanic Engineering, vol. 18, number 4, Bucker, H. P., 1976, Use of calculated sound fields and matched field detection to locate sound sources in shallow water, Journal of the Acoustical Society of America, volume 59, number 2, Capon, J., 1969, High resolution frequency-wavenumber spectrum analysis, Proceedings of the IEEE, volume 57, number 8, Crochiere, R., 1980, A weighted overlap-add method of short-time Fourier analysis/synthesis, IEEE Trans. on Acoustics, Speech and Signal Processing, volume ASSP-28, number 1, Fialkowski, L. T., Collins, M. D., Kuperman, W. A., Perkins, J. S., Kelly, L. J., Larsson, A., Fawcett, J. A., and Hall, L. H., 2000, Matched-field processing using measured replica fields, Journal of the Acoustical Society of America, volume 107, number 2, Foschini, G. J. and M. J. Gans, 1998, On limits of wireless communications in a fading environment when using multiple antennas. Wireless Personal Communications 6 (3): Franks, L. E., 1981, Signal Theory, Dowden and Culver, Inc., Stroudsburg, PA, Gibbons, S. J. and Ringdal, F., 2006, The detection of low magnitude seismic events using array-based waveform correlation, Geophysical Journal International, volume 165,
43 Gibbons, S. J., Sorensen, M., Harris, D. B., Ringdal, F., 2007, The detection and location of low magnitude earthquakes in northern Norway using multichannel waveform correlation, Physics of the Earth and Planetary Interiors, volume 150, number 3-4, Gibbons, S. J., T. Kvaerna and F. Ringdal, 2009, Considerations in phase estimation and event location using small aperture regional seismic arrays, Pure and Applied Geophysics, accepted for publication Harris, D. B., 1991, A waveform correlation method for identifying quarry explosions, Bulletin of the Seismological Society of America, volume 81, Hauksson, E. and Shearer, P., 2005, Southern California hypocenter relocation with waveform cross-correlation, Part 1: Results using the double-difference method, Bulletin of the Seismological Society of America, volume 95, Israelsson, H., 1990, Correlation of waveforms from closely spaced regional events, Bulletin of the Seismological Society of America, volume 80, Johnson, D. H. and Dudgeon, D. E., 1993, Array Signal Processing: Concepts and Techniques, Prentice Hall. Kennett, B.L.N., 2002, The Seismic Wavefield. Volume II: Interpretation of Seismograms on Regional and Global Scales, Cambridge University Press. Kværna, T. and Doornbos,D.J, 1986, An integrated approach to slowness analysis with arrays and three-component stations, NORSAR Scientific Report: Semiannual Technical Summary No /1987, NORSAR, Kjeller, Norway. pp
44 Moustakas A. L., H. U. Baranger, A. M. Sengupta, L. Balents and S. H. Simon, 2000, Communication through diffusive media: coherence and capacity, Science, vol. 287, p Mykkeltveit, S., Aastebol, K., Doornbos, D. J., and Husebye, E. S., 1983, Seismic Array Configuration Optimization, Bulletin of the Seismological Society of America. 73, Oppenheim, A. V. and R. W. Schafer, 1975, Digital Signal Processing, Prentice Hall, Englewood Cliffs, New Jersey. Portnoff, M. R., 1980,Time-frequency representation of digital signals and systems based on short-time Fourier analysis, IEEE Trans. on Acoustics, Speech and Signal Processing, volume ASSP-28, number 1, Schaff, D. P., and Richards, P. G., 2004, Repeating seismic events in China, Science, volume 303, Schaff, D. P. and Waldhauser, F., 2005, Waveform cross-correlation-based differential traveltime measurements at the Northern California Seismic Network, Bulletin of the Seismological Society of America, volume 95, Schweitzer, J., 2001, Slowness corrections one way to improve IDC products, Pure and Applied Geophysics, volume 158, Simon S. H., A. L. Moustakas, M. Stoytchev and H. Safar, 2001, Communication in a disordered world, Physics Today, pp Van Trees, H. L., 1968, Detection, Estimation, and Modulation Theory, Part I. Wiley, NewYork.
45 Van Trees, H. L., 2002, Detection, Estimation, and Modulation Theory, Part IV: Optimum Array Processing, Wiley-Interscience, New York. Waldhauser, F. and Ellsworth, W. L., 2000, A double-difference earthquake location algorithm: Method and application to the northern Hayward Fault, California, Bulletin of the Seismological Society of America, volume 90, Acknowledgements This work performed under the auspices of the U.S. Department of Energy by Lawrence Livermore National Laboratory under contract DE-AC52-07NA27344 and NORSAR under contract DE-FC52-05NA The authors thank Steve Myers, Bill Walter and Frode Ringdal for their help and suggestions, and Jerry Sweeney for his careful review of the manuscript. The authors also thank three anonymous reviewers for their careful reviews and comments which significantly improved the manuscript.
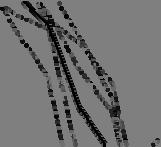
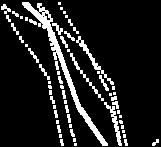
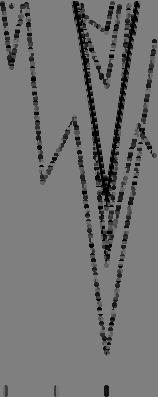
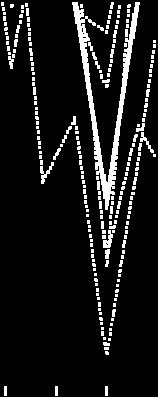
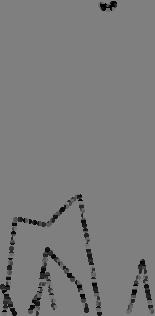
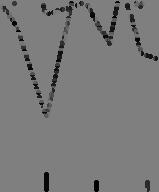
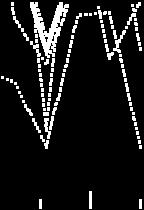
46 Figure Legends Figure 1 The mines of the Khibiny and Olenegorsk regions are too close for explosions to be attributed to specific mines on the basis of wavenumber (FK) spectrum direction estimates made from ARCES array (upper left) observations of Pn waves (Figure 2). ARCES resolution is indicated on the map at lower left, which shows the half-power contours of the array response at three frequencies when the array is steered to the Rasvumchorr mine (K2). Figure 2 Recordings of 7 explosions conducted at the Rasvumchorr mine (see Figure 1) made at an in-mine station (upper left) and the ARCES array center element (bottom, upper right) demonstrate that the regional seismic signal is the convolution of a short excitation and a prolonged Green s function. The great variability of the signals seen near the source and the common path to the observing station suggest the array signal can be modeled as the convolution of brief stochastic forcing functions with long-duration, deterministic Green s functions. Consequently, the spatial structure of the signal is deterministic (but unknown), even if the time history is a random process. Figure 3 The real parts of the first 10 impulse responses (top) and amplitude frequency responses (bottom) for the bank of narrowband filters defined in equation (11). Seven individual bands are highlighted in blue and the sum of 33 bands in the range Hz is shown in red. Figure 4 Signals recorded by the ARCES station ARA0 (the array center element) for the ensemble of events used to calibrate the Norpakh mine (K5). Note the first-arriving P waves (see inset) show a high degree of time history variation. Figure 5 This figure shows the matrix of inter-element and inter-band coherence of the Pn phase for the 17-element subarray of the ARCES shown in Figure 1. The coherence has been
47 computed here for explosions at the Kirovsk mine, using 114 events. The image consists of blocks each representing a distinct pairing of 33 different frequency bands (the labels on the axes represent frequency). Each block is a matrix of correlations among the elements of the ARCES array. The fact that the matrix is approximately block diagonal is evidence that the 33 frequency bands chosen for our analysis are approximately uncorrelated. Figure 6 This figure introduces a method for visualizing steering vectors that is used subsequently in Figures 7, 9, 11 and 12. The steering vector (right) can be visualized by plotting a symbol at each array sensor location. The size of the symbol is proportional to the magnitude of the steering vector element corresponding to the sensor. The color of the symbol encodes the phase. The example shown here is for a plane wave incident on the array from the southeast; the amplitudes are uniform and the phase increases linearly with distance along the direction of wave travel. The phase is calculated from the geometry shown at left: the phase is proportional to the vector offset of a sensor projected onto the slowness vector defining the direction and velocity of travel. Figure 7 Plane wave steering vectors in 7 frequency bands (highlighted in blue in Figure 3) for all 10 mines are rendered here with the method described in Figure 6, and show that theoretical plane wave steering vectors vary little among the mines. The slowness for each mine has been optimized to fit the data (maximize the ensemble FK spectrum) over the Hz frequency band (equation 36). Figure 8 At all frequencies, the ensemble covariance matrices have a large fraction of their eigenspectrum energy concentrated in a single eigenvalue. The two plots show the fraction of eigenspectrum energy present in the largest eigenvalue as a function of frequency for the 5
48 Khibiny mines (top) and the 5 Olenegorsk mines (bottom). The light lines depict the concentration of eigenspectrum energy for individual mines and the dark lines depict mining group averages. Figure 9 Empirical (matched field) steering vectors are depicted here in the same manner as in the Figure 7, allowing direct comparison. Note the variability among the mines (vertical direction) which increases at high frequencies. Steering vectors diverge substantially above 8 Hz. Figure 10 Plots of the inner products (equation 37) of theoretical and empirical steering vectors show that, at low frequencies, the matched field calibration process largely reproduces the theoretical plane wave steering vectors. At high frequencies deviation increases demonstrating the breakdown of the plane wave model. The inner products for individual mines are shown as light lines; averages for each mining group are depicted with heavy lines. Mines of the Khibiny and Olenegorsk groups behave differently, but both show poor matches between measured and theoretical steering vectors above 8 Hz. Figure 11 This figure shows the increase in resolution obtained with empirical matched field steering vectors. The quantity displayed is the ambiguity function, the inner product between steering vectors at each mine and the corresponding reference steering vector at the Rasvumchorr mine. The ambiguity value is rendered as symbol size (area) at the geographic location of each mine. Ambiguity functions for three different types of steering vectors are shown at each of two frequencies: 5 and 10 Hz. The theoretical plane wave function results from steering vectors calculated from great circle path azimuths and a fixed phase velocity of 7.8 km/sec. The calibrated plane wave function results from fitting the best plane wave to the data over the 2.5-
49 12.5 Hz band. The matched field function has much greater resolution which results from steering vectors extracted as the principal eigenvectors of covariance matrices for each mine in the two frequency bands. Figure 12 Distributions of the matched field processing classification statistic (right) for the Olenegorsk (O2) mine population of 52 events under the 10 hypotheses about originating source (indicated at left) separate O2 unambiguously from the other mines. Frequency distributions for the theoretical (great-circle path) plane wave FK classifier (left) are ambiguous. Distributions for the plane wave FK classifier with slowness corrections (middle) show slightly improved separation between the two mining groups. Figure 13 Classification results for 549 events show that the theoretical plane wave (FK without corrections) spectrum (top) is unable to resolve the mines, as expected. The FK algorithm with corrections (middle) largely separates the Olenegorsk group from the Khibiny group, and begins to distinguish individual mines. The matched field method (bottom) separates all mines with a high degree of reliability (98.2%). Figure 14 Classification results for the event ensembles using waveform correlation against reference events from each mine show better performance that either of the FK methods, but performance which is not as good as matched field processing. This result is consistent with the expectation that waveform correlation techniques are hampered by the kind of waveform variability evident in Figure 4.
50 Tables Table 1 Number of events at each mine observed by the ARCES, together with distance and backazimuth to each mine Mine () ARCES Distance ARCES Backazimuth Number of explosions ( ) Kirovogorsk Olenegorsk Oktjabrsk Bauman Komsomolsk Kirovsk Rasvumchorr Central Koashva Norpakh
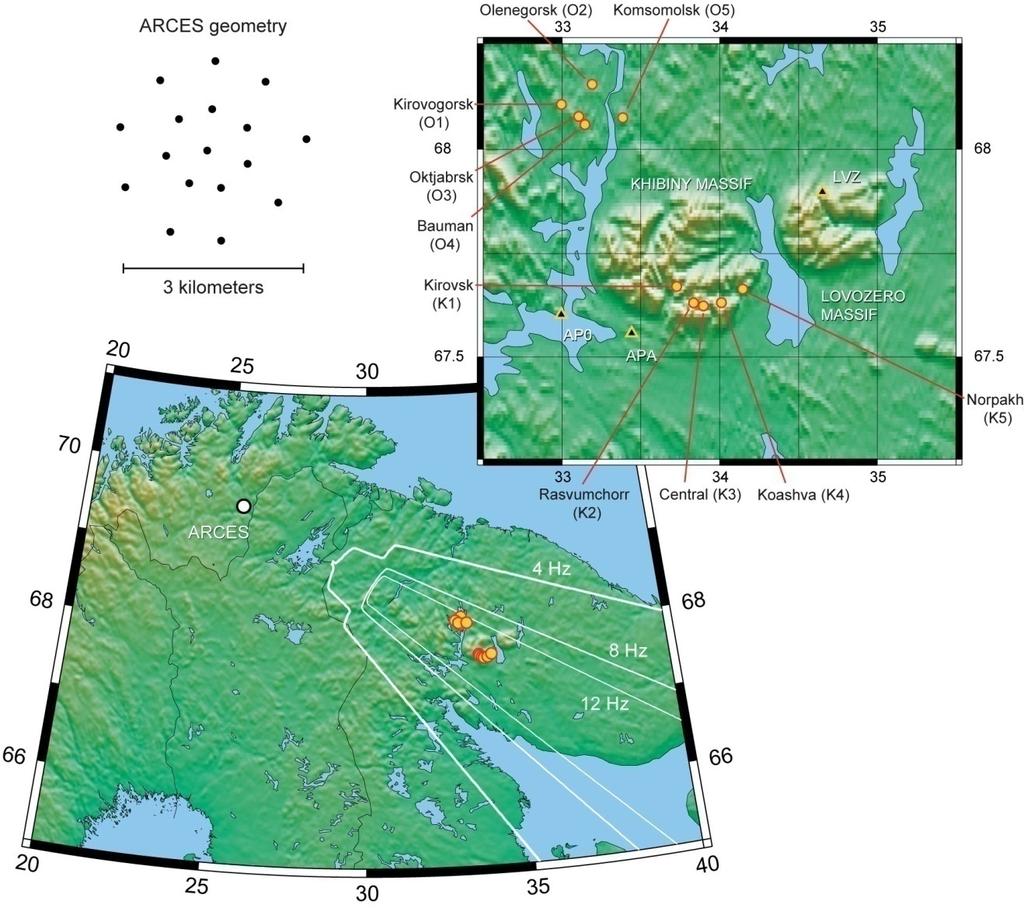
51 Figure 1
52 Figure 2 F
53 Figure 3
54 Figure 4


55 Figure 5 F
56 Figure 6
57 Figure 7


58 Figure 8
59 Figure 9


60 Figure 10
61 Figure 11


62 Figure 12
63 Figure 13
64 Figure 14
65 Appendix A. Constructing a Bank of Bandpass Filters from a Lowpass Prototype In equation (11) we describe a collection of bandpass filters designed as frequency translations of a lowpass prototype filter: ; 2 Φ (11) The bandpass filter is obtained by modulating the impulse response of the lowpass filter by a complex exponential function with frequency. To demonstrate this point, note that the frequency response of the bandpass filter is obtained by: Φ (A.1) With an integer, 0, 1, 2, and Φ defined as in (11), it is clear that the sum of all such bandpass filters is unity: 1 (A.2)
66 This property gives us the fidelity constraint (equation 10) allowing reconstruction of the original signal from its narrowband components. Equation (12) presents an alternative interpretation of the filtering operation with one of these narrowband filters: (12) The quantity in square brackets within the integral corresponds to demodulating the signal (shifting it to the left, i.e. downward, in frequency), where it is then filtered by the lowpass prototype filter. The lowpass filter effectively snips out the portion of the signal in the band 2, now situated around 0, and the final multiplication by returns the narrowband component to its proper place in the spectrum (centered at ). In practice, the data are discrete time series and the ideal baseband prototype filter must be approximated, which we do with a finite-duration impulse response (FIR) digital filter. It can be shown [Portnoff, 1980] that the fidelity constraint (equation 10) can be met exactly with a baseband filter that satisfies ; 1, 2, (A.3) Here, is the number of frequency bands used in the filterbank. The rest of the coefficients of the filter are chosen to approximate the response of the ideal lowpass filter. We elected to use a windowing design with a raised cosine (Hamming) taper [Oppenheim and Schafer, 1975]: cos ;,,, (A.4)
67 which satisfies the constraints of (A.3). The parameter controls the fidelity of the digital filter to the ideal lowpass response indicated in equation (11). Larger values of produce a sharper filter, and tend to suppress the bias we describe in the text. For the particular choices we made ( 2, 128) the baseband impulse response is as shown in the top trace in Figure 3. The real parts of the successive nine higher passband impulse responses are shown beneath it. Since the data in our examples are sampled 40 times per second, the 128 bands are distributed over a finite bandwidth of 40 Hz; consequently, the width of each narrowband component is Hz. modulation: The digital bandpass filters are created from the baseband filter by the discrete-time ; 2 1,, 2 (A.5) With this choice of filters and a power of 2, a particularly efficient FFT implementation is available for calculating samples of the complex envelopes [Portnoff, 1980; Crochiere, 1980]. Details of the implementation are beyond the scope of this paper.
68 Appendix B. Representation of Short-Duration Signals from Single Envelope Samples In our mathematical background we asserted that short-duration signals could be represented by single samples (one per band) of their complex envelopes (equation 16). In this appendix, we show examples of reconstruction of signals from single samples of their complex envelopes to provide a sense of the limitations of this approximation. Inserting the single-sample approximation of equation (16) into equation (14), we see that the envelope in one particular band is approximated by: 0 (B.1) Combining this approximation with equations (10) and (12): 0 (B.2) We see that this approximation leads to the short-duration signal being represented by a Fourier series (in brackets) windowed by the impulse response of the baseband filter used as the kernel of the narrowband filterbank. Figure B1 shows the impulse response of the baseband filter (blue) superimposed upon a series of short-duration signals of increasing duration. The top signal is a zero-duration signal (impulse). The second signal is a one-half second segment of a sample function from a zeromean Gaussian random process, and subsequent signals are segments of the same realization with durations increasing in one-half second increments. The original signals are indicated in black, and their approximations (equation B.2) are shown in red.
69 Figure B2 provides greater detail of the approximations. These show that the impulse is reconstructed exactly from single samples of its narrowband envelopes and the signal with ½ second duration is very well approximated. The approximation begins to deteriorate when the duration reaches one second, and clearly is unacceptablee for longer signals. This example suggests that the assertion of equation (16) is valid so long as the duration of the signal being represented is less than approximately. Figure B1 An example of reconstruction of short-duration signals demonstratess the limitations of the approximation of wideband signals by single samples of their complex envelopes. The baseband impulse response of the filterbank is shown in blue at top and a succession of signals of increasing duration (black) and their approximations by equation (B.2) (red) is shown beneath it. Figure B2 compares the signals and their approximations in greater detail.

70 Figure B2 Reconstruction of short-duration signals is very good, but deteriorates as the duration increases. Original signals are shown in black and their reconstructions from single samples of their complex envelopes are superimposed in red. The top trace shows an impulse (zero duration) ), for which reconstructio on is perfect. Each succeeding trace shows signals of increasing duration starting with one-half second (second trace) and increasing by one-half second for each step downward. The reconstruction of the signal one-half second long is very good, and fair for the signal with one second duration. Longer signals are not well represented.
1Form Approved. O5e. REPRINT 4. TITLE AND SUBTITLE Sa. CONTRACT NUMBER EXPANDING COHERENT ARRAY PROCESSING TO LARGER APERTURES FA C-0007
 1Form Approved REPORT DOCUMENTATION_PAGEjOMB No. 0704-0188 Public reporting burden for this collection of information is estimated to average 1 hour per response, including the time for reviewing instructions,
26th Seismic Research Review - Trends in Nuclear Explosion Monitoring
 RESEARCH IN REGIONAL SEISMIC MONITORING Frode Ringdal 1, Tormod Kvaerna 1, Elena O. Kremenetskaya 2, Vladimir E. Asming 2, Sergeij Kozyrev 2, Svein Mykkeltveit 1, Steven J. Gibbons 1, and Johannes Schweitzer
SEISMIC CALIBRATION OF THE EUROPEAN ARCTIC
 SEISMIC CALIBRATION OF THE EUROPEAN ARCTIC Svein Mykkeltveit, Frode Ringdal, Conrad Lindholm, NORSAR Elena Kremenetskaya, Kola Regional Seismological Centre Sponsored by U.S. Department of Energy Office
28th Seismic Research Review: Ground-Based Nuclear Explosion Monitoring Technologies
 BASIC RESEARCH ON SEISMIC AND INFRASONIC MONITORING OF THE EUROPEAN ARCTIC Frode Ringdal, Tormod Kværna, Svein Mykkeltveit, Steven J. Gibbons, and Johannes Schweitzer NORSAR Sponsored by Army Space and
Analysis of the 29th May 2008 Ölfus earthquake and aftershock sequence using three-component t processing on ICEARRAY
 Analysis of the 29th May 2008 Ölfus earthquake and aftershock sequence using three-component t processing on ICEARRAY Benedikt Halldórsson Steven J. Gibbons International Symposium on Strong-motion Earthquake
27th Seismic Research Review: Ground-Based Nuclear Explosion Monitoring Technologies
 GROUND TRUTH COLLECTION FOR MINING EXPLOSIONS IN NORTHERN FENNOSCANDIA AND NORTHWESTERN RUSSIA Dave B. Harris 1, Frode Ringdal 2, Elena O. Kremenetskaya 3, Svein Mykkeltveit 2, Donald W. Rock 1, Nils Maercklin
Improvements to Seismic Monitoring of the European Arctic Using Three-Component Array Processing at SPITS
 Improvements to Seismic Monitoring of the European Arctic Using Three-Component Array Processing at SPITS Steven J. Gibbons Johannes Schweitzer Frode Ringdal Tormod Kværna Svein Mykkeltveit Seismicity
PROJECT PROGRESS REPORT (03/lfi?lfibr-~/15/1998):
:") F?ECEVVEI) N% 05 w PROJECT PROGRESS REPORT (03/lfi?lfibr-~/15/1998): A COMPREHENSIVE STUDY OF FRACTURE PATTERNS AND DENSITIES IN THE GEYSERS GEOTHERMAL RESERVOIR USING MICROEARTHQUAKE SHEAR-WAVE SPLITTING
F?ECEVVEI) N% 05 w PROJECT PROGRESS REPORT (03/lfi?lfibr-~/15/1998): A COMPREHENSIVE STUDY OF FRACTURE PATTERNS AND DENSITIES IN THE GEYSERS GEOTHERMAL RESERVOIR USING MICROEARTHQUAKE SHEAR-WAVE SPLITTING
Let us consider a typical Michelson interferometer, where a broadband source is used for illumination (Fig. 1a).
.") 7.1. Low-Coherence Interferometry (LCI) Let us consider a typical Michelson interferometer, where a broadband source is used for illumination (Fig. 1a). The light is split by the beam splitter (BS) and
7.1. Low-Coherence Interferometry (LCI) Let us consider a typical Michelson interferometer, where a broadband source is used for illumination (Fig. 1a). The light is split by the beam splitter (BS) and
ADAPTIVE ANTENNAS. SPATIAL BF
 ADAPTIVE ANTENNAS SPATIAL BF 1 1-Spatial reference BF -Spatial reference beamforming may not use of embedded training sequences. Instead, the directions of arrival (DoA) of the impinging waves are used
[work in progress] Dave Harris. Tern Hauk
![[work in progress] Dave Harris. Tern Hauk](/thumbs/94/121711853.jpg "[work in progress] Dave Harris. Tern Hauk") UCRLJC- 12952 PREPRNT Can T Phases Be Used to Map Blockage? [work in progress] Dave Harris Tern Hauk Presented at the 1995 Monitoring Technologies Conference Westfields nternational Conference Center Chantilly,
UCRLJC- 12952 PREPRNT Can T Phases Be Used to Map Blockage? [work in progress] Dave Harris Tern Hauk Presented at the 1995 Monitoring Technologies Conference Westfields nternational Conference Center Chantilly,
Improving Regional Seismic Event Location Through Calibration of the International Monitoring System
 UCRL-JC-133019 PREPRINT Improving Regional Seismic Event Location Through Calibration of the International Monitoring System C.A. Schultz S.C. Myers M. Flanagan J. Swenson W. Hanley M. Pasyanos This paper
Applications of Pulse Shape Analysis to HPGe Gamma-Ray Detectors
 UCRL-JC- 134555 PREPRINT Applications of Pulse Shape Analysis to HPGe Gamma-Ray Detectors GJ. Schmid D.A. Beckedahl JJ. Blair J.E. Kammeraad This paper was prepared for submittal to the American Nuclear
INTEGRATING DIVERSE CALIBRATION PRODUCTS TO IMPROVE SEISMIC LOCATION
 INTEGRATING DIVERSE CALIBRATION PRODUCTS TO IMPROVE SEISMIC LOCATION ABSTRACT Craig A. Schultz, Steven C. Myers, Jennifer L. Swenson, Megan P. Flanagan, Michael E. Pasyanos, and Joydeep Bhattacharyya Lawrence
SEISMIC CALIBRATION OF THE EUROPEAN ARCTIC
 SEISMIC CALIBRATION OF THE EUROPEAN ARCTIC Svein Mykkeltveit, Frode Ringdal, Conrad Lindholm, NORSAR Elena Kremenetskaya, Kola Regional Seismological Centre Sponsored by U.S. Department of Energy Office
29th Monitoring Research Review: Ground-Based Nuclear Explosion Monitoring Technologies
 IMPROVING MAGNITUDE DETECTION THRESHOLDS USING MULTI-STATION, MULTI-EVENT, AND MULTI-PHASE METHODS David Schaff and Felix Waldhauser Lamont-Doherty Earth Observatory, Columbia University Sponsored by Air
Modified Kriging: Evaluation, Modification, Recommendations
 UCRL-ID- 12873 1 Modified Kriging: Evaluation, Modification, Recommendations and C.A. Schultz S.C. Myers September 1997 This is an informal report intended primarily forinternal or limited external distribution.
UPGRADED CALIBRATIONS OF THE THOMSON SYSTEM AT DIII D
 GA A23440 UPGRADED CALIBRATIONS OF THE THOMSON SYSTEM AT DIII D by B. BRAY, C. HSIEH, T.N. CARLSTROM, and C.C. MAKARIOU AUGUST 2000 DISCLAIMER This report was prepared as an account of work sponsored by
Plasma Response Control Using Advanced Feedback Techniques
 Plasma Response Control Using Advanced Feedback Techniques by M. Clement 1 with J. M. Hanson 1, J. Bialek 1 and G. A. Navratil 1 1 Columbia University Presented at 59 th Annual APS Meeting Division of
Stochastic Structural Dynamics Prof. Dr. C. S. Manohar Department of Civil Engineering Indian Institute of Science, Bangalore
 Stochastic Structural Dynamics Prof. Dr. C. S. Manohar Department of Civil Engineering Indian Institute of Science, Bangalore Lecture No. # 33 Probabilistic methods in earthquake engineering-2 So, we have
Analysis of Shane Telescope Aberration and After Collimation
 UCRL-ID- 133548 Analysis of Shane Telescope Aberration and After Collimation Before Don Gavel January 26,1999 This is an informal report intended primarily for internal or limited external distribution.
Performance Analysis for Strong Interference Remove of Fast Moving Target in Linear Array Antenna
 Performance Analysis for Strong Interference Remove of Fast Moving Target in Linear Array Antenna Kwan Hyeong Lee Dept. Electriacal Electronic & Communicaton, Daejin University, 1007 Ho Guk ro, Pochen,Gyeonggi,
How Small Can a Launch Vehicle Be?
 UCRL-CONF-213232 LAWRENCE LIVERMORE NATIONAL LABORATORY How Small Can a Launch Vehicle Be? John C. Whitehead July 10, 2005 41 st AIAA/ASME/SAE/ASEE Joint Propulsion Conference and Exhibit Tucson, AZ Paper
= (G T G) 1 G T d. m L2
 1 G T d. m L2") The importance of the Vp/Vs ratio in determining the error propagation and the resolution in linear AVA inversion M. Aleardi, A. Mazzotti Earth Sciences Department, University of Pisa, Italy Introduction.
The importance of the Vp/Vs ratio in determining the error propagation and the resolution in linear AVA inversion M. Aleardi, A. Mazzotti Earth Sciences Department, University of Pisa, Italy Introduction.
Start-up Noise in 3-D Self-AmpMed
 LBNL-388 13 UC-414 ERNEST ORLANDO LAWRENCE BERKELEY NATIONAL LABORATORY CONI=- 7 6 0 8 133--5r Start-up Noise in 3-D Self-AmpMed Spontaneous Emission IC-J. Kim Accelerator and Fusion Research Division
Reliability Theory of Dynamically Loaded Structures (cont.)
") Outline of Reliability Theory of Dynamically Loaded Structures (cont.) Probability Density Function of Local Maxima in a Stationary Gaussian Process. Distribution of Extreme Values. Monte Carlo Simulation
Outline of Reliability Theory of Dynamically Loaded Structures (cont.) Probability Density Function of Local Maxima in a Stationary Gaussian Process. Distribution of Extreme Values. Monte Carlo Simulation
Copyright license. Exchanging Information with the Stars. The goal. Some challenges
 Copyright license Exchanging Information with the Stars David G Messerschmitt Department of Electrical Engineering and Computer Sciences University of California at Berkeley messer@eecs.berkeley.edu Talk
Using the X-FEL to understand X-ray Thomson scattering for partially ionized plasmas
 LLNL-PROC-564720 Using the X-FEL to understand X-ray Thomson scattering for partially ionized plasmas J. Nilsen, W. R. Johnson, K. T. Cheng July 17, 2012 13th International Conference on X-ray Lasers Paris,
The Unique Source Mechanism of an Explosively Induced Mine Collapse
 The Unique Source Mechanism of an Explosively Induced Mine Collapse Xiaoning Yang, Brian W. Stump, W. Scott Phillips Geophysics Group - EES-3, Los Alamos National Laboratory Contract No. W-7405-ENG-36
(4) How do you develop an optimal signal detection technique from the knowledge of
 How do you develop an optimal signal detection technique from the knowledge of") Signal and Noise in Global Warming Detection Final Report Gerald R. North, Principal Investigator Climate System Research Program, Texas A&M University, Texas 1. Program Objectives The specific objectives
Signal and Noise in Global Warming Detection Final Report Gerald R. North, Principal Investigator Climate System Research Program, Texas A&M University, Texas 1. Program Objectives The specific objectives
EEG- Signal Processing
 Fatemeh Hadaeghi EEG- Signal Processing Lecture Notes for BSP, Chapter 5 Master Program Data Engineering 1 5 Introduction The complex patterns of neural activity, both in presence and absence of external
GA A22722 CENTRAL THOMSON SCATTERING UPGRADE ON DIII D
 GA A22722 CENTRAL THOMSON SCATTERING UPGRADE ON DIII D by D.G. NILSON, T.N. CARLSTROM, C.L. HSIEH, B.W. STALLARD, and R.E. STOCKDALE NOVEMBER 1997 DISCLAIMER This report was prepared as an account of work
Plutonium 239 Equivalency Calculations
 LLNL-TR-490356 Plutonium 239 Equivalency Calculations J. Wen July 7, 2011 Disclaimer This document was prepared as an account of work sponsored by an agency of the United States government. Neither the
Final Report for DOEI Project: Bottom Interaction in Long Range Acoustic Propagation
 Final Report for DOEI Project: Bottom Interaction in Long Range Acoustic Propagation Ralph A. Stephen Woods Hole Oceanographic Institution 360 Woods Hole Road (MS#24) Woods Hole, MA 02543 phone: (508)
29th Monitoring Research Review: Ground-Based Nuclear Explosion Monitoring Technologies
 MODELING TRAVEL-TIME CORRELATIONS BASED ON SENSITIVITY KERNELS AND CORRELATED VELOCITY ANOMALIES William L. Rodi 1 and Stephen C. Myers 2 Massachusetts Institute of Technology 1 and Lawrence Livermore
Determine the Inside Wall Temperature of DSTs using an Infrared Temperature Sensor
 SUMMARY DOCUMENT Determine the Inside Wall Temperature of DSTs using an Infrared Temperature Sensor Date submitted: July 29, 2016 Prepared by: Aparna Aravelli, Ph.D. Florida International University Collaborators:
Shock compression of precompressed deuterium
 LLNL-PROC-491811 Shock compression of precompressed deuterium M. R. Armstrong, J. C. Crowhurst, J. M. Zaug, S. Bastea, A. F. Goncharov, B. Militzer August 3, 2011 Shock compression of precompressed deuterium
DIRECTION-of-arrival (DOA) estimation and beamforming
 estimation and beamforming") IEEE TRANSACTIONS ON SIGNAL PROCESSING, VOL. 47, NO. 3, MARCH 1999 601 Minimum-Noise-Variance Beamformer with an Electromagnetic Vector Sensor Arye Nehorai, Fellow, IEEE, Kwok-Chiang Ho, and B. T. G. Tan
IEEE TRANSACTIONS ON SIGNAL PROCESSING, VOL. 47, NO. 3, MARCH 1999 601 Minimum-Noise-Variance Beamformer with an Electromagnetic Vector Sensor Arye Nehorai, Fellow, IEEE, Kwok-Chiang Ho, and B. T. G. Tan
Discriminative Direction for Kernel Classifiers
 Discriminative Direction for Kernel Classifiers Polina Golland Artificial Intelligence Lab Massachusetts Institute of Technology Cambridge, MA 02139 polina@ai.mit.edu Abstract In many scientific and engineering
RWM FEEDBACK STABILIZATION IN DIII D: EXPERIMENT-THEORY COMPARISONS AND IMPLICATIONS FOR ITER
 GA A24759 RWM FEEDBACK STABILIZATION IN DIII D: EXPERIMENT-THEORY COMPARISONS AND IMPLICATIONS FOR ITER by A.M. GAROFALO, J. BIALEK, M.S. CHANCE, M.S. CHU, D.H. EDGELL, G.L. JACKSON, T.H. JENSEN, R.J.
GA A27857 IMPACT OF PLASMA RESPONSE ON RMP ELM SUPPRESSION IN DIII-D
 GA A27857 IMPACT OF PLASMA RESPONSE ON RMP ELM SUPPRESSION IN DIII-D by A. WINGEN, N.M. FERRARO, M.W. SHAFER, E.A. UNTERBERG, T.E. EVANS, D.L. HILLIS, and P.B. SNYDER JULY 2014 DISCLAIMER This report was
Flipping Bits in the James Webb Space Telescope s Cameras
 Flipping Bits in the James Webb Space Telescope s Cameras Lance Simms IEEE Life Members Talk 05/16/2018 LLNL-PRES-735208 This work was performed under the auspices of the U.S. Department of Energy by Lawrence
Response to Comment on "The National Ignition Facility Laser Performance Status"
 UCRL-JRNL-237304 Response to Comment on "The National Ignition Facility Laser Performance Status" C. A. Haynam, R. A. Sacks, E. I. Moses, K. Manes, S. Haan, M. L. Spaeth December 17, 2007 Applied Optics
Modeling Laser and e-beam Generated Plasma-Plume Experiments Using LASNEX
 UCRL-ID-136726 Modeling Laser and e-beam Generated Plasma-Plume Experiments Using LASNEX D.D.-M. Ho December 1,1999 US. Department of Energy Approved for public release; further dissemination unlimited
Scaling of divertor heat flux profile widths in DIII-D
 LLNL-PROC-432803 Scaling of divertor heat flux profile widths in DIII-D C. J. Lasnier, M. A Makowski, J. A. Boedo, S. L. Allen, N. H. Brooks, D. N. Hill, A. W. Leonard, J. G. Watkins, W. P. West May 20,
FINAL REPORT INTEGRATING P-WAVE AND S-WAVE SEISMIC DATA TO IMPROVE CHARACTERIZATION OF OIL RESERVOIRS. Innocent J. Aluka
 1 FINAL REPORT INTEGRATING P-WAVE AND S-WAVE SEISMIC DATA TO IMPROVE CHARACTERIZATION OF OIL RESERVOIRS by Innocent J. Aluka Prepared for U.S. Department of Energy Under Grant No. DE-FG26-00NT40832 Department
Module 1: Signals & System
 Module 1: Signals & System Lecture 6: Basic Signals in Detail Basic Signals in detail We now introduce formally some of the basic signals namely 1) The Unit Impulse function. 2) The Unit Step function
Signal Modeling Techniques in Speech Recognition. Hassan A. Kingravi
 Signal Modeling Techniques in Speech Recognition Hassan A. Kingravi Outline Introduction Spectral Shaping Spectral Analysis Parameter Transforms Statistical Modeling Discussion Conclusions 1: Introduction
Subspace Detectors: Theory
 UCRL-TR-222758 Subspace Detectors: Theory D. B. Harris July 11, 2006 Disclaimer This document was prepared as an account of work sponsored by an agency of the United States Government. Neither the United
Observation of shear-wave splitting from microseismicity induced by hydraulic fracturing: A non-vti story
 Observation of shear-wave splitting from microseismicity induced by hydraulic fracturing: A non-vti story Petr Kolinsky 1, Leo Eisner 1, Vladimir Grechka 2, Dana Jurick 3, Peter Duncan 1 Summary Shear
Chirp Transform for FFT
 Chirp Transform for FFT Since the FFT is an implementation of the DFT, it provides a frequency resolution of 2π/N, where N is the length of the input sequence. If this resolution is not sufficient in a
Discrete Simulation of Power Law Noise
 Discrete Simulation of Power Law Noise Neil Ashby 1,2 1 University of Colorado, Boulder, CO 80309-0390 USA 2 National Institute of Standards and Technology, Boulder, CO 80305 USA ashby@boulder.nist.gov
Two-Screen Method for Determining Electron Beam Energy and Deflection from Laser Wakefield Acceleration
 LLNL-PROC-41269 Two-Screen Method for Determining Electron Beam Energy and Deflection from Laser Wakefield Acceleration B. B. Pollock, J. S. Ross, G. R. Tynan, L. Divol, S. H. Glenzer, V. Leurent, J. P.
REVIEW OF ORIGINAL SEMBLANCE CRITERION SUMMARY
 Semblance Criterion Modification to Incorporate Signal Energy Threshold Sandip Bose*, Henri-Pierre Valero and Alain Dumont, Schlumberger Oilfield Services SUMMARY The semblance criterion widely used for
Probing Mid-Mantle Heterogeneity Using PKP Coda Waves
 Probing Mid-Mantle Heterogeneity Using PKP Coda Waves Michael A.H. Hedlin and Peter M. Shearer Cecil H. and Ida M. Green Institute of Geophysics and Planetary Physics Scripps Institution of Oceanography,
Correlation based imaging
 Correlation based imaging George Papanicolaou Stanford University International Conference on Applied Mathematics Heraklion, Crete September 17, 2013 G. Papanicolaou, ACMAC-Crete Correlation based imaging
Parametric Instabilities in Laser/Matter Interaction: From Noise Levels to Relativistic Regimes
 UCRL-ID-133227 Parametric Instabilities in Laser/Matter Interaction: From Noise Levels to Relativistic Regimes H. A. Baldis C. Labaune W. L. Kruer February 11, 1999 Lawrence Livermore National Laboratory
Direct Determination of the Stacking Order in Gd 2 O 3 Epi-Layers on GaAs
 Direct Determination of the Stacking Order in Gd 2 O 3 Epi-Layers on GaAs Yizhak Yacoby, Mukhles Sowwan and Ron Pindak Brookhaven National Laboratory P.O. Box 5000 Upton, NY 11973, USA Julie Cross PNC-CAT,
We use the overhead arrow to denote a column vector, i.e., a number with a direction. For example, in three-space, we write
 1 MATH FACTS 11 Vectors 111 Definition We use the overhead arrow to denote a column vector, ie, a number with a direction For example, in three-space, we write The elements of a vector have a graphical
ROBUST ADAPTIVE PROCESSING IN LITTORAL REGIONS WITH ENVIRONMENTAL UNCERTAINTY
 ROBUST ADAPTIVE PROCESSING IN LITTORAL REGIONS WITH ENVIRONMENTAL UNCERTAINTY LISA M. ZURK, NIGEL LEE, BRIAN TRACEY 244 Wood St., Lexington, MA 02420, zurk@ll.mit.edu 1 Introduction Detection and localization
Final Technical Report. Department of Energy. for
 Final Technical Report to Department of Energy for Project: The Screening of the Lamb Ship in Heavy Helium-like Ions Grant No.: DE-FG04-95SF20579 submitted by Derrick J. Hylton Associate Professor of Physics
Development of a High Intensity EBIT for Basic and Applied Science
 UCRL-ID- 129832 Development of a High Intensity EBIT for Basic and Applied Science R.E. Marrs D. Schneider February 5,1998 This is an informal report intended primarily for internal or limited external
Elec4621 Advanced Digital Signal Processing Chapter 11: Time-Frequency Analysis
 Elec461 Advanced Digital Signal Processing Chapter 11: Time-Frequency Analysis Dr. D. S. Taubman May 3, 011 In this last chapter of your notes, we are interested in the problem of nding the instantaneous
A Germanium Detector with Optimized Compton Veto for High Sensitivity at Low Energy
 LLNL-TR-518852 A Germanium Detector with Optimized Compton Veto for High Sensitivity at Low Energy S. Friedrich December 6, 2011 Disclaimer This document was prepared as an account of work sponsored by
Theory and Problems of Signals and Systems
 SCHAUM'S OUTLINES OF Theory and Problems of Signals and Systems HWEI P. HSU is Professor of Electrical Engineering at Fairleigh Dickinson University. He received his B.S. from National Taiwan University
12.4 Known Channel (Water-Filling Solution)
") ECEn 665: Antennas and Propagation for Wireless Communications 54 2.4 Known Channel (Water-Filling Solution) The channel scenarios we have looed at above represent special cases for which the capacity
ECEn 665: Antennas and Propagation for Wireless Communications 54 2.4 Known Channel (Water-Filling Solution) The channel scenarios we have looed at above represent special cases for which the capacity
EECS490: Digital Image Processing. Lecture #26
 Lecture #26 Moments; invariant moments Eigenvector, principal component analysis Boundary coding Image primitives Image representation: trees, graphs Object recognition and classes Minimum distance classifiers
Uncertainty Principle Applied to Focused Fields and the Angular Spectrum Representation
 Uncertainty Principle Applied to Focused Fields and the Angular Spectrum Representation Manuel Guizar, Chris Todd Abstract There are several forms by which the transverse spot size and angular spread of
2. SPECTRAL ANALYSIS APPLIED TO STOCHASTIC PROCESSES
 2. SPECTRAL ANALYSIS APPLIED TO STOCHASTIC PROCESSES 2.0 THEOREM OF WIENER- KHINTCHINE An important technique in the study of deterministic signals consists in using harmonic functions to gain the spectral
Los Alamos IMPROVED INTRA-SPECIES COLLISION MODELS FOR PIC SIMULATIONS. Michael E. Jones, XPA Don S. Lemons, XPA & Bethel College Dan Winske, XPA
 , LA- U R-= Approved for public release; distribution is unlimited. m Title: Author(s) Submitted tc IMPROED INTRA-SPECIES COLLISION MODELS FOR PIC SIMULATIONS Michael E. Jones, XPA Don S. Lemons, XPA &
High Resolution Imaging of Fault Zone Properties
 Annual Report on 1998-99 Studies, Southern California Earthquake Center High Resolution Imaging of Fault Zone Properties Yehuda Ben-Zion Department of Earth Sciences, University of Southern California
Fission-Fusion Neutron Source
 LLNL-CONF-415765 Fission-Fusion Neutron Source G. F. Chapline, R. Clarke August 18, 2009 DOE Fusion-Fission Workshop Gaithersburg, MD, United States September 30, 2009 through October 2, 2009 Disclaimer
25th Seismic Research Review - Nuclear Explosion Monitoring: Building the Knowledge Base
 KARATAU, MAKANCHI, AND LOCATION IN WESTERN CHINA Lee K. Steck, George E. Randall, Michael L. Begnaud, Charlotte A. Rowe, and Aaron A. Velasco Los Alamos National Laboratory Sponsored by National Nuclear
Robust Range-rate Estimation of Passive Narrowband Sources in Shallow Water
 Robust Range-rate Estimation of Passive Narrowband Sources in Shallow Water p. 1/23 Robust Range-rate Estimation of Passive Narrowband Sources in Shallow Water Hailiang Tao and Jeffrey Krolik Department
SPARSE signal representations have gained popularity in recent
 6958 IEEE TRANSACTIONS ON INFORMATION THEORY, VOL. 57, NO. 10, OCTOBER 2011 Blind Compressed Sensing Sivan Gleichman and Yonina C. Eldar, Senior Member, IEEE Abstract The fundamental principle underlying
24th Seismic Research Review Nuclear Explosion Monitoring: Innovation and Integration
 SEISMIC MONITORING OF BLASTING ACTIVITY IN RUSSIA Michael A.H. Hedlin University of California, San Diego Sponsored by Defense Threat Reduction Agency Contract No. DTRA01-00-C-0115 ABSTRACT Two significant
An Adaptive Sensor Array Using an Affine Combination of Two Filters
 An Adaptive Sensor Array Using an Affine Combination of Two Filters Tõnu Trump Tallinn University of Technology Department of Radio and Telecommunication Engineering Ehitajate tee 5, 19086 Tallinn Estonia
Modeling impulse response using Empirical Orthogonal Functions
 Modeling impulse response using Empirical Orthogonal Functions Trond Jenserud, Roald Otnes, Paul van Walree 1 1 Forsvarets forskningsinstitutt, P.O. Box 115, NO-3191 Horten, Norway, {trond.jenserud,roald.otnes,paul.vanwalree}@ffi.no
Laser Intensity Modulation by Nonabsorbing Defects. M. D. Feit A. M. Rubenchik
 UCRL-JC-124536 PREPRINT Laser Intensity Modulation by Nonabsorbing Defects M. D. Feit A. M. Rubenchik This paper was prepared for submittal to the 28th Annual Symposium on Optical Materials for High Power
AC dipole based optics measurement and correction at RHIC
 BNL-1132-213-CP AC dipole based optics measurement and correction at RHIC X. Shen, S. Y. Lee Indiana University of Bloomington, IN 4745, USA M. Bai, S. White, G. Robert-Demolaize, Y. Luo, A. Marusic BNL,
Imaging and time reversal in random media
 0 1 2 Imaging and time reversal in random media Liliana Borcea George Papanicolaou Chrysoula Tsogka James Berryman December 15, 2002 Abstract We present a general method for estimating the location of
INTERMOLECULAR POTENTIAL FUNCTIONS AND HIGH RESOLUTION MOLECULAR SPECTROSCOPY OF WEAKLY BOUND COMPLEXES. Final Progress Report
 . INTERMOLECULAR POTENTIAL FUNCTIONS AND HIGH RESOLUTION MOLECULAR SPECTROSCOPY OF WEAKLY BOUND COMPLEXES Final Progress Report John S. Muenter Department of Chemistry University of Rochester Rochester,
Sound Recognition in Mixtures
 Sound Recognition in Mixtures Juhan Nam, Gautham J. Mysore 2, and Paris Smaragdis 2,3 Center for Computer Research in Music and Acoustics, Stanford University, 2 Advanced Technology Labs, Adobe Systems
Today. MIT 2.71/2.710 Optics 11/10/04 wk10-b-1
 Today Review of spatial filtering with coherent illumination Derivation of the lens law using wave optics Point-spread function of a system with incoherent illumination The Modulation Transfer Function
Pressure Normal Derivative Extraction for Arbitrarly Shaped Surfaces Endrias G. Asgedom,Okwudili Chuks Orji, Walter Söllner, PGS
 Pressure Normal Derivative Extraction for Arbitrarly Shaped Surfaces Endrias G. Asgedom,Okwudili Chuks Orji, Walter Söllner, PGS Downloaded 9// to... Redistribution subject to SEG license or copyright;
LLNL DATA COLLECTION DURING NOAAETL COPE EXPERIMENT
 UCRL-ID-121682 LLNL DATA COLLECTION DURING NOAAETL COPE EXPERIMENT Test Plan David D. Manfrom Imaging & Detection Program September 6,1995 This is an informal report intended primarily for internal or
SciDAC CENTER FOR SIMULATION OF WAVE-PLASMA INTERACTIONS
 SciDAC CENTER FOR SIMULATION OF WAVE-PLASMA INTERACTIONS GA A27760 ITERATED FINITE-ORBIT MONTE CARLO SIMULATIONS WITH FULL-WAVE FIELDS FOR MODELING TOKAMAK ICRF WAVE HEATING EXPERIMENTS Final Report for
1 Coherent-Mode Representation of Optical Fields and Sources
 1 Coherent-Mode Representation of Optical Fields and Sources 1.1 Introduction In the 1980s, E. Wolf proposed a new theory of partial coherence formulated in the space-frequency domain. 1,2 The fundamental
Higher-order statistics: improved event resolution?
 Higher-order statistics: improved event resolution? David C. Henley and Arnim B. Haase Higher-order statistics ABSTRACT In any area where near-surface earth structure causes one or more small time delays
Comparison of spectral decomposition methods
 Comparison of spectral decomposition methods John P. Castagna, University of Houston, and Shengjie Sun, Fusion Geophysical discuss a number of different methods for spectral decomposition before suggesting
Quarterly Report April 1 - June 30, By: Shirley P. Dutton. Work Performed Under Contract No.: DE-FC22-95BC14936
 DE-FC22-95BC14936--18 Application of Advanced Reservoir Characterization, Simulation, and Production Optimization Strategies to Maximize Recovery in Slope, and Basin Clastic Reservoirs, West Texas (Delaware
29th Monitoring Research Review: Ground-Based Nuclear Explosion Monitoring Technologies
 FINITE DIFFERENCE MODELING OF INFRASOUND PROPAGATION TO LOCAL AND REGIONAL DISTANCES Catherine de Groot-Hedlin Scripps Institution of Oceanography, University of California at San Diego Sponsored by Army
BWXT Y-12 Y-12. A BWXT/Bechtel Enterprise SMALL, PORTABLE, LIGHTWEIGHT DT NEUTRON GENERATOR FOR USE WITH NMIS
 BWXT Y-12 A BWXT/Bechtel Enterprise Report No.: Y/LB-16,078 (Paper) SMALL, PORTABLE, LIGHTWEIGHT DT NEUTRON GENERATOR FOR USE WITH NMIS J. Reichardt J. T. Mihalczo R. B. Oberer L. G. Chiang J. K. Mattingly
PREDICTIVE MODELING OF PLASMA HALO EVOLUTION IN POST-THERMAL QUENCH DISRUPTING PLASMAS
 GA A25488 PREDICTIVE MODELING OF PLASMA HALO EVOLUTION IN POST-THERMAL QUENCH DISRUPTING PLASMAS by D.A. HUMPHREYS, D.G. WHYTE, M. BAKHTIARI, R.D. DERANIAN, E.M. HOLLMANN, A.W. HYATT, T.C. JERNIGAN, A.G.
Linear Optimum Filtering: Statement
 Ch2: Wiener Filters Optimal filters for stationary stochastic models are reviewed and derived in this presentation. Contents: Linear optimal filtering Principle of orthogonality Minimum mean squared error
PROJECT PROGRESS REPORT (06/16/1998-9/15/1998):
:") PROJECT PROGRESS REPORT (/1/199-9/15/199): A COMPREHENSVE STUDY OF FRACTURE PATTERNS AND DENSTES N THE GEYSERS GEOTHERMAL RESERVOR USNG MCROEARTHQUAKE SHEAR-WAVE SPLTTNG TOMOGRAPHY (YEAR 2: TOMOGRAPHC
PROJECT PROGRESS REPORT (/1/199-9/15/199): A COMPREHENSVE STUDY OF FRACTURE PATTERNS AND DENSTES N THE GEYSERS GEOTHERMAL RESERVOR USNG MCROEARTHQUAKE SHEAR-WAVE SPLTTNG TOMOGRAPHY (YEAR 2: TOMOGRAPHC
Optimization of NSLS-II Blade X-ray Beam Position Monitors: from Photoemission type to Diamond Detector. P. Ilinski
 BNL-94868-2013-CP Optimization of NSLS-II Blade X-ray Beam Position Monitors: from Photoemission type to Diamond Detector P. Ilinski Submitted to Journal of Physics: Conference Series March 2013 Photon
ESTIMATING INDEPENDENT-SCATTERER DENSITY FROM ACTIVE SONAR REVERBERATION
 Proceedings of the Eigth European Conference on Underwater Acoustics, 8th ECUA Edited by S. M. Jesus and O. C. Rodríguez Carvoeiro, Portugal 12-15 June, 2006 ESTIMATING INDEPENDENT-SCATTERER DENSITY FROM
VolksMeter with one as opposed to two pendulums
 VolksMeter with one as opposed to two pendulums Preface In all of the discussions that follow, remember that a pendulum, which is the seismic element used in the VolksMeter, responds only to horizontal
Safety Considerations for Laser Power on Metals in Contact with High Explosives-Experimental and Calculational Results
 Preprint UCRL-JC- 137014 Safety Considerations for Laser Power on Metals in Contact with High Explosives-Experimental and Calculational Results F. Roeske, K.H. Carpenter This article was submitted to Twenty-Seventh