The power performance of fixed-t panel unit root tests allowing for structural breaks in their deterministic components
|
|
|
- Garry Cooper
- 5 years ago
- Views:
Transcription

 20-82039 - Fax: (++30) 20-820330 www.")
1 ATHES UIVERSITY OF ECOOMICS AD BUSIESS DEPARTMET OF ECOOMICS WORKIG PAPER SERIES The ower erformance of fixed-t anel unit root tests allowing for structural breaks in their deterministic comonents Yiannis Karavias and Elias Tzavalis 76 Patission Str., Athens 04 34, Greece Tel. (++30) Fax: (++30)
2 The ower erformance of xed-t anel unit root tests allowing for structural breaks in their deterministic comonents Yiannis Karavias a and Elias Tzavalis b a: School of Economics, University of ottingham Granger Centre for Time Series Econometrics b: Deartment of Economics, Athens University of Economics & Business Abstract The asymtotic local ower of least squares based xed-t anel unit root tests allowing for a structural break in their individual e ects and/or incidental trends of the AR anel data model is studied. These tests correct the least squares estimator of the autoregressive coe cient of this anel data model for its inconsistency due to the individual e ects and/or incidental trends of the anel. The limiting distributions of the tests are analytically derived under a sequence of local alternatives, assuming that the cross-sectional dimension of the tests grows large. It is shown that the considered xed-t tests have local ower which tends to unity fast only if the anel data model includes individual e ects. For anel data models with incidental trends, the ower of the tests becomes trivial. However, this roblem does not always aear if the tests allow for serial correlation of the error term. JEL classi cation: C22, C23 Keywords: Panel data, unit root tests, structural breaks, local ower, serial correlation, incidental trends *Corresonding author. University of ottingham, ottingham G7 2RD, UK. Tel: addresses: ioannis.karavias@nottingham.ac.uk (Y. Karavias), etzavalis@aueb.gr (E. Tzavalis).
3 Introduction There is recently growing interest in develoing anel data unit root tests allowing for a break in their deterministic comonents, namely in their individual e ects and/or individual linear trends (see, Carrion-i-Silvestre et al. (2005), Harris et al (2005), Karavias and Tzavalis (202, 203), Chan and Pauwels (20), Bai and Carrion-i-Silvestre (202), Hadri et al. (202) and Pauwels et al. (202)). As is atly noted by Perron (989) in the single time-series literature, not accounting for a break oint in the level and/or deterministic trend of economic series can lead to a unit root test which can hardly reject the null hyothesis of unit roots from its alternative of stationary series. Panel unit root tests su er from this roblem too. This aer investigates the ower roerties of xed-t anel unit root tests that allow for structural breaks. These tests are aroriate for anels with few time series observations and many cross-section units, often met in ractice (see, e.g., Arellano (2003)). The asymtotic theory emloyed consider the time dimension (T ) as xed and the cross section dimension as going to in nity. In articular, the aer studies the asymtotic local ower of Harris and Tzavalis (999) and Karavias and Tzavalis (202) anel unit root tests allowing for a structural break in their deterministic comonents. The rst (denoted as HT ) was extended by Karavias and Tzavalis (203) to allow for structural breaks. The second (denoted as KT ) allows, in addition to structural breaks, for serial correlation in the error term of the individual series of the anel. Both the above tests are based on the least squares (LS) estimator of the autoregressive coe cient of the AR anel data model. This estimator is corrected for its inconsistency due to the individual e ects (both individual in- ote that a version of the KT test for the case of no structural breaks has been suggested by Kruiniger and Tzavalis (2002), and Moon and Peron (2008) for the case that T is large and the error term is a white noise rocess. 2
4 tercets and individual intercets along with incidental trends are considered) of the anel. In the case that the error term is serially correlated, the LS estimator must be also corrected for its inconsistency due to the serial correlation of the error term. The latter can be easily done in the framework considered by Karavias and Tzavalis (202) (see KT test), which adjusts the LS estimator of the autoregressive coe cient of the AR anel data model only for the inconsistency of its numerator. The aer makes a number of contributions into the literature of anel data unit root tests, which have imortant ractical imlications. First, it shows that, for the standard anel data model with individual intercets, the HT test has higher asymtotic local ower than the KT test. This haens because the HT does not require a consistent estimator of the variance of the error term, comared to the KT test. The HT test is invariant to this nuisance arameter, as it adjusts the LS estimator for its inconsistency of both its numerator and numerator. Second, the aer shows that, as with anel unit root tests that do not allow for a break, the HT and KT tests have trivial asymtotic local ower if incidental trends are included in the deterministic comonents of the AR anel data model. The allowance for a break in the deterministic comonents of this model does not save the tests from this roblem. Third, the tests can increase their ower if they allow for serial correlation of the error term. In this case, the KT test can have non-trivial asymtotic local ower, even for the anel data model with incidental trends. The increase of the ower of this test in this case can be attributed to the serial correlation e ects on the inconsistency correction of the LS estimator. The above results are con rmed through a Monte Carlo exercise. This exercise also rovides interesting small samle results on the ower erformance of the tests and shows the usefulness of the asymtotic aroximation. The aer is organized as follows: Section 2 resents the assumtions on the data generat- 3
5 ing rocess required by the two tests considered. Section 3 derives the limiting distributions of the tests. For the KT test allowing for serial correlation e ects, this is done in Section 4. Section 5 carries out the Monte Carlo exercise. Section 6 concludes the aer. All roofs are given in the aendix. 2 Models and Assumtions Consider the following AR dynamic anel data models allowing for a common structural break in their deterministic comonents (individual e ects and/or individual linear trends) at time oint T 0, for all individual units of the anel i: M: y i = a i e + a (2) i e (2) + i ; i = ; 2; ::;, M2: y i = a i e + a (2) i e (2) + i + (2) i (2) + i ; i = ; :::; where i = ' i + u i ; ' 2 ( ; ], y i = (y i ; :::; y it ) 0 and y i = (y i0 ; :::; y it ) 0 are (T X) vectors, u i = (u i ; :::; u it ) is the (T X) vector of error terms u it, a i and i denote the individual e ects and sloe coe cients of the linear (incidental) trends of the anel. In articular, a i is de ned as a i = a i if t T 0 and a i = a (2) i if t > T 0, while e and e (2) are (T X)-column vectors de ned as follows: e t = if t T 0 and 0 otherwise, and e (2) t = if t > T 0 and 0 otherwise. Sloe coe cients i are de ned as i = i if t T 0 and i = (2) i if t > T 0, while and (2) are (T X)-column vectors de ned as follows: t = t if t T 0 ; and zero otherwise, and 4
6 (2) t = t if t > T 0, and zero otherwise. Throughout the aer, we will denote the fraction of the samle that the break occurs as, i.e. = T 0 T 2 I = 2 T ; 3 T ; :::::; T T. The above models nest in the same framework both the null hyothesis of unit roots in ', i.e., ' =, and its alternative of stationarity, ' <. They can be written in a nonlinear form as follows: y i = 'y i + ( ')(a i e + a (2) i e (2) ) + u i ; i = ; 2; :::; and y i = 'y i + ' i e + ' (2) i e (2) + ( ')(a i e + a (2) i e (2) ) + ( ')( i + (2) i (2) ) + u i ; resectively. The "within grou" least squares (LS) (known also as least squares dummy variables (LSDV)) estimator of autoregressive coe cient ' of the models can be written as follows: ^' m = i= y 0 i Q m y i! i= y 0 i! Q m y i, m = f; 2g; where Q m is the (T XT ) within transformation (annihilator) matrix of the individual is de ned as Q m = I X m X m 0 X m 0 X m, for m = f; 2g, series of the anel y it. Q m where X = e ; e ( ) for model M and X 2 = e ; e ( ) ; ; ( ) for model M2. This estimator is inconsistent due to the within transformation of the data, which wies o the individual e ects and/or incidental trends of the anel, as well as its initial conditions y i0. Thus, xed-t anel unit root tests based on it must rely on a correction of estimator ^' m for its inconsistency (asymtotic bias) (see, e.g., Harris and Tzavalis (999, 2004)). To study the asymtotic local ower of these tests, de ne the autoregressive coe cient ' as ' = c. Then, the hyotheses of interest become H 0 : c = 0 and H a : c > 0, 5
7 where c is the local to unity arameter. The limiting distributions of the tests based on LSDV estimator ^' m will be derived under the sequence of local alternatives ', by making the following quite general assumtion: Assumtion : (b) fu i g constitutes a sequence of indeendent normally distributed random vectors of dimension (T X) with means E(u i ) = 0 and variance-autocovariance matrices E(u i u 0 i) = [ ts ], 8 i 2 f; 2; :::; g, where ts = E(u it u is ) = 0 for s = t + max + ; :::; T and t < s. (b2) tt > 0 for at least one t = ; :::; T: (b3) The 4 + th oulation moments of y i ; i = ; :::; are uniformly bounded. That is, for every l 2 R T such that l 0 l = ; E(jl 0 y i j 4+ ) < B < + for some B, where is the di erence oerator. (b4) l 0 V ar(vec(y i yi)l 0 > 0 for every l 2 R 0:5T (T +) such that l 0 l =. (b5) E(u it y io ) = E u it a i = E u it a (2) i = 0 and 8 i 2 f; 2; :::; g; t 2 f; 2; :::; T g: (b6) E u it i = E u it (2) i = 0; 8 i 2 f; 2; :::; g; t 2 f; 2; :::; T g; E(a it it ) = 0; 8 i 2 f; 2; :::; g. Assumtion enables us to derive the limiting distribution of the xed-t anel data unit root tests of Harris and Tzavalis (999, 2004) (denoted as HT ), based on LS estimator ^' m (denoted as HT ), as was extended by Karavias and Tzavalis (202) to allow for a common break in the deterministic comonents of models M and M2. It also allows the derivation of this limiting distribution for Karavias and Tzavalis (202) xed-t anel data unit root tests (denoted as KT ), based on ^' m, allowing for a structural break under heteroscedasticity and/or serial correlation of error term u it. Condition (b) of the assumtion ermits the variance matrix of error terms u it, = E(u i u 0 i), to have general form heteroscedasticity and serial correlation. The latter is assumed to have maximum order max ; which is less than the time dimension of the anel, T. If = 2 I, where I is the (T XT ) identity matrix, then 6
8 Assumtion is consistent with the assumtions of Harris and Tzavalis (999) anel data unit root tests, considering the simler case of u it IID(0; 2 u). Conditions (b2)-(b4) qualify alication of the Markov LL and the Lindeberg -Levy central limit theorem (CLT) to derive the limiting distribution of the HT and KT tests, as!, under the assumtions of condition (b). More seci cally, conditions (b2) and (b4) guarantee regularity so that the variance of the errors and its estimator will not be zero. Condition (b3) imlies that V ar(y i0 ) < +, which is consistent with assumtions like constant, random and mean stationary initial conditions y i0. Covariance stationary of y i0, imlying V ar(y i0 ) = 2 ' 2 (see Kruiniger (2008) and Madsen (200)) is not considered. This is because, as is also atly noted by Moon et al. (2007), this assumtion imlies that V ar(y i0 )! when '!, which means that the variance of the initial condition increases with the number of cross-section units. This is not meaningful for cross-section data sets. Finally, (b5)-(b6) constitute weak conditions under which the limiting distribution of the tests can be derived when c > 0; (b5) is required for Model M, while (b6) for model M2. Under these two conditions, the limiting distribution of the tests under H a : c > 0 becomes invariant to nuisance arameters a i and i, as well as the initial conditions y i0 of the anel. To study the asymtotic local ower of the tests, we will rely on the sloe arameter, denoted as k; of local ower functions of the form (z a + ck), where is the standard normal cumulative distribution function and z a denotes the -level ercentile. Since is strictly monotonic, a larger k means greater ower, for the same value of c. If k is ositive, then the tests will have non-trivial ower. If it is zero, they will have 7
9 trivial ower, which is equal to a, and if it is negative they will be biased. 3 The limiting distribution of the tests if u it IID(0; 2 ) This section resents the limiting distribution of the HT and KT test statistics under the sequence of local alternatives ' = c. The HT test corrects both the numerator and denominator of LS estimator ^' m for its inconsistency, while the KT corrects only the numerator of ^' m. This enables the KT test to be easily extended to allow for serial correlation in error terms u it. But, in contrast to HT, this test statistic requires a consistent estimator of the variance of u it, 2 u, to adjust for the inconsistency of estimator ^' m. 3. Model M For model M, the HT test allowing for a break is based on the following statistic: V =2 HT; (^' B ), where B = lim(^' ) = tr(0 Q ) is the inconsistency of LS estimator ^' ) under H 0 : c = 0, V HT; = 2tr(A2 HT; ) tr( 0 Q, with tr( 0 Q A )2 HT; = 2 (0 Q + Q ) B ( 0 Q ), is the variance of the limiting distribution of the corrected for its inconsistency estimator ^', i.e. (^' B ). The KT test is based on statistic V =2^ KT; ^' ^b ^!, 8
10 where ^b ^ ^ 2 u tr(0 Q P ) i= y0 i; Q y i which relies on a consistent estimator of its numerator, denominator of ^' scaled by, V KT; = 24 utr(a 2 KT; 0 ), is the variance of the limiting distribution of is also consistent estimator of the inconsistency of ^', P ^ = i= y0 i; Q y i; is the ), with A KT; = 2 (0 Q + Q ^' ^b, where ^ is a (T XT )-dimension matrix having in its main diagonal the corresonding elements of matrix 0 Q, and zeros elsewhere, imlying tr( ) = tr( 0 Q ). This matrix is designed so as, in adjusting the numerator of estimator ^' for its inconsistency, to subtract from it samle moments of it which cature its inconsistency e ects due to the within transformation of the individual series y it of the anel. This means that the following sum of oulation moments are left for inference about null hyothesis H 0 : c = 0: E h u 0 i( 0 Q )u i i = 0, for all i. For model M, this sum of moments imlies a consistent estimator of variance 2 u under null hyothesis H 0 : c = 0, which can be taken as ^ 2 u = oerator. 2 P i= y0 i y i tr( ), where is the di erence In the next theorem, we give the limiting distribution of the HT and KT statistics, de ned above for model M, under the sequence of local alternatives ' = c. Theorem Let conditions (b)-(b5) of Assumtion hold and u it IID(0; 2 ). Then, 2 u 2 It can be easily seen that, under H 0 : c = 0, we have lim ^ 2 P u = lim tr( ) i= tr( y iyi 0) = tr( 0 Q ) = 2 tr( u, since tr( ) ) = tr(0 Q ). 9
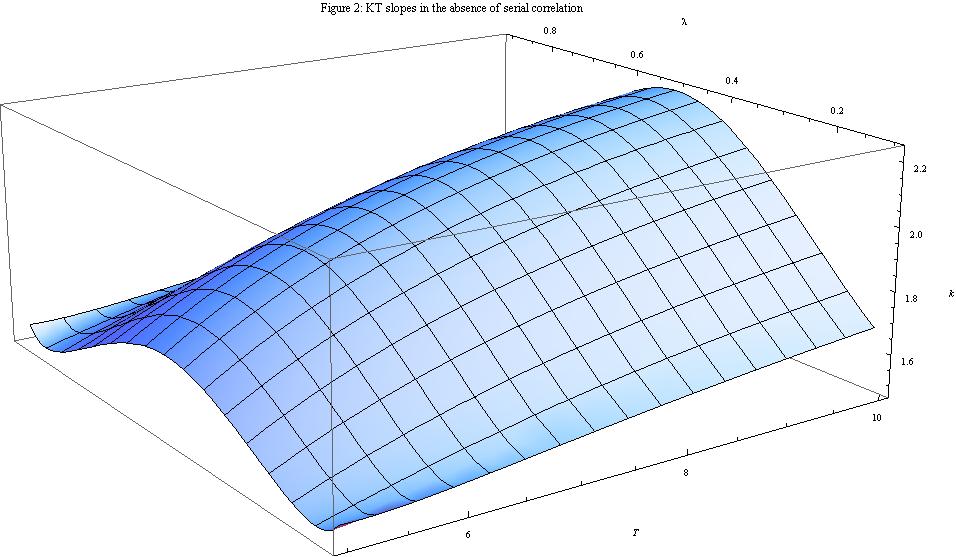
11 under ' = c, we have V and V =2 HT; (^' B ) =2^ KT; ^' ^b ^ d! ( ck HT; ; )! d! ( ck KT; ; ) ; as!, where k HT; = T (T 2) T 2 ( ) s T 4 + T T 2 ( ) 8 T 6 R + T 5 R 2 + T 4 R 3 + T 2 R T 36 and k KT; = 3(T 2) q T 2 ( ) + 6T + 0 4( +2( )T ) T ( ) ; where R ; R 2 ; R 3 ; R 4 and ; 2 are olynomials of de ned in the aendix (see roof of the theorem). The limiting distributions given by Theorem imly that the asymtotic local ower function of test statistics HT and KT deend on the values of sloe arameters k HT and k KT, resectively. In Table, we resent values of these arameters, for di erent values of T and. The results of these tables indicate that the asymtotic local ower behavior of the two tests is di erent. The HT test has much higher ower than the KT. The ower of the test is much bigger when the break is in the beginning or towards the end of the samle, i.e. = f0:25; 0:75g: 3 On the other hand, the ower of the KT test reaches its maximum oint when the break is in the middle of the samle, = f0:50g. The ower of the HT test increases with T, i.e. k HT; = O(T ). The ower of the KT test increases with T for 3 Analogous evidence is rovided for single time series unit root tests allowing for breaks, based on a model selection Bayesian aroach (see Meligkotsidou et al. (20)). 0
12 relatively small T. As T grows large, the test has no ower gains. This can be seen from lim T k KT; = ; which is indeendent of T. These results can be more clearly seen by the three-dimension Figures and 2, resenting values of k HT; and k KT;, for di erent values of and T. The above di erences between the HT and KT tests can be attributed to the way that each test corrects for the inconsistency of the LS estimator ^'. As mentioned before, the HT test is based on a correction of LS estimator ^' for the inconsistency of both its numerator and denominator. On the other hand, the KT test is based on an adjustment of estimator ^' only for the inconsistency of its numerator, which additionally requires a consistent estimator of the variance of error term u it, 2 u. The later reduces the local ower of the test. Finally, another interesting result of Theorem is that, under the sequence of local alternatives considered, the break function arameters do not enter the asymtotic distribution of both tests. Thus, the magnitude of the break does not a ect local ower of the tests. Furthermore, local ower is also robust to initial condition y i0 asymtotically, which means that the magnitude of y i0 also does not a ect the ower of the test (see also Harvey and Leybourne (2005) and Harris et al. (200)). Scaling aroriately the HT and KT test statistics by T and assuming that T,!, with c! 0, it can be shown (see aendix) that, under ' T ;T = T, the limiting distributions of the large-t versions of the tests are given as follows: Corollary Let conditions (b)-(b5) of Assumtion hold and u it IID(0; 2 ). Then,
13 under ' ;T = c T, we have V and V =2 HT; =2 KT; T (^' B ) ^ T ^' ^b ^ L! ck HT;; ;! d! ck KT;; ; as T,!, with T! 0, where r kht; = (2 2 and kkt; = 0, 2 + ) R and V HT; = 36R (2 2 and V 2 ) 2 KT; = 36( ) 2( )( ) 2 resectively denote the local ower sloe coe cients and the variances of the limiting distributions of the large-t versions of the HT and KT test statistics. Values of ower sloe coe cients kht; and k KT;, for di erent values of, are reorted in Table 2. These indicate that, in contrast to the HT test, the large-t extension of the KT test does not have asymtotic local ower. 4 This test can be thus thought of as more aroriate for short anels. The results of the table also indicate that the large-t extension of the HT test has less ower than its xed-t version. It is also found that ower takes its highest values in the beginning and towards the end of the samle, i.e., for = f0:0, 0:90g, as for its xed-t version. The smaller ower of the large-t versions of the tests, comared to their xed-t ones can be attributed to the faster rate of convergence of the alternative hyotheses to the null, i.e. ' ;T = (200)). c T comared to ' = c (see also Harris et al. 4 An analogous result has been derived by Moon and Perron (2008) for this test in the case of no break. 2
14 3.2 Model M2 For model M 2, which additionally considers incidental trends in the deterministic comonents of individual anel series y it, the HT and KT test statistics are de ned analogously to those for model M: The HT test admits the same formulas, but with Q 2 instead of Q, B 2 = lim(^' 2 ) = tr(0 Q V HT;2 = 2tr(A2 HT;2 ) tr( 0 Q 2 2 ) tr( 0 Q 2 ) denotes the inconsistency of LS estimator ^', with A HT;2 = )2 2 (0 Q 2 + Q 2 ) B 2 ( 0 Q 2 ), is the variance of the limiting distribution of (^' 2 B 2 ). However, for the KT test, ^ 2 u = 2, P i= y0 i y i tr( ) is no longer a consistent estimator of 2 u in the case of model M2, due to the resence of individual coe cients (e ects) i under null hyothesis H 0 : c = 0 imlying i= E(y i y 0 i) = e e 0 + (2) e(2) e (2)0 + 2 ui; (2) where = P i= E(( i ) 2 ) and (2) = P i= E(((2) i ) 2 ): To render the KT test statistic invariant to these e ects, Karavias and Tzavalis (202) suggested the following estimator of 2 u: ^ 2 u = P i= y0 i 2 y i ; tr( 2 ) with 2 = 2 + tr(0 Q 2 M ) trace(m J ) M + tr(0 Q 2 M (2) ) trace(m (2) J 2 ) M (2), (3) where 2 is a diagonal matrix of (T XT )-dimension having in its main diagonal the elements of the main diagonal of the matrix 0 Q 2, J = e e 0 and J 2 = e (2) e (2)0 and M = J diagfe g and M (2) = J 2 diagfe (2) g, where diagfe (r) g, r = f; 2g, are matrices that have zeros everywhere excet from their main diagonal which have the elements of vectors 3
15 e (r). Matrix 2 lays the same role as, for the KT test statistic in the case of model M. It rovides an estimator of 2 u which enables us to correct the numerator of LS estimator ^' 2 for its inconsistency, due to the within transformation of the individual series of the anel, while in arallel roviding a number of samle moments uon which inference about unit roots can be drawn. This imlies that the variance of the limiting distribution of the adjusted for its inconsistency estimator ^' 2 ^b 2 will be given as V KT;2 = 24 utr(a 2 KT;2 ), with A KT;2 = 2 (0 Q 2 + Q ). ^ 2 The next theorem derives the limiting distribution of the HT and KT statistics under the sequence of local alternatives local alternatives ' = c. Theorem 2 Let conditions (b)-(b6) of Assumtion hold and u it IID(0; 2 ). Then, under ' = c, we have V =2 HT;2 (^' 2 B 2 ) L! ( ck HT;2 ; ) and V =2^ KT;2 2 ^' 2! ^b 2 ^ 2 d! ( ck KT;2 ; ) ; as!, where k HT;2 = 0 and k KT;2 = 0. The results of the theorem indicate that the well known incidental trends roblem of anel data unit root tests (see e.g. Moon et al. (2007)) also exists even if the tests allow for break and T is xed. Both the HT and KT test statistics have trivial ower. This result holds for the large-t version of the tests, too. 4
16 4 Power of the KT tests if error terms u it are serially correlated In this section, we consider the case that the variance-covariance matrix of error terms u it has a more general form than = 2 ui, assumed in the revious section. That is, we assume that = [ ts ], where ts = E(u it u is ) = 0 for s = t + max + ; :::; T and t < s. This means that u it allow for heteroscedasticity and serial correlation of maximum lag order max. Our analysis enables us to investigate the combined e ects of a structural break and serial correlation in u it on the asymtotic local ower of anel unit roots. As only the KT test is extended to allow for serially correlated errors u it (see, e.g., Karavias and Tzavalis (202)), our analysis will be focused on this test. For both models M and M2, the KT test statistic under the above assumtions about u it has analogous forms to those resented in the revious section. What changes is that, in order to take into account for an -order serial correlation in u it which will be aeared in the -uer and -lower secondary diagonals of matrix, selection matrices and 2 now are de ned di erently. They constitute (T XT )-dimension matrices having in their main diagonals and their -lower and -uer diagonals the corresonding elements of matrices of 0 Q and 0 Q 2, resectively. Thus, they will be henceforth denoted by the subscrit "", as ; and ;2. Furthermore, in the same reasoning, matrix M has elements m ts = 0 if ts 6= 0, and m ts = if ts = 0, matrix M (2) has elements m (2) ts = 0 if ts 6= 0, and m 2ts = if ts = 0. For model M2, the corresonding matrix to 2 now will be denoted with the subscrit "" as ;2 = ;2 + tr(0 Q 2 M ) trace(m J ) M + tr(0 Q 2 M (2) ) trace(m (2) J 2 ) M (2), (4) 5
17 where matrix M selects the elements of matrix e e 0 + (2) e(2) e (2)0 + consisting only of individual sloe coe cient e ects, for t; s T 0. For t or s > T 0, all elements of M are set to m ts = 0. On the other hand, matrix M (2) e e 0 + (2) e(2) e (2)0 + consisting only of e ects (2) ; for t; s > T 0. selects the elements of matrix For both models M and M2, the consistent estimator of the inconsistency of the LS estimator ^' m for the KT test is de ned as ^b ^ = tr( P i= y0 i; ; ^) and Q y i; ^b 2 ^ 2 = tr( P i= y0 i; ;2 ^) Q y i; resectively, where ^ = P i= y iy 0 i constitutes an estimator of variance-covariance matrix under null hyothesis H 0 : c = 0. This is consistent for model M. For model M2, it is remultilied by matrix ;2 to become net of the individual e ects and (2). The variance of the limiting distribution of the adjusted for its inconsistency estimator ^' ^' ^b m m, is given as V ^ KT; = 2tr (A KT; )2, with A KT; = 2 (0 Q + Q m 0 ; ; ), for model M, and V KT;2 = 2tr (A KT;2 )2, with A KT;2 = 2 (0 Q 2 + Q 2 ;2 0 ;2 ), for model M2. 5 In the next theorem, we rovide the limiting distribution of the KT test under the m, sequence of local alternatives ' = c, for model M allowing for serial correlation in u it. As shown in Karavias and Tzavalis (202), the limiting distribution of the test for this model can be derived assuming that the maximum order of serial correlation of u it, max, is given as max = [T=2 2] ; 5 ote that, for notation simlicity, subscrit "" is suressed from the notation of ^b m, V KT; and V KT;2. 6
18 where [:] denotes the greatest integer function. Theorem 3 Let conditions (b)-(b5) of Assumtion hold. Then, under ' = c, we have V =2^ KT; ^' ^b ^! d! ( ck KT; ; ), for model M, as!, where k KT; = tr(f 0 Q ) + tr(0q ) tr( ; ) tr( 0 q 2tr((A KT; )2 ) ; ). The results of the theorem indicate that the asymtotic local ower of the KT test now deends also on the values of the variance-covariance arameters ts, a ecting the ower sloe arameter k KT;. This can increase, or reduce, the local ower of the test deending on the sign of ts. To see this more clearly, in Table 3, we resent estimates of the ower sloe arameter k KT; assuming that error terms u it follow a MA rocess: u it = " it + " it, where " it IID(0; 2 "). ote that the table also considers the case that = 0 (i.e., there is no serial correlation), but the KT test allows for serial correlation of order =. This case can show if the KT test loses signi cant ower if a higher order of serial correlation is assumed than the correct one. The results of the table also show that the KT test has always ower if 0 or the break oint T 0 is at the middle of the samle (i.e., = 0:5), as in the case of no serial correlation (see Table ). The nding that the test has ower even if = 0, for all cases of T 0 considered, indicates that it can be safely alied to test 7
19 for unit roots even if higher than the correct order of serial correlation is assumed. 6 As was exected, the ower of the test in this case is always less comared to that when the correct lag order = 0 is considered. This can be attributed to the fact that the test exloits less moment conditions in drawing inference about unit roots, by assuming = when = 0. Another interesting conclusion that can be drawn from the results of the table is that, when > 0, the ower of the KT test becomes bigger than that of its version which does not allow for serial correlation u it, resented in the revious section (see Table 2). We have found that this result can be mainly attributed to the resence of terms tr( ; ) and tr( 0 ; ) in the function of sloe coe cient k KT;, given by Theorem 3. These have a ositive e ect on k KT; (i.e., tr( ; ) + tr( 0 ; ) < 0) when > 0 and a negative e ect when < 0 (i.e., tr( ; ) + tr( 0 ; ) > 0). 7 As T increases, the above sign e ects of the sign of on the KT test are amli ed. These ower gains of the KT test for model M, when > 0, may be also attributed to the fact that a ositive value of adds to the variability of individual anel series y it, driving further away the limiting distributions of the test under the null and alternative hyotheses. For model M2, the limiting distributions of the KT test under ' = c and serially correlated error terms u it are given in the next theorem. ote that, for this model, the maximum order of serial correlation allowed by the KT test is given as 8 >< T 3; if T is even and T 2 0 = T 2 max = >: minft 0 2; T T 0 2g otherwise; 6 We have found that this is true even for >. 7 The sum of traces tr(f 0 Q ) + tr( 0 Q ) a ects the ower of the KT test, too. However, because this constitutes a arabola function which oens uwards, its e ect on k KT; is almost symmetrical with resect to the sign of. Thus, the relationshi between k KT; and is mainly determined by tr( ; ) + tr( 0 ; ). 8
20 see Karavias and Tzavalis (202). Theorem 4 Let conditions (b)-(b6) of Assumtion hold. Then, under ' = c, we have V =2^ KT;2 2 ^' 2! ^b 2 ^ 2 d! ( ck KT;2 ; ), for model M2, as!, where k KT;2 = tr(f 0 Q 2 ) + tr(0q 2 ) tr( q 2tr((A KT;2 )2 ) ;2 ) tr( 0 ;2 ). The results of the theorem indicate that, if it allows for serial correlation in u it, the KT test can have non-trivial ower even in the case of incidental trends. Table 4 resents values of k KT;2 for the case that u it follows MA rocess: u it = " it + " it. This is done for di erent values of and T. As in Table 3, we also consider the case that = 0. The results of Table 4 indicate that, for model M2, the KT test has non-trivial ower only if < 0. If = 0, the test has trivial ower while for > 0, the test is biased. For < 0, the ower of the test increases with T. For a given T; it becomes bigger if the break oint T 0 is located towards the end of the samle, i.e. = 0:75. These results are in contrast to those for model M, resented in Table 3, where the KT test is found to have more ower if > 0. This can be attributed to the interaction between matrix and annihilator matrix Q 2, entering the trace terms tr(:), on the ower sloe arameter k KT;2 and, in articular, on terms tr( ;2 ) and tr( 0 ;2 ). Calculations of these terms show that negative values of reverse the ower reduction e ects coming from detrending of the individual anel series through matrix Q 2. In contrast to model M, this now haens only when < 0. As for model M, the above gains in ower of the KT test, when < 0; may be also attributed to 9
21 the reduction in the variability of series y it, which a negative value of imlies. The series behave more like being generated from a model with a common trend. As shown by Moon et al. (2007), in this case the incidental arameter roblem disaears. 5 Monte Carlo results In this section, we conduct a Monte Carlo study to examine if the asymtotic local ower functions of the HT and KT tests, imlied by the results of the revious section, rovide good aroximations of their small samle ones. This is done based on 5000 iterations. For each iteration, we calculate the size of the tests at 5% level (i.e., for c = 0) and their ower (i.e., for c = ). This is done searately for the cases that u it IID(0; ) and u it = " it + " it, with 2 f 0:8; 0:5; 0; 0:5; 0:8g. The and T -dimensions of the anel data models are assumed as follows: 2 f00; 300; 000g and T 2 f8; 0; 5; 20g, while the break fraction is taken to be 2 f[0:25t ]; [0:5T ]; [0:75T ]g, where [] denotes integer art. The nuisance arameters of the models are set to the following values: y i0 = 0, a i i = 0; for all i, as they do not a ect the limiting distribution of the tests. = 0 and Tables 5 and 6 resent the results of our simulation study for the case that u it IID(0; ). The last column of the tables gives the theoretical values (T V ) of the ower function and the nominal size of the tests, at a = 5%. For model M, the results of Table 6 indicate that both the HT and KT tests have size and ower values which are very close to their theoretical ones. Furthermore, the results con rm that the HT test has more ower towards the beginning and the end of the samle while the KT test has more ower in the middle. As was also redicted by the theory, the HT test has higher ower than the KT test. The small samle ower of this test is very close to that redicted by its asymtotic 20
22 local ower function (see column T V ) even for small (e.g., =00). However, this is not always true for the KT test, which needs very high in order its ower to converge to its theoretical value. For model M2, the results of Table 6 indicate that, for large, both HT and KT tests have trivial ower, as it was exected. However, in small samles (e.g., = 00), both tests have some non-trivial ower. This can be obviously attributed to second, or higher, order e ects of the true ower function, which cannot be aroximated by the rst-order aroximation considered in our analysis. ote that, for model M 2, the KT test has slightly higher small samle ower than the HT. Tables 7, 8, 9 and 0 resent the results of our simulation study for the KT test allowing for serial correlation in error terms u it, assuming u it = " it + " it. This is done for models M and M2, and T 2 f8; 0g. The maximum order of serial correlation allowed by the KT test is set to =, which matches that of the MA rocess of u it. The results of these tables are also consistent with theory. For model M, the KT test has signi cant ower when > 0. This converges to its theoretical value, reorted in the last column of the table, quite fast as increases. For negative values of, the test has also signi cant ower. This haens for =f0:75g, as was redicted by the theory. ote that both the theoretical and small samle values of the ower function of the KT are higher than their corresonding values in the absence of serial correlation (see Table 5). This is also consistent with the theory and can be attributed to the serial correlation e ects of u it on the ower function of the test, discussed in the revious section. For model M2, the results of Tables 9 and 0 indicate that the KT test has smaller ower than for model M. As was exected by the theory, the ower of the test is non-trivial if < 0. The KT test has also some small samle ower if > 0, which quali es its use in ractice. As was argued before, this ower can be attributed to second, or higher, order 2
23 e ects of the true ower function, which are not aroximated e ciently by our asymtotic aroximations. Finally, another interesting conclusion which can be drawn from the results of our simulation study reorted in Tables (7)-(0) is that, when <0, a break towards the end of the samle increases the ower of the KT test. When > 0, the ower of the test is maximized at the middle of the samle. These results aly to both models M and M2. They are also consistent with the theoretical results reorted in Table 4. 6 Conclusions This aer analyzes the asymtotic local ower roerties of least-squares based xed-t anel unit root tests allowing for a structural break in the deterministic comonents of the AR anel data model, namely its individual e ects and/or sloe coe cients of its individual linear (incidental) trends. This is done by assuming that the cross-section dimension of the anel data models grows large. Thus, the results of our analysis concern mainly alications of the above tests to short anels, often used in emirical microeconomic studies. The aer derives the limiting distributions under the sequence of local alternatives of extensions of Harris and Tzavalis (999) anel unit root tests (denoted as HT ) allowing for a structural break (see Karavias and Tzavalis (203)) and Karavias and Tzavalis (202) recently develoed anel data unit root tests (denoted as KT ). In addition to a structural break, the last test also allows for serial correlation in the error terms of the AR anel data model. Both of these tests are based on the least squares dummy variables estimator of the autoregressive coe cient of the AR anel data model which is corrected for its inconsistency due to the deterministic comonents of the anel and/or serial correlation e ects of the error term. 22
24 The results of the aer lead to a number of interesting conclusions. First, they show that, for the standard AR anel data model with white noise error terms and individual e ects, both the HT and KT tests have signi cant asymtotic local ower. The HT test has much higher ower than the KT. The ower of this test increases with T, in contrast to the KT test. The latter is found to be more aroriate for small T. This haens because, to adjust for the inconsistency of the least squares estimator, the KT test requires consistent estimation of the variance of the error term, which leads to a reduction of its ower. The HT test does not deend on this nuisance arameter, as it adjusts the least squares estimator for both the inconsistency of its numerator and denominator, and thus the variance of the error term is cancelled out. The HT test is found to have more ower when the break is towards the beginning or the end of the samle, while the KT test has more ower when the break is towards the middle of the samle. Second, both the HT and KT tests have asymtotically trivial ower in the case that the AR allows also for incidental trends. The allowance for a common break in the sloe coe cients of the incidental trends does not change the behavior of the tests. This roblem does not always exist for the KT test extended for serial correlation of the error term. In this case, the aer resents circumstances that the KT test has non-trivial ower. In articular, this haens when the error term follows a MA rocedure with negative serial correlation. The ower of the KT in this case can be attributed to the e ects of the serial correlation of error term on the adjustment of the least squares estimator of the autoregressive coe cient for its inconsistency, uon which the KT test is based on. In contrast to large-t anel data unit root tests, the ower function of xed-t tests deend on the values of nuisance arameters caturing serial correlation e ects which can a ect the asymtotic (over ) ower of the tests. The above results are con rmed through a Monte Carlo simulation exercise. 23
25 This exercise has shown that the emirical robabilities of rejection are very close to their theoretical values, which means that the asymtotic theory rovides a good aroximation of small samle results of xed-t anel data unit roots. References [] Arellano, M., 2003, Panel data econometrics, Oxford University Press, UK [2] Bai J., Carrion-I-Silvestre, J.L., Structural Changes, Common Stochastic Trends, and Unit Roots in Panel Data. Review of Economic Studies, vol. 76(2), [3] Carrion-i-Silvestre, J.L., Del Barrio-Castro, T., Loez-Bazo, E., Breaking the anels: An alication to real er caita GDP. Econometrics Journal, 8, [4] Chan, F., Pauwels, L.L., 20. Model seci cation in anel data unit root tests with an unknown break. Mathematics and Comuters in Simulation. 8, [5] Hahn, J., Kuersteiner, G., Asymtotically unbiased inference for a dynamic anel model with xed e ects when both n and T are large. Econometrica. 70, [6] Hadri K., Larsson, R., Rao, Y., 202. Testing for stationarity with a break in anels where the time dimension is nite. Bulletin of Economic Research, 64, s23-s48. [7] Harris D., Harvey D., Leybourne S., and Sakkas., 200. Local asymtotic ower of the Im-Pesaran-Shin anel unit root test and the imact of initial observations. Econometric Theory 26,
26 [8] Harris, D., Leybourne, S., and McCabe, B., Panel Stationarity Tests for Purchasing Power Parity with Cross-Sectional Deendence. Journal of Business & Economic Statistics, vol. 23, [9] Harris, R., Tzavalis, E., 999. Inference for unit roots in dynamic anels where the time dimension is xed. Journal of Econometrics, 9, [0] Harris, R., Tzavalis, E., Inference for unit roots for dynamic anels in the resence of deterministic trends: Do stock rices and dividends follow a random walk? Econometric Reviews 23, [] Harvey, D.I., Leybourne S.J., On testing for unit roots and the initial observation. Econometrics Journal 8, 97. [2] Karavias, Y., and Tzavalis, E., 202. Generalized xed-t Panel Unit Root Tests Allowing for Structural Breaks. Granger Centre Discussion Paer Series, o 2/02. [3] Karavias, Y., and Tzavalis, E., 203. Testing for unit roots in short anels allowing for structural breaks. Comutational Statistics and Data Analysis. (In ress). htt://dx.doi.org/0.06/j.csda [4] Kruiniger, H., Maximum Likelihood Estimation and Inference Methods for the Covariance Stationary Panel AR/Unit Root Model. Journal of Econometrics 44, [5] Kruiniger, H., and E., Tzavalis, Testing for unit roots in short dynamic anels with serially correlated and heteroscedastic disturbance terms. Working Paers 459, Deartment of Economics, Queen Mary, University of London, London. 25
27 [6] Madsen E., 200. Unit root inference in anel data models where the time-series dimension is xed: a comarison of di erent tests. Econometrics Journal 3, [7] Meligkotsidou, L., Tzavalis, E., Vrontos I.D., 20. A Bayesian analysis of unit roots and structural breaks in the level, the trend and the error variance of autoregressive models of economic series. Econometric Reviews, 30 (2), [8] Moon, H.R., Perron, B., Asymtotic local ower of ooled t-ratio tests for unit roots in anels with xed e ects. Econometrics Journal, [9] Moon, H.R., Perron, B., Phillis, P.C.B., Incidental trends and the ower of anel unit root tests. Journal of Econometrics, 4(2), [20] Pauwels, L.L., Chan, F., Mancini, G.T., 202. Testing for Structural Change in Heterogeneous Panels with an Alication to the Euro s Trade E ect. Journal of Time Series Econometrics, 4(2), Article 3. [2] Perron, P., 989. The great crash, the oil rice shock, and the unit root hyothesis. Econometrica, 57, [22] Schott, J.R., 996. Matrix Analysis for Statistics, Wiley-Interscience. 6. Aendix In this aendix, we rovide roofs of the theorems and the corollary resented in the main text of the aer. Proof of Theorem : First, we derive the limiting distribution of the HT test statistic, under the sequence of local alternatives ' = c. De ne vector w = (; ' ; ' 2 ; :::; 'T )0 26
28 and matrix 0 = 0 : : : : : 0 0 : ' : : ' 2 ' : : : : : : : : : : 0 : ' T 2 ' T 3 : : ' 0 C A Under null hyothesis H 0 : c = 0; we have = : The rst order Taylor exansions of and w yields = + F (' ) + o and (5) w = e + f(' ) + o P, (6) resectively, where F = d d', vector y i can be written as j c=0 and f = dw d' j c=0. Based on the above de nitions of w and y i = wy i0 + X i + u i, (7) where i = (a i ( ' ); a (2) i ( ' )) 0 = ( ' )(a i ; a (2) i ) 0 : Using last relationshi of 27
29 y i, the HT test statistic for model M can be written under ' = c as follows: (^' ' B ) (8) 0 = y i 0 Q (' y i + X i + u i ) i= B ' C A ; y i 0 = = i= i= X yi 0 i= y 0 i y 0 i i= y 0 i Q u i Q Q y i B Q u i B i= y 0 i i= y 0 i i= i= y 0 i y 0 i Q y i Q y i Q y i Q y i = C A ; (A) (B) : (9) (C) ext, we derive asymtotic results of each of quantities (A); (B) and (C), de ned by (9). Substituting (7) in (A), we have (A) = X yi 0 i= X i= Q u i = y i0 w 0 Q u i + 0 i X i= X 0 y i0 w i X u 0 i 0 0 Q u i + u 0 i 0 Q u i Q u i Using relationshis (5)-(6), we can nd the following limits of the summands entering into the last relationshi of (A). First, it can be shown that X i= y i0 w 0 Q u i = = X i= X i= y i0 (e 0 + f 0 (' y i0 e 0 Q u i + c ))Q u i + o P ; i= y i0 f 0 Q u i + o P ; = o P ; (0) 28
30 since e 0 Q = 0 and E(y i0 u i ) = 0 by assumtion (b5), and = = = c X i= X i= X i= = o ; i= 0 i X 0 0 Q u i 0 i X 0 ( 0 + F 0 (' ) + o )Q u i ; 0 i X 0 0 Q u i + c (a i= i ; a (2) i ) 0 X 0 0 Q u i + c2 3=2 0 i X 0 F 0 Q u i + o ; i= (a i ; a (2) i ) 0 X 0 F 0 Q u i +o ; since E(a i u i ) = 0 by assumtion (b5). Finally, we have X i= u 0 i 0 Q u i = = X i= X i= u 0 i ( 0 + F 0 (' u 0 i 0 Q u i c ) + o ) Q u i ; i= u 0 if 0 Q u i + o ; where c i= u 0 if 0 Q u i! c 2 u tr(f 0 Q ) and (2) i= u 0 i 0 Q u i 2 utr( 0 Q )! d! (0; V HT;A ); (3) where V HT;A is the variance of the last limiting distribution. Based on the asymtotic results given by equations (0)-(3), we can show that (A) X yi 0 i= Q u d i! c 2 utr(f 0 Q ); V HT;A : (4) 29
31 To derive asymtotic results for summand (B), write it as follows: (B) B = B i= i= y 0 i Q y i y i0 w i X u 0 i 0 Q y i0 w + X i + u i : By similar arguments to those alied to derive results (0)-(3), we can rove the following asymtotic results: X i= X i= yi0w 2 0 Q w + y i0 w 0 Q X i + y i0 w 0 Q u i 0 i X 0 0 Q wy i0 + 0 i X i= X 0 0 Q X i +X u 0 i 0 Q wy i0 + u 0 i 0 Q X i = o ; (5) i u i ) = o ; (6) = o ; (7) X i= u 0 i 0 Q u i = X i= u 0 i( 0 + F 0 (' ))Q ( + F (' ))u i + o ; (8) where c c i= i= i= u 0 i 0 Q u i 2 utr( 0 Q )! d! (0; V HT;B ); (9) u 0 if 0 Q u i! 2 u tr(f 0 Q ); (20) u 0 i 0 Q F u i! 2 u tr( 0 Q F ) and (2) c 2 3=2 i= u 0 if 0 Q F u i = o : (22) 30
32 Based on the above results, given by equations (5)-(22), it can be shown that (B) B y 0 i Q y i d! (23) i= c 2 ub [tr(f 0 Q ) + tr( 0 Q F )]; BV 2 HT;B : Finally, following similar arguments to the above, we can easily show that, for quantity (C), the following asymtotic result holds: (C) i= y 0 i Q y i! 2 u tr( 0 Q ): (24) Using asymtotic results (4), (23) and (24), equation (9) imlies that (^' ' B )! d c tr(f 0 Q ) 2B tr(f 0 Q ) tr( 0 Q ) ; V HT; or (^' B )! d c tr(f 0 Q ) + tr( 0 Q ) 2B tr(f 0 Q ) tr( 0 Q )! ; (25) ; V HT; since tr( 0 Q ) B tr( 0 Q ) = 0. ote that the analytic formula of variance V HT; of the last limiting distribution is the same with that of the HT test under null hyothesis H 0 : c = 0, given by V HT; = 2tr(A2 HT; ) tr( 0 Q )2. This does not deend on local arameter c. It remains the same under the null and sequence of local alternative hyotheses (see, e.g., Madsen (200) and Karavias and Tzavalis (203)), given as V HT; = 2tr(A2 HT; ) tr( 0 Q! =2. Scaling by V HT; )2 ; 3
33 the above limiting distribution yields V =2 HT; (^' B )! d ( ck HT; ; ), with (26) k HT; = tr(f 0 Q ) + tr(0q ) 2B tr(f 0 Q ) q. 2tr(A 2 HT; ) Substituting into the above formula of k HT; the following identities: tr(f 0 Q ) = tr( 0 Q F ) = (27) = 6 44 ( )T 3 2 ( )T 2 24 T + 6 tr( 0 Q ) + tr(f 0 Q ) + tr( 0 Q ) = 0; (28) tr(f 0 Q ) = tr( 0 Q ) = tr( 0 Q ) = T 2 6 ( ) T 2 6 ( ) + T ; (29) T 2 ; 2 (30) 2 6 ; (3) 2 tr 0 Q + Q 2 tr 0 Q tr 0 Q + Q 0 Q " # 2 tr(a 2 HT; ) = tr 2 (0 Q + Q ) B ( 0 Q ) (32) ; = T 2 6 ( ) + T 7 3 ; (33) = 90 ( )T 4 (34) + 36 ( )T ; = T 2 ; (35) 2 yields the results of Theorem, for the HT test statistic. ote that 2tr(A 2 HT; ) can be 32
34 analytically written as 2tr(A 2 HT; ) = D S, where D = T 6 R + T 5 R 2 + T 4 R 3 + T 2 R T 36; S = T 4 + T ; R = ; R 2 = ; R 3 = ; R 4 = ; = and 2 = To derive the limiting distribution of the KT test under the sequence of local alternatives ' = c, write ^ ^' ^b ^ '! = ^ = = 0 ' + i= i= y 0 i y 0 i i= i= y 0 i y 0 i Q u i Q y 0 i Q u i ^ 2 utr( 0 Q ) Q u i i= y 0 i ^b ^! ; '! y i ; C A ; = X yi 0 i= Q u i X yi 0 i= y i, (36) 33
35 where y i can be written as y i = u i + (' )y i + X i : (37) The limiting distribution of the KT test under ' = asymtotic results for the two summands entering into equation (36), i.e., and X yi 0 i= c can be roved by obtaining X yi 0 i= Q u i y i, following analogous to the roof of (26) stes. The formula of sloe ower arameter k KT; is given as k KT; = tr(f 0 Q ) q : (38) 2tr(A 2 KT; ) Substituting the following identities into the above formula of k KT; : tr(a 2 KT; ) = tr 2 (0 Q + Q! 2 0 ) ; (39) tr( ) = tr( 0 ) = 0; (40) 2tr(A 2 KT; ) = 2tr(P ) 2tr(Z 2 ); with Z = 2 ( 0 + ) (4) and P = 2 (0 Q ) Q ; (42) tr ( 0 Q ) 2 = tr(z 2 ) = T 2 2 (22 2 ) + T 5 and (43) ( )T T (44) 6( ) yields the results of Theorem, for the KT statistic. Proof of Corollary : The results of the corollary and, in articular, those of equation 34
36 can be derived based on analogous arguments to those alied for the roof of Theorem. To obtain the analytic formula of k HT;, given by equation, scale (8) by T, relace ' with ' ;T, and aly asymtotic theory for!, as in Theorem. Then, we will have T (^' ' ;T B )! d c tr(f 0 Q ) 2B tr(f 0 Q ) tr( 0 Q ) ; T 2 V HT;! : Multilying with =2 T 2 V HT; and using c ';T = T, the last limiting distribution can be written as T =2 T 2 V HT; (^' B )! d c T k HT;; (45) where k HT; = tr(f 0 Q )+tr(0q ) 2B tr(f 0 Q r ) 2tr(A 2 HT; ) limit T! of k HT;, V HT; and ' ;T, (45) can be written as (see roof of Theorem ). By taking the T V HT; =2 (^' B )! d ckht;;, where r kht; lim T T k HT; = ( ) R V HT; lim T T 2 V HT; = 36R (2 2 2 ) 2 : and The analytic formulas of the last two limits are derived based on the results of identities (27)- (35). The above results have been derived by taking sequentially limits, rst for! and, then, for T!. Joint convergence in ; T requires the extra assumtion that T! 0, see also Moon and Perron (2008). However, for c = 0 there is no need to secify the relative 35
37 rate of convergence between and T (see Hahn and Kuersteiner (2002) and Karavias and Tzavalis (203)). The formulas of k KT; and VKT;, given by the corollary for the large-t version of the KT test, can be derived by following similar stes to the above. Then, using the results of identities (39)-(44), we can obtain k KT; lim T T k KT; = 0 and V KT; lim T T 2 V KT; 36( ) 2( )( ) : 2 Proof of Theorem 2: To rove the theorem, we will follow analogous stes to those for the roof of Theorem. We now will rely on relationshis (7) and (37), where now vector i is de ned as i = 0 ( ' )a i + ' i ( ' )a (2) i + ' (2) i ( ' ) i ( ' ) (2) i = e i + ( ' ) i, C A due to the resence of individual trends under ' ;T = 0 (2) i ; i ; (2) i ) 0 ; e = c T, where i = ( i i ; (2) i C A and i = ( i ; (2) i ) 0. The non-standardized HT test
38 statistic for model M2 can be written as follows: (^' 2 ' B 2 ) 0 = y i 0 i= = X yi 0 i= Q 2 (' y i + X 2 i + u i ) i= y 0 i ' B 2 C A 2 y i Q Q 2 u i B 2 i= y 0 i i= y 0 i Q 2 y i Q 2 y i = (A 0 ) (B 0 ), (C 0 ) where (A 0 ) X yi 0 i= Q 2 u i, (B 0 ) B 2 i= y 0 i Q 2 y i and (C 0 ) i= y 0 i Q 2 y i. As in the roof of Theorem, next we derive asymtotic results of (A 0 ), (B 0 ) and (C 0 ), using i = e i + ( ' ) i. The most imortant ones are the following: c c c c i= i= i= i= i= 0 ie 0 X Q 2 X 2 e i tr(e 0 X Q 2 X 2 e E( i 0 i)) 0 ie 0 X 0 2 F 0 Q 2 e i! ctr(e 0 X 0 2 F 0 Q 2 e E( i 0 i)) 0 ie 0 X Q 2 F X 2 e i! ctr(e 0 X Q 2 F e E( i 0 i)) 0 ix Q 2 X 2 e i! ctr(x Q 2 X 2 e E( i 0 i)) 0 ie 0 X Q 2 X 2 i! ctr(e 0 X Q 2 X 2 E( i 0 i))! d! (0; V HT;4 ) Given these results, the roof of Theorem 2 for the test statistic HT follows immediately, 37
39 after using the following identities: tr(e 0 X Q 2 X 2 e E( i 0 i)) = 0 tr(e 0 X 0 2 F 0 Q 2 e E( i 0 i)) tr(e 0 X Q 2 F e E( i 0 i)) = 0 and tr(x Q 2 X 2 e E( i 0 i)) tr(e 0 X Q 2 X 2 E( i 0 i)) = 0. The roof of the second result of the theorem, i.e., k KT;2 = 0, can be roved by following analogous stes to the above and using the following identities: tr(e 0 X X 2 e E( i 0 i)) tr(e 0 X X 2 e E( i 0 i)) = 0 and tr(x X 2 e E( i 0 i)) tr(e 0 X X 2 E( i 0 i)) = 0. Proof of Theorem 3: This can be roved by following analogous stes to the roof of Theorem, for the KT test statistic, by setting E(u i u 0 i) = instead of 2 ui T : Proof of Theorem 4: This can be roved by following analogous stes to the roof of Theorems 2 and 3, for the KT test statistic. 38
40 7 Tables Table : Values of k HT; and k KT; for model M k HT; k KT; nt Table 2: Values of sloe arameters kht; and k KT; kht kkt Table 3: Values of k KT; for model M, with u it = " it + " it T T 0 = 0:8 = 0:5 = 0:0 = 0:5 = 0: Table 4: Values of k KT;2 for model M2, with u it = " it + " it T T 0 = 0:8 = 0:5 = 0:0 = 0:5 = 0: :08 0: :09 0: 0 5 0:20 0:5 0 0:2 0:4 7 0:66 0:46 0 0:2 0: :47 0:32 0 0:3 0:5 0:75 0:53 0 0:20 0: :7 0: 0 0:03 0:04 0 0:70 0:45 0 0:5 0:7 5 0:80 0:54 0 0:7 0:20 39
41 Table 5: Simulated values of k HT; and k KT; for model M, with u it IID(0; 2 u) TV T =8 = 0:25 c=0 HT KT c= HT KT = 0:5 c=0 HT KT c= HT KT = 0:75 c=0 HT KT c= HT KT T =0 = 0:25 c=0 HT KT c= HT KT = 0:5 c=0 HT KT c= HT KT = 0:75 c=0 HT KT c= HT KT
42 Table 6: Simulated values of k HT;2 and k KT;2 for model M, with u it IID(0; 2 u) TV T=8 = 0:25 c=0 HT KT c= HT KT = 0:5 c=0 HT KT c= HT KT = 0:75 c=0 HT KT c= HT KT T=0 = 0:25 c=0 HT KT c= HT KT = 0:5 c=0 HT KT c= HT KT = 0:75 c=0 HT KT c= HT KT
43 Table 7: Simulated values of ower k KT; for model M, with u it =" it + " it (T = 8) TV = 0:8 = 0:25 c = c = = 0:50 c = c = = 0:75 c = c = = 0:5 = 0:25 c = c = = 0:50 c = c = = 0:75 c = c = = 0:5 = 0:25 c = c = = 0:50 c = c = = 0:75 c = c = = 0:8 = 0:25 c = c = = 0:50 c = c = = 0:75 c = c =
44 Table 8: Simulated values of k KT; for model M, with u it =" it + " it (T = 0) TV = 0:8 = 0:25 c = c = = 0:50 c = c = = 0:75 c = c = = 0:5 = 0:25 c = c = = 0:50 c = c = = 0:75 c = c = = 0:5 = 0:25 c = c = = 0:50 c = c = = 0:75 c = c = = 0:8 = 0:25 c = c = = 0:50 c = c = = 0:75 c = c = Table 9: Simulated values of ower k KT;2 for model M2, with u it =" it + " it (T = 8) TV = 0:8 = 0:50 c = c = = 0:5 = 0:50 c = c = = 0:5 = 0:50 c = c = = 0:8 = 0:50 c = c =

45 Table 0: Simulated values of ower k KT;2 for model M2, with u it =" it + " it (T = 0) TV = 0:8 = 0:50 c = c = = 0:75 c = c = = 0:5 = 0:50 c = c = = 0:75 c = c = = 0:5 = 0:50 c = c = = 0:75 c = c = = 0:8 = 0:50 c = c = = 0:75 c = c =
46 45
Johan Lyhagen Department of Information Science, Uppsala University. Abstract
 Why not use standard anel unit root test for testing PPP Johan Lyhagen Deartment of Information Science, Usala University Abstract In this aer we show the consequences of alying a anel unit root test that
Estimating Time-Series Models
 Estimating ime-series Models he Box-Jenkins methodology for tting a model to a scalar time series fx t g consists of ve stes:. Decide on the order of di erencing d that is needed to roduce a stationary
Elements of Asymptotic Theory. James L. Powell Department of Economics University of California, Berkeley
 Elements of Asymtotic Theory James L. Powell Deartment of Economics University of California, Berkeley Objectives of Asymtotic Theory While exact results are available for, say, the distribution of the
A Simple Panel Stationarity Test in the Presence of Cross-Sectional Dependence
 A Simle Panel Stationarity est in the Presence of Cross-Sectional Deendence Kaddour Hadri Eiji Kurozumi 2 Queen s University Management School Deartment of Economics Queen s University Hitotsubashi University
A fixed-t version of Breitung s panel data unit root test and its asymptotic local power
 A fixed-t version of Breitung s panel data unit root test and its asymptotic local power by Yiannis Karavias and Elias Tzavalis Granger Centre Discussion Paper o. 4/02 A fixed-t Version of Breitung s Panel
Chapter 3. GMM: Selected Topics
 Chater 3. GMM: Selected oics Contents Otimal Instruments. he issue of interest..............................2 Otimal Instruments under the i:i:d: assumtion..............2. he basic result............................2.2
The Nottingham eprints service makes this work by researchers of the University of Nottingham available open access under the following conditions.
 Harvey, David I. and Leybourne, Stehen J. and Taylor, A.M. Robert (04) On infimum Dickey Fuller unit root tests allowing for a trend break under the null. Comutational Statistics & Data Analysis, 78..
On the asymptotic sizes of subset Anderson-Rubin and Lagrange multiplier tests in linear instrumental variables regression
 On the asymtotic sizes of subset Anderson-Rubin and Lagrange multilier tests in linear instrumental variables regression Patrik Guggenberger Frank Kleibergeny Sohocles Mavroeidisz Linchun Chen\ June 22
Estimation of the large covariance matrix with two-step monotone missing data
 Estimation of the large covariance matrix with two-ste monotone missing data Masashi Hyodo, Nobumichi Shutoh 2, Takashi Seo, and Tatjana Pavlenko 3 Deartment of Mathematical Information Science, Tokyo
Testing Weak Cross-Sectional Dependence in Large Panels
 esting Weak Cross-Sectional Deendence in Large Panels M. Hashem Pesaran University of Southern California, and rinity College, Cambridge January, 3 Abstract his aer considers testing the hyothesis that
 A Simle Panel Stationarity itle Cross-Sectional Deendence est in Author(s) Hadri, Kaddour; Kurozumi, Eiji Citation Issue 00-06 Date ye echnical Reort ext Version ublisher URL htt://hdl.handle.net/0086/8605
Bias in Dynamic Panel Models under Time Series Misspeci cation
 Bias in Dynamic Panel Models under Time Series Misseci cation Yoonseok Lee August 2 Abstract We consider within-grou estimation of higher-order autoregressive anel models with exogenous regressors and
Estimation of spatial autoregressive panel data models with xed e ects
 Estimation of satial autoregressive anel data models with xed e ects Lung-fei Lee Deartment of Economics Ohio State University l eeecon.ohio-state.edu Jihai Yu Deartment of Economics University of Kentucky
Heteroskedasticity, Autocorrelation, and Spatial Correlation Robust Inference in Linear Panel Models with Fixed-E ects
 Heteroskedasticity, Autocorrelation, and Satial Correlation Robust Inference in Linear Panel Models with Fixed-E ects Timothy J. Vogelsang Deartments of Economics, Michigan State University December 28,
Adaptive Estimation of the Regression Discontinuity Model
 Adative Estimation of the Regression Discontinuity Model Yixiao Sun Deartment of Economics Univeristy of California, San Diego La Jolla, CA 9293-58 Feburary 25 Email: yisun@ucsd.edu; Tel: 858-534-4692
Lower Confidence Bound for Process-Yield Index S pk with Autocorrelated Process Data
 Quality Technology & Quantitative Management Vol. 1, No.,. 51-65, 15 QTQM IAQM 15 Lower onfidence Bound for Process-Yield Index with Autocorrelated Process Data Fu-Kwun Wang * and Yeneneh Tamirat Deartment
Exercises Econometric Models
 Exercises Econometric Models. Let u t be a scalar random variable such that E(u t j I t ) =, t = ; ; ::::, where I t is the (stochastic) information set available at time t. Show that under the hyothesis
Elements of Asymptotic Theory. James L. Powell Department of Economics University of California, Berkeley
 Elements of Asymtotic Theory James L. Powell Deartment of Economics University of California, Berkeley Objectives of Asymtotic Theory While exact results are available for, say, the distribution of the
Local Power of Panel Unit Root Tests Allowing for. Structural Breaks
 Local Power o Panel Unit Root Tests Allowing or Structural Breaks Yiannis Karavias a, and Elias Tzavalis b Abstract The asymptotic local power o least squares based ixed-t panel unit root tests allowing
Supplementary Materials for Robust Estimation of the False Discovery Rate
 Sulementary Materials for Robust Estimation of the False Discovery Rate Stan Pounds and Cheng Cheng This sulemental contains roofs regarding theoretical roerties of the roosed method (Section S1), rovides
MAKING WALD TESTS WORK FOR. Juan J. Dolado CEMFI. Casado del Alisal, Madrid. and. Helmut Lutkepohl. Humboldt Universitat zu Berlin
 November 3, 1994 MAKING WALD TESTS WORK FOR COINTEGRATED VAR SYSTEMS Juan J. Dolado CEMFI Casado del Alisal, 5 28014 Madrid and Helmut Lutkeohl Humboldt Universitat zu Berlin Sandauer Strasse 1 10178 Berlin,
On split sample and randomized confidence intervals for binomial proportions
 On slit samle and randomized confidence intervals for binomial roortions Måns Thulin Deartment of Mathematics, Usala University arxiv:1402.6536v1 [stat.me] 26 Feb 2014 Abstract Slit samle methods have
Time Series Models and Inference. James L. Powell Department of Economics University of California, Berkeley
 Time Series Models and Inference James L. Powell Department of Economics University of California, Berkeley Overview In contrast to the classical linear regression model, in which the components of the
The following document is intended for online publication only (authors webpage).
.") The following document is intended for online ublication only (authors webage). Sulement to Identi cation and stimation of Distributional Imacts of Interventions Using Changes in Inequality Measures, Part
The following document is intended for online ublication only (authors webage). Sulement to Identi cation and stimation of Distributional Imacts of Interventions Using Changes in Inequality Measures, Part
GMM-based inference in the AR(1) panel data model for parameter values where local identi cation fails
 panel data model for parameter values where local identi cation fails") GMM-based inference in the AR() panel data model for parameter values where local identi cation fails Edith Madsen entre for Applied Microeconometrics (AM) Department of Economics, University of openhagen,
GMM-based inference in the AR() panel data model for parameter values where local identi cation fails Edith Madsen entre for Applied Microeconometrics (AM) Department of Economics, University of openhagen,
A Comparison between Biased and Unbiased Estimators in Ordinary Least Squares Regression
 Journal of Modern Alied Statistical Methods Volume Issue Article 7 --03 A Comarison between Biased and Unbiased Estimators in Ordinary Least Squares Regression Ghadban Khalaf King Khalid University, Saudi
Towards understanding the Lorenz curve using the Uniform distribution. Chris J. Stephens. Newcastle City Council, Newcastle upon Tyne, UK
 Towards understanding the Lorenz curve using the Uniform distribution Chris J. Stehens Newcastle City Council, Newcastle uon Tyne, UK (For the Gini-Lorenz Conference, University of Siena, Italy, May 2005)
ON THE LEAST SIGNIFICANT p ADIC DIGITS OF CERTAIN LUCAS NUMBERS
 #A13 INTEGERS 14 (014) ON THE LEAST SIGNIFICANT ADIC DIGITS OF CERTAIN LUCAS NUMBERS Tamás Lengyel Deartment of Mathematics, Occidental College, Los Angeles, California lengyel@oxy.edu Received: 6/13/13,
i) the probability of type I error; ii) the 95% con dence interval; iii) the p value; iv) the probability of type II error; v) the power of a test.
 the probability of type I error; ii) the 95% con dence interval; iii) the p value; iv) the probability of type II error; v) the power of a test.") Problem Set 5. Questions:. Exlain what is: i) the robability of tye I error; ii) the 95% con dence interval; iii) the value; iv) the robability of tye II error; v) the ower of a test.. Solve exercise 3.
Problem Set 5. Questions:. Exlain what is: i) the robability of tye I error; ii) the 95% con dence interval; iii) the value; iv) the robability of tye II error; v) the ower of a test.. Solve exercise 3.
Debt, In ation and Growth
 Debt, In ation and Growth Robust Estimation of Long-Run E ects in Dynamic Panel Data Models Alexander Chudik a, Kamiar Mohaddes by, M. Hashem Pesaran c, and Mehdi Raissi d a Federal Reserve Bank of Dallas,
Notes on Instrumental Variables Methods
 Notes on Instrumental Variables Methods Michele Pellizzari IGIER-Bocconi, IZA and frdb 1 The Instrumental Variable Estimator Instrumental variable estimation is the classical solution to the roblem of
Hotelling s Two- Sample T 2
 Chater 600 Hotelling s Two- Samle T Introduction This module calculates ower for the Hotelling s two-grou, T-squared (T) test statistic. Hotelling s T is an extension of the univariate two-samle t-test
Combining Logistic Regression with Kriging for Mapping the Risk of Occurrence of Unexploded Ordnance (UXO)
") Combining Logistic Regression with Kriging for Maing the Risk of Occurrence of Unexloded Ordnance (UXO) H. Saito (), P. Goovaerts (), S. A. McKenna (2) Environmental and Water Resources Engineering, Deartment
Combining Logistic Regression with Kriging for Maing the Risk of Occurrence of Unexloded Ordnance (UXO) H. Saito (), P. Goovaerts (), S. A. McKenna (2) Environmental and Water Resources Engineering, Deartment
Introduction Model secication tests are a central theme in the econometric literature. The majority of the aroaches fall into two categories. In the r
 Reversed Score and Likelihood Ratio Tests Geert Dhaene Universiteit Gent and ORE Olivier Scaillet Universite atholique de Louvain January 2 Abstract Two extensions of a model in the resence of an alternative
Cambridge-INET Institute
 Faculty of Economics Cambridge-INET Institute Cambridge-INET Working Paer Series No: 4/3 Cambridge Working Paer in Economics: 45 THE CROSS-QUANTILOGRAM: MEASURING QUANTILE DEPENDENCE AND TESTING DIRECTIONAL
QML estimation of spatial dynamic panel data models with time varying spatial weights matrices
 QML estimation of satial dynamic anel data models with time varying satial weights matrices Lung-fei Lee Deartment of Economics Ohio State University Jihai Yu Guanghua School of Management eking University
SIGNALING IN CONTESTS. Tomer Ifergane and Aner Sela. Discussion Paper No November 2017
 SIGNALING IN CONTESTS Tomer Ifergane and Aner Sela Discussion Paer No. 17-08 November 017 Monaster Center for Economic Research Ben-Gurion University of the Negev P.O. Box 653 Beer Sheva, Israel Fax: 97-8-647941
Linear diophantine equations for discrete tomography
 Journal of X-Ray Science and Technology 10 001 59 66 59 IOS Press Linear diohantine euations for discrete tomograhy Yangbo Ye a,gewang b and Jiehua Zhu a a Deartment of Mathematics, The University of Iowa,
4. Score normalization technical details We now discuss the technical details of the score normalization method.
 SMT SCORING SYSTEM This document describes the scoring system for the Stanford Math Tournament We begin by giving an overview of the changes to scoring and a non-technical descrition of the scoring rules
1 Gambler s Ruin Problem
 Coyright c 2017 by Karl Sigman 1 Gambler s Ruin Problem Let N 2 be an integer and let 1 i N 1. Consider a gambler who starts with an initial fortune of $i and then on each successive gamble either wins
Tests for Cointegration, Cobreaking and Cotrending in a System of Trending Variables
 Tests for Cointegration, Cobreaking and Cotrending in a System of Trending Variables Josep Lluís Carrion-i-Silvestre University of Barcelona Dukpa Kim y Korea University May 4, 28 Abstract We consider
arxiv: v1 [physics.data-an] 26 Oct 2012
![arxiv: v1 [physics.data-an] 26 Oct 2012](/thumbs/93/114154382.jpg "arxiv: v1 [physics.data-an] 26 Oct 2012") Constraints on Yield Parameters in Extended Maximum Likelihood Fits Till Moritz Karbach a, Maximilian Schlu b a TU Dortmund, Germany, moritz.karbach@cern.ch b TU Dortmund, Germany, maximilian.schlu@cern.ch
Constraints on Yield Parameters in Extended Maximum Likelihood Fits Till Moritz Karbach a, Maximilian Schlu b a TU Dortmund, Germany, moritz.karbach@cern.ch b TU Dortmund, Germany, maximilian.schlu@cern.ch
A multiple testing approach to the regularisation of large sample correlation matrices
 A multile testing aroach to the regularisation of large samle correlation matrices Natalia Bailey Queen Mary, University of London M. Hashem Pesaran University of Southern California, USA, and rinity College,
Asymptotic F Test in a GMM Framework with Cross Sectional Dependence
 Asymtotic F Test in a GMM Framework with Cross Sectional Deendence Yixiao Sun Deartment of Economics University of California, San Diego Min Seong Kim y Deartment of Economics Ryerson University First
Unit Roots and Structural Breaks in Panels: Does the Model Specification Matter?
 18th World IMACS / MODSIM Congress, Cairns, Australia 13-17 July 2009 http://mssanz.org.au/modsim09 Unit Roots and Structural Breaks in Panels: Does the Model Specification Matter? Felix Chan 1 and Laurent
Elementary Analysis in Q p
 Elementary Analysis in Q Hannah Hutter, May Szedlák, Phili Wirth November 17, 2011 This reort follows very closely the book of Svetlana Katok 1. 1 Sequences and Series In this section we will see some
On a Markov Game with Incomplete Information
 On a Markov Game with Incomlete Information Johannes Hörner, Dinah Rosenberg y, Eilon Solan z and Nicolas Vieille x{ January 24, 26 Abstract We consider an examle of a Markov game with lack of information
Notes on Time Series Modeling
 Notes on Time Series Modeling Garey Ramey University of California, San Diego January 17 1 Stationary processes De nition A stochastic process is any set of random variables y t indexed by t T : fy t g
Tests for Two Proportions in a Stratified Design (Cochran/Mantel-Haenszel Test)
") Chater 225 Tests for Two Proortions in a Stratified Design (Cochran/Mantel-Haenszel Test) Introduction In a stratified design, the subects are selected from two or more strata which are formed from imortant
Chater 225 Tests for Two Proortions in a Stratified Design (Cochran/Mantel-Haenszel Test) Introduction In a stratified design, the subects are selected from two or more strata which are formed from imortant
1 Extremum Estimators
 FINC 9311-21 Financial Econometrics Handout Jialin Yu 1 Extremum Estimators Let θ 0 be a vector of k 1 unknown arameters. Extremum estimators: estimators obtained by maximizing or minimizing some objective
ASYMPTOTIC RESULTS OF A HIGH DIMENSIONAL MANOVA TEST AND POWER COMPARISON WHEN THE DIMENSION IS LARGE COMPARED TO THE SAMPLE SIZE
 J Jaan Statist Soc Vol 34 No 2004 9 26 ASYMPTOTIC RESULTS OF A HIGH DIMENSIONAL MANOVA TEST AND POWER COMPARISON WHEN THE DIMENSION IS LARGE COMPARED TO THE SAMPLE SIZE Yasunori Fujikoshi*, Tetsuto Himeno
MATHEMATICAL MODELLING OF THE WIRELESS COMMUNICATION NETWORK
 Comuter Modelling and ew Technologies, 5, Vol.9, o., 3-39 Transort and Telecommunication Institute, Lomonosov, LV-9, Riga, Latvia MATHEMATICAL MODELLIG OF THE WIRELESS COMMUICATIO ETWORK M. KOPEETSK Deartment
Using the Divergence Information Criterion for the Determination of the Order of an Autoregressive Process
 Using the Divergence Information Criterion for the Determination of the Order of an Autoregressive Process P. Mantalos a1, K. Mattheou b, A. Karagrigoriou b a.deartment of Statistics University of Lund
E-companion to A risk- and ambiguity-averse extension of the max-min newsvendor order formula
 e-comanion to Han Du and Zuluaga: Etension of Scarf s ma-min order formula ec E-comanion to A risk- and ambiguity-averse etension of the ma-min newsvendor order formula Qiaoming Han School of Mathematics
Road Traffic Accidents in Saudi Arabia: An ARDL Approach and Multivariate Granger Causality
 MPRA Munich Personal RePEc Archive Road Traffic Accidents in Saudi Arabia: An ARDL Aroach and Multivariate Granger Causality Mohammed Moosa Ageli King Saud University, RCC, Riyadh, Saudi Arabia 24. Aril
MATH 2710: NOTES FOR ANALYSIS
 MATH 270: NOTES FOR ANALYSIS The main ideas we will learn from analysis center around the idea of a limit. Limits occurs in several settings. We will start with finite limits of sequences, then cover infinite
Bootstrap Inference for Impulse Response Functions in Factor-Augmented Vector Autoregressions
 Bootstra Inference for Imulse Resonse Functions in Factor-Augmented Vector Autoregressions Yohei Yamamoto y University of Alberta, School of Business February 2010 Abstract his aer investigates standard
The non-stochastic multi-armed bandit problem
 Submitted for journal ublication. The non-stochastic multi-armed bandit roblem Peter Auer Institute for Theoretical Comuter Science Graz University of Technology A-8010 Graz (Austria) auer@igi.tu-graz.ac.at
Maximum Likelihood Asymptotic Theory. Eduardo Rossi University of Pavia
 Maximum Likelihood Asymtotic Theory Eduardo Rossi University of Pavia Slutsky s Theorem, Cramer s Theorem Slutsky s Theorem Let {X N } be a random sequence converging in robability to a constant a, and
Performance of lag length selection criteria in three different situations
 MPRA Munich Personal RePEc Archive Performance of lag length selection criteria in three different situations Zahid Asghar and Irum Abid Quaid-i-Azam University, Islamabad Aril 2007 Online at htts://mra.ub.uni-muenchen.de/40042/
Research Note REGRESSION ANALYSIS IN MARKOV CHAIN * A. Y. ALAMUTI AND M. R. MESHKANI **
 Iranian Journal of Science & Technology, Transaction A, Vol 3, No A3 Printed in The Islamic Reublic of Iran, 26 Shiraz University Research Note REGRESSION ANALYSIS IN MARKOV HAIN * A Y ALAMUTI AND M R
COMMUNICATION BETWEEN SHAREHOLDERS 1
 COMMUNICATION BTWN SHARHOLDRS 1 A B. O A : A D Lemma B.1. U to µ Z r 2 σ2 Z + σ2 X 2r ω 2 an additive constant that does not deend on a or θ, the agents ayoffs can be written as: 2r rθa ω2 + θ µ Y rcov
BOOTSTRAP FOR PANEL DATA MODELS
 BOOSRAP FOR PAEL DAA MODELS Bertrand HOUKAOUO Université de Montréal, CIREQ July 3, 2008 Preliminary, do not quote without ermission. Astract his aer considers ootstra methods for anel data models with
Benoît MULKAY Université de Montpellier. January Preliminary, Do not quote!
 Bivariate Probit Estimation for Panel Data: a two-ste Gauss-Hermite Quadrature Aroach with an alication to roduct and rocess innovations for France Benoît MULKAY Université de Montellier January 05 Preliminary,
The Fekete Szegő theorem with splitting conditions: Part I
 ACTA ARITHMETICA XCIII.2 (2000) The Fekete Szegő theorem with slitting conditions: Part I by Robert Rumely (Athens, GA) A classical theorem of Fekete and Szegő [4] says that if E is a comact set in the
CHAPTER 5 STATISTICAL INFERENCE. 1.0 Hypothesis Testing. 2.0 Decision Errors. 3.0 How a Hypothesis is Tested. 4.0 Test for Goodness of Fit
 Chater 5 Statistical Inference 69 CHAPTER 5 STATISTICAL INFERENCE.0 Hyothesis Testing.0 Decision Errors 3.0 How a Hyothesis is Tested 4.0 Test for Goodness of Fit 5.0 Inferences about Two Means It ain't
State Estimation with ARMarkov Models
 Deartment of Mechanical and Aerosace Engineering Technical Reort No. 3046, October 1998. Princeton University, Princeton, NJ. State Estimation with ARMarkov Models Ryoung K. Lim 1 Columbia University,
An Improved Panel Unit Root Test Using GLS-Detrending
 An Improved Panel Unit Root Test Using GLS-Detrending Claude Lopez 1 University of Cincinnati August 2004 This paper o ers a panel extension of the unit root test proposed by Elliott, Rothenberg and Stock
General Linear Model Introduction, Classes of Linear models and Estimation
 Stat 740 General Linear Model Introduction, Classes of Linear models and Estimation An aim of scientific enquiry: To describe or to discover relationshis among events (variables) in the controlled (laboratory)
Econ 3790: Business and Economics Statistics. Instructor: Yogesh Uppal
 Econ 379: Business and Economics Statistics Instructor: Yogesh Ual Email: yual@ysu.edu Chater 9, Part A: Hyothesis Tests Develoing Null and Alternative Hyotheses Tye I and Tye II Errors Poulation Mean:
System Reliability Estimation and Confidence Regions from Subsystem and Full System Tests
 009 American Control Conference Hyatt Regency Riverfront, St. Louis, MO, USA June 0-, 009 FrB4. System Reliability Estimation and Confidence Regions from Subsystem and Full System Tests James C. Sall Abstract
LECTURE 13: TIME SERIES I
 1 LECTURE 13: TIME SERIES I AUTOCORRELATION: Consider y = X + u where y is T 1, X is T K, is K 1 and u is T 1. We are using T and not N for sample size to emphasize that this is a time series. The natural
DEPARTMENT OF ECONOMICS ISSN DISCUSSION PAPER 20/07 TWO NEW EXPONENTIAL FAMILIES OF LORENZ CURVES
 DEPARTMENT OF ECONOMICS ISSN 1441-549 DISCUSSION PAPER /7 TWO NEW EXPONENTIAL FAMILIES OF LORENZ CURVES ZuXiang Wang * & Russell Smyth ABSTRACT We resent two new Lorenz curve families by using the basic
Monopolist s mark-up and the elasticity of substitution
 Croatian Oerational Research Review 377 CRORR 8(7), 377 39 Monoolist s mark-u and the elasticity of substitution Ilko Vrankić, Mira Kran, and Tomislav Herceg Deartment of Economic Theory, Faculty of Economics
On Wald-Type Optimal Stopping for Brownian Motion
 J Al Probab Vol 34, No 1, 1997, (66-73) Prerint Ser No 1, 1994, Math Inst Aarhus On Wald-Tye Otimal Stoing for Brownian Motion S RAVRSN and PSKIR The solution is resented to all otimal stoing roblems of
Comparing Nested Predictive Regression Models with Persistent Predictors
 Comparing Nested Predictive Regression Models with Persistent Predictors Yan Ge y and ae-hwy Lee z November 29, 24 Abstract his paper is an extension of Clark and McCracken (CM 2, 25, 29) and Clark and
arxiv: v2 [stat.me] 3 Nov 2014
![arxiv: v2 [stat.me] 3 Nov 2014](/thumbs/92/109512170.jpg "arxiv: v2 [stat.me] 3 Nov 2014") onarametric Stein-tye Shrinkage Covariance Matrix Estimators in High-Dimensional Settings Anestis Touloumis Cancer Research UK Cambridge Institute University of Cambridge Cambridge CB2 0RE, U.K. Anestis.Touloumis@cruk.cam.ac.uk
onarametric Stein-tye Shrinkage Covariance Matrix Estimators in High-Dimensional Settings Anestis Touloumis Cancer Research UK Cambridge Institute University of Cambridge Cambridge CB2 0RE, U.K. Anestis.Touloumis@cruk.cam.ac.uk
Analysis of some entrance probabilities for killed birth-death processes
 Analysis of some entrance robabilities for killed birth-death rocesses Master s Thesis O.J.G. van der Velde Suervisor: Dr. F.M. Sieksma July 5, 207 Mathematical Institute, Leiden University Contents Introduction
A New Asymmetric Interaction Ridge (AIR) Regression Method
 Regression Method") A New Asymmetric Interaction Ridge (AIR) Regression Method by Kristofer Månsson, Ghazi Shukur, and Pär Sölander The Swedish Retail Institute, HUI Research, Stockholm, Sweden. Deartment of Economics and
A New Asymmetric Interaction Ridge (AIR) Regression Method by Kristofer Månsson, Ghazi Shukur, and Pär Sölander The Swedish Retail Institute, HUI Research, Stockholm, Sweden. Deartment of Economics and
Statics and dynamics: some elementary concepts
 1 Statics and dynamics: some elementary concets Dynamics is the study of the movement through time of variables such as heartbeat, temerature, secies oulation, voltage, roduction, emloyment, rices and
Positive decomposition of transfer functions with multiple poles
 Positive decomosition of transfer functions with multile oles Béla Nagy 1, Máté Matolcsi 2, and Márta Szilvási 1 Deartment of Analysis, Technical University of Budaest (BME), H-1111, Budaest, Egry J. u.
substantial literature on emirical likelihood indicating that it is widely viewed as a desirable and natural aroach to statistical inference in a vari
 Condence tubes for multile quantile lots via emirical likelihood John H.J. Einmahl Eindhoven University of Technology Ian W. McKeague Florida State University May 7, 998 Abstract The nonarametric emirical
Uniform Law on the Unit Sphere of a Banach Space
 Uniform Law on the Unit Shere of a Banach Sace by Bernard Beauzamy Société de Calcul Mathématique SA Faubourg Saint Honoré 75008 Paris France Setember 008 Abstract We investigate the construction of a
In nite-dimensional VARs and Factor Models
 In nite-dimensional VARs and Factor Models Alexander Chudik y Euroean Central Bank and CIMF M. Hashem Pesaran z Cambridge University, CIMF and USC January 22, 2 Abstract his aer rooses a novel aroach for
Causality Testing using Higher Order Statistics
 Causality Testing using Higher Order Statistics Dr Sanya Dudukovic International Management Deartment Franklin College, Switzerland Fax: 41 91 994 41 17 E-mail : Sdudukov@fc.edu Abstract : A new causality
Modeling Business Cycles with Markov Switching Arma (Ms-Arma) Model: An Application on Iranian Business Cycles
 Model: An Application on Iranian Business Cycles") Modeling Business Cycles with Markov Switching Arma (Ms-Arma) Model: An Alication on Iranian Business Cycles Morteza Salehi Sarbijan 1 Faculty Member in School of Engineering, Deartment of Mechanics, Zabol
Modeling Business Cycles with Markov Switching Arma (Ms-Arma) Model: An Alication on Iranian Business Cycles Morteza Salehi Sarbijan 1 Faculty Member in School of Engineering, Deartment of Mechanics, Zabol
Common Correlated Effects Estimation of Heterogeneous Dynamic Panel Data Models with Weakly Exogenous Regressors *
 Federal Reserve Bank of Dallas Globalization and Monetary Policy Institute Working Paer o. 46 htt://www.dallasfed.org/assets/documents/institute/waers/203/046.df Common Correlated Effects Estimation of
Testing the Fractionally Integrated Hypothesis using M Estimation
 esting the Fractionally Integrated Hyothesis using M Estimation Matei Demetrescu a, Paulo M.M. Rodrigues b and Antonio Rubia c a Christian-Albrechts-University of Kiel b Banco de Portugal and Nova School
Colin Cameron: Brief Asymptotic Theory for 240A
 Colin Cameron: Brief Asymtotic Theory for 240A For 240A we o not go in to great etail. Key OLS results are in Section an 4. The theorems cite in sections 2 an 3 are those from Aenix A of Cameron an Trivei
Consistent Estimation of the Number of Dynamic Factors in a Large N and T Panel
 Consistent Estimation of the Number of Dynamic Factors in a Large N and T Panel Dante AMENGUAL Deartment of Economics, Princeton University, Princeton, NJ 08544 (amengual@rinceton.edu) Mark W. WATSON Woodrow
Web-Based Technical Appendix to Measuring Aggregate Price Indexes with Demand Shocks: Theory and Evidence for CES Preferences (Not for Publication)
") Web-Based Technical Aendix to Measuring Aggregate Price Indexes with Demand Shocks: Theory and Evidence for CES Preferences (Not for Publication) Stehen J. Redding Princeton University and NBER David E.
Web-Based Technical Aendix to Measuring Aggregate Price Indexes with Demand Shocks: Theory and Evidence for CES Preferences (Not for Publication) Stehen J. Redding Princeton University and NBER David E.
Cointegration Tests Using Instrumental Variables Estimation and the Demand for Money in England
 Cointegration Tests Using Instrumental Variables Estimation and the Demand for Money in England Kyung So Im Junsoo Lee Walter Enders June 12, 2005 Abstract In this paper, we propose new cointegration tests
CERIAS Tech Report The period of the Bell numbers modulo a prime by Peter Montgomery, Sangil Nahm, Samuel Wagstaff Jr Center for Education
 CERIAS Tech Reort 2010-01 The eriod of the Bell numbers modulo a rime by Peter Montgomery, Sangil Nahm, Samuel Wagstaff Jr Center for Education and Research Information Assurance and Security Purdue University,
Distributed Rule-Based Inference in the Presence of Redundant Information
 istribution Statement : roved for ublic release; distribution is unlimited. istributed Rule-ased Inference in the Presence of Redundant Information June 8, 004 William J. Farrell III Lockheed Martin dvanced
Hidden Predictors: A Factor Analysis Primer
 Hidden Predictors: A Factor Analysis Primer Ryan C Sanchez Western Washington University Factor Analysis is a owerful statistical method in the modern research sychologist s toolbag When used roerly, factor
Monte Carlo Studies. Monte Carlo Studies. Sampling Distribution
 Monte Carlo Studies Do not let yourself be intimidated by the material in this lecture This lecture involves more theory but is meant to imrove your understanding of: Samling distributions and tests of
Approximating min-max k-clustering
 Aroximating min-max k-clustering Asaf Levin July 24, 2007 Abstract We consider the roblems of set artitioning into k clusters with minimum total cost and minimum of the maximum cost of a cluster. The cost
The Longest Run of Heads
 The Longest Run of Heads Review by Amarioarei Alexandru This aer is a review of older and recent results concerning the distribution of the longest head run in a coin tossing sequence, roblem that arise
Journal of Chemical and Pharmaceutical Research, 2014, 6(5): Research Article
: Research Article") Available online www.jocr.com Journal of Chemical and Pharmaceutical Research, 204, 6(5):580-585 Research Article ISSN : 0975-7384 CODEN(USA) : JCPRC5 Exort facilitation and comarative advantages of the
Available online www.jocr.com Journal of Chemical and Pharmaceutical Research, 204, 6(5):580-585 Research Article ISSN : 0975-7384 CODEN(USA) : JCPRC5 Exort facilitation and comarative advantages of the
Econ 3790: Business and Economics Statistics. Instructor: Yogesh Uppal
 Econ 379: Business and Economics Statistics Instructor: Yogesh Ual Email: yual@ysu.edu Chater 9, Part A: Hyothesis Tests Develoing Null and Alternative Hyotheses Tye I and Tye II Errors Poulation Mean: